 Yannis De Luna1
 Mohammad I. Ahmad
 Nasr Bensalah
94% of researchers rate our articles as excellent or good
Learn more about the work of our research integrity team to safeguard the quality of each article we publish.
Find out more
ORIGINAL RESEARCH article
Front. Chem., 24 January 2023
Sec. Electrochemistry
Volume 11 - 2023 | https://doi.org/10.3389/fchem.2023.1101459
This article is part of the Research TopicRegeneration of Battery MaterialsView all 4 articles
The purpose of this study is the synthesis of α-MnO2-based cathode materials for rechargeable aqueous zinc ion batteries by hydrothermal method using KMnO4 and MnSO4 as starting materials. The aim is to improve the understanding of Zn2+ insertion/de-insertion mechanisms. The as-prepared solid compounds were characterized by spectroscopy and microscopy techniques. X-ray diffraction showed that the hydrothermal reaction forms α-MnO2 and Ce4+-inserted MnO2 structures. Raman spectroscopy confirmed the formation of α-MnO2 with hexagonal MnO2 and Ce-MnO2 structures. Scanning electron microscopy (SEM) confirmed the formation of nanostructured MnO2 (nanofibers) and Ce-MnO2 (nanorods). The electrochemical performance of MnO2 was evaluated using cyclic voltammetry (CV), galvanostatic charge-discharge (GCD) tests in half-cells. CV results showed the reversible insertion/de-insertion of Zn2+ ions in MnO2 and Ce-MnO2. GCD cycling tests of MnO2 and Ce-MnO2 at 2500 mA/g demonstrated an impressive electrochemical performance, excellent cycling stability throughout 500 cycles, and high rate capability. The excellent electrochemical performance and the good cycling stability of MnO2 and Ce-MnO2 nanostructures by simple method makes them promising cathode materials for aqueous rechargeable zinc-ion batteries.
Li-ion technology has consistently proven its place as a suitable form of energy storage system with its high energy and power density, among other qualities (Andre et al., 2017). However, LIBs utilize costly materials and are often not environmentally safe, which causes disposal and recovery problems (Costa et al., 2021). Besides these factors, safety concerns surrounding Li-ion batteries (LIBs) have limited their applications, especially in large-scale energy storage systems (Shahjalal et al., 2021). With the constantly growing need for safe, high-performance rechargeable batteries, battery systems beyond Li-ion battery systems need to be considered to uncover any untapped potential. The ideal rechargeable battery requires fast charging, large capacity, and long-term cycling, whilst maintaining safety. Therefore, the shift in research interests towards aqueous rechargeable batteries have grown in the recent years.
Batteries based on multivalent metals, such as aluminium, calcium, magnesium and zinc, could potentially satisfy the demand for large-scale energy storage with low costs, owing to their abundant supply in nature. One of the most promising metal-ion technologies is aqueous rechargeable zinc-ion batteries (ARZIBs) because of the exceptional properties of zinc as anode. For instance, the low material cost, high availability, physical and chemical stability, low toxicity and high safety are ideal characteristics for a battery electrode material (Li and Dai, 2014; Fang et al., 2018; Ming et al., 2019; Tang et al., 2019; Wu et al., 2019; Huang et al., 2020). Until recent developments, zinc-ion batteries have been predominantly applied in primary batteries (non-rechargeable). At the beginning of the last decade, a reversible Zn2+ insertion/de-insertion was demonstrated for the first time using tunnel structure of α-MnO2 cathode in mild-acid aqueous ZnSO4 electrolyte and Zn foil anode (Xu et al., 2012). Besides being a safer alternative to LIBs with low material toxicity, zinc has a high energy density (5855 mA h/cm3) (Xu and Wang, 2019) and a moderately high redox potential (Xu et al., 2015). These characteristics improve the suitability of ARZIBs for industrial-scale applications, such as storage systems for renewable energy and electric vehicles (Zhu et al., 2020).
Manganese oxides have gained significant research interests over the last years due to their high working potential, naturally abundant supply, cost effectiveness, and low toxicity (Liu et al., 2021). Specifically, manganese dioxide, MnO2, of various crystal structures and Mn oxidation states, has been commonly studied as a cathode for ARZIBs. The various crystal polymorphs such as α-, β-, γ-, and δ-type MnO2 that assume different structures (layers, spinels, and tunnels) depending on the positions of MnO6 octahedra (Post, 1999; Cheng et al., 2006; Ji et al., 2015; Liu et al., 2018). There are two steps involved in the insertion of Zn2+ ions into the structure of the host material (MnO2), as shown below:
According to these reactions, two Zn2+ ions can be inserted within one unit of MnO2, leading to an overall theoretical specific capacity of 616 mA h/g (308 mA h/g per reaction step). In particular, the structure of α-MnO2 consists of tunnels, providing a larger surface area and active sites, which is ideal for the insertion/de-insertion mechanism of Zn2+ ions (Alfaruqi et al., 2015).
MnO2−based materials have been prepared by different methods, such as through the chemical and electrochemical oxidation of Mn2+, the chemical and electrochemical reduction of MnO4− or the direct phase transformation from other manganese oxides. It was found that the crystal structure of MnO2 affects the cycling stability and electrochemical performance of ARZIBs. Detailed literature reviews (Yan et al., 2012; Kundu et al., 2016; Zhang et al., 2017; Ming et al., 2019; Tang et al., 2019; Wu et al., 2019; Huang et al., 2020) indicate that more studies need to be conducted to understand the mechanisms in which Zn2+ ions can be inserted into the host structure at greater depths. In addition, there is a vital need to enhance practical specific capacities to the theoretical value to take advantage of the material’s full potential. Furthermore, present issues that arise during cycling of MnO2 materials have been highlighted, such as the dissolution of the host material and the occurrence of irreversible reactions. To overcome such issues, the pre-intercalation of electrode materials with metal ions and water molecules has been explored to stabilize the inner structures (Wang et al., 2019; Zhou et al., 2022).
Herein, a facile hydrothermal method was used to synthesize α-MnO2 and pre-inserted Ce-MnO2 nanomaterials by redox reaction between Mn2+ and MnO4− at neutral pH. This research aims to evaluate the cycling performance of MnO2-based cathode materials for ARZIBs. The effects of the successful pre-insertion of Ce4+ ions into the structure of α-MnO2 will be investigated, to determine whether it will facilitate the insertion and de-insertion of Zn2+ ions during discharge and charge and improve the capacity and overall performance of the cathode materials. Nanostructured MnO2 and Ce-inserted MnO2 were synthesized via hydrothermal method by reaction of MnO4− with Mn2+ as manganese sources. The as-prepared nanostructured materials were characterized by different techniques including X-ray diffraction (XRD), Raman spectroscopy, energy dispersive spectroscopy (EDS), scanning electron microscopy (SEM), and transmission electron microscopy (TEM). The electrochemical performance of these nanomaterials as cathode materials for ARZIBs was assessed through electrochemical tests: cyclic voltammetry (CV) and galvanostatic charge/discharge (GCD).
Potassium permanganate (KMnO4) and N-methyl-2-pyrrolidone (NMP) were purchased from Sigma-Aldrich. Manganese sulfate monohydrate (MnSO4·H2O) was obtained from VWR Chemicals. Cerium(IV) sulfate tetrahydrate (Ce(SO4)2.4H2O) and cerium(III) nitrate hexahydrate (Ce(NO3)3·6H2O) was purchased from Riedel-de Haen. Carbon black was from TIMCAL Graphite & Carbon. Polyvinylidene fluoride (PVDF) was purchased from Arkema. Zinc sulfate heptahydrate (ZnSO4.7H2O) and zinc foil were purchased from Fisher Scientific Ltd. Filter paper as separator was purchased from Glaswarenfabrik Karl Hecht GmbH & Co. KG, and titanium foil was obtained from Baoji Hanz Metal Material Co.
The MnO2-based nanostructures were prepared by hydrothermal method using KMnO4 and MnSO4 as starting materials. Pure MnO2 was synthesized by dissolving a mixture of 3.2 g KMnO4 and 5.07 g MnSO4.H2O in 40 mL deionized water. Ce-inserted MnO2 was prepared using the same amounts of KMnO4 and MnSO4.H2O in presence of 1 g Ce(NO3)3.6H2O in 40 mL deionized water. The mixtures were stirred at 50°C–60 °C for 2 h. At the end of the stirring, the pink color characteristic of KMnO4 disappeared, indicating the complete reduction of Mn(VII) and the oxidation of Mn(II) into Mn(IV), as shown in the equation below:
A dark precipitate of MnO2 was formed during the reaction. The suspensions were transferred into separate Teflon jars, then enclosed inside stainless steel autoclaves. The tightly sealed autoclaves were transferred inside an oven and kept at 180°C for 24 h. After the hydrothermal treatment, the content of jars were naturally cooled down to room temperature. The solids were separated by centrifugation at 4000 rpm for 10 min at 20°C, and then washed several times by deionized water until a neutral pH was attained. The washed solids were dried in vacuum oven at 80°C overnight.
A slurry containing the active material, conductive material, binder, and solvent was prepared using a ball mill machine (Changsha Tianchuang Powder Technology Co., Ltd. XQM-0.4A), agate grinding Teflon jars and three agate balls (diameter 4 mm). In each jar, 0.75 g of the active material was mixed with 0.15 g of carbon (graphite) used as conductive material, and 0.1 g PVDF used as binder in 3.5 mL N-methyl-2-pyrrolidone (NMP). The agate grinding jar was placed inside the ball miller at 400 rpm for 1 h. The slurry obtained was casted on Ti foil by Doctor Blade and a thick film coater (MTI, MSK-AFA-I), followed by drying in the oven overnight. Then, the dried casted materials were cut into disks using a disk cutting machine (MTI, MSK-T10).
The prepared materials were tested as cathode material in half-cell using Zn metal as counter and reference electrode. The electrolyte used was 3 M ZnSO4 aqueous solution. The coin cells (CR 2032) were sealed by a hydraulic crimping machine to finalize its assembly (MTI, MSK-110).
Crystal structures were identified by X-ray diffractometry (XRD) (PAnalytical Empyrean X-ray diffractometer, 40 KV/30 mA) at a scan rate of 2°/min between 20° and 90°. Raman spectroscopy (Thermo Scientific™, DXR™ two Raman Microscope) was used to give more details about the structure and morphology of the synthesized solids. Scanning electron microscopy (SEM) analysis using FEI NOVA NANOSEM 450 was conducted to provide information related to morphology of the solids. The same machine was used to identify the elemental composition of solids by energy dispersive X-ray spectroscopy (SEM-EDS). Transmission Electron microscope (FEI, TECNAI G2 TEM, TF20) was used to observe the nanostructured materials and determine inter-planar distances by diffraction patterns.
Cyclic voltammetry (CV) testing was accomplished using CS350 Potentiostat/Galvanostat (electrochemical workstation). Galvanostatic charge/discharge (GCD) cycling was performed using eight Channel Battery Analyzer (0.005–1 mA, up to 5V) - BST8-WA.
The structure of the solids produced by hydrothermal method was analyzed by X-ray diffraction (XRD) spectroscopy. The XRD spectra of the solid materials produced by the reaction of MnO4− and Mn2+ in absence and presence of Ce4+ are given in Figures 1A, B. The XRD spectrum of the solids produced by the reaction of MnO4− and Mn2+ in absence of Ce4+ match well with the spectrum of α-MnO2·0.15 H2O. The indexed peaks corresponding to (hkl) planes are shown in Figure 1A. This result demonstrates the formation of hydrated MnO2 structure by hydrothermal method. However, the XRD peaks of the solid material produced by the reaction of MnO4− and Mn2+ in the presence of Ce4+ are shifted from those of α-MnO2·0.15 H2O (see Figure 1B). The observed shifts indicate the pre-insertion of Ce4+ into the tunnels of α-MnO2 structure (Ce-MnO2·0.15 H2O).
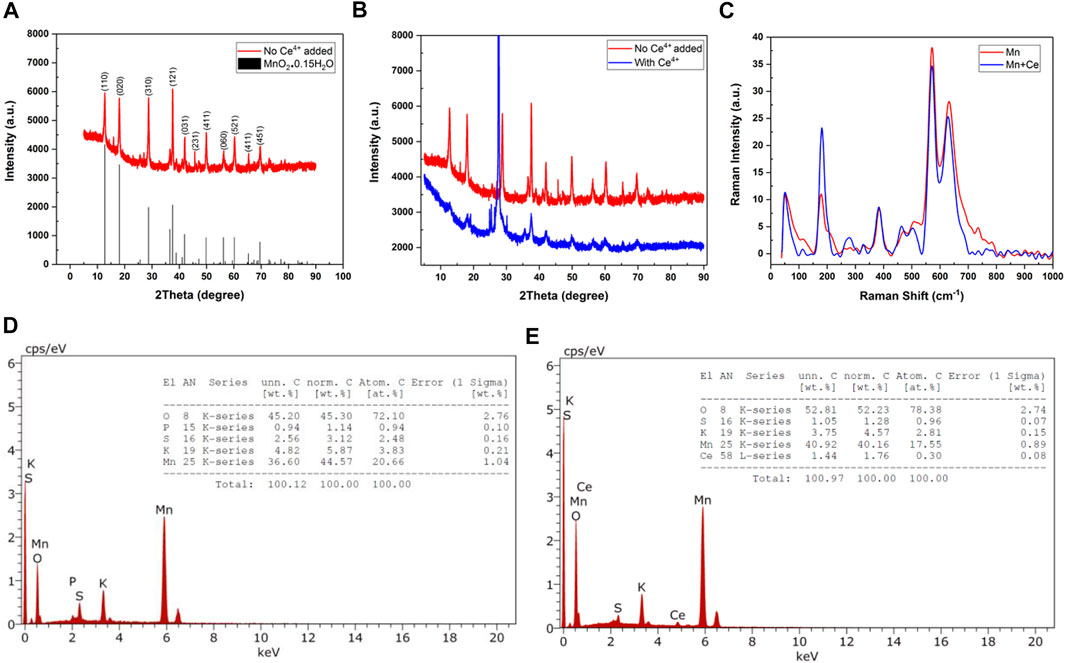
FIGURE 1. XRD spectra of the solids produced by hydrothermal reaction (A) in absence (with α-MnO2·0.15 H2O as reference) and (B) in presence of Ce4+ ions. (C)Raman spectra of MnO2 and Ce-MnO2 prepared by hydrothermal method. EDX spectra and elemental analysis results of (D) MnO2 and (E) Ce-MnO2.
The average grain size of particles, R, can be calculated from the most intense peak of XRD spectrum using Scherrer formula:
Where K is a factor that represents the particle shape with a value equal to 0.9 and the X-ray wavelength is λ = 1.5406 Å. In addition, θ is defined as the diffraction angle for almost intense peak. β is the experimental full width at half maximum of the same peak. The estimated grain sizes were 26.5 nm for MnO2 and 400 nm for Ce-MnO2, indicating the formation of nanostructures with much smaller nanoparticles in the absence of Ce4+ ions.
Raman spectroscopy was performed to identify the structure and morphology of MnO2 and Ce-MnO2. Raman spectra of MnO2 and Ce-MnO2 are given in Figure 1C. MnO2 and Ce-MnO2 present similar Raman shifts located at 182, 390, 570, and 636 cm−1. The presence of well-resolved Raman shifts at 570 and 636 cm−1 indicates the formation of hexagonal MnO2 structure (Hsu et al., 2011). The Raman band at 636 cm−1 correspond well with the Raman spectrum of MnO2 and can be attributed to the Mn–O symmetric stretching vibrations in MnO6 octahedra (Julien et al., 2003; Yin et al., 2015). The Raman band located at 570 cm−1 corresponds to the terminal Mn–O stretching in the basal plane of the MnO6 sheet in the tunnel-type α-MnO2 structure (Hsu et al., 2011). The presence of low-wavenumber Raman bands at 182 and 390 cm−1 indicates the insertion of cations into the α-MnO2 structure (Yin et al., 2015). The higher intensity of Raman peak located at 182 cm−1, in Raman spectrum of Ce-MnO4 sample confirms the co-insertion of Ce4+ ions, in addition to K+ ions.
Energy dispersive X-ray (EDX) analysis was used the elemental analysis at the surface of solid materials. Figures 1D, E present the EDX spectra of MnO2 and Ce-MnO2 compounds. The EDX spectrum of MnO2 shown in Figure 1D confirms the presence of Mn and O, in addition to S, P, and K as impurities. The atomic ratio O/Mn is greater than 2 (O/Mn = 2.65) due to the presence of excess oxygen in SO42- impurities that cannot be removed during washing. The presence of Ce, in addition to Mn and O, was confirmed by EDX, as shown in Figure 1E. Furthermore, impurities of S and K were also detected. The atomic ratio O/Mn was also greater than 2 (3.07) due to the presence of impurities (SO42−) and CeO2. The atomic ratio of Mn/Ce was greater than 10 (11.1) indicating that small amount of Ce is pre-inserted into the α-MnO2 structure.
SEM analysis provides high-resolution imaging at different magnifications by scanning the surface of a solid sample with an electron beam. It is an analytical tool useful for observing the shape and the size of particles and the morphology of solid materials. Figures 2A, B present the SEM images at two different magnifications of MnO2 and Ce-MnO2, respectively. The micrographs display homogeneous morphologies for both MnO2 and Ce-MnO2, whilst different particle shapes and sizes were clearly observed. Figure 2A shows self-assembled nanofibers of MnO2 with diameters between 5 and 15 nm. However, well-defined nanorods (with average diameter and length of 50 and 500 nm, respectively) are perceived in Figure 2B for Ce-MnO2. It should be noted that several reports in literature mentioned that different MnO2 particle shapes (nanowires, urchin-like, nanorods, nanospheres, etc.) and sizes (from nm to μm) can be formed by hydrothermal method depending on several factors, including the reactants, pH conditions, temperature, and duration (Cheng et al., 2006; Duan et al., 2012; Su et al., 2013; Yin et al., 2015). It is then obvious that the presence of Ce4+ ions affected the morphology and the particle shape and size (from nanofibers to nanorods) of the product from the hydrothermal reaction.

FIGURE 2. SEM images of (A) MnO2 nanofibers and (B) Ce-MnO2 nanorods. TEM, HRTEM and SAED pattern images of (C–E) MnO2 and (F–H) Ce-MnO2.
Transmission electron microscopy (TEM) generates more sensitive images than SEM in the scale of sub-micrometers and nanometers. TEM imaging is used for morphological and structural characterization and dimensional measurements of nanostructures, atomic lattice spacing, and cell diameter with a resolution as low as a fraction of an Angstrom (1 Å = 10–10 m). TEM images of MnO2 and Ce-MnO2 are given in Figures 2C–H. The image and inset in Figures 2C, F confirm the morphologies and sizes observed in SEM analysis for MnO2 (nanofibers) and Ce-MnO2 (nanorods), respectively. The average length of MnO2 nanofibers is approximately 142 nm, whilst the average length of Ce-MnO2 nanorods is estimated to be 355 nm. High resolution TEM (HRTEM) imaging and selected area electron diffraction (SAED) patterns enable the direct measurement of lattice spacing between atomic planes in crystalline samples. Figures 2D, E present HRTEM images and SAED patterns of MnO2 crystals. The lattice spacing in MnO2 crystal estimated from the HRTEM images was 0.7 nm, corresponding to (110) crystal plane. Figures 2G, H present HRTEM images and SAED patterns of Ce-MnO2 crystals, which reveal the same lattice spacing as MnO2 sample. According to the SAED of Figures 2E, H, one shows an obvious two-dimensional lattice structure, and the other is a diffraction ring structure, which corresponds to monocrystalline and polycrystalline structures, for MnO2 and Ce-MnO2, respectively.
Cyclic voltammetry (CV) is a widely used technique in electrochemistry. CV is a powerful tool to study the electrochemical behavior of a system by systematic study of current-voltage measurements of a given electrochemical cell. The oxidation or reduction taking place at the electrode surface is related with the potential of the electrode. The more negative potential implies more strongly reducing electrode and on the other hand more positive potential implies more strongly oxidizing electrode. Figures 3A, B presents the consecutive cyclic voltammograms of MnO2 and Ce-MnO2 used as working electrodes in half-cell ARZIBs using Zn metal as reference and counter electrode and 3 M ZnSO4 aqueous electrolyte. All peak positions identified for both half-cells are summarized in Table 1. Similar results were obtained in literature, which resembles the shape of CV curve in this study, as well as almost identical peak positions (Shi et al., 2020; Zang et al., 2020; Cai et al., 2021). In the return scan (reduction), two peaks appear at around 1.2 V and 1.3 V vs. Zn/Zn2+, which can be attributed to Zn2+ ions insertion into the MnO2 host structure wherein Mn4+ is reduced to lower valences (Figure 3A) (Cai et al., 2021). The first oxidation scan of MnO2 nanofibers cathode presents two peaks at approximately 1.6 V and 1.7 V vs. Zn/Zn2+, corresponding to the oxidation of Mn species back to Mn4+ and the de-insertion of Zn2+ ions. The only inconsistency lies in the cathodic region of the first CV scan, which showed a reduction peak positioned past 1.0 V, which also appeared for the Ce-MnO2 cell. In addition, the intensity of the peaks from both oxidation and reduction have been shown to decrease after CV2. On a positive note, consistent overlapping of the peaks from CV3 until CV10 was also observed, which signifies good reproducibility for long-term cycling. The CV of Ce-MnO2 in Figure 3B shows two peaks in the cathodic region at 1.2 and 1.3 V vs. Zn/Zn2+. Two consistent anodic peaks that are associated with the oxidation of Mn species back to Mn4+ were observed at 1.6 V (prominent) and 1.7 V (shoulder) vs. Zn/Zn2+. A peak at 1.1 V vs. Zn/Zn2+ was present in the first CV scan, which then shifted to around 1.2 V in the later scans. A slight increase in peak intensity was observed in the first two scans, which then remained consistent until CV 10. After CV 5, the peaks overlap which indicates favorable reproducibility upon further cycling. Generally, the number of peaks in the anodic and cathodic region are equivalent and not too far apart, indicating the reversible insertion/de-insertion of Zn2+ ions. Overall, both cells have shown good reproducibility and identical electrochemical peaks, indicating reversible insertion/de-insertion of Zn2+ ions. However, Ce-MnO2 half-cell has shown better reproducibility with almost identical peak positions and intensities throughout the ten cycles.
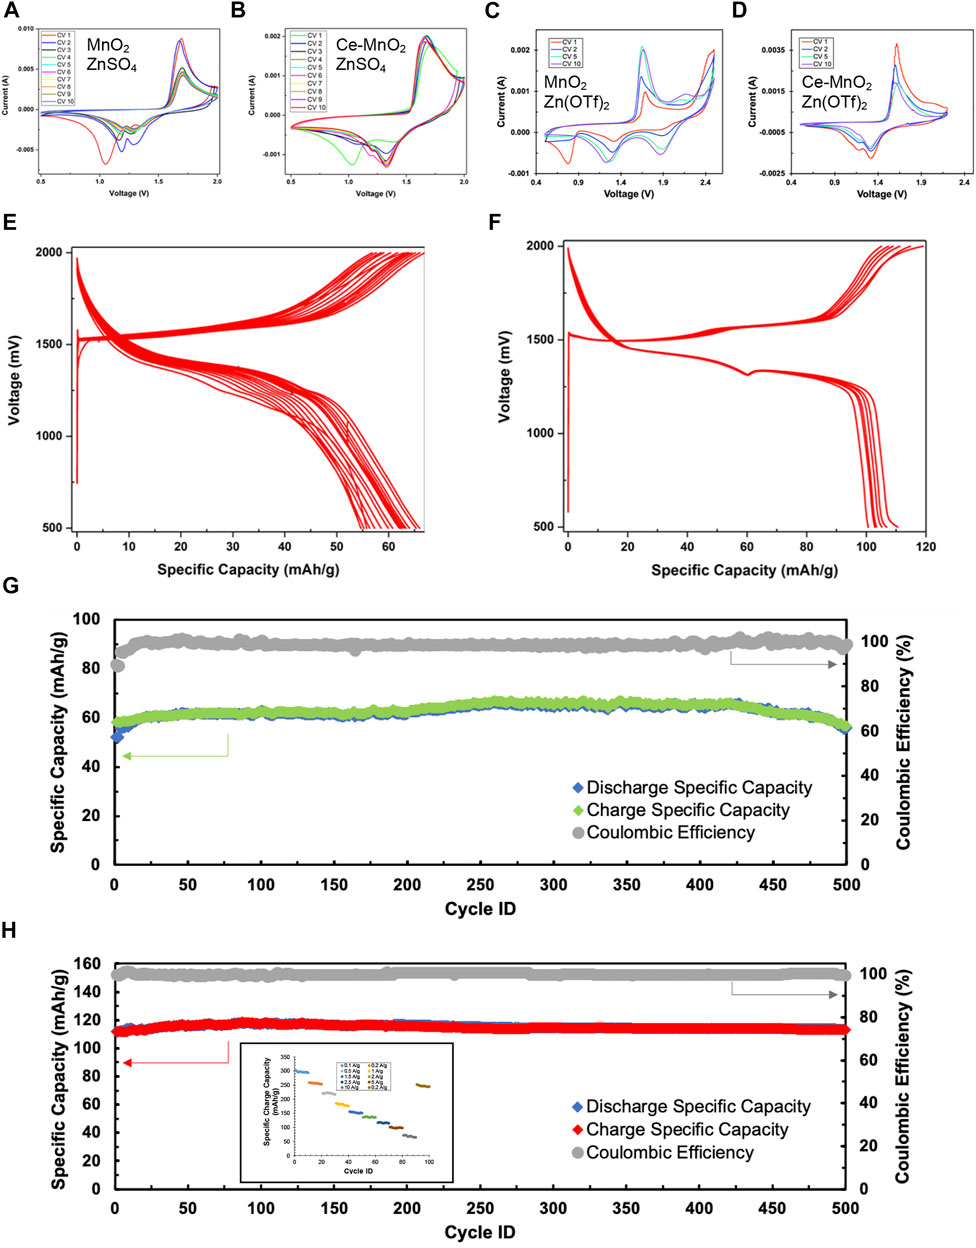
FIGURE 3. Cyclic voltammograms of (A) MnO2 and (B) Ce-MnO2 cathode materials with 3 M ZnSO4, and (C) MnO2 and (D) Ce-MnO2 with 3 M Zn(CF3SO3)2 tested in half-cell ARZIBs using Zn metal as reference and counter electrode at a scan rate of 1 mV/s. Voltage profiles during galvanostatic charge/discharge (GCD) at current density of 2500 mA/g with 3 M ZnSO4 of (E) MnO2 and (F) Ce-MnO2. Cycling stability measurements during GCD cycling of (G) MnO2 and (H) Ce-MnO2 cathode in 500 cycles (inset: rate capability).
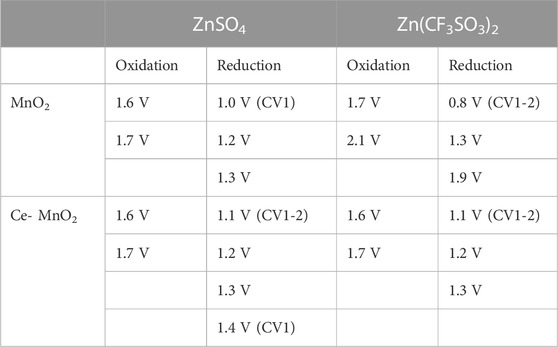
TABLE 1. Summary of the peak positions identified from cyclic voltammograms of MnO2 and Ce-MnO2 half-cells against Zn/Zn2+ in ZnSO4 and Zn(CF3SO3)2 electrolytes.
For comparison, CV was repeated for MnO2 and Ce-MnO2 coin cells using 3 M Zn(CF3SO3)2 as aqueous electrolyte (also known as Zn(OTf)2). Cyclic voltammograms for each MnO2 and Ce-MnO2 half-cell against Zn/Zn2+ are presented in Figures 3C, D. The peak positions are summarized in Table 1 against that of ZnSO4 electrolyte. The CV scan for MnO2 nanofiber material (Figure 3C) displays two cathodic peaks positioned at 1.7 and 2.1 V. The second peak at 2.1 V only appears to be present from CV5 and beyond. As for the reduction, three peaks appear at 0.8, 1.3, and 1.9 V, with an additional shoulder peak appearing at 2.1 V. However, the first peak located 0.8 V gradually decreased in intensity with each CV scan and completely disappeared from CV5 and beyond. The peak intensities have increased from CV1, reaching similar intensities in CV5 and CV10, as evident in the overlap. In terms of reproducibility, CV scan for MnO2 nanofiber material with ZnSO4 electrolyte in Figure 3A has shown higher reproducibility than that of Zn(CF3SO3)2 electrolyte in Figure 3C, which might be due to the secondary reactions of dissolution of Ti current collector in Zn(CF3SO3)2 at high voltages. Nevertheless, more distinct peaks were achieved when Zn(CF3SO3)2 electrolyte was used. The cyclic voltammogram of Ce-MnO2 half-cell (Figure 3D) presents peaks at similar positions seen in Figure 3B (anodic: 1.6 and 1.7 V; cathodic: 1.1, 1.2, and 1.3 V). The peak intensities appear to decrease with longer cycling and stabilize between CV5 and CV10. Compared to Figure 3B, this CV scan is more consistent with the peak positions, which indicates good recyclability.
To evaluate the electrochemical performance of α-MnO2 and Ce-inserted α-MnO2 as cathode materials for aqueous ZIBs, half-cells were prepared and cycled in battery analyzers. The charge rate (current density) in the GCD cycling of MnO2 and Ce-MnO2 was fixed to 2500 mA/g. Figures 3E, F shows voltage profiles (changes of voltage with specific capacity) during consecutive GCD cycles of MnO2 and Ce-MnO2 cathode materials tested in half-cell ARZIBs using Zn metal as reference and counter electrodes and 3 M ZnSO4 electrolyte. The first discharge and charge cycles of MnO2 cathode materials present reduction and oxidation plateaus at 1300 mV and 1500 mV vs. Zn/Zn2+, respectively (Figure 3E). For the subsequent GCDs, the same plateaus exist with a decrease in the specific capacity from one cycle to another. A good accordance between the CV results and the GCD plots was perceived. The GCD cycles of Ce-MnO2 present two plateaus in charge and two plateaus in discharge. The GCD cycles of Ce-MnO2 showed better stability (Figure 3F) than those of MnO2.
Figures 3G, H present the changes of specific charge and discharge capacities and Coulombic efficiency (CE) in 500 cycles. The first specific charge and discharge capacities of 55 and 52 mA h/g for MnO2, as shown in Figure 3G. The charge specific capacity undergoes a little increase and then stabilizes after 10 cycles, with CE reaching almost 100%. The specific charge capacity was retained at about 65 mA h/g for the rest of GCD cycles. Similar results were observed with Ce-MnO2 cathode materials (Figure 3H). It is markedly noted that Ce-MnO2 exhibited a more stable performance and much higher specific capacity values than MnO2, with a specific capacity of approximately 115 mA h/g throughout the 500 cycles. The pre-insertion of Ce4+ ions into the tunnels of α-MnO2 improves the specific capacity of the battery. The average specific charge capacities of Ce-MnO2 after 10 GCD cycles at each of the following rates 100, 200, 500, 1000, 1500, 2000, 2500, 5000, 10000 were 297, 256, 222, 183, 153, 136, 116, 97, and 68 mA h/g, respectively. The Ce-MnO2 retained an average specific charge capacity of 246 mA h/g at 200 mA/g indicating a robust chemical structure and excellent rate capability.
Characterization techniques, particularly SEM/EDX and TEM, were used to observe the changes in the cathode material before and after cycling. Before cycling, the cathode only consists of the casted slurry components (active material, binder, carbon black). During discharge, Zn2+ ions are released from the anode and travel through the electrolyte and inserted within the cathode material. The Zn2+ ions undergo de-insertion from the cathode and travel back to the anode during charge in secondary batteries. The following results from post-mortem analysis revealed the rechargeable nature of the half-cells.
SEM imaging of the cathode’s surface before cycling shows MnO2 microfibers mixed with the slurry components (Figure 4A). However, the components are not evenly distributed in the slurry, which may be the reason for the low specific capacities observed in GCD. Upon discharging, the appearance of the cathode has drastically changed from microfibers to smooth, three-dimensional units of varying thicknesses due to stacking (Figure 4B). Finally, the charged state of the MnO2 cathode reverted back to its original appearance, with the exception of microsheets protruding out of the cathode in certain areas (Figure 4C). The same observation was found in a birnessite-type MnO2 in discharged states (Wang et al., 2019). The growth of the microsheets were associated with the formation of zinc sulfate hydroxide hydrate, [Zn(OH2)3ZnSO4⋅xH2O]. The Ce-inserted MnO2 cathode consists of nanorods, which are evident the micrograph before cycling (Figure 4F). After discharging to 0.5 V, plate-like structures are observed on the surface, indicating a phase transformation (Figure 4G). In the charged state, the cathode material has almost completely reverted back to the pristine state, with some of the plate-like units remaining on the surface (Figure 4H).
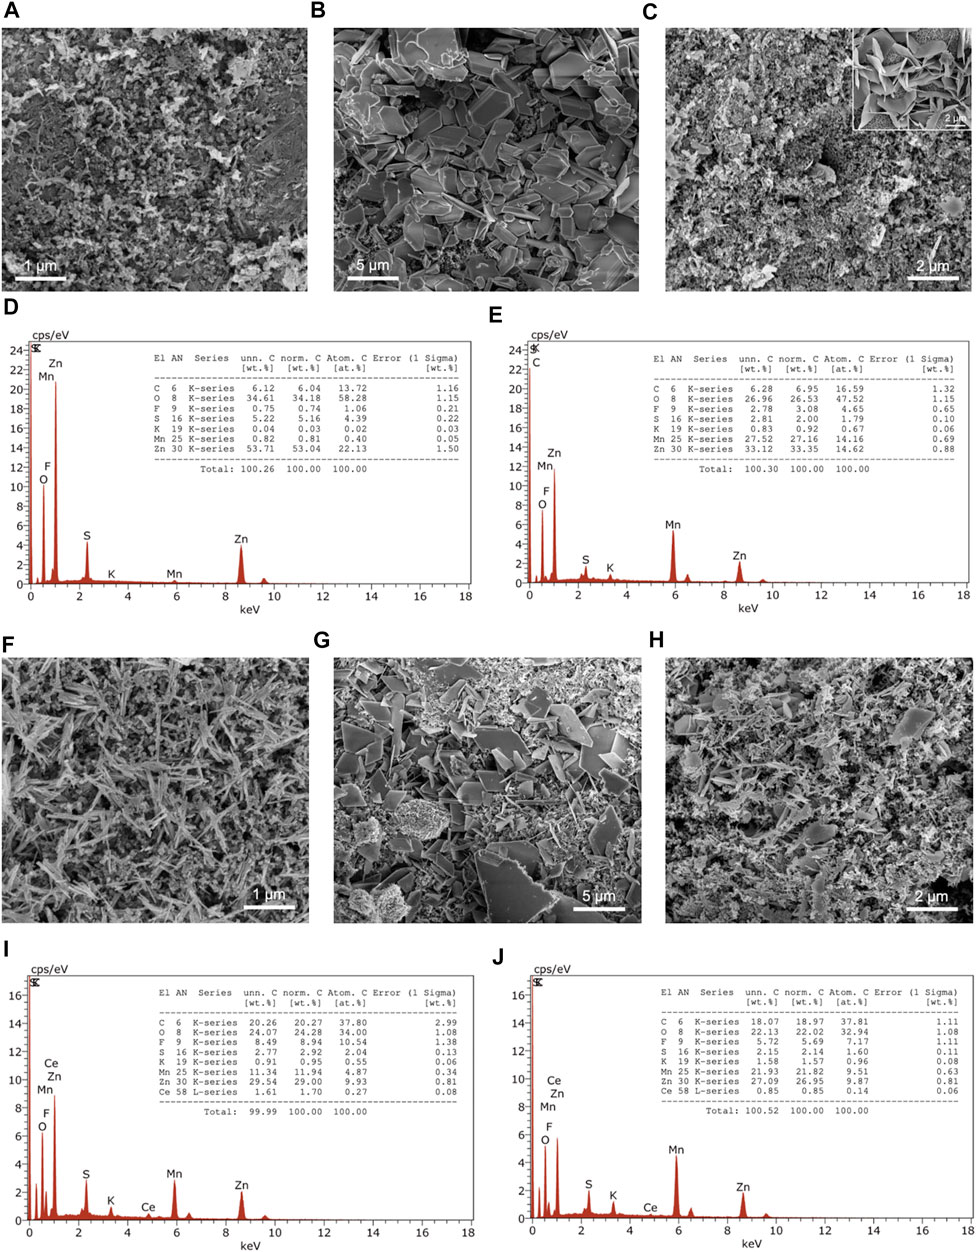
FIGURE 4. SEM images before cycling, after discharge, and after charge of (A–C) MnO2 with EDX spectra (D) after discharge and (E) after charge, and (F–H) Ce-MnO2 cathodes with EDX spectra (I) after discharge and (J) after charge. Inset of SEM image of microsheets.
EDX analysis of MnO2 cathode revealed a large Zn/Mn ratio, which indicates the insertion of Zn2+ in the MnO2 structure (zincation) and the formation of other Zn-based compounds (Figure 4D). In the charged state, the Zn/Mn ratio decreased to 1 (Figure 4E). Similar observations were seen with Ce-MnO2 cathode. Upon discharging, the Zn/Mn ratio was 2, which indicates that two Zn2+ ions were inserted in the cathode host structure (full zincation) (Figure 4I). After charging, the Zn/Mn ratio also decreased to 1 (Figure 4J). This may suggest that the de-insertion of Zn2+ ions was incomplete or other Zn compounds have formed, as shown in the formation of microsheets from SEM analysis (Figure 4C).
TEM analysis of the MnO2 cathode supports the images produced from SEM, which revealed a nanofiber structure (Figure 5A). The crystal plane that was evident in all stages is (110), which has a d-spacing of 0.69 nm in α-MnO2·0.15 H2O. In Figure 5D, the structures formed during discharge in SEM imaging was also observed in TEM, with lengths of over 1 µm. Furthermore, a change from monocrystalline to polycrystalline phase was evident in the SAED pattern images before cycling (Figure 5C) and after discharge (Figure 5F). Besides (110) crystal plane, three other planes were observed including (020), (310), and (121), which are the main crystal planes of α-MnO2·0.15 H2O. After charge, a return to monocrystalline phase was observed, which revealed crystal plane (110). This indicates that the anode material is capable of reverting back to the original state before cycling, which is equivalent to good reversibility, as reflected in electrochemical findings.
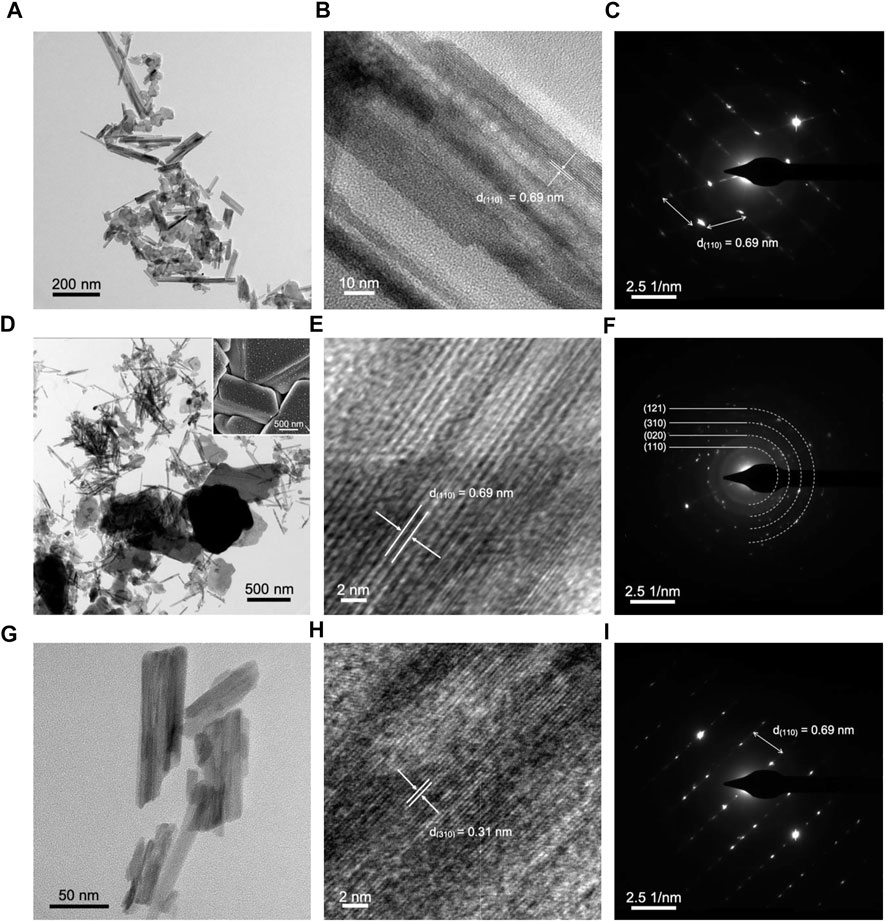
FIGURE 5. TEM, HRTEM, and SAED pattern images of MnO2 cathode (A–C) before cycling, (D–F) after discharge, and (G–I) after charge. Inset of SEM image of cathode after discharge.
The TEM imaging of Ce-MnO2 cathode in post-mortem analysis showed the nanorod structures present in SEM analysis (Figure 6A). Similar to MnO2, Ce-inserted

FIGURE 6. TEM, HRTEM, and SAED pattern images of Ce-MnO2 cathode (A–C) before cycling, (D–F) after discharge, and (G–I) after charge.
MnO2 had d-spacing that matched well with that of α-MnO2·0.15 H2O, especially the characteristic (110) crystal plane. Before cycling, Ce-MnO2 cathode was polycrystalline, as shown in the SAED pattern image in Figure 6C. After discharge, the phase changed to monocrystalline. The phase returned back to polycrystalline after charge, indicating good reversibility of the cathode.
Overall, post-mortem analysis has revealed that the cathode is capable of reverting back to the original structure, which is indicative of good reversibility. For both cathodes, the formation of microstructures were evident in SEM and TEM analysis in the discharged state. In particular, MnO2 cathode showed a more significant change from nanofibers to stacked 3-D units. However, these structures were replaced with the original nanofibers and scattered microsheets, which were previously reported to be [Zn(OH2)3ZnSO4⋅xH2O]. In all states of the cathode, the (110) crystal plane was observed in HRTEM and SAED pattern images. Therefore, the original structure of MnO2 was preserved in both pristine and Ce-inserted cathodes.
In this work, hydrothermal method was used to synthesize MnO2 and Ce-MnO2 nanostructures. XRD analysis confirmed the formation of α-MnO2 structures: α-MnO2·0.15 H2O and Ce-inserted α-MnO2·0.15 H2O. Raman spectroscopy confirmed the formation of tunnel-type α-MnO2 structures with the presence of Mn–O–Mn bonds in MnO6 octahedra and terminal Mn–O bonds stretching vibrations. SEM imaging revealed the formation of nanomaterials with different morphologies: nanofibers for MnO2 and nanorods for Ce-MnO2. The electrochemical testing by CV and GCD demonstrate that MnO2 nanofibers as ARZIB cathode can deliver a reversible specific capacity of 65 mA h/g throughout the majority of cycles. Meanwhile, Ce-MnO2 nanorods cathode exhibited better performance than MnO2 with a specific capacity of 115 mA h/g with high capacity retention over 500 GCD cycles. These results indicate that the pre-insertion of Ce4+ ions into the tunnels of MnO2 structure enhances the performance of Zn/MnO2 battery. Post-mortem analysis revealed that the cathode retained the structure of α-MnO2·0.15 H2O for the most part. Significant structural changes were observed for the MnO2 cathode after discharge due to zincation. Good reversibility was indicated in the results from post-mortem analysis, which supports the electrochemical findings. Further enhancements can be done in the future by searching for more stable electrolytes and nanostructured layered structures.
The original contributions presented in the study are included in the article/supplementary material, further inquiries can be directed to the corresponding author.
YD: Investigation, Methodology, Visualization, Writing—Original draft preparation AA: Investigation, Formal analysis, Resources, Data curation, Writing—Original draft preparation MA: Validation, Formal analysis, Resources, Writing—Reviewing and Editing HN: Validation, Supervision, Formal analysis, Resources, Writing—Reviewing and Editing NB: Conceptualization, Methodology, Resources, Supervision, Validation, Visualization, Writing—Original draft preparation, Writing—Reviewing and Editing.
This work was funded by Qatar University through its Collaborative Grants Funding Program with project number QUCG-CAS-21/23-602.
The authors gratefully acknowledge the Central Laboratories Unit (CLU) and Center for Advanced Materials at Qatar University for the assistance in spectroscopy and microscopy analysis.
The authors declare that the research was conducted in the absence of any commercial or financial relationships that could be construed as a potential conflict of interest.
All claims expressed in this article are solely those of the authors and do not necessarily represent those of their affiliated organizations, or those of the publisher, the editors and the reviewers. Any product that may be evaluated in this article, or claim that may be made by its manufacturer, is not guaranteed or endorsed by the publisher.
Alfaruqi, M. H., Gim, J., Kim, S., Song, J., Jo, J., Kim, S., et al. (2015). Enhanced reversible divalent zinc storage in a structurally stable α-MnO2 nanorod electrode. J. Power Sources 288, 320–327. doi:10.1016/j.jpowsour.2015.04.140
Andre, D., Hain, H., Lamp, P., Maglia, F., and Stiaszny, B. (2017). Future high-energy density anode materials from an automotive application perspective. J. Mater Chem. A Mater 5, 17174–17198. doi:10.1039/C7TA03108D
Cai, X., Li, H., Li, J., Yan, H., Liu, Y., Yu, H., et al. (2021). Hydrothermal synthesis of β-MnO2 nanorods for highly efficient zinc-ion storage. Ionics (Kiel). 27, 3943–3950. doi:10.1007/s11581-021-04188-6
Cheng, F., Zhao, J., Song, W., Li, C., Ma, H., Chen, J., et al. (2006). Facile controlled synthesis of MnO2 nanostructures of novel shapes and their application in batteries. Inorg. Chem. 45, 2038–2044. doi:10.1021/ic051715b
Costa, C. M., Barbosa, J. C., Gonçalves, R., Castro, H., del Campo, F. J., and Lanceros-Méndez, S. (2021). Recycling and environmental issues of lithium-ion batteries: Advances, challenges and opportunities. Energy Storage Mater 37, 433–465. doi:10.1016/j.ensm.2021.02.032
Duan, X., Yang, J., Gao, H., Ma, J., Jiao, L., and Zheng, W. (2012). Controllable hydrothermal synthesis of manganese dioxide nanostructures: Shape evolution, growth mechanism and electrochemical properties. CrystEngComm 14, 4196. doi:10.1039/c2ce06587h
Fang, G., Zhou, J., Pan, A., and Liang, S. (2018). Recent advances in aqueous zinc-ion batteries. ACS Energy Lett. 3, 2480–2501. doi:10.1021/acsenergylett.8b01426
Hsu, Y. K., Chen, Y. C., Lin, Y. G., Chen, L. C., and Chen, K. H. (2011). Reversible phase transformation of MnO2 nanosheets in an electrochemical capacitor investigated by in situ Raman spectroscopy. Chem. Commun. 47, 1252–1254. doi:10.1039/c0cc03902k
Huang, J. Q., Lin, X., Tan, H., Du, X., and Zhang, B. (2020). Realizing high-performance Zn-ion batteries by a reduced graphene oxide block layer at room and low temperatures. J. Energy Chem. 43, 1–7. doi:10.1016/j.jechem.2019.07.011
Ji, C., Ren, H., and Yang, S. (2015). Control of manganese dioxide crystallographic structure in the redox reaction between graphene and permanganate ions and their electrochemical performance. RSC Adv. 5, 21978–21987. doi:10.1039/c5ra01455g
Julien, C., Massot, M., Baddour-Hadjean, R., Franger, S., Bach, S., and Pereira-Ramos, J. P. (2003). Raman spectra of birnessite manganese dioxides. Solid State Ion. 159, 345–356. doi:10.1016/S0167-2738(03)00035-3
Kundu, D., Adams, B. D., Duffort, V., Vajargah, S. H., and Nazar, L. F. (2016). A high-capacity and long-life aqueous rechargeable zinc battery using a metal oxide intercalation cathode. Nat. Energy 1, 16119. doi:10.1038/nenergy.2016.119
Li, Y., and Dai, H. (2014). Recent advances in Zinc-air batteries. Chem. Soc. Rev. 43, 5257–5275. doi:10.1039/c4cs00015c
Liu, B., Sun, Y., Liu, L., Xu, S., and Yan, X. (2018). Advances in manganese-based oxides cathodic electrocatalysts for Li–air batteries. Adv. Funct. Mater 28, 1704973. doi:10.1002/adfm.201704973
Liu, C., Chi, X., Huang, J., and Liu, Y. (2021). A high-voltage rechargeable alkaline Zn–MnO4− battery with enhanced stability achieved by highly reversible MnO4−/MnO42− redox pair. Mater Today Energy 20, 100680. doi:10.1016/j.mtener.2021.100680
Ming, J., Guo, J., Xia, C., Wang, W., and Alshareef, H. N. (2019). Zinc-ion batteries: Materials, mechanisms, and applications. Mater. Sci. Eng. R Rep. 135, 58–84. doi:10.1016/j.mser.2018.10.002
Post, J. E. (1999). Manganese oxide minerals: Crystal structures and economic and environmental significance. Proc. Natl. Acad. Sci. U. S. A. 96, 3447–3454. doi:10.1073/pnas.96.7.3447
Shahjalal, M., Shams, T., Islam, Md.E., Alam, W., Modak, M., bin Hossain, S., et al. (2021). A review of thermal management for Li-ion batteries: Prospects, challenges, and issues. J. Energy Storage 39, 102518. doi:10.1016/j.est.2021.102518
Shi, M., Xiao, P., Yang, C., Sheng, Y., Wang, B., Jiang, J., et al. (2020). Scalable gas-phase synthesis of 3D microflowers confining MnO2 nanowires for highly-durable aqueous zinc-ion batteries. J. Power Sources 463, 228209. doi:10.1016/j.jpowsour.2020.228209
Su, D., Ahn, H. J., and Wang, G. (2013). Hydrothermal synthesis of α-MnO2 and β-MnO 2 nanorods as high capacity cathode materials for sodium ion batteries. J. Mater Chem. A Mater 1, 4845. doi:10.1039/c3ta00031a
Tang, B., Shan, L., Liang, S., and Zhou, J. (2019). Issues and opportunities facing aqueous zinc-ion batteries. Energy Environ. Sci. 12, 3288–3304. doi:10.1039/c9ee02526j
Wang, J., Wang, J.-G., Liu, H., Wei, C., and Kang, F. (2019). Zinc ion stabilized MnO2 nanospheres for high capacity and long lifespan aqueous zinc-ion batteries. J. Mater Chem. A Mater 7, 13727–13735. doi:10.1039/C9TA03541A
Wu, T. H., Zhang, Y., Althouse, Z. D., and Liu, N. (2019). Nanoscale design of zinc anodes for high-energy aqueous rechargeable batteries. Mater Today Nano 6, 100032. doi:10.1016/j.mtnano.2019.100032
Xu, C., Chen, Y., Shi, S., Li, J., Kang, F., and Su, D. (2015). Secondary batteries with multivalent ions for energy storage. Sci. Rep. 5, 14120. doi:10.1038/srep14120
Xu, C., Li, B., Du, H., and Kang, F. (2012). Energetic zinc ion chemistry: The rechargeable zinc ion battery. Angewandte Chemie - International Edition. doi:10.1002/anie.201106307
Xu, W., and Wang, Y. (2019). Recent progress on zinc-ion rechargeable batteries. Nanomicro Lett. 11, 90. doi:10.1007/s40820-019-0322-9
Yan, J., Wang, J., Liu, H., Bakenov, Z., Gosselink, D., and Chen, P. (2012). Rechargeable hybrid aqueous batteries. J. Power Sources 216, 222–226. doi:10.1016/j.jpowsour.2012.05.063
Yin, B., Zhang, S., Jiang, H., Qu, F., and Wu, X. (2015). Phase-controlled synthesis of polymorphic MnO2 structures for electrochemical energy storage. J. Mater Chem. A Mater 3, 5722–5729. doi:10.1039/c4ta06943a
Zang, X., Li, L., Sun, Z., Boukherroub, R., Meng, J., Cai, K., et al. (2020). A simple physical mixing method for MnO2/MnO nanocomposites with superior Zn2+ storage performance. Trans. Nonferrous Metals Soc. China 30, 3347–3355. doi:10.1016/S1003-6326(20)65466-8
Zhang, N., Cheng, F., Liu, J., Wang, L., Long, X., Liu, X., et al. (2017). Rechargeable aqueous zinc-manganese dioxide batteries with high energy and power densities. Nat. Commun. 8, 405. doi:10.1038/s41467-017-00467-x
Zhou, S., Wu, X., Du, H., He, Z., Wu, X., and Wu, X. (2022). Dual metal ions and water molecular pre-intercalated δ-MnO2 spherical microflowers for aqueous zinc ion batteries. J. Colloid Interface Sci. 623, 456–466. doi:10.1016/j.jcis.2022.05.018
Keywords: energy storage, aqueous rechargeable zinc-ion batteries, manganese oxide, hydrothermal method, electrochemical performance
Citation: De Luna Y, Alsulaiti A, Ahmad MI, Nimir H and Bensalah N (2023) Electrochemically stable tunnel-type α-MnO2-based cathode materials for rechargeable aqueous zinc-ion batteries. Front. Chem. 11:1101459. doi: 10.3389/fchem.2023.1101459
Received: 17 November 2022; Accepted: 13 January 2023;
Published: 24 January 2023.
Edited by:
Guijing Liu, Ludong University, ChinaReviewed by:
Limin Zhu, Henan University of Technology, ChinaCopyright © 2023 De Luna, Alsulaiti, Ahmad, Nimir and Bensalah. This is an open-access article distributed under the terms of the Creative Commons Attribution License (CC BY). The use, distribution or reproduction in other forums is permitted, provided the original author(s) and the copyright owner(s) are credited and that the original publication in this journal is cited, in accordance with accepted academic practice. No use, distribution or reproduction is permitted which does not comply with these terms.
*Correspondence: Nasr Bensalah, bmFzci5iZW5zYWxhaEBxdS5lZHUucWE=
Disclaimer: All claims expressed in this article are solely those of the authors and do not necessarily represent those of their affiliated organizations, or those of the publisher, the editors and the reviewers. Any product that may be evaluated in this article or claim that may be made by its manufacturer is not guaranteed or endorsed by the publisher.
Research integrity at Frontiers
Learn more about the work of our research integrity team to safeguard the quality of each article we publish.