 Ralf Meyer
 Kai Mueller1
 Dirk Enke
- 1Institute of Chemical Technology, Leipzig University, Leipzig, Germany
- 2Leibniz Institute of Surface Engineering, Leipzig, Germany
Surface-modified porous silica is a well-established composite material. To improve its embedding and application behavior, adsorption studies of various probe molecules have been performed using the technique of inverse gas chromatography (IGC). For this purpose, IGC experiments were carried out in the infinite dilution mode on macro-porous micro glass spheres before and after surface modification with (3-mercaptopropyl)trimethoxysilane. To provide information about the polar interactions between probe molecules and the silica surface, in particular, eleven polar molecules have been injected. In summary, the free surface energy for pristine silica (
1 Introduction
For elucidating catalytic processes and enhancing process efficiency, the characterization of porous catalysts is crucial. While the chemical characterization of the catalyst surface, e.g., by infrared and X-ray photoelectron spectroscopy, is standard practice, the energetic characterization of surface sites is often neglected, although all heterogeneously catalyzed reactions take place at the surface. Therefore, inverse gas chromatography (IGC) has become established as a gas phase method to investigate the adsorption/desorption processes of reactants and products in interactions with particles, granulates, or fibers. This method is able to determine a large number of physicochemical properties, for example, surface energies (Grimsey Ian et al., 2002; Das et al., 2011), acid/base/polar functionality of surfaces (Hamieh et al., 2002), solubility parameters (Adamska and Voelkel, 2006), desorption isotherms (Tisserand et al., 2009), surface heterogeneity (Balard, 1997), and phase transition temperatures (Surana et al., 2003). Although the method was developed in the 1970s, IGC has become popular in recent years. The fundamentals of this method for application to powder materials are summarized by Mohammadi-Jam and Waters (2014), Voelkel et al. (2015), and Williams (2015) in comprehensive reviews.
In general, IGC is a variant of gas chromatography in which the sample material is packed as a column, and interactions with the surface are investigated using organic probe molecules. When injecting particularly small amounts of probe molecules (so-called infinite dilution mode) and, thus, achieving low coverage of the surface, interactions only occur with high-energy adsorption sites and low-energy adsorption sites can be neglected. Ideally, intermolecular interactions between the probes can also be excluded, which results in highly symmetric, Gaussian peak-shaped chromatograms whose retention time remains very accurate even with small changes in sample concentration (Thielmann and Baumgarten, 2000).
The different retention times of individual probe molecules can be used to calculate thermodynamic state variables, such as free energies of the adsorption (
Adsorption enthalpy and adsorption entropy have an additional mechanistic–diagnostic value. By investigating the correlation of
For example, Ruthven and Kaul (1998) showed a correlation between adsorption enthalpy and entropy for the adsorption of linear paraffins on zeolites, silicalite, silica gel, and commercial catalysts. For a linear enthalpy and entropy relation, the isokinetic temperature (Tβ) can be determined from the slope of the regression line. Typically, it is used to highlight differences in adsorbate–adsorbent interactions and as aids in the search for the elucidation of the reaction mechanisms (Denayer et al., 1998; Bond et al., 2000). Thus, Eder and Lercher (1997) showed that the entropy loss is disproportionally stronger for the medium-pore zeolite H-ZSM-5 compared to the large-pore zeolites H-FAU, H-BEA, and H-MOR. This higher entropy loss observed on MFI suggests more pronounced interactions with the lattice of MFI and tighter bound surface complexes than with FAU.
With respect to the application of IGC, various publications show the remarkable relevance of the correlation between
The primary task of this work was comparing the surface functionalities of macro-porous silica spheres (intended for use in modern sensor technology) before and after extensive modification with (3-mercaptopropyl)trimethoxysilane (MPTMS) used as a cross-linking silane. It is obvious that silica hydrophobization by MPTMS multilayers should really and quickly be confirmed through IGC using the adsorption of a few linear paraffins at any temperature. However, measuring surface energies of complex surfaces with exclusively alkane probes is worthless, as has already been shown (Das et al., 2011; Bauer et al., 2019; Pal et al., 2019). Thus, we carried out all the work of injecting multiple polar and non-polar probes at multiple temperatures following the different IGC approaches (Gutmann and van Oss), the adsorption enthalpy–entropy determination, and DFT calculations for optimized adsorption complexes. However, even by applying the considerable arsenal of IGC techniques, this study cannot be expected to have entirely new and spectacular results on the energetic characterization of the well-known silica surface sites. Our intention was, consequently, to use IGC in an exemplary manner to obtain a more or less extensive surface energy characterization for new, less well-investigated carrier materials overlooking the chemical intuition for silica materials that removing –OH groups from its surface makes it less polar.
2 Materials and methods
2.1 Materials
Macro-porous glass spheres of particle size fraction 100–200 µm were produced according to a procedure published elsewhere (Enke et al., 2003). In brief, sodium borosilicate glass spheres with a composition of 70 wt% SiO2, 23 wt% B2O3, and 7 wt% Na2O were used as starting materials. To initiate phase separation, the glass was thermally treated at 650°C for 24 h. To remove the pure silica shell, the glass spheres were immersed in a sodium hydroxide solution. The extraction of the sodium-rich borate phase was performed at 80°C with hydrochloric acid. Colloidal silica deposits remaining in the pore system after acidic leaching were removed by treatment with sodium hydroxide solution at room temperature. Finally, the resulting porous glass was washed with deionized water and dried at 120°C.
2.2 Surface modification
The surface of porous glass spheres was modified for 1 h at room temperature by reaction with 0.05 mmol silane per m2 glass surface (surface coverage ∼6 MPTMS species/nm2) dissolved in ethanol and acidified by 0.1 M HCl. After solvent evaporation, the modified porous glass samples were dried at 90°C overnight. To reduce the MPTMS molecules, which are physisorbed at the silica surface after the surface modification, the glass beads were washed three times with water and ethanol, filtered, and finally dried at 100°C overnight.
2.3 Structural characterization
For scanning electron microscopy, a LEO GEMINI 1530 from Zeiss with an Everhart–Thornley detector (ETD) was used. The samples were attached to the sample carrier using an adhesive carbon foil and then vapor-deposited with gold. Measurements were performed at an accelerating voltage of 10 kV and a working distance of 5 mm. Particle size determination by laser diffraction was carried out on a Cilas 1064 L instrument. Nitrogen sorption and mercury intrusion measurements were performed by using an Autosorb iQ apparatus (Quantachrome) and a Quantachrome PoreMaster porosimeter, respectively. Elemental analyses were accomplished with a vario Max CHN (Elementar Analysensysteme GmbH) instrument. The amount of organics grafted on the modified porous glass was measured by thermogravimetric analysis (Netzsch STA 409) in air with a heating rate of 10 K/min.
2.4 Methods of inverse gas chromatography
IGC experiments were performed on a PerkinElmer Clarus 580 GC apparatus equipped with a flame ionization detector and controlled by the IGC software package from Adscientis SARL (Wittelsheim, France). Samples of 100–300 mg were filled into typical stainless-steel GC-packed columns (10 cm length, o.d., 1/4 in.), accomplished with mechanical vibration. Both ends of the columns were plugged with silane-treated glass wool. All the samples were conditioned at 150°C overnight under a helium flow rate of 20 mL/min. The IGC experiments were performed under the same flow rate at various temperatures (30°C–120°C). On each sample, several molecular probe molecules (C6-C10 n-alkanes, dichloromethane, chloroform, diethyl ether, ethanol, acetone, acetonitrile, ethyl acetate, butanone, tetrahydrofuran, benzene, and toluene) were injected at least two times.
2.4.1 Retention volume and dispersive and specific free energy of adsorption
In the IGC method, gaseous probe molecules are injected to study adsorption to the column material. Thereby, a very high dilution (so-called infinite dilution mode) allows intermolecular interactions to be ignored. Raw data from IGC are the different net retention times (
where
More details of the theoretical background can be found in recent IGC publications (Gholami et al., 2020; Hamieh et al., 2020).
Thermodynamic calculations (Schultz et al., 1987) result in the free energy of adsorption
where
The free adsorption energy can be split into two components contributing to the attractive forces of adsorption (Schrader and Loeb, 1992). These are the dispersive component of the adsorption energy
In the following section, approaches are shown to determine these components individually from the total free energy of adsorption to determine physicochemical properties, such as free surface energy and acid–base properties.
2.4.2 Method of topological index
The interpretation of the size of the free energies of adsorption (
One often applied approach was provided by Schultz et al. (1987) using surface tension data for characterization of the probe molecules according to their cross-sectional area
Since the IGC measurements are performed under infinite dilution conditions, which implies that only the interaction of single molecules on a free surface is considered, the morphology and the properties of the surface under study have to be related to appropriate molecular features (other than the typical properties of bulk materials) of the probe molecules. Therefore, an accessible topological index was used, developed by Brendle and Papirer (1997a), which can be calculated from the structure of the probe molecules and is expressed as
The
The graphical presentation of the free energies of adsorption (
Non-polar n-alkanes adsorb exclusively due to dispersive van der Waals interactions. Since the
2.5 Quantum chemical simulation
A better understanding of physicochemical properties and interaction energies between probe molecules and a surface, as obtained by IGC, can be supported by molecular modeling using van der Waals and electrostatic interactions between atoms of the probe molecules and atoms of the adsorption sites. The simulation of larger surface structures also allows statements regarding the orientation of probes on the adsorbent and gives indications for bond lengths as well as bond types (Grimsey I. M. et al., 2002). Density functional theory (DFT) B3LYP hybrid functional (Lee et al., 1988; Becke, 1996) was used for quantum chemical calculations as implemented in Jaguar, version 10.3 (Schrodinger, 2019). As a model system for calculations, a 32 T (tetrahedral) silica cluster (cell size of approximately 1 nm × 1 nm) has been used in its non-hydroxylated and hydroxylated forms (no OH group and 2 OH groups/nm2, respectively), which resulted in a Si32O68H8 composition (108 atoms as a whole). The SiO2 cluster model and the adsorption structures of different probe molecules were optimized in the gas phase at the B3LYP/6-31G (d) level of theory, which seems to be a reliable method for studying the structures and stabilities of silica materials (Abdallah et al., 2009; Rimola et al., 2013). This computational model has also been successfully used in our previous works (Bauer et al., 2017; Bauer et al. 2019; Bauer et al. 2021). Test calculations on selected molecules were performed using the B3LYP/6–31 + G (d, p) approach showing the same trend. Overall, however, it must be noted that DFT calculations on such large systems are time consuming and, therefore, the use of Monte Carlo simulations may be a very promising approach (Kong et al., 2022). The energy of adsorption complex formation (
3 Results and discussion
3.1 Structural characterization of porous silica spheres
The porous silica spheres produced were first examined by means of textural methods. Figure 1A shows an electro-microscopic image of the porous silica spheres. Thermally induced phase separation, followed by the removal of the outer skin and acid extraction of the borate-rich phase, produced a visible pore system (Figure 1B). The particles retain their spherical shape with a diameter of ∼100 µm. However, due to the alkaline extractions, distinct cavities can be observed on the spherical surface. A difference in texture due to surface modification cannot be detected by scanning electron microscopy on MPTMS-modified porous glass spheres. Particle size determination by laser diffraction showed a Gaussian particle size distribution in a range of 60–200 µm with an average value of 112.5 µm.
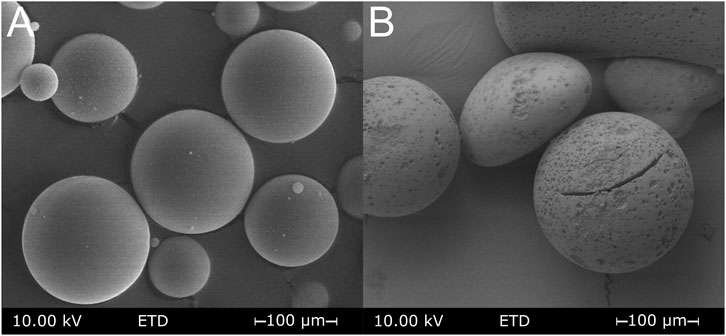
FIGURE 1. Electro-microscopic image of the silica spheres before (A) and after (B) the leaching procedure to create porosity.
According to the mercury porosimetry in Figure 2, the material exhibited a narrow mono-modal pore system. The average pore diameter is 77 nm at a porosity of 51.7% and a pore volume of 0.27 cm2/g. Signals of pore diameters at 4,000 nm can be attributed to an interparticulate pore volume, which occurs due to the packing of the silica spheres at a particle size of about 100 µm. As expected, no change in this pore structure due to post-synthetic silanization was observed.
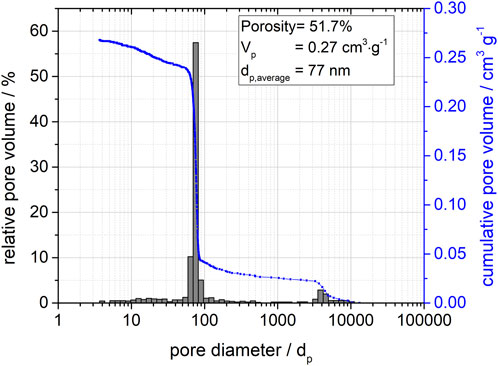
FIGURE 2. Pore distribution function for the porous silica spheres determined by mercury porosimetry showing relative and cumulative pore volumes.
The internal surface area of the pore system was determined by nitrogen sorption using BET theory. The specific BET surface area of the pure glass of 26 m2/g is reduced to 19 m2/g by silanization with MPTMS. Calculating the pore size distribution from desorption isotherms, a neglectable change in average pore diameter occurs for the modified glass. Therefore, the decrease of specific BET area after surface modification can be addressed to a reduction of surface roughness due to the grafting of MPTMS.
3.2 Determination of the free energy of adsorption
The free energy of adsorption
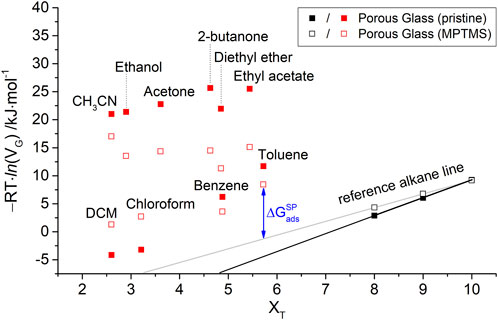
FIGURE 3. Free energy of adsorption
For the evaluation of the interactions of polar probe molecules, separate consideration of the polar component of the adsorption free energy
where
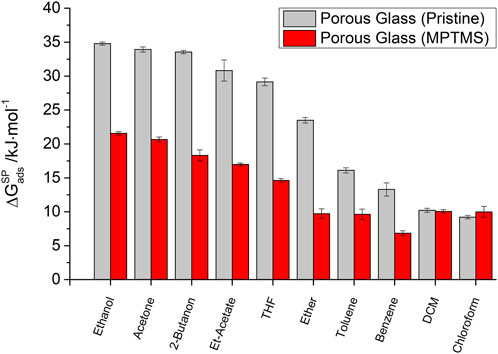
FIGURE 4. Polar component of the free energy of adsorption
This order already shows a correlation between the chemical structure of the polar probes and the strength of the observed specific interactions. The strongest interactions occur for probe molecules with the highest dielectric constants (ethanol and acetone) and, consequently, the ability to form hydrogen bonds. According to the classification, the formation of π-interactions for benzene or toluene plays a minor role in the polar interaction strength. Likewise, purely Lewis-acidic probe molecules such as chloroform (CHCl3) and dichloromethane (DCM) show only a weak interaction with the surface of the porous glass.
For MPTMS-modified silica samples in general, a decreasing polar component of the adsorption free energy (
This demonstrates that an insufficient number of polar probe molecules is inappropriate for IGC studies of polar surface sites. Only with a large spectrum of polar molecules is it possible to represent all the contributions to adsorptive–adsorbent interactions. The example of the mono-polar Lewis acid chloroform shows that this probe molecule is not sensitive to a loss of Lewis acid silanol groups due to the surface modification of porous glass. In contrast, Lewis basic probe molecules with the ability to form hydrogen bonds form particularly attractive interactions in the case of silanol groups and are, therefore, well suited for imaging the surface properties of porous glasses.
3.3 Determination of free surface energy
In accordance with the linear relationship found between the free energy of adsorption of n-alkanes and their chain length, Dorris and Gray (Dorris and Gray, 1980) provided a simple approach to calculate the dispersive contribution of the surface free energy (
where (
For IGC measurement in the range from 30°C to 120°C, a temperature dependence of
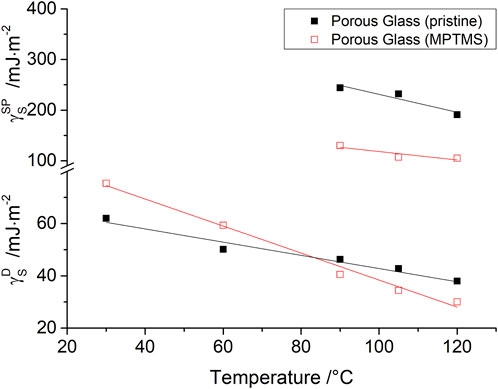
FIGURE 5. Dispersive
As Bauer et al. have already shown in previous publications (Bauer et al., 2019; Bauer et al., 2021), the strength of purely disperse interactions on oxide materials is inferior to the strength of polar interactions. For this reason, surface characterization using only disperse components of the free surface energy
In comparison with the determination of the dispersive component of the surface energy
An adhesion approach postulated by van Oss et al. (1988) was used to describe the polar component of free surface energy
During adsorption of a polar probe molecule (L) onto a solid surface (S), the interactions between the Lewis acid property of the probe molecules
where
However, the van Oss approach is rarely applied in this original non-linear form. For the determination of
Unfortunately, the obtained estimates for
where
The associated polar component of free surface energy
Values of
The reason for the decrease in polar interactions is the reduction of the surface silanol groups by silane modification. However, even after extensive silanization, the remaining polar silanol groups make an important contribution to the physicochemical properties of siliceous materials (Bauer et al., 2003; Bauer et al. 2019; Bauer et al. 2021).
After values for
As displayed in Table 1, the total amount of surface energy
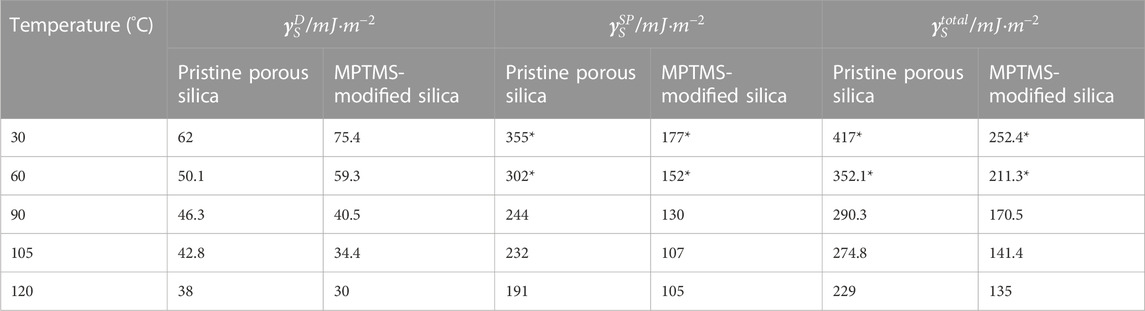
TABLE 1. Estimated values for the free surface energy
3.4 Acid–base properties
In the field of adhesion, Fowkes (Fowkes, 1964; Fowkes, 1968) was the first who addressed the non-dispersive or specific interactions to acid–base or donor–acceptor interactions.
In the meantime, various models have been developed to investigate the acid–base properties by means of IGC. The Gutmann model (Gutmann, 1978) assigns parameters to the polar probe molecules of IGC according to their electron pair acceptor ability (AN) and electron pair donor ability (DN). Subsequently, acid (
Plotting
However, the determination of acid–base properties from the thermodynamic parameter
Temperature dependency must be taken into account for these values, and this simplification is only valid if the entropic contributions to
Finally, the surface of the column material can be characterized in terms of Lewis acidity with the determined parameters
Two complications exist for the Gutmann approach with respect to IGC-ID, since the determination of
Via Gutmann’s approach, for example, Sreekanth et al. (2018) assessed that the surface of melamine- and thiourea-derived graphitic carbon nitrides contain similar basic sites and fewer acidic sites. In the same way, Lazarević et al. (2011) proved that the iron-modification of sepiolite surface did not effect a change in acid–base properties, as the
For materials such as graphitic carbon nitrides and sepiolite, which are not tested as frequently or completely as silica, what can be expected from the chemical intuition concerning any specific surface modifications? The reliable and effective handling of the various IGC techniques can provide some solid evidence rather than baseless suppositions.
In the literature, further enhancements of the Gutmann approach can be found, such as the corrected AN* values (Riddle and Fowkes, 1990) or an additional K-parameter for amphoteric contributions according to Hamieh et al. (2020).
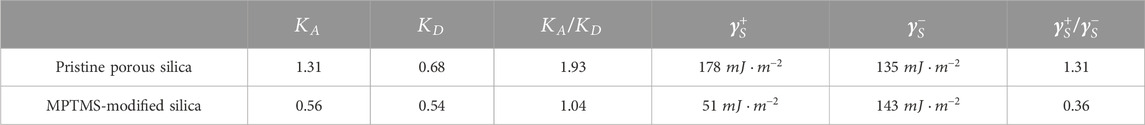
TABLE 2. Estimated acid–base parameters from the Gutmann and van Oss approachs at 120°C for porous silica before and after surface modification with MPTMS.
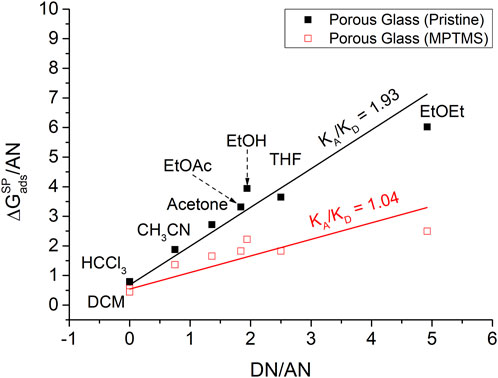
FIGURE 6. Determination of the acid and base parameters (
As is well known, measuring surface energies of complex surfaces with non-polar probes only is worthless. A significant advantage of the van Oss approach (compared with the Gutmann approach) rests in the supply of the polar component of free surface energy
The authors accept the argument of chemical intuition that removing −OH groups from silica makes its surface less polar. However, the van Oss approach provides numbers which give further information about the degree of reduction (see Figure 5).
In the IGC literature on controlled pristine porous glass, a Lewis-acidic character is mostly reported with
3.5 Thermodynamic parameters and enthalpy–entropy compensation
The parameter of free energy of adsorption
Plotting
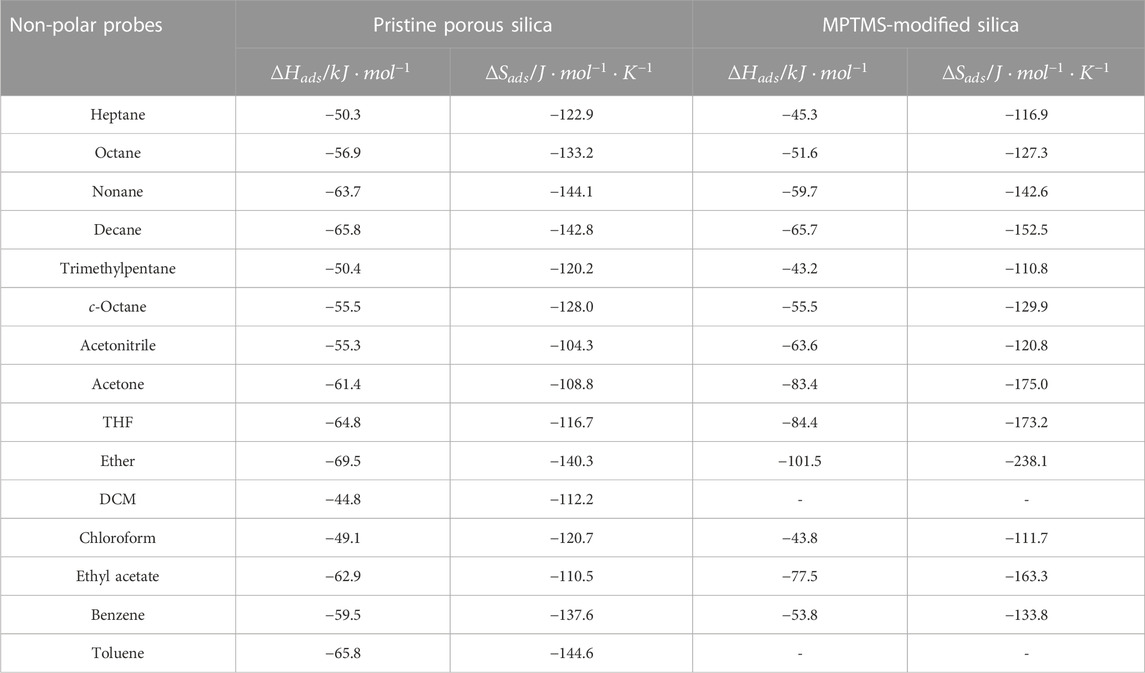
TABLE 3. Estimated
In many thermodynamic analyses of chemical reactions and adsorption processes, it has been experimentally demonstrated that there are linear relationships between two thermodynamic or kinetic parameters in which the factors
This phenomenon is called enthalpy–entropy compensation (Liu and Guo, 2001) and can be used to address similar (or different) adsorption behavior of the probe molecules. Since the slope
The observation of the compensation effect for widely different processes has led to a number of explanations, including ambiguous discussions (Yelon et al., 2012; Pan et al., 2015; Perez-Benito and Mulero-Raichs, 2016). It has also been proposed that the compensation effect is, in some cases, a result of trivial statistical errors and experimental uncertainties (Suárez et al., 1994). According to Krug et al. (1976a) and Krug et al. (1976b), the entropy–enthalpy compensation theory is only valid if the isokinetic temperature (
Studies have shown that enthalpy–entropy compensation occurs not only during the adsorption of gases on active surfaces (Garrone et al., 2008; Korolev et al., 2011; Pera-Titus, 2016) but also in water–sorbent systems of dried foodstuff (Gabas et al., 1999; McMinn et al., 2005).
Originating from the enthalpy–entropy compensation, the isokinetic temperature is a useful value to distinguish between different adsorption/desorption mechanisms. For example, Pimentel and McClellan (1971) found different isokinetic temperatures for the formation of hydrogen bonds between ethers (
Furthermore, the compensation effect between enthalpy and entropy reported for n-alkane sorption on different acidic zeolites (Eder and Lercher, 1997) reveals that the slopes, i.e., the isokinetic temperatures, are not equal; obviously due to differences in their sorption properties, which are affected by pore size, Si/Al ratio, etc. It should be noted that the difference in slopes can also be attributed to the existence of different surface sites (Díaz et al., 2007).
In the specific case of n-hexane adsorption on HZSM-5, Hercigonja et al. determined the compensation temperatures. Here, the lowest (−50°C) and the highest (69°C) isokinetic temperatures were found for parent HZMS-5 and for CuZSM-5, respectively. Importantly for the suitability of the isokinetic theory, all found compensation temperatures differ from the temperature of adsorption (30°C). These results clearly show that the highest changes in entropy of adsorbed n-hexane were achieved by its adsorption on the sample containing Cu2+ cations (Eder and Lercher, 1997).
The IGC data also show such enthalpy–entropy compensation effect for different kinds of probe molecules, as shown in Figures 7, 8 for the silica materials studied. Corresponding to the different isokinetic temperatures obtained from plotting
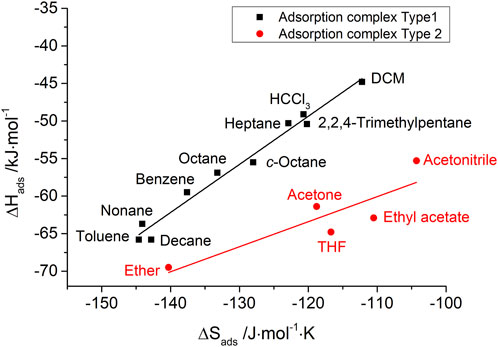
FIGURE 7. Enthalpy–entropy compensation for probe molecules with two types of adsorption complexes on pristine porous silica.
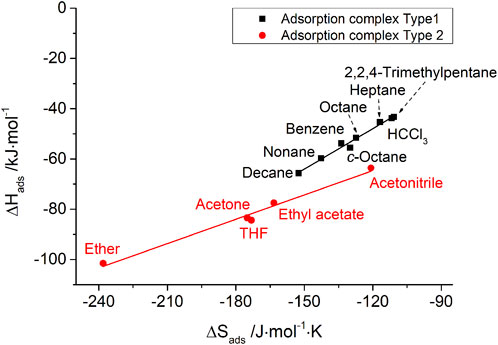
FIGURE 8. Enthalpy–entropy compensation for probe molecules with two types of adsorption complexes on MPTMS-modified porous silica.
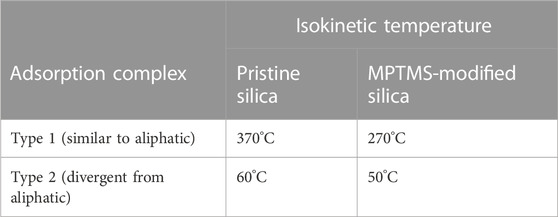
TABLE 4. Two different assumed adsorption complexes (type 1 and type 2) and the related isokinetic temperatures for probe molecules on the silica surface according to enthalpy–entropy compensation before and after surface modification.
The authors’ conclusion for the e–e compensation effect observed in this IGC study: on the basis of isokinetic temperatures, it has given reliable information about the very different nature of adsorption complexes of typically polar IGC probe molecules, e.g., chloroform (exclusively van der Waals interactions) and tetrahydrofuran (predominantly hydrogen bond formation). However, the scientific meaning of the height of isokinetic temperatures is still open to discussion.
3.6 Adsorption complexes and DFT investigations of polar probes on the silica surface
DFT calculations on the adsorption of polar probes on the surface of a silica cluster model in its hydroxylated and non-hydroxylated form (2 OH groups/nm2 and no OH group, respectively) have been performed. Figure 9 shows an adsorbed tetrahydrofuran molecule in its optimized molecular structure at a distance of about 1.7 Å to one of the surface silanol groups.
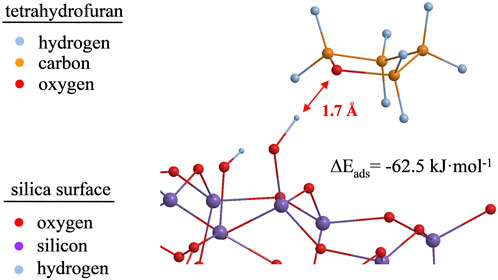
FIGURE 9. Optimized geometry for tetrahydrofuran adsorbed on silanol groups of a 32 Si-member silica cluster model at the B3LYP/6-31G (d,p) level of theory. For reasons of demonstrability, protons at the silica cluster’s boundaries are omitted.
For comparison, Abdallah et al. (2009) found that, with the same B3LYP/6-31G(d) level of theory, bond lengths for hydrogen bonds were 1.7 Å and 1.9 Å for the physical adsorption of isopropanol on a silica surface. For THF adsorbed on the silica surface, not only the identical bond lengths, but also the localization of the Si–OH proton between the oxygen of the silanol group and the oxygen of the THF (Figure 9) indicate the formation of a hydrogen bond. The calculated energy of complexes formation (
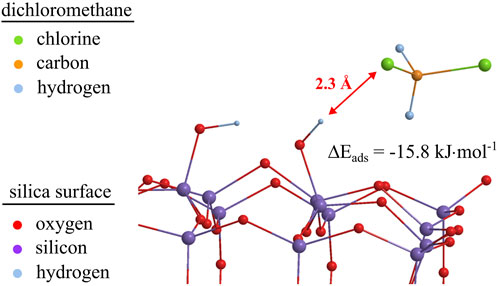
FIGURE 10. Optimized geometry for dichloromethane adsorbed on silanol groups of a 32 Si-member silica cluster model at the B3LYP/6-31G (d, p) level of theory. For reasons of demonstrability, protons at the silica cluster’s boundaries are omitted.
For comparison, free adsorption energies and bond distances for polar and non-polar probes on a neat silica cluster and a silica cluster with Si–OH groups are shown in Table 5. It should be noted that both non-polar and polar probe molecules show higher free adsorption energies when silanol groups are present on the surface of the silica cluster, pointing to stronger bonding of even dispersive interacting molecules with silanol groups. In comparison, the type 2adsorption complexes already show high adsorption energies (
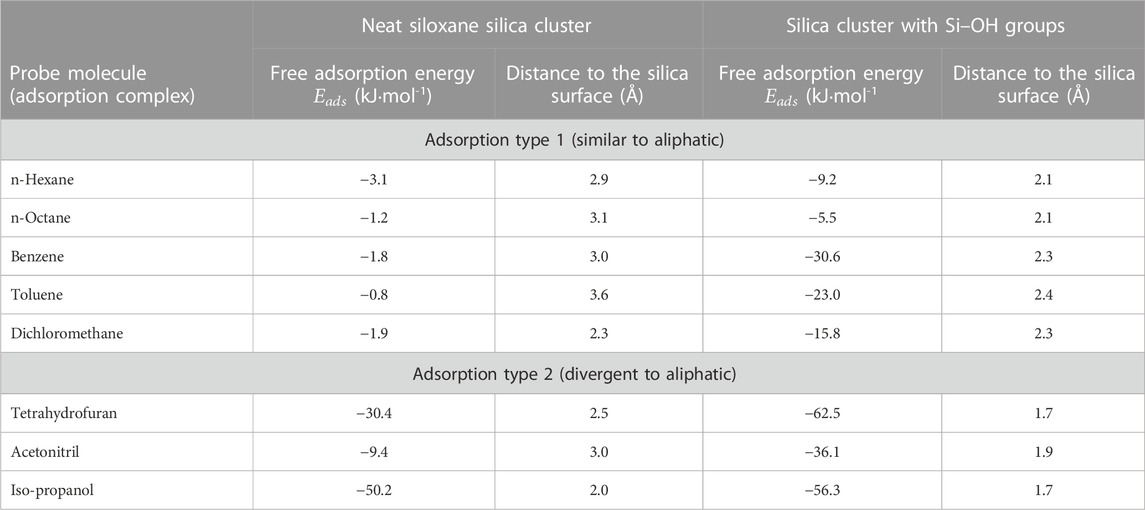
TABLE 5. Free adsorption energies and distances to the silica surface from DFT calculations for polar probe molecules on Si–OH free and Si–OH containing surfaces.
4 Conclusion
The technique of inverse gas chromatography (IGC) has been applied to investigate the effect of silanization on the physicochemical surface properties of siliceous materials. Thus, porous glass spheres with a mean particle diameter of 110 µm and a mean pore diameter of 77 nm were modified with a surface coverage of 6 MPTMS species/nm2 using 3-mercaptopropyltrimethoxysilane (MPTMS) as a grafting agent. The surfaces of the pristine and modified silica were analyzed by scanning electron microscopy (SEM), nitrogen sorption, mercury porosimetry, elemental and gravimetric analysis, and inverse gas chromatography in the infinite dilution mode, and particle size determination was performed using laser diffraction.
For both silica samples, the dispersive component of the surface energy (
With respect to the acid–base surface properties determined according to the Gutmann as well as the van Oss approach, the Lewis-acidic parameters (
According to the enthalpy–entropy compensation from the thermodynamic parameters, a correlation between
Quantum chemical studies on the adsorption of particularly polar probe molecules have proven useful in providing not only the surface configurations of the adsorbates but also in giving indications for the different adsorption complexes on the silica surface.
Data availability statement
The original contributions presented in the study are included in the article/Supplementary Material, further inquiries can be directed to the corresponding authors.
Author contributions
RM: Conceptualization, investigation, methodology, visualization, and writing—original draft; KM: Investigation; SN: Investigation, formal analysis, and visualization; FB: Conceptualization, methodology, and writing—review and editing; and DE: Supervision and writing—review and editing.
Funding
This work was supported by the German Research Foundation (DFG) (EN 942/10-1). This publication was funded by the Open-Access Publishing Fund of Leipzig University supported by the German Research Foundation within the program Open-Access Publication Funding.
Acknowledgments
The authors thank Eric Brendle (Adscientis, Wittelsheim, France) and Ralf Duempelmann (Inolytix AG, Sisseln, Switzerland) for sharing their expertise regarding IGC and helpful discussions on polar interactions.
Conflict of interest
The authors declare that the research was conducted in the absence of any commercial or financial relationships that could be construed as a potential conflict of interest.
Publisher’s note
All claims expressed in this article are solely those of the authors and do not necessarily represent those of their affiliated organizations, or those of the publisher, the editors, and the reviewers. Any product that may be evaluated in this article, or claim that may be made by its manufacturer, is not guaranteed or endorsed by the publisher.
References
Abdallah, M. R., Hasan, M. A., and Zaki, M. I. (2009). Theoretical study of the adsorption of 2-propanol onto silica surfaces on the basis of ab initio and density functional calculations. Adsorpt. Sci. Technol. 27 (3), 215–253. doi:10.1260/026361709789868884
Adamska, K., and Voelkel, A. (2006). Hansen solubility parameters for polyethylene glycols by inverse gas chromatography. J. Chromatogr. A 1132 (1-2), 260–267. doi:10.1016/j.chroma.2006.07.066
Balard, H. (1997). Estimation of the surface energetic heterogeneity of a solid by inverse gas chromatography. Langmuir 13 (5), 1260–1269. doi:10.1021/la951526d
Bauer, F., Czihal, S., Bertmer, M., Decker, U., Naumov, S., Wassersleben, S., et al. (2017). Water-based functionalization of mesoporous siliceous materials, Part 1: Morphology and stability of grafted 3-aminopropyltriethoxysilane. Microporous Mesoporous Mater. 250, 221–231. doi:10.1016/j.micromeso.2016.01.046
Bauer, F., Meyer, R., Bertmer, M., Naumov, S., Al-Naji, M., Wissel, J., et al. (2021). Silanization of siliceous materials, part 3: Modification of surface energy and acid-base properties of silica nanoparticles determined by inverse gas chromatography (IGC). Colloids Surfaces A Physicochem. Eng. Aspects 618, 126472. doi:10.1016/j.colsurfa.2021.126472
Bauer, F., Meyer, R., Czihal, S., Bertmer, M., Decker, U., Naumov, S., et al. (2019). Functionalization of porous siliceous materials, Part 2: Surface characterization by inverse gas chromatography. J. Chromatogr. A 1603, 297–310. doi:10.1016/j.chroma.2019.06.031
Bauer, F., Sauerland, V., Ernst, H., Glasel, H.-J., Naumov, S., and Mehnert, R. (2003). Preparation of scratch- and abrasion-resistant polymeric nanocomposites by monomer grafting onto nanoparticles, 4. Macromol. Chem. Phys. 204 (3), 375–383. doi:10.1002/macp.200390003
Becke, Axel D. (1996). Density-functional thermochemistry. IV. A new dynamical correlation functional and implications for exact-exchange mixing. J. Chem. Phys. 104 (3), 1040–1046. doi:10.1063/1.470829
Bond, Geoffrey C., Keane, M. A., Kral, H., Lercher, J. A., Keane, Mark A., Kral, Hans, et al. (2000). Compensation phenomena in heterogeneous catalysis: General principles and a possible explanation. Catal. Rev. 42 (3), 323–383. doi:10.1081/CR-100100264
Brendle, Eric, and Papirer, Eugene (1997b). A new topological index for molecular probes used in inverse gas chromatography. J. Colloid Interface Sci. 194 (1), 217–224. doi:10.1006/jcis.1997.5105
Brendle, Eric, and Papirer, Eugene (1997a). A new topological index for molecular probes used in inverse gas chromatography for the surface nanorugosity evaluation. J. Colloid Interface Sci. 194 (1), 207–216. doi:10.1006/jcis.1997.5104
Castellano, M., Marsano, E., Turturro, A., Conzatti, L., and Busca, G. (2012). Dependence of surface properties of silylated silica on the length of silane arms. Adsorption 18 (3-4), 307–320. doi:10.1007/s10450-012-9402-6
Das, Shyamal C., Larson, Ian, Morton, David A. V., and Stewart, Peter J. (2011). Determination of the polar and total surface energy distributions of particulates by inverse gas chromatography. Langmuir 27 (2), 521–523. doi:10.1021/la104135z
Denayer, Joeri F., Baron, G. V., Martens, J. A., Jacobs, P. A., Baron, Gino V., Martens, Johan A., et al. (1998). Chromatographic study of adsorption of n -alkanes on zeolites at high temperatures. J. Phys. Chem. B 102 (17), 3077–3081. doi:10.1021/jp972328t
Díaz, Eva, Ordóñez, Salvador, and Vega, Aurelio (2007). Adsorption of volatile organic compounds onto carbon nanotubes, carbon nanofibers, and high-surface-area graphites. J. Colloid Interface Sci. 305 (1), 7–16. doi:10.1016/j.jcis.2006.09.036
Donnet, J. B., Park, S. J., Park, S. J., and Balard, H. (1991). Evaluation of specific interactions of solid surfaces by inverse gas chromatography. Chromatographia 31 (9-10), 434–440. doi:10.1007/BF02262385
Dorris, Gilles M., and GrayDerek, G. (1980). Adsorption of n-alkanes at zero surface coverage on cellulose paper and wood fibers. J. Colloid Interface Sci. 77 (2), 353–362. doi:10.1016/0021-9797(80)90304-5
Eder, Florian, and Lercher, Johannes A. (1997). Alkane sorption in molecular sieves: The contribution of ordering, intermolecular interactions, and sorption on Brønsted acid sites. Zeolites 18 (1), 75–81. doi:10.1016/S0144-2449(96)00127-3
Enke, D., Janowski, F., and Schwieger, W. (2003). Porous glasses in the 21st century––a short review. Microporous Mesoporous Mater. 60 (1-3), 19–30. doi:10.1016/S1387-1811(03)00329-9
Fowkes, Frederick M. (1964). Attractive forces at interfaces. Industrial Eng. Chem. 56 (12), 40–52. doi:10.1021/ie50660a008
Fowkes, Frederick M. (1968). Calculation of work of adhesion by pair potential suummation. J. Colloid Interface Sci. 28 (3-4), 493–505. doi:10.1016/0021-9797(68)90082-9
Gabas, A. L., Telis-Romero, J., and Menegalli, F. C. (1999). Thermodynamic models for water sorption by grape skin and pulp. Dry. Technol. 17 (4-5), 962–974. doi:10.1080/07373939908917584
Gaines, G. L. (1972). Surface and interfacial tension of polymer liquids -a review. Polym. Eng. Sci. 12 (1), 1–11. doi:10.1002/pen.760120102
Gamelas, J. A. F., Azpeitia, M., Ferreira, P. J., and Tejado, A. (2018). Surface energy and lewis acid-base characteristics of lignocellulosic fibers upon modification by chemical vapor deposition of trichloromethylsilane: An inverse gas chromatography study. J. Wood Chem. Technol. 38 (3), 264–275. doi:10.1080/02773813.2018.1454961
Garrone, E., Bonelli, B., and Otero Areán, C. (2008) Enthalpy–entropy correlation for hydrogen adsorption on zeolites Chem. Phys. Lett. 456 (1-3), 68–70. doi:10.1016/j.cplett.2008.03.014
Gholami, F., Tomas, M., Gholami, Z., Mirzaei, S., and Vakili, M. (2020). Fatemeh/tomas, martin/gholami, zahra/mirzaei, somayeh/vakili, mohammadtaghi (2020). surface characterization of carbonaceous materials using inverse gas chromatography: A review. Electrochem 1 (4), 367–387. doi:10.3390/electrochem1040024
Greene, S. A., and Past, H. (1958). The determination of heats of adsorption by gas-solid chromatography. J. Phys. Chem. 62 (1), 55–58. doi:10.1021/j150559a015
Grimsey, Ian M., Feeley, J. C., York, P., Feeley, Jane C., and York, Peter (2002b). Analysis of the surface energy of pharmaceutical powders by inverse gas chromatography. J. Pharm. Sci. 91 (2), 571–583. doi:10.1002/jps.10060
Grimsey, I. M., Osborn, J. C., Doughty, S. W., York, P., and Rowe, R. C. (2002a). The application of molecular modelling to the interpretation of inverse gas chromatography data. J. Chromatogr. A 969 (1-2), 49–57. doi:10.1016/S0021-9673(02)00898-1
Gutmann, Viktor (1978). The Donor-Acceptor approach to molecular interactions. New York, NY, USA: Plenum Press.
Hamieh, T., Ali Ahmad, A., Roques-Carmes, T., and Toufaily, J. (2020). Surface thermodynamics and Lewis acid-base properties of metal-organic framework Crystals by Inverse gas chromatography at infinite dilution. J. Chromatogr. A 1666, 462849. doi:10.1016/j.chroma.2022.462849
Hamieh, Tayssir, Ali Ahmad, Ali, Roques-Carmes, Thibault, and Toufaily, Joumana (2020). New approach to determine the surface and interface thermodynamic properties of H-β-zeolite/rhodium catalysts by inverse gas chromatography at infinite dilution. Sci. Rep. 10 (1), 20894. doi:10.1038/s41598-020-78071-1
Hamieh, Tayssir, Fadlallah, Mohamed-Baker, and Schultz, Jacques (2002). New approach to characterise physicochemical properties of solid substrates by inverse gas chromatography at infinite dilution. J. Chromatogr. A 969 (1-2), 37–47. doi:10.1016/s0021-9673(02)00369-2
Hamieh, Tayssir, Rezzaki, Mustapha, and Schultz, Jacques (2001). Study of the transition temperatures and acid–base properties of poly (methyl methacrylate) adsorbed on alumina and silica, by using inverse gas chromatography technique. Colloids Surfaces A Physicochem. Eng. Aspects 189 (1-3), 279–291. doi:10.1016/s0927-7757(01)00597-0
Huang, Jan-Chan (2007). Entropy–enthalpy compensation in solution properties of solutes at infinite dilution in nonpolar polymers. J. Appl. Polym. Sci. 104 (2), 1241–1247. doi:10.1002/app.25766
James, A. T., and Martin, A. J. P. (1952). Gas-liquid partition chromatography; the separation and micro-estimation of volatile fatty acids from formic acid to dodecanoic acid. Biochem. J. 50 (5), 679–690. doi:10.1042/bj0500679
Kong, L., Dong, K., Li, G., Yang, C., Lai, S., and Qu, Y. (2022). Molecular simulation study on the protective mechanism of three kinds of HTPB propellant antioxidants. FirePhysChem 2 (1), 4–13. doi:10.1016/j.fpc.2022.03.003
Korolev, Alexander A., Shiryaeva, V. E., Popova, T. P., Kurganov, A. A., Shiryaeva, Valeria E., Popova, Tamara P., et al. (2011). Enthalpy-entropy compensation effect on adsorption of light hydrocarbons on monolithic stationary phases. J. Sep. Sci. 34 (16-17), 2362–2369. doi:10.1002/jssc.201100162
Kraus, E., Baudrit, B., Heidemeyer, P., Bastian, M., Nguen, D. A., Starostina, I., et al. (2015). Perspektiven der Säure-Base-Methode zur Untersuchung der Oberflächeneigenschaften von Polymeren. Chem. Ing. Tech. 87 (10), 1334–1341. doi:10.1002/cite.201400174
Krug, R. R., Hunter, W. G., and Grieger, R. A. (1976a). Enthalpy-entropy compensation. 1. Some fundamental statistical problems associated with the analysis of van't Hoff and Arrhenius data. J. Phys. Chem. 80 (21), 2335–2341. doi:10.1021/j100562a006
Krug, R. R., Hunter, W. G., and Grieger, R. A. (1976b). Enthalpy-entropy compensation. 2. Separation of the chemical from the statistical effect. J. Phys. Chem. 80 (21), 2341–2351. doi:10.1021/j100562a007
Lara, Javier, and Schreiber, Henry (1991). Specific interactions and adsorption of film-forming polymers. J. Coatings Technol. 63 (801).
Lazarević, S., Janković-Častvan, I., Onjia, A., Krstić, J., Janaćković, D., and Petrović, R. (2011). Surface characterization of iron-modified sepiolite by inverse gas chromatography. Industrial Eng. Chem. Res. 50 (20), 11467–11475. doi:10.1021/ie200595n
Lee, C., Weitao, Y., and Robert, G. P. (1988). Development of the Colle-Salvetti correlation-energy formula into a functional of the electron density. Phys. Rev. B, Condens. matter 37 (2), 785–789. doi:10.1103/PhysRevB.37.785
Liu, L., and Guo, Q. X. (2001). Isokinetic relationship, isoequilibrium relationship, and enthalpy-entropy compensation. Chem. Rev. 101 (3), 673–696. doi:10.1021/cr990416z
McMinn, W. A. M., Al-Muhtaseb, A. H., and Magee, T. R. A. (2005). Enthalpy–entropy compensation in sorption phenomena of starch materials. Food Res. Int. 38 (5), 505–510. doi:10.1016/j.foodres.2004.11.004
Mittal, K. L. (Ed.) (1991). Acid-base interactions. Relevance to adhesion science and technology ; in Proceedings of the Honour of the 75th birthday of professor frederick M. Fowkes; [proceedings of the symposium on acid-base interactions; relevance to adhesion science and technology, June 18 - 20, 1990. Utrecht, The Netherlands, VSP.
Mohammad, Mohammad Amin (2013). Chromatographic adhesion law to simplify surface energy calculation. J. Chromatogr. A 1318, 270–275. doi:10.1016/j.chroma.2013.09.066
Mohammadi-Jam, S., and Waters, K. E. (2014). Inverse gas chromatography applications: A review. Adv. colloid interface Sci. 212, 21–44. doi:10.1016/j.cis.2014.07.002
Münch, Alexander S., and Mertens, Florian O. R. L. (2018). Investigation of n-alkane adsorption on HKUST-1 and determination of intrinsic interfacial energy contributions. Microporous Mesoporous Mater. 270 (74), 180–188. doi:10.1016/j.micromeso.2018.05.012
Pal, A., Kondor, A., Mitra, S., Thu, K., Harish, S., Sivasankaran, S., et al. (2019). On surface energy and acid–base properties of highly porous parent and surface treated activated carbons using inverse gas chromatography. J. Industrial Eng. Chem. 69 (4), 432–443. doi:10.1016/j.jiec.2018.09.046
Pan, A., Biswas, T., Rakshit, A. K., and Moulik, S. P. (2015). Enthalpy-entropy compensation (eec) effect: A revisit. J. Phys. Chem. B 119 (52), 15876–15884. doi:10.1021/acs.jpcb.5b09925
Papirer, E., Balard, H., Balard, H., and Vidal, A. (1988). Inverse gas chromatography: A valuable method for the surface characterization of fillers for polymers (glass fibres and silicas). Eur. Polym. J. 24 (8), 783–790. doi:10.1016/0014-3057(88)90015-8
Pera-Titus, M. (2016). Direct inference of site strength in basic solids upon CO2 adsorption: Enthalpy-entropy compensation effects. Phys. Chem. Chem. Phys. PCCP 18 (32), 22548–22556. doi:10.1039/C6CP03941C
Perez-Benito, J. F., and Mulero-Raichs, M. (2016). Enthalpy-entropy compensation effect in chemical kinetics and experimental errors: A numerical simulation approach. J. Phys. Chem. A 120 (39), 7598–7609. doi:10.1021/acs.jpca.6b08079
Pimentel, G. C., McClellan, A. L., and McClellan, A. L. (1971). Hydrogen bonding. Annu. Rev. Phys. Chem. 22 (1), 347–385. doi:10.1146/annurev.pc.22.100171.002023
Pirez, C., Lee, A. F., Jones, C., and Wilson, K. (2014). Can surface energy measurements predict the impact of catalyst hydrophobicity upon fatty acid esterification over sulfonic acid functionalised periodic mesoporous organosilicas? Catal. Today 234, 167–173. doi:10.1016/j.cattod.2014.01.042
Riddle, Floyd L., and Fowkes, Frederick M. (1990). Spectral shifts in acid-base chemistry. 1. van der Waals contributions to acceptor numbers. J. Am. Chem. Soc. 112 (9), 3259–3264. doi:10.1021/ja00165a001
Rimola, A., Costa, D., Sodupe, M., Lambert, J.-F., and Ugliengo, P. (2013). Silica surface features and their role in the adsorption of biomolecules: Computational modeling and experiments. Chem. Rev. 113 (6), 4216–4313. doi:10.1021/cr3003054
Rückriem, M., Enke, D., and Hahn, T. (2015). Inverse gas chromatography (IGC) as a tool for an energetic characterisation of porous materials. Microporous Mesoporous Mater. 209 (23), 99–104. doi:10.1016/j.micromeso.2014.08.053
Rückriem, M., Inayat, A., Enke, D., Gläser, R., Einicke, W. D., and Rockmann, R. (2010). Inverse gas chromatography for determining the dispersive surface energy of porous silica. Colloids Surfaces A Physicochem. Eng. Aspects 357 (1-3), 21–26. doi:10.1016/j.colsurfa.2009.12.001
Ruthven, Douglas M., and Kaul, Bal K. (1998). Compensation theory of adsorption: Correlation and prediction of henry constants for linear paraffins on zeolite adsorbents. Adsorption 4 (34), 269–273. doi:10.1023/A:1008885717229
Saint Flour, Carol, and Papirer, Eugene (1982). Gas-solid chromatography: Method of measuring surface free energy characteristics of short fibers. 2. Through retention volumes measured near zero surface coverage. Industrial Eng. Chem. Prod. Res. Dev. 21 (4), 666–669. doi:10.1021/i300008a031
Schrader, Malcolm E., and Loeb, George I. (1992). in Modern approaches to wettability. Theory and applications (New York, NY,USA: Springer Science+Business Media LLC)
Schultz, J., Lavielle, L., and Martin, C. (1987). The role of the interface in carbon fibre-epoxy composites. J. Adhesion 23 (1), 45–60. doi:10.1080/00218468708080469
Shi, B., Zhang, Q., Jia, L., Liu, Y., and Li, B. (2007). Surface Lewis acid-base properties of polymers measured by inverse gas chromatography. J. Chromatogr. A 1149 (2), 390–393. doi:10.1016/j.chroma.2007.03.127
Sreekanth, T. V. M., Basivi, Praveen Kumar, Nagajyothi, P. C., Dillip, G. R., Shim, J., Ko, T. J., et al. (2018). Determination of surface properties and Gutmann's Lewis acidity-basicity parameters of thiourea and melamine polymerized graphitic carbon nitride sheets by inverse gas chromatography. J. Chromatogr. A 1580, 134–141. doi:10.1016/j.chroma.2018.10.042
Starikov, E. B., and Nordén, B. (2007). Enthalpy-entropy compensation: A phantom or something useful? J. Phys. Chem. B 111 (51), 14431–14435. doi:10.1021/jp075784i
Suárez, M. P., Palermo, A., and Aldao, C. M. (1994). The compensation effect revisited. J. Therm. Analysis 41 (4), 807–816. doi:10.1007/bf02547160
Surana, R., Randall, L., Pyne, A., Vemuri, N. M., and Suryanarayanan, R. (2003). Determination of glass transition temperature and in situ study of the plasticizing effect of water by inverse gas chromatography. Pharm. Res. 20 (10), 1647–1654. doi:10.1023/A:1026199604374
Thielmann, F., and Baumgarten, E. (2000). Characterization of microporous aluminas by inverse gas chromatography. J. Colloid Interface Sci. 229 (2), 418–422. doi:10.1006/jcis.2000.6958
Tisserand, C., Calvet, R., Patry, S., Galet, L., and Dodds, J. A. (2009). Comparison of two techniques for the surface analysis of alumina (Al2O3): Inverse gas chromatography at finite concentration (IGC-FC) and dynamic vapor sorption (DVS). Powder Technol. 190 (1-2), 53–58. doi:10.1016/j.powtec.2008.04.058
Tümsek, Fatma, and İnel, Oǧuz (2003). Evaluation of the thermodynamic parameters for the adsorption of some n-alkanes on A type zeolite crystals by inverse gas chromatography. Chem. Eng. J. 94 (1), 57–66. doi:10.1016/s1385-8947(03)00046-9
Van Oss, C. J., Good, R. J., and Chaudhury, M. K. (1988). Additive and nonadditive surface tension components and the interpretation of contact angles. Langmuir 4 (4), 884–891. doi:10.1021/la00082a018
Voelkel, Adam, Grajek, Henryk, Strzemiecka, Beata, and Adamska, Katarzyna (2015). “New essential events in modern applications of inverse gas chromatography,” in Veronica Pino/Jared L. Anderson/Alain Berthod et al. Analytical separation science. Editor (Weinheim, Germany: Wiley-VCH Verlag GmbH & Co. KGaA), 979–998.
Voelkel, Adam (1991). Inverse gas chromatography: Characterization of polymers, fibers, modified silicas, and surfactants. Crit. Rev. Anal. Chem. 22 (5), 411–439. doi:10.1080/10408349108051641
Voelkel, Adam (2012). “Physicochemical measurements (inverse gas chromatography),” in Gas chromatography (Elsevier), 477–494.
Voelkel, A., Strzemiecka, B., Adamska, K., and Milczewska, K. (2009). Inverse gas chromatography as a source of physiochemical data. J. Chromatogr. A 1216 (10), 1551–1566. doi:10.1016/j.chroma.2008.10.096
Wiener, H. (1947). Structural determination of paraffin boiling points. J. Am. Chem. Soc. 69 (1), 17–20. doi:10.1021/ja01193a005
Williams, Daryl R. (2015). Particle engineering in pharmaceutical solids processing: Surface energy considerations. Curr. Pharm. Des. 21 (19), 2677–2694. doi:10.2174/1381612821666150416100319
Yelon, A., Sacher, E., and Linert, W. (2012). Comment on “The mathematical origins of the kinetic compensation effect” Parts 1 and 2 by P. J. Barrie, Phys. Chem. Chem. Phys. 14, (22), 8232–8234.doi:10.1039/C2CP40618G
Keywords: inverse gas chromatography, porous silica, surface energy, polar surface groups, acid–base properties, enthalpy–entropy compensation, isokinetic temperature, hydrogen bonds
Citation: Meyer R, Mueller K, Naumov S, Bauer F and Enke D (2023) Characterization of polar surface groups on siliceous materials by inverse gas chromatography and the enthalpy–entropy compensation effect. Front. Chem. 11:1084046. doi: 10.3389/fchem.2023.1084046
Received: 29 October 2022; Accepted: 17 March 2023;
Published: 30 March 2023.
Edited by:
Adam Voelkel, Poznań University of Technology, PolandReviewed by:
Sergey V. Bondarchuk, Bohdan Khmelnytsky National University of Cherkasy, UkraineSteven Abbott, TCNF, United Kingdom
Copyright © 2023 Meyer, Mueller, Naumov, Bauer and Enke. This is an open-access article distributed under the terms of the Creative Commons Attribution License (CC BY). The use, distribution or reproduction in other forums is permitted, provided the original author(s) and the copyright owner(s) are credited and that the original publication in this journal is cited, in accordance with accepted academic practice. No use, distribution or reproduction is permitted which does not comply with these terms.
*Correspondence: Ralf Meyer, cmFsZi5tZXllckB1bmktbGVpcHppZy5kZQ==; Dirk Enke, ZGlyay5lbmtlQHVuaS1sZWlwemlnLmRl