
94% of researchers rate our articles as excellent or good
Learn more about the work of our research integrity team to safeguard the quality of each article we publish.
Find out more
ORIGINAL RESEARCH article
Front. Chem., 27 September 2022
Sec. Nanoscience
Volume 10 - 2022 | https://doi.org/10.3389/fchem.2022.991922
This article is part of the Research TopicNanostructured Functional Materials for Smart Window, Anti-corrosionfouling and Electronic PackagingView all 5 articles
 Qingwen Liang1,2†Ping Tang1†Jing Zhou1Jinghe Bai1
 Dan Tian3
 Xiaofei Zhu1*Defeng Zhou1*
 Ning Wang2,4*Wenfu Yan5
Solid state electrolytes have been intensively studied in the solid oxide fuel cells (SOFCs). The aim of this work is to investigate the effects of MgO and Fe2O3 dual sintering aids on the microstructure and electrochemical properties of solid state Gd0.2Ce0.8O2-δ (GDC) electrolytes, which are prepared by a sol-gel method with MgO and Fe2O3 addition to the GDC system. It is found that the addition of MgO and Fe2O3 can reduce the sintering temperature, increase densification and decrease the grain boundary resistance of the electrolyte. The 2 mol% MgO and 2 mol% Fe2O3 co-doped GDC (GDC-MF) exhibits the highest grain boundary conductivity. At 400°C, the grain boundary conductivity and total conductivity of GDC-MF are 15.89 times and 5.56 times higher than those of GDC. The oxygen reduction reaction (ORR) rate at the electrolyte/cathode interface of GDC-MF is 47 % higher than that of GDC. Furthermore, the peak power density of a single cell supported by GDC-MF is 0.45 W cm−2 at 700°C, 36.7% higher than that of GDC. Therefore, the GDC-MF should be a promising electrolyte material for intermediate-temperature solid oxide fuel cells (IT-SOFCs).
As the critical components of solid oxide fuel cells (SOFCs), solid electrolytes have the advantages of high ionic conductivity, high density, and high chemical compatibility (Santos et al., 2018; Spiridigliozzi et al., 2019; Singh et al., 2021). Electrolytes usually require high sintering temperatures (≥1400°C) to obtain sufficiently high densities and electrical conductivities (Wang et al., 2019). However, the high sintering temperature will lead to a series of challenges, e.g., high manufacturing cost, fast aging rate of the cell, and the poor compatibility of the components. Therefore, it is of great significance to develop new solid electrolytes with high ionic conductivity in the intermediate-temperature (500–700°C) range.
CeO2-based solid electrolytes were the widely investigated IT-SOFCs electrolytes because of the high ionic conductivity at low/medium temperature and excellent compatibility with the commonly used electrode materials (Coduri et al., 2018; Zhang et al., 2021). A small amount of low melting point additives were often added to CeO2-based solid electrolyte as sintering aids during the process of sintering, e.g., Fe2O3 (Xu et al., 2011; Zheng et al., 2011; Mehranjani et al., 2017), MgO(Cho et al., 2007; Li et al., 2008; Bi et al., 2017), ZnO (Nicollet et al., 2017), and Bi2O3 (Accardo et al., 2018) etc. This method can significantly reduce the sintering temperature and improve the density of the electrolyte. Fe2O3 and MgO have been reported to be the excellent sintering aids for improving the ionic conductivity and relative density of Gd0.2Ce0.8O2-δ (GDC) electrolyte (Zheng et al., 2011; Bi et al., 2017; Shajahan et al., 2020). Zheng et al. added 0.25 mol% Fe2O3 to Ce0.8Sm0.2O1.9 electrolyte and obtained the improved densification and excellent total conductivity (σt) (Zheng et al., 2011). Similarly, Mehranjani et al. reported that with 2 mol% Fe2O3 as sintering aids, yttria-stabilized zirconia (YSZ) and GDC bilayer electrolytes could exhibit the reduced sintering temperature from 1450 to 1300°C and the improved densification (Mehranjani et al., 2017). Moreover, the liquid-phase sintering mechanism of Fe2O3 gave rise to the good continuity and permeability at the GDC grain boundary, which effectively promoted the migration of oxygen ions (Zhang et al., 2004a). In addition, MgO is another effective sintering aid, which can simultaneously improve the density and conductivity of the electrolyte. For instance, adding 1.0 mol% MgO to GDC electrolyte as sintering aids could reach the relative densities of 95% after sintering at 1200°C for 10 h (Bi et al., 2017). Molten MgO can promote GDC grain growth and the degree of densification of the sample. Moreover, the difference of the ionic radii between Mg2+ (0.89 Å) and Ce4+ (0.97 Å) will arouse the lattice distortion, which helps grain boundary movement and grain growth during the sintering process. Additionally, the solid solubility of Mg2+ in the CeO2 lattice was as low as ∼1 mol% (Cho et al., 2007), when the amount of Mg2+ exceeds the solubility, the redundant MgO will populate at the grain boundaries. Therefore, the addition of MgO can optimize the structure of the space charge layer and remove the silicon phase at the grain boundaries, improving the overall ionic conductivity (Li et al., 2008).
In recent years, intense research has been focused on the double-sintering aids strategy on ceria-based electrolytes (Jia et al., 2015; Chen et al., 2020; Babar et al., 2022). For example, the Nd0.2Ce0.8O2-δ (NDC) solid electrolyte with CoO-Bi2O3 (molar ratio of 1:1) dual sintering aids achieved the density of 95.3 % after sintered at 1100°C for 10 h (Chen et al., 2020). At 800°C, the σt was 5.765 × 10⁻² S cm−1, which was higher than that of the NDC electrolytes added with single sintering aids CoO (3.802 × 10⁻² S cm−1) or Bi2O3 (4.649 × 10⁻² S cm−1). Similarly, the electrochemical property and sintering behavior of the Ce0.8Y0.2-xCuxO2-δ electrolytes were improved by adjusting the Y/Cu ratio (Jia et al., 2015). Ce0.8Y0.2-xCuxO2-δ electrolyte sintered at 1300°C for 4 h could achieve a high relative density of 95%. It can be seen that selecting a suitable sintering aid is an important approach to improve the conductivity of the ceria-based electrolyte. Compared with single sintering aids, adding dual sintering aids is also an effective strategy to improve material densification. The addition of MgO or Fe2O3 can form liquid phase sintering and promote electrolyte densification at low temperatures.
Usually the doping amount of the sintering aid is less than 5 mol% (Zhang et al., 2017; Han et al., 2018). With this in mind, in this paper, the addition of 4 mol% MgO-Fe2O3 dual sintering aids were proposed to promote the electrochemical performance of Gd0.2Ce0.8O2-δ solid state electrolyte in the IT-SOFCs.
The chemicals in this paper including Ce(NO3)3·6H2O (99.99%), Gd(NO3)3·6H2O (99.99%), Mg(NO3)2·6H2O (99%), Fe(NO3)3·9H2O (99%), La(NO3)3·6H2O (99.9%), Sr(NO3)2 (99%), Fe(NO3)3·9H2O (99.99%), Co(NO3)2·6H2O (99.99%), glycine (99%), NiO (99.9%), Polyethylene glycol (PEG 2000) and solid citric acid (C6H8O7·H2O, 99.5%), were purchased from Aladdin. Those chemicals were used as received without further purification.
GDC and GDC-based electrolyte powders with MgO and Fe2O3 sintering aids were prepared by sol-gel method. According to the stoichiometric ratio, Ce(NO3)3·6H2O, Gd(NO3)3·6H2O, Mg(NO3)2·6H2O and Fe(NO3)3·9H2O were accurately weighed and dissolved in distilled water, orderly. Polyethylene glycol and solid citric acid weighed 1.5 times of metal ions were added to the solution under continuous stirring at the room temperature to obtain the precursor solution of GDC. Then, the solution was dehydrated at 75°C to obtain a dry gel, and calcined in a muffle furnace at a heating rate of 5°C min−1 to 650 °C for 6 h to obtain GDC and GDC-based electrolyte powders with different proportions of MgO and Fe2O3 sintering aids. Subsequently, after all powder samples were thoroughly ground in an agate mortar, the GDC samples with 4 mol% MgO, 4 mol% Fe2O3, 2 mol% MgO+2 mol% Fe2O3 added were labeled as GDC-M, GDC-F and GDC-MF, respectively. In order to obtain samples with similar thickness, ∼0.5 g of different electrolyte powders were weighed and pressed into discs with a diameter of 13 mm and a thickness of 1.2 mm under the pressure 10 MPa. Then, all pressed samples were sintered in a muffle furnace at 1200°C for 10 h at a heating rate of 5°C min−1 to obtain dense electrolyte sheets. Finally, both sides of the electrolyte sheets were coated with silver paste and heated at 700°C for 30 min for electrochemical performance test after polishing and ultrasonic cleaning.
La0.6Sr0.4Co0.8Fe0.2O3-δ (LSCF) cathode powder was prepared by glycine-nitrate method (Bai et al., 2020). According to the stoichiometric ratio, La(NO3)3·6H2O, Sr(NO3)2, Fe(NO3)3·9H2O and Co(NO3)2·6H2O were accurately weighed and dissolved in distilled water, orderly. Glycine was added to the solution at the ratio of 1.5 times higher than the
The GDC and GDC-MF electrolyte powders were mixed with LSCF cathode and NiO anode (mass fraction ratio of 50:50) in ethanol, respectively, and then calcined in air at 950°C for 15 h to evaluate the SOFC performance and compatibility with the electrolyte.
The symmetrical cells and single-cells were prepared to investigate the electrochemical behavior of fuel cells. The electrode powders were homogeneously mixed with 3 wt% terpineol/ethylene cellulose and fully ground in an agate mortar for 30 min to produce the cathode slurry. The LSCF cathode slurry was symmetrically coated on both sides of the GDC-MF and GDC pellets using screen printing technique. The effective area and thickness of the cathode were controlled to be ∼0.25 cm2 and ∼20 μm, respectively, and calcined at 950 °C for 2 h. The Ag slurry was applied to the grid structure on both sides of the cell as the current collector, and then dried at 100°C for 2 h to obtain a symmetrical cell.
Both sides of the GDC and GDC-MF electrolyte sheets were polished to a thickness of ∼300 μm and placed in ethanol for ultrasonic cleaning. The NiO-GDC (percentage ratio of 6:4) anode were prepared by ball milling, and 6 wt% terpineol/ethylene cellulose was added to form the anode slurry. The anode slurry was screen-printed on one side of the GDC-MF and GDC pellets and calcined at 1250°C for 4 h. The cathode ink was coated on the other side of the electrolyte pellets and calcined at 950°C for 2 h. The effective area and thickness of the electrode were controlled to be consistent with the symmetric cells. The anode of the fuel cell was attached and sealed to one end of the quartz tube by using silver paste.
The X-ray diffractometer (XRD, Rigaku D/MAX-2000/PC, Japan) equipped with Cu Kα1 radiation (λ = 0.15406 nm, 40 kV and 40 mA; scanning rate: 4° min−1) was used to characterize the crystal structure and compatibility of the sintered samples. The Raman spectrometer (Jobin-Yvon Horiba Scientific) with 532 nm excitation wavelength was carried out to analyze oxygen vacancy concentration of powders from 100 cm−1 to 1000 cm−1. Surface chemistry analysis of the GDC-based electrolyte powders were identified by X-ray Photoelectron Spectroscopy (XPS). The microstructure of electrolyte sheets was determined by field emission scanning electron microscopy (FE-SEM, SUPPA 40, ZEISS, Germany). The thermal expansion coefficient (TEC) of the sintered samples was characterized by thermal expansion analyzer (Netzsch DIL 402C) in the range of 50–850°C (heating rate: 3°C min−1; standard sample: Al2O3). The relative densities of all sintered samples were tested by the Archimedes method and calculated by Eq. 1:
where ρA is the actual density measured using Archimedes’ principle, ρT is the theoretical density of the sintered sample obtained from X-ray diffraction data using Jade software, and ρrel is the relative density of the sintered sample.
The grain size of the sintered samples was calculated according to the following Debye Scherrer formula (Eq. 2):
where dXRD、K、λ、θ and β are the crystalline size, Scherrer constant (0.89), X-ray wavelength (0.154,056 nm), Bragg diffraction angle and diffraction peak half-width, respectively.
The Electrochemical Impedance Spectroscopy (EIS) was carried out on a Solartron 1260–1287 workstation under the following conditions: open-circuit voltage (OCV), AC perturbation voltage of 10 mV, frequency range of 100 KHz-0.1 Hz, temperature range of 300–800°C and temperature interval of 50°C. The EIS data was analyzed and fitted by Ziew software. The conductivity of the samples was calculated according to the following Eq. 3:
in which D, S and σ correspond to the thickness, surface area and conductivity of the sample respectively.
In order to determine the effect of the addition of MgO and Fe2O3 on the structure of GDC electrolyte, the XRD spectra of all samples are shown in Figure 1, and the unit cell parameters of the samples are listed in Table 1. As can be seen from Figure 1A, the diffraction peaks of all samples correspond to the characteristic peaks of the cubic fluorite structure (JCPDS #46–0507) of GDC, and no additional impurity peaks were observed. To further clarify the effect of MgO and Fe2O3 addition on GDC structure, the diffraction peak (111) of the sample was amplified (2θ = 27.0–30.0°) and shown in Figure 1B. Combined with Figure 1B and Table 1, it can be seen that the diffraction peak (111) of GDC and GDC-M samples have almost no deviation. Moreover, the unit cell parameters of GDC and GDC-M were also almost unchanged, this could be discussed from the following two aspects. On the one hand, Mg2+ entering the GDC lattice would lead to a decrease in unit cell parameters due to the radius of Mg2+ (0.89 Å) is smaller than that of Ce4+ (0.97 Å); On the other hand, it is extremely low of the solid solubility of MgO (∼1 mol%) in GDC. When the solid solubility is exceeded, the remaining MgO will remain at the grain boundaries, which increases the unit cell parameters. In addition, compared with the diffraction peak (111) of GDC, the diffraction peak of GDC-F was slightly shifted toward the high diffraction angles, indicating that the addition of Fe2O3 could reduce the cell volume of GDC (Table 1). This result could be attributed to the solid solubility of Fe2O3 in GDC more than 4 mol% (Zheng et al., 2011; Abbas et al., 2015). Therefore, Fe3+ (0.78 Å) with smaller radius could easily enter the GDC lattice to replace Ce4+ (0.97 Å) ions, resulting in the shrinkage of the unit cell volume. It is worth noting that the diffraction peak of GDC-MF (111) was shifted to the high diffraction angles less than that of GDC-F (Figure 1B), and the unit cell parameters was also similar to GDC-M sample. This is mainly attributed to the co-addition of 2 mol% Fe2O3 and 2 mol% MgO which increases the lattice parameters of the GDC samples as a result of phase equilibrium.
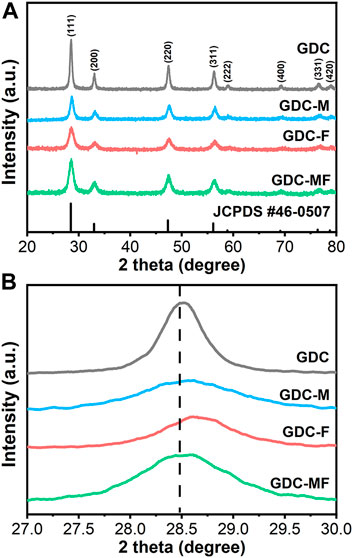
FIGURE 1. (A) X-ray diffraction (XRD) patterns and (B) Zoom-in XRD patterns in a 2θ range of 27.00–30.00° of GDC-based electrolytes.
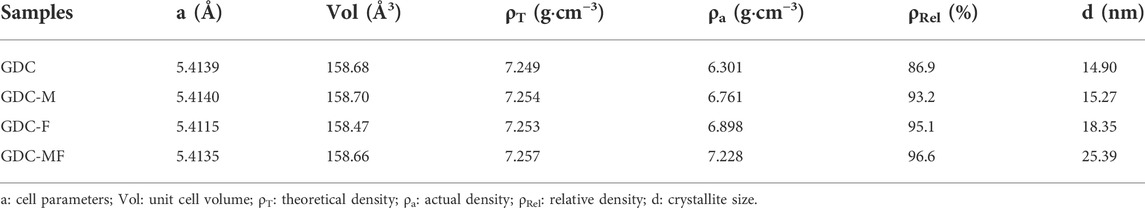
TABLE 1. Relevant parameters of GDC-based electrolytes sintered at 1200°C for 10 h.
The effect of MgO and Fe2O3 additions on the GDC structure and new defect sites were tested by the Raman spectrometer at room temperature, as shown in Figure 2A. From the Raman spectrum, all samples had a weak absorption band at 245 cm−1, which could be attributed to a double degenerate transverse optical mode (Li et al., 2009). In addition, the Raman peak around 465 cm−1 was associated with the F2g vibrational mode of the cubic lattice, indicating that the CeO2-based electrolytes still maintain the perfect cubic fluorite structure (Nakajima et al., 1994; Li et al., 2020; Song et al., 2021), which was consistent with the XRD results. Moreover, the positions of the vibrational peaks around 465 cm−1 for GDC-M and GDC samples were consistent, basically. However, for GDC-F and GDC-MF samples, the vibrational peaks around 465 cm−1 were slightly shifted toward higher frequencies and slightly broadened, which may be related to the formation of solid solutions (Accardo et al., 2021). The shift of the vibrational peak suggests that the addition of Fe2O3 to CeO2 might form a solid solution and this difference might be related to the low solubility of MgO in GDC (∼1 mol%). In addition, the defects caused by doping could also interfere with the signal at ∼465 cm−1 (Sartoretti et al., 2019), suggesting that there might be dopant ions entering the CeO2 lattice to replace Ce4+ to generate oxygen vacancies.
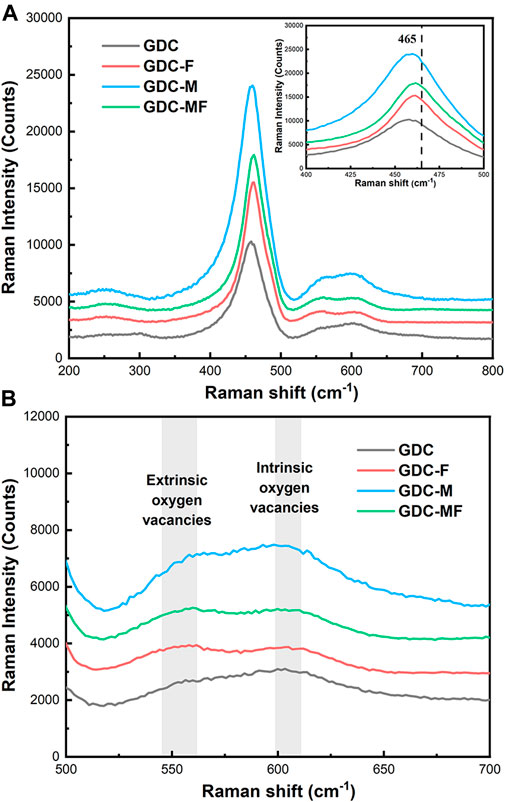
FIGURE 2. (A) Raman spectra of all samples, inset is the magnified F2g band and (B) Oxygen vacancy pattern.
The locally enlarged Raman spectra was shown in Figure 2B. Characteristic absorption peaks associated with the vibration of oxygen vacancies in the defect space were observed at ∼550 and ∼600 cm−1 (Anjaneya et al., 2014; Song et al., 2021). Among them, the signal at ∼550 cm−1 was attributed to the vibration of oxygen vacancies in the defect space generated by the introduction of low-valent cations into the CeO2 lattice (Guo and Waser, 2006). With the addition of sintering aids MgO and Fe2O3, the signal intensities of GDC-F, GDC-M and GDC-MF were stronger than that of GDC at 550 cm−1 (Figure 2B). This was because the small amount of Mg2+ or Fe3+ enters the CeO2 lattice to replace Ce4+ to generate oxygen vacancies, resulting in the enhanced signal intensity at 550 cm−1. The corresponding defect equations are shown in Eqs 4, 5:
Since the signal at 550 cm−1 was related to the oxygen vacancy, the area ratio of this peak to the peak of 464 cm−1, i.e., A550/A464, could estimate the oxygen vacancy concentration (Pu et al., 2007). Compared to the GDC (0.0279) sample, the oxygen vacancy concentrations of GDC-F (0.0649), GDC-M (0.0367) and GDC-MF (0.0584) were all increased. This result confirms that the Ce4+ of GDC lattice were replaced by Mg2+ or Fe2+ to generate
In order to further verify the effect of MgO and Fe2O3 addition on the oxygen vacancies of GDC, X-ray photoelectron spectroscopy (XPS) was carried out to characterize the chemical environment of the powder surfaces. The fitted XPS spectra of the O 1s orbitals of the GDC and GDC-MF samples were shown in Figure 3. It can be seen that the O 1s spectrum was consisted of three typical peaks located at ∼527.6, ∼530.0 and ∼531.1 eV, representing lattice oxygen (Olattice), surface oxygen (Osurface) (e.g. OH−, O2-, O− and carbonate) and moist oxygen, respectively (Zhang et al., 2019). A slight increase in the Osurface/Olattice ratio could be observed, meaning that Olattice was decreased and Olattice vacancy was increased (Bai et al., 2020). According to the fitted peak areas, it can be concluded that the corresponding Osurface contents of the GDC and GDC-MF were 23.9 and 25.0%, and the Osurface contents were 76.1 and 75.0%, respectively. For the GDC-MF electrolyte, the increase of Osurface content was only 1.1%, which was similar to the variation trend estimated by Raman. The reason for its slight increase may be that only small amounts of Mg2+ and Fe3+ enter the CeO2 lattice and Fe2O3 may connect with some of the oxygen vacancies [
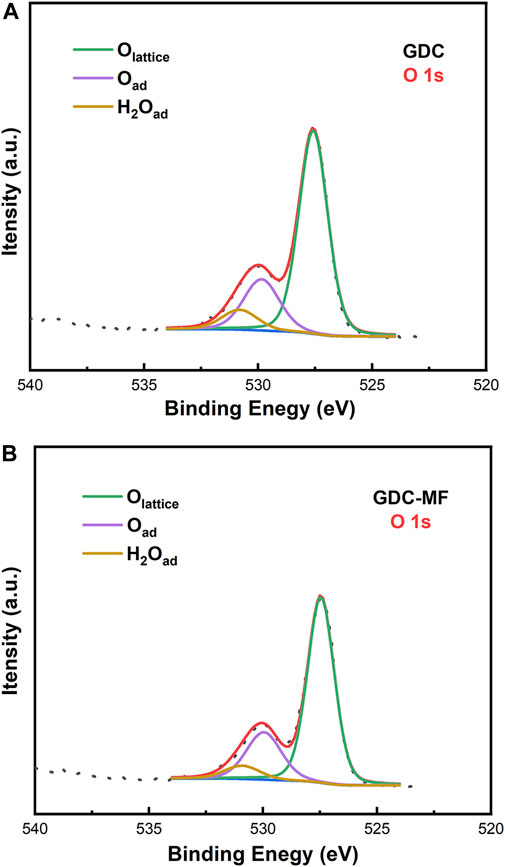
FIGURE 3. XPS spectra of O 1s for (A) GDC and (B) GDC-MF samples.
All samples sintered at 1200°C for 10 h were characterized by field emission scanning electron microscopy (FE-SEM). The results of the microscopic morphology of the samples were shown in Figure 4. There were many holes and relatively poor density (86.9%) in the GDC (Figure 4A) samples. The grain sizes of the GDC-M (Figure 4B), GDC-F (Figure 4C) and GDC-MF (Figure 4D) samples were larger than those of GDC (Table 1), indicating that MgO or Fe2O3 could promote the growth of grains and improve the density of the samples. For the GDC-M samples, the grain size and relative density were larger than those of GDC (Table 1). It is due to the large difference between the ionic radii of Mg2+ (0.89 Å) and Ce4+ (0.97 Å). During the sintering process, the lattice distortion promoted the movement of grain boundaries, which accelerated the growth of grains and increased the density of the samples. Compared with the GDC-M, the GDC-F had more obvious grain growth and higher relative density (95.1%). On the one hand, this due to the mismatch of the radii of Fe3+ (0.78 Å) and Ce4+ (0.97Å). On the other hand, it was mainly attributed to the low melting point of Fe2O3 and the presence of partially melted Fe2O3 on the grain surface as the sintering temperature increase. Therefore, the surface tension and friction of the grains would be changed, and the rearrangement of the grains would be promoted to make the electrolyte more densified, i.e., the viscous flow mechanism was occurred (Zhang et al., 2004b). The GDC-MF sample had the largest grain size and the highest densities (96.6%), which was produced by the combined action of two sintering aids. Firstly, the densification of the electrolyte was facilitated by the viscous flow mechanism of Fe2O3. Secondly, due to the difference in the ionic radius of Mg2+/Fe3+ and Ce4+, the GDC lattice distortion and defects were produced, which accelerated the migration of grain boundaries, promoted grain growth, reduced the porosity between grains, and increased the relative density of the electrolyte. Therefore, the co-action of the Fe2O3 viscous flow mechanism and the radius effect of Mg2+/Fe3+ and Ce4+ were important factors to improve the sintering performance of the GDC-MF electrolyte.
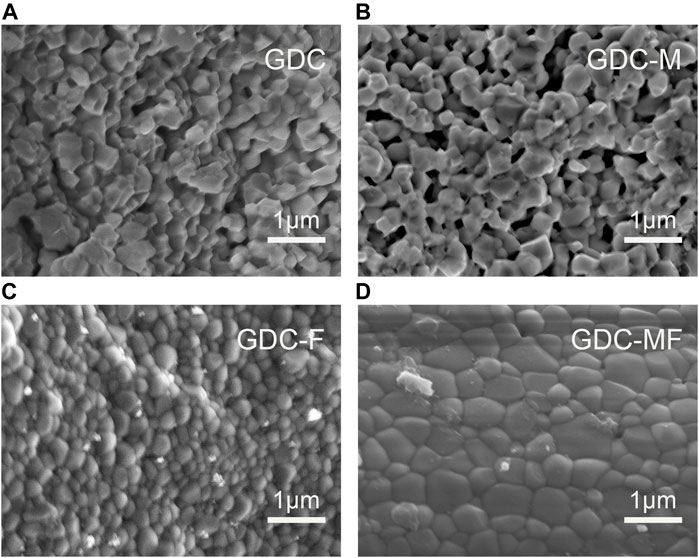
FIGURE 4. Cross-sectional FE-SEM image of (A) GDC, (B) GDC-M, (C) GDC-F and (D) GDC-MF electrolytes sintered at 1200°C for 10 h.
EIS was used to evaluate the electrocatalytic performance of GDC-based electrolytes that were sintered at 1200°C. Figure 5 exhibits the Nyquist spectra and equivalent circuit diagrams of the GDC-based electrolyte measured at 350 and 800°C, where the CPE and Rel represent the constant phasor element and polarization resistance, respectively. As shown in Figure 5A, at 350°C, the impedance spectrum was consisted of a semicircle and a small ray arc. The plots could be divided into high and low frequency arcs, and the intersection of the high frequency arc and the low frequency arc with the real axis (Z′) were the grain resistance (Rgi) and the total resistance (Rt). The difference between the Rt and the Rgi was the grain boundary resistance (Rgb). As the temperature increased to 800°C (Figure 5B), the impedance spectrum was changed to a ray arc with a tail, and the Rgb was disappeared, where Rt = Rgi. The associated resistance data were listed in Table 2. Combining Figure 5A and Table 2, it can be seen that the Rgi, Rgb and Rt of the GDC-M, GDC-F and GDC-MF were lower than that of GDC electrolyte (RGDC-MF < RGDC-F < RGDC-M < RGDC). At 350°C, the Rgb (3.14 Ω) and Rgi (70.03 Ω) of the GDC-MF were only 4.85 and 22.11% of the GDC electrolyte, indicating that the co-addition of MgO and Fe2O3 could effectively reduce the Rgb and Rgi. Comparing the Rgi/Rt of the GDC-M, GDC-F and GDC-MF, it can be seen that the ratio of Rgb to Rt of the GDC-MF (0.04) was significantly lower than that of GDC-M (0.15) and GDC-F (0.06). This indicated that the addition of Fe2O3-MgO dual sintering aids in GDC electrolyte was exhibited a more significant effect on reducing the Rgb. This was attributed to the liquid phase sintering mechanism of Fe2O3 (Wang et al., 2017), which increased the effective densification of the sample and reduced the Rgi and Rgb, thereby reducing the overall resistance. In addition, the radius effect of Mg2+ and Fe3+ was also an important factor to improve the sintering performance and electrical conductivity of GDC-MF.
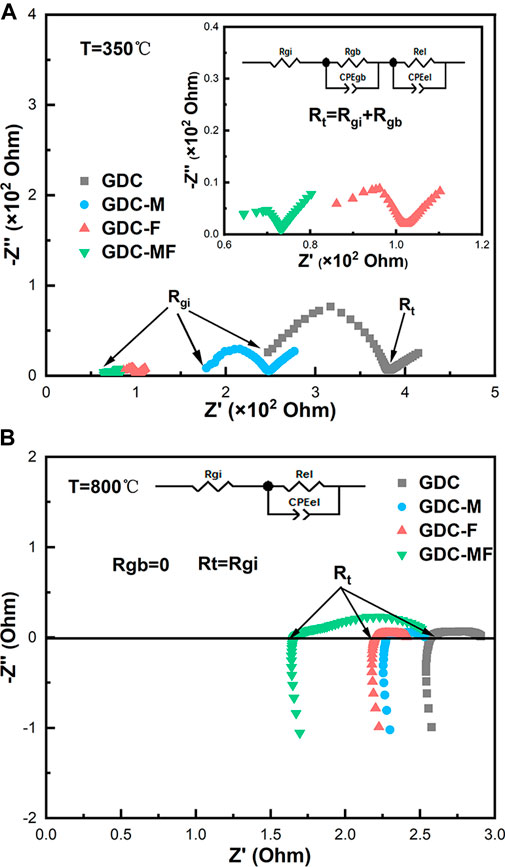
FIGURE 5. EIS analysis of GDC-based electrolytes and Equivalent circuit diagrams at (A) 350 and (B) 800°C.
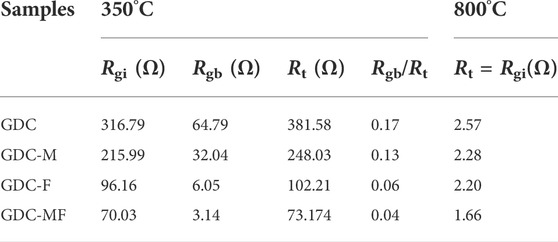
TABLE 2. Resistance of GDC-based electrolytes at 350 and 800°C.
Figures 6A–C was the Arrhenius curve of the grain boundary conductivity (σgb), grain conductivity (σgi), and total conductivity (σt) of GDC-base electrolytes. It can be seen from Figure 6 that in the temperature range of 300–800°C, the conductivity of the GDC electrolyte was always the lowest. Compared with the GDC electrolyte, the σgi and σgb of the GDC-M, GDC-F and GDC-MF were improved significantly, and the GDC-MF had the maximum σgi, σgb and σt. At 400°C, the σgi and σgb of the GDC-MF were 3.56 × 10⁻³ S cm−1 and 2.40 × 10⁻¹ S cm−1, which were 5.42 and 15.89 times higher than the σgi (6.57 × 10⁻⁴ S cm−1) and σgb (1.51 × 10⁻² S cm−1) of the GDC. Additionally, the increase of σgb was more significant. At 800°C, the conductivity of the GDC-MF (6.97 × 10⁻² S cm−1) was much higher than the conductivity of 2.5 mol% CoO-Bi2O3 co-doped NDC (5.765 × 10⁻² S cm−1) (Chen et al., 2020) and the Ce0.8Gd0.2-XSrxO1.9-x/2 (x = 0.01) composite electrolyte (3.6 × 10⁻² S cm−1) (Kashyap et al., 2014). And the σt of GDC electrolyte with over 95% relative density calcined at 1400°C was 3.25 × 10⁻² S cm−1, which was only 46% of the GDC-MF electrolyte (Öksüzömer et al., 2013). Supplementary Table S1 summarize the total conductivity comparison of different electrolytes. In addition, the total conductivities of GDC and GDC-MF under different partial oxygen pressures were also explored (Supplementary Figure S1), as discussed in detail in Supplementary Material. The corresponding activation energy (Ea) was calculated according to the Arrhenius formula and expressed in Figure 6C. From the picture, the GDC-MF (Ea = 0.58 eV) was showed the lowest activation energy similar to the GDC-F (Ea = 0.57 eV), but lower than the GDC (Ea = 0.72 eV) and GDC-M (Ea = 0.68 eV). The reduction in activation energy was meant that high ionic conductivity could be achieved at reduced temperatures. In summary, the improvement of GDC based-electrolytes performance could be attributed to: (I) The liquid phase sintering mechanism of MgO/Fe2O3 promoted the movement of grain boundaries and improved the densification of the samples, thus reducing the grain/Rgb; (II) The molten Fe2O3 had good continuity and permeability at the GDC grain boundary, which could effectively promote the migration of oxygen ions; (III) The MgO remaining at the grain boundary could remove the SiO2 impurities (Bi et al., 2017), change the structure of the space charge layer (Zhang et al., 2004b), and improve the conductivity of the grain boundary; (IV) A small amount of Mg2+ or Fe2+ could enter the lattice to generate oxygen vacancies, provide oxygen ion transport channels and improve the σgi.
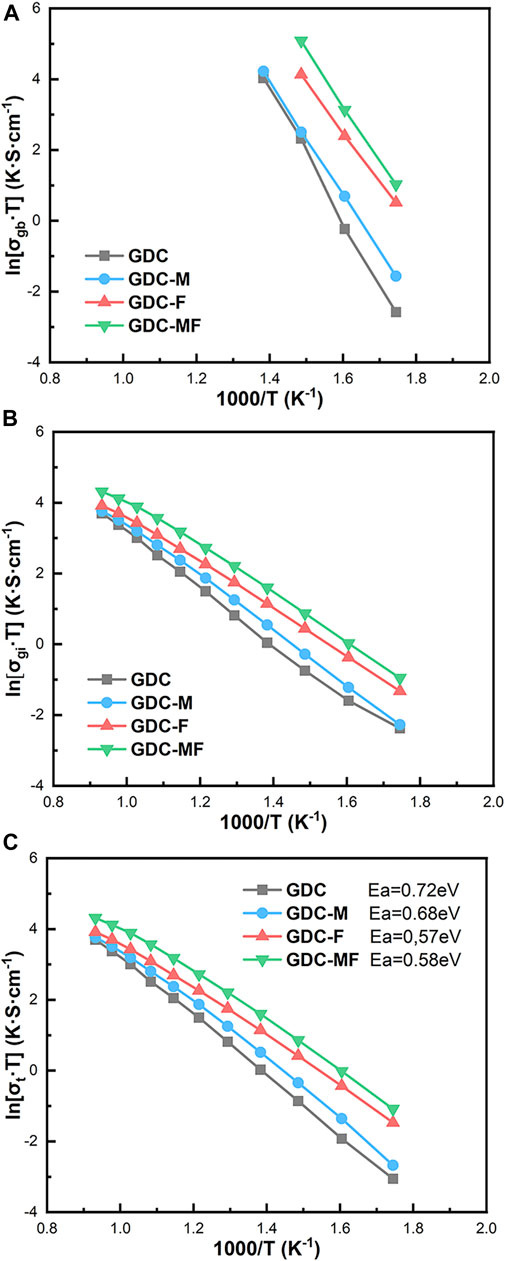
FIGURE 6. Arrhenius curves of (A) σgb, (B) σgi, and (C) σt of GDC-based electrolytes.
To illustrate the excellent performance of GDC-MF electrolyte, the possible mechanism for the improvement of conductive was proposed in Figure 7. The Fe2O3 and MgO sintering aids were represented by red and golden yellow skeleton, respectively. During the sintering process, the Fe2O3/MgO particles were gradually melted at the grain boundaries to form a liquid phase, which promoted the sintering process by diffusing and surrounding the GDC particles. After sintering, the cross-section of GDC-MF was analyzed by EDX mapping (Supplementary Figure S2), and it was found that the distribution of Ce, Gd and Fe elements contained in the sample was relatively uniform, indicating that Fe3+ easily entered the GDC lattice. In addition, line scan analysis (Supplementary Figure S3) showed that the content of Mg element in the grain boundaries was higher than that in the grains. This is due to the low solid solubility of MgO ∼1 mol%, and only a small amount of Mg2+ enters the CeO2 lattice (Cho et al., 2007). Other MgO might act as a grain boundary scavenger and interact with SiO2 to generate Mg2SiO4, reducing the grain boundary resistance, thereby increasing the grain boundary conductivity of GDC (Bi et al., 2017). However, there is no peak of Mg2SiO4 in XRD due to the relatively small amount. Therefore, the addition of Fe2O3/MgO dual sintering aids in GDC electrolyte proposed in this work was an effective strategy to obtain highly dense electrolyte materials.
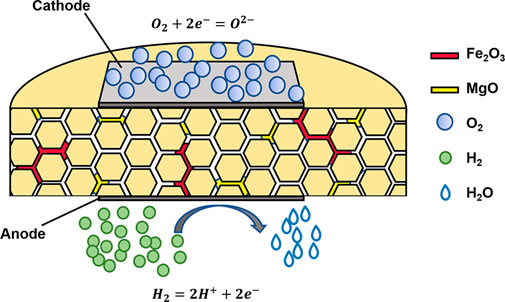
FIGURE 7. Schematic diagram of the full-cell model supported by GDC-MF electrolyte.
Previously, the GDC-MF composite electrolytes with high ionic conductivity and good densification have been demonstrated. In addition, the GDC-MF electrolytes should have good TEC, chemical compatibility, oxygen reduction reaction (ORR) activity and long-term stability (Zhang et al., 2004c; Zhu et al., 2017).
The thermal expansion behavior of GDC and GDC-MF electrolytes in the temperature range of 50–800°C was shown in Figure 8. The average TEC was calculated by fitting the dL/L0 data as the function of temperature. As shown in Figure 8, the thermal expansion curve of the electrolyte was increased with the increase of temperature, and the average TEC of GDC and GDC-MF was calculated to be 10.9 × 10⁻⁶ K−1 and 11.2 × 10⁻⁶ K−1, respectively. The GDC and GDC-MF electrolytes were exhibited similar TECs with LSCF (15.4 × 10⁻⁶ K−1) cathode (Tai et al., 1995) and NiO-based anode (16.9 × 10⁻⁶ K−1) (Chen et al., 2008) materials. The results indicate that the addition of Fe2O3-MgO dual sintering aids had no effect on the TEC of the GDC electrolyte. The GDC-MF and GDC electrolytes have good thermal matching with the electrodes, and each component will not break in the SOFC operating temperature range.
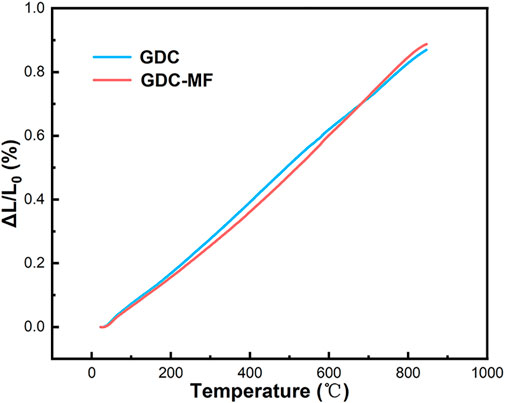
FIGURE 8. Thermal expansion curves of sintered samples versus temperature.
The chemical compatibility between the perovskite cathode material LSCF and NiO anode with the GDC and GDC-MF electrolyte was studied. The GDC and GDC-MF electrolyte powders were mixed with NiO anode powder and LSCF cathode powder at the weight ratio of 1:1, respectively, and calcined at 950°C for 15 h in air. The XRD patterns measured at room temperature were shown in Figures 9A,B. It can be seen that the main diffraction peaks could be assigned to the characteristic diffraction peaks of GDC, GDC-MF, NiO and LSCF, and no new diffraction peaks were generated. It was confirmed that the GDC-MF electrolyte exhibits good chemical compatibility with NiO and LSCF electrodes at the high temperature of 950°C.
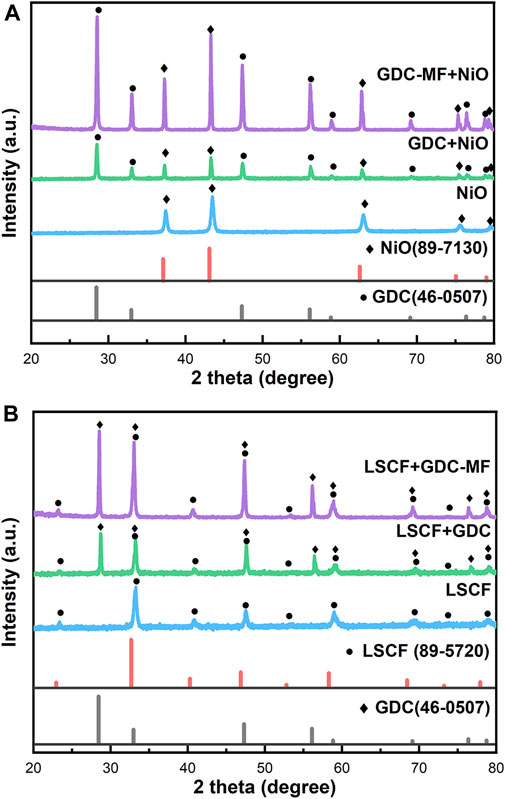
FIGURE 9. Chemical compatibility of the GDC-MF electrolyte with (A) LSCF cathode and (B) NiO anode material.
To evaluate the effect of the composite electrolyte on the ORR activity at the cathode/electrolyte interface, electrochemical impedance spectroscopy tests of symmetrical cells (LSCF/GDC/LSCF and LSCF/GDC-MF/LSCF) were performed in the temperature range of 650–800°C. As shown in Figure 10A, the ohmic area-specific resistance (ASRoh) corresponds to the real axis intercept in the high frequency region, and the total area-specific resistance (ASRt) corresponds to the real axis intercept in the low frequency region. The polarization area-specific resistance (ASRp) can be estimated according to the formula
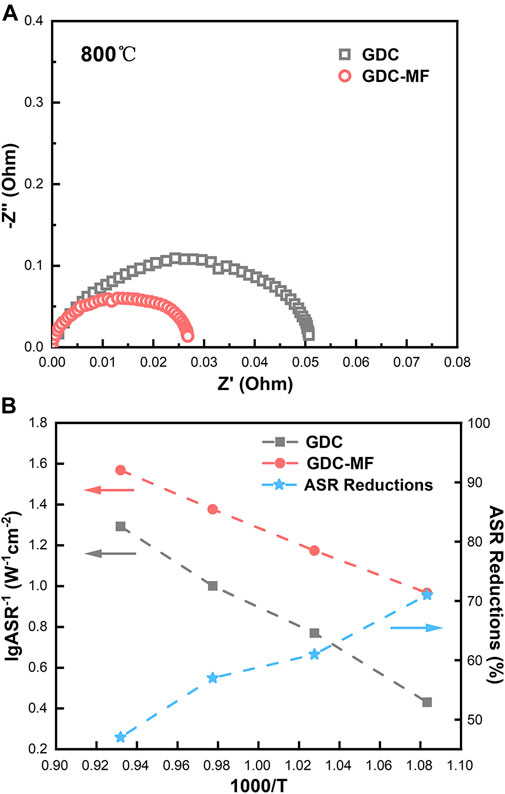
FIGURE 10. Electrochemical performance of symmetric cells: (A) Electrochemical impedance spectra at 800 °C. (B) ASR versus temperature curves of LSCF cathodes on GDC and LSCF cathodes on GDC-MF (left Y-axis), and percentage reduction of ASR of LSCF cathodes on GDC-MF relative to GDC (right Y-axis).
The ASRp value versus temperature is shown in Figure 10B. It can be seen that the ASRp of the symmetric cells assembled with GDC-MF electrolytes was significantly decreased in the temperature range of 650–800 °C compared to the GDC electrolyte. Furthermore, the ASRp value of LSCF in GDC-MF electrolytes was reduced by more than 47% compared to GDC (right y-axis). It is shown that adding Fe2O3-MgO dual sintering aids effectively reduced the ASRp between the GDC-based electrolyte and the LSCF cathode and increased the ORR rate. The enhanced ORR rate could be attributed to the improved density of the GDC electrolyte with the addition of Fe2O3 and MgO.
The electrolyte-supported single cells were assembled to evaluate the effect of Fe2O3 and MgO on the output performance of GDC-based SOFCs. NiO and LSCF powders were used as anode and cathode materials. The single cells supported with GDC and GDC-MF electrolytes were labelled as Cell-I and Cell-II, respectively. It was compared the current density-voltage (I-V) and current density-power density (I-P) curves of single cells Cell-I and Cell-II in the temperature range of 600–700°C, using wet H2 as the fuel and air as the oxidant (Figures 11A,B). The maximum OCV of Cell-I and Cell-II was 0.71 and 0.83 V, respectively. It can be seen that the maximum OCVs of the 2 cells were lower than the theoretical OCV of 1.04–1.1 V (Steele, 2000; Leah et al., 2005). This is mainly attributed to that part of Ce4+ in the electrolyte was reduced to Ce3+ at low oxygen partial pressure (under reducing atmosphere) and high temperature, resulting in a certain n-type electronic conductivity. Due to the existence of electrons, a short-circuit current is formed inside the electrolyte, The short-circuit current was formed inside the electrolytes due to the presence of electrons, so that its OCVs were less than the theoretical electromotive force (Zhou et al., 2022). In addition, the OCV of the single cells decreased slightly with increasing temperature, which was conformed to the trend predicted by the Nernst equation (Zhao et al., 2014). The peak power densities of Cell-I at 600°C, 650 and 700°C were 0.13, 0.21, and 0.33 W cm−2, and the peak power densities of Cell-II were 0.27, 0.37 and 0.45 W cm−2, respectively. Compared with Cell-Ⅰ, the peak power densities of cell-Ⅱ have been greatly improved. At 700°C, the peak power density of Cell-II was 36.4% higher than that of Cell-Ⅰ. The improved power density of Cell-II could be attributed to the enhanced electrolyte density, improved electrical conductivity, matching of TEC, and excellent ORR rate. As shown in Figure 11C, Cell-II was tested for long-term stability at 600°C and the current density of 0.3 A cm−2 for 70 h. It can be seen from the figure that the voltage and power density of the single cell did not change during the test time. These results confirm that the GDC-MF electrolyte is a promising electrolyte material for IT-SOFC.
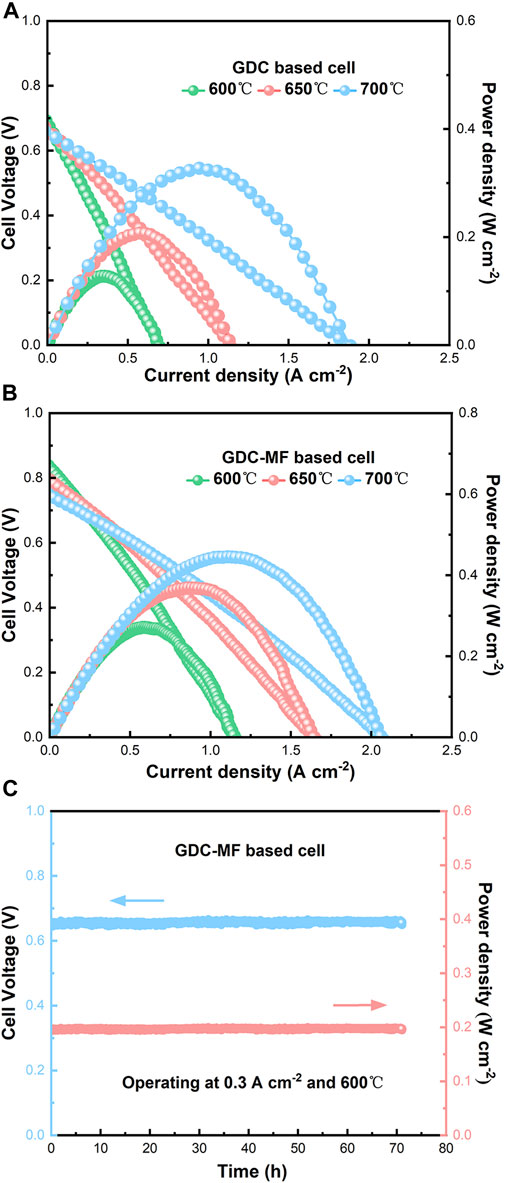
FIGURE 11. Electrochemical performance measured at 600°C, 650°C, and 700°C of (A) the GDC, (B) GDC-MF electrolyte-based SOFC, and (C) long-term stability of Cell-II measured at 600°C for 70 h.
In summary, the effects of the addition of MgO and Fe2O3 on the sintering behavior, phase composition, microstructure, electrochemical performance and compatibility with classical electrodes of GDC electrolytes were systematically investigated. All the GDC-based electrolytes samples were prepared by a sol-gel method and exhibited the cubic fluorite structure. MgO-Fe2O3 acted as a dual sintering aid could increase the effective densification of the samples and reduce the Rgi, Rgb and Rt of the GDC-MF electrolyte. At 400 °C, the σgb and σt of the GDC-MF were 2.40 × 10⁻¹ S cm−1 and 3.50 × 10⁻³ S cm−1, which were 15.89 and 5.56 times higher than those of GDC σgb (1.51 × 10⁻² S cm−1) and σt (6.30 × 10⁻⁴ S cm−1). Additionally, the GDC-MF electrolyte had matchable thermal expansion coefficient and excellent chemical compatibility with commonly used electrodes. Furthermore, the single cell supported by GDC-MF electrolyte could reach the highest power density of 0.45 W cm−2 at 700°C, and demonstrate the stable voltage and power density in the long-term stability test within 70 h. Therefore, adding Fe2O3-MgO dual sintering aids to GDC electrolyte is an effective approach to improve the electrochemical performance, and the GDC-MF electrolyte should be a promising electrolyte for IT-SOFC.
The original contributions presented in the study are included in the article/Supplementary Material, further inquiries can be directed to the corresponding authors.
QL and PT completed the experiments, analyzed the data and wrote the manuscript. XZ and TD provided resources and funding acquisition for this manuscript. DZ, JZ, JB and WY designed the experimental direction and helped in the analysis and review of data. NW reviewed and revised the manuscript.
This study was supported by the Science Research Foundation of Jilin Province (20190201230JC and 20200403154SF), the Guangdong Basic and Applied Basic Research Foundation (2019A1515010743), the Open Foundation of State Key Laboratory of Inorganic Synthesis and Preparative Chemistry (2020–31); the National Natural Science Foundation of China (21471022, 21971113, 22175094). Opening Foundation of State Key Laboratory of Inorganic Synthesis and Preparative Chemistry, China (No. 2020–31).
The authors declare that the research was conducted in the absence of any commercial or financial relationships that could be construed as a potential conflict of interest.
All claims expressed in this article are solely those of the authors and do not necessarily represent those of their affiliated organizations, or those of the publisher, the editors and the reviewers. Any product that may be evaluated in this article, or claim that may be made by its manufacturer, is not guaranteed or endorsed by the publisher.
The Supplementary Material for this article can be found online at: https://www.frontiersin.org/articles/10.3389/fchem.2022.991922/full#supplementary-material
Abbas, F., Jan, T., Iqbal, J., and Naqvi, M. S. H. (2015). Fe doping induced enhancement in room temperature ferromagnetism and selective cytotoxicity of CeO2 nanoparticles. Curr. Appl. Phys. 15, 1428–1434. doi:10.1016/j.cap.2015.08.007
Accardo, G., Audasso, E., and Yoon, S. P. (2021). Unravelling the synergistic effect on ionic transport and sintering temperature of nanocrystalline CeO2 tri-doped with Li, Bi and Gd as dense electrolyte for solid oxide fuel cells. J. Alloys Compd. 898, 162880. doi:10.1016/j.jallcom.2021.162880
Accardo, G., Frattini, D., Ham, H. C., Han, J. H., and Yoon, S. P. (2018). Improved microstructure and sintering temperature of bismuth nano-doped GDC powders synthesized by direct sol-gel combustion. Ceram. Int. 44, 3800–3809. doi:10.1016/j.ceramint.2017.11.165
Anjaneya, K. C., Nayaka, G. P., Manjanna, J., Kumar, V. M. A., Govindaraj, G., and Ganesha, K. N. (2014). Investigation on the Sr-doped ceria Ce1-xSrxO2-d (x = 0.05–0.2) as an electrolyte for intermediate temperature SOFC. J. Alloys Compd. 598, 33–40. doi:10.1016/j.jallcom.2014.01.242
Babar, Z. U. D., Hanif, M. B., Gao, J.-T., Li, C.-J., and Li, C.-X. (2022). Sintering behavior of BaCe0.7Zr0.1Y0.2O3-δ electrolyte at 1150 °C with the utilization of CuO and Bi2O3 as sintering aids and its electrical performance. Int. J. Hydrogen Energy 47, 7403–7414. doi:10.1016/j.ijhydene.2021.12.075
Bai, J. H., Han, Z. Y., Lv, B., Chen, X., Zhu, X. F., and Zhou, D. F. (2020). Preparation of 3D structure high performance Ba0·5Sr0·5Fe0·8Cu0·2O3-δ nanofiber SOFC cathode material by low-temperature calcination method. Int. J. Hydrogen Energy 46, 8132–8142. doi:10.1016/j.ijhydene.2020.11.263
Bi, H., Liu, X., Zhu, L., Sun, J., Yu, S., Yu, H., et al. (2017). Effect of MgO addition and grain size on the electrical properties of Ce0.9Gd0.1O1.95 electrolyte for IT-SOFCs. Int. J. Hydrogen Energy 42, 11735–11744. doi:10.1016/j.ijhydene.2017.02.110
Chen, M., Kim, B. H., Xu, Q., Nam, O. J., Ko, J. H., Kang, W. J., et al. (2008). Structure and electrical properties of (Na0.5Bi0.5)1-xBaxTiO3 piezoelectric ceramics. J. Eur. Ceram. Soc. 28, 843–849. doi:10.1016/j.jeurceramsoc.2007.08.007
Chen, X., Sun, X., Zhou, J., Zhou, D., Zhu, X., and Meng, J. (2020). Effects of CoO and Bi2O3 single/dual sintering aids doping on structure and properties of Ce0.8Nd0.2O1.9. Ceram. Int. 46, 22727–22732. doi:10.1016/j.ceramint.2020.06.038
Cho, Y. H., Cho, P. S., Auchterlonie, G., Kim, D. K., Lee, J. H., Kim, D. Y., et al. (2007). Enhancement of grain-boundary conduction in gadolinia-doped ceria by the scavenging of highly resistive siliceous phase. Acta Mater. 55, 4807–4815. doi:10.1016/j.actamat.2007.05.001
Coduri, M., Checchia, S., Longhi, M., Ceresoli, D., and Scavini, M. (2018). Rare earth doped ceria: The complex connection between structure and properties. Front. Chem. 6, 526. doi:10.3389/fchem.2018.00526
Guo, X., and Waser, R. (2006). Electrical properties of the grain boundaries of oxygen ion conductors: Acceptor-doped zirconia and ceria. Prog. Mat. Sci. 51, 151–210. doi:10.1016/j.pmatsci.2005.07.001
Han, J., Zhang, J., Li, F., Luan, J., and Jia, B. (2018). Low-temperature sintering and microstructure evolution of Bi2O3-doped YSZ. Ceram. Int. 44, 1026–1033. doi:10.1016/j.ceramint.2017.10.039
Jia, B., Tian, C., Wang, C., Wu, T., Xie, J., and Li, M. (2015). Preparation and characterization of Ce0.8Y0.2−xCuxO2−δ as electrolyte for intermediate temperature solid oxide fuel cells. J. Power Sources 278, 420–429. doi:10.1016/j.jpowsour.2014.12.073
Kashyap, D., Patro, P. K., Lenka, R. K., Mahata, T., and Sinha, P. K. (2014). Effects of Gd and Sr co-doping in CeO2 for electrolyte application in solid oxide fuel cell (SOFC). Ceram. Int. 40, 11869–11875. doi:10.1016/j.ceramint.2014.04.021
Leah, R. T., Brandon, N. P., and Aguiar, P. (2005). Modelling of cells, stacks and systems based around metal-supported planar IT-SOFC cells with CGO electrolytes operating at 500-600 °C. J. Power Sources 45, 336–352. doi:10.1016/j.jpowsour.2004.12.067
Li, B., Wei, X., and Pan, W. (2008). Electrical properties of Mg-doped Gd0.1Ce0.9O1.95 under different sintering conditions. J. Power Sources 183, 498–505. doi:10.1016/j.jpowsour.2008.05.050
Li, S., Lu, X., Shi, S. Q., Chen, L. Q., Wang, Z. X., and Zhao, Y. S. (2020). Europium-doped ceria nanowires as anode for solid oxide fuel cells. Front. Chem. 8, 348. doi:10.3389/fchem.2020.00348
Li, S. P., Lu, J. Q., Fang, P., and Luo, M. F. (2009). Effect of oxygen vacancies on electrical properties of Ce0.8Sm0.1Nd0.1O2−δ electrolyte: An in situ Raman spectroscopic study. J. Power Sources 193, 93–98. doi:10.1016/j.jpowsour.2008.12.022
Mehranjani, A. S., Cumming, D. J., Sinclair, D. C., and Rothman, R. H. (2017). Low-temperature co-sintering for fabrication of zirconia/ceria bi-layer electrolyte via tape casting using a Fe2O3 sintering aid. J. Eur. Ceram. Soc. 37, 3981–3993. doi:10.1016/j.jeurceramsoc.2017.05.018
Nakajima, A., Yoshihara, A., and Ishigame, M. (1994). Defect-induced Raman spectra in doped CeO2. Phys. Rev. B 50, 13297–13307. doi:10.1103/physrevb.50.13297
Nicollet, C., Waxin, J., Dupeyron, T., Flura, A., Heint, J. M., Ouweltjes, J. P., et al. (2017). Gadolinium doped ceria interlayers for Solid Oxide Fuel Cells cathodes: Enhanced reactivity with sintering aids (Li, Cu, Zn), and improved densification by infiltration. J. Power Sources 372, 157–165. doi:10.1016/j.jpowsour.2017.10.064
Öksüzömer, M. a. F., Dönmez, G., Sariboğa, V., and Altinçekiç, T. G. (2013). Microstructure and ionic conductivity properties of gadolinia doped ceria (GdxCe1−xO2−x/2) electrolytes for intermediate temperature SOFCs prepared by the polyol method. Ceram. Int. 39, 7305–7315. doi:10.1016/j.ceramint.2013.02.069
Pu, Z. Y., Lu, J. Q., Luo, M. F., and Xie, Y. L. (2007). Study of oxygen vacancies in Ce0.9Pr0.1O2-δ solid solution by in situ X-ray diffraction and in situ Raman spectroscopy. J. Phys. Chem. C 111, 18695–18702. doi:10.1021/jp0759776
Santos, T. H., Grilo, J. P. F., Loureiro, F. J. A., Fagg, D. P., and Fonseca, F. C. (2018). Macedo structure, densification and electrical properties of Gd3+ and Cu2+ codoped ceria solid electrolytes for SOFC applications: Effects of Gd2O3 content. Ceram. Int. 44, 2745–2751. doi:10.1016/j.ceramint.2017.11.009
Sartoretti, E., Novara, C., Giorgis, F., Piumetti, M., Bensaid, S., Russo, N., et al. (2019). In situ Raman analyses of the soot oxidation reaction over nanostructured ceriabased catalysts. Sci. Rep. 9, 3875. doi:10.1038/s41598-019-39105-5
Shajahan, I., Dasari, H. P., and Saidutta, M. B. (2020). Effect of sintering aids on sintering kinetic behavior of praseodymium doped ceria based electrolyte material for solid oxide cells. Int. J. Hydrogen Energy 45, 25935–25944. doi:10.1016/j.ijhydene.2020.06.163
Singh, M., Zappa, D., and Comini, E. (2021). Solid oxide fuel cell: Decade of progress, future perspectives and challenges. Int. J. Hydrogen Energy 46, 27643–27674. doi:10.1016/j.ijhydene.2021.06.020
Song, X. B., Liao, D. L., Lian, Z. X., Chen, F., and Peng, K. (2021). Effects of monovalent alkali metals on grain boundary conductivity and electrochemical properties of gadolinia-doped ceria electrolyte. Ceram. Int. 47, 18773–18782. doi:10.1016/j.ceramint.2021.03.212
Spiridigliozzi, L., Dell'agli, G., Accardoc, G., Yoon, S. P., and Frattini, D. (2019). Electro-morphological, structural, thermal and ionic conduction properties of Gd/Pr co-doped ceria electrolytes exhibiting mixed Pr3+/Pr4+ cation. Ceram. Int. 45, 4570–4580.
Steele, B. C. H. (2000). Appraisal of Ce1-yGdy O2-y/2 electrolytes for IT-SOFC operation at 500 °C. Solid State Ionics 129, 95–110. doi:10.1016/s0167-2738(99)00319-7
Tai, L. W., Nasrallah, M. M., Anderson, H. U., Sparlin, D. M., and Sehlin, S. R. (1995). Structure and electrical properties of La1−xSrxCo1−y FeyO3. part 2. the system La1−x SrxCo0.2 Fe0.8O3. Solid State Ionics 76, 273–283. doi:10.1016/0167-2738(94)00245-n
Wang, J., Chen, X., Xie, S., Chen, L., Wang, Y., Meng, J., et al. (2019). Bismuth tungstate/neodymium-doped ceria composite electrolyte for intermediate-temperature solid oxide fuel cell: Sintering aid and composite effect. J. Power Sources 428, 105–114. doi:10.1016/j.jpowsour.2019.04.105
Wang, Y., Zhou, D., Chen, L., Xie, S., Liu, X., and Meng, J. (2017). Improvement in the sintering and electrical properties of strontiumand magnesium-doped lanthanum gallate by MoO3 dopant. J. Alloys Compd. 710, 748–755. doi:10.1016/j.jallcom.2017.03.323
Xu, D., Liu, X., Xu, S., Yan, D., Pei, L., Zhu, C., et al. (2011). Fabrication and performance of Ce0.85Sm0.15O1.925–Fe2O3 electrolytes in IT-SOFCs. Solid State Ionics 192, 510–514. doi:10.1016/j.ssi.2010.03.026
Zhang, C., Sunarso, J., Zhu, Z., Wang, S., and Liu, S. (2017). Enhanced oxygen permeability and electronic conductivity of Ce0.8Gd0.2O2−δ membrane via the addition of sintering aids. Solid State Ionics 310, 121–128. doi:10.1016/j.ssi.2017.08.020
Zhang, L. L., Chen, G., Dai, R. X., Lv, X. H., Yang, D., and Geng, S. J. (2021). A review of the chemical compatibility between oxide electrodes and electrolytes in solid oxide fuel cells. J. Power Sources 492, 229630. doi:10.1016/j.jpowsour.2021.229630
Zhang, T. S., Ma, J., Chan, S. H., and Kilner, J. A. (2004a). Improvements in sintering behavior and grain-boundary conductivity of ceria-based electrolytes by a small addition of Fe[sub 2]O[sub 3]. J. Electrochem. Soc. 151, J84. doi:10.1149/1.1795257
Zhang, T. S., Ma, J., Kong, L. B., Chan, S. H., Hing, P., and Kilner, J. A. (2004b). Iron oxide as an effective sintering aid and a grain boundary scavenger for ceria-based electrolytes. Solid State Ionics 167, 203–207. doi:10.1016/j.ssi.2004.01.006
Zhang, T. S., Ma, J., Leng, Y. J., Chan, S. H., Hing, P., and Kilner, J. A. (2004c). Effect of transition metal oxides on densification and electrical properties of Si-containing Ce0.8Gd0.2O2-δ ceramics. Solid State Ionics 168, 187–195. doi:10.1016/j.ssi.2004.02.015
Zhang, W. W., Wang, H. C., Guan, K., Wei, Z. Y., Zhang, X., Meng, J. L., et al. (2019). La0.6Sr0.4Co0.2Fe0.8O3-δ/CeO2 heterostructured composite nanofibers as a highly active and robust cathode catalyst for solid oxide fuel cells. ACS Appl. Mat. Interfaces 11, 26830–26841. doi:10.1021/acsami.9b06668
Zhao, L., Drennan, J., Kong, C., Amarasinghe, S., and Jiang, S. P. (2014). Insight into surface segregation and chromium deposition on La0.6Sr0.4Co0.2Fe0.8O3-δ cathodes of solid oxide fuel cells. J. Mat. Chem. A 2, 11114–11123. doi:10.1039/c4ta01426j
Zheng, Y., Zhou, M., Ge, L., Li, S., Chen, H., and Guo, L. (2011). Effect of Fe2O3 on Sm-doped ceria system solid electrolyte for IT-SOFCs. J. Alloys Compd. 509, 546–550. doi:10.1016/j.jallcom.2010.09.103
Zhou, J., Tang, P., Bai, J.-H., Chen, Y.-X., Meng, Y., Zhu, X.-F., et al. (2022). A new type of Gd0.2Ce0.8O3-δ fuel cell electrolyte containing Er0.2Bi0.8O1.5 with highly improved performance. J. Alloys Compd. 901, 163654. doi:10.1016/j.jallcom.2022.163654
Zhu, Z., Li, M., Xia, C., and Bouwmeester, H. J. M. (2017). Bismuth-doped La1.75Sr0.25NiO4+δ as a novel cathode material for solid oxide fuel cells. J. Mat. Chem. A 5, 14012–14019. doi:10.1039/c7ta03381h
ASRp Polarization area-specific resistance
Cell-I Single cells supported with GDC electrolyte
Cell-II Single cells supported with GDC-MF electrolyte
Ea Activation energy
EIS Electrochemical impedance spectroscopy
FE-SEM Field emission scanning electron microscopy
GDC Gd0.2Ce0.8O2–δ
GDC-F GDC Samples with 4 mol% Fe2O3 addition
GDC-M GDC Samples with 4 mol% MgO addition
GDC-MF GDC Samples with 2 mol% MgO+2 mol% Fe2O3 addition
IT-SOFCs Intermediate-temperature solid oxide fuel cells
LSCF La0.6Sr0.4Co0.8Fe0.2O3-δ
OCV Open-circuit voltage
Olattice Lattice oxygen
ORR Oxygen reduction reaction
Osurface Surface oxygen
Rgb Grain boundary resistance
Rgi Grain resistance
Rt Total resistance
SOFCs Solid oxide fuel cells
TEC Thermal expansion coefficient
XPS X-ray photoelectron spectroscopy
XRD X-ray diffractometer
σgb Grain boundary conductivity
σgi Grain conductivity
σt Total conductivity
Keywords: solid oxide fuel cells, sintering aid, electrolyte, Gd0.2Ce0.8O2-δ (GDC), ionic conductivity
Citation: Liang Q, Tang P, Zhou J, Bai J, Tian D, Zhu X, Zhou D, Wang N and Yan W (2022) Effect of MgO and Fe2O3 dual sintering aids on the microstructure and electrochemical performance of the solid state Gd0.2Ce0.8O2-δ electrolyte in intermediate-temperature solid oxide fuel cells. Front. Chem. 10:991922. doi: 10.3389/fchem.2022.991922
Received: 12 July 2022; Accepted: 16 August 2022;
Published: 27 September 2022.
Edited by:
Guoxin Zhang, Shandong University of Science and Technology, ChinaReviewed by:
Wang Sun, Beijing Institute of Technology, ChinaCopyright © 2022 Liang, Tang, Zhou, Bai, Tian, Zhu, Zhou, Wang and Yan. This is an open-access article distributed under the terms of the Creative Commons Attribution License (CC BY). The use, distribution or reproduction in other forums is permitted, provided the original author(s) and the copyright owner(s) are credited and that the original publication in this journal is cited, in accordance with accepted academic practice. No use, distribution or reproduction is permitted which does not comply with these terms.
*Correspondence: Xiaofei Zhu, emh1eGlhb2ZlaUBjY3V0LmVkdS5jbg==; Defeng Zhou, ZGVmZW5nemhvdTY1QDEyNi5jb20=; Ning Wang, d2FuZ25pbmdAc2lhdC5hYy5jbg==
†These authors contributed equally to this work and share first authorship
Disclaimer: All claims expressed in this article are solely those of the authors and do not necessarily represent those of their affiliated organizations, or those of the publisher, the editors and the reviewers. Any product that may be evaluated in this article or claim that may be made by its manufacturer is not guaranteed or endorsed by the publisher.
Research integrity at Frontiers
Learn more about the work of our research integrity team to safeguard the quality of each article we publish.