 Ze Ying Li1
 Na Feng
 Bao Qiong Li
95% of researchers rate our articles as excellent or good
Learn more about the work of our research integrity team to safeguard the quality of each article we publish.
Find out more
ORIGINAL RESEARCH article
Front. Chem. , 07 September 2022
Sec. Organic Chemistry
Volume 10 - 2022 | https://doi.org/10.3389/fchem.2022.984010
This article is part of the Research Topic Bioactive Natural Products-Oriented Synthetic and Functional Studies View all 24 articles
Cortex Fraxini is an important traditional Chinese herbal medicine with various medical functions. Aesculin and aesculetin are the main effective components of Cortex Fraxini. The fluorescence signals of the two compounds have a high degree of overlap with each other, making quantitative analysis difficult with conventional analytical methods. In the present study, different chemometrics methods, including lasso regression (LAR), interval partial least squares (iPLS), and multidimensional partial least squares (N-PLS) methods, were employed and combined with excitation–emission matrix (EEM) fluorescence for the purpose of accurate quantification of aesculin and aesculetin in Cortex Fraxini samples. The most satisfactory results were obtained by using the N-PLS method based on the EEM spectra without scatterings, with correlation coefficient of calibration and prediction values higher than 0.9972 and 0.9962, respectively, root mean squared errors for calibration and prediction values lower than 0.0304 and 0.1165, respectively, and recovery values in the range of 83.32%–104.62%. The obtained credible models indicated that the N-PLS method combined with EEM spectra has the advantages of being green, low cost, and accurate and it is a good strategy for the determination of active compounds in complex samples. To further confirm the accuracy of the obtained results, the same samples were analyzed by the recognized ultra-performance liquid chromatography method.
Chinese herbal medicine is a natural resource with abundant sources. It is widely used in the treatment of diseases in China and neighboring countries. Compared with western medicine, Chinese herbal medicine is popular with people because of its low toxicity and few side effects. Cortex Fraxini (Chinese name Qin-pi) is an important traditional Chinese herbal medicine that has been used to treat gout, arthritis, hyperuricemia, and other diseases (Wang et al., 2016a) for over 2000 years. Coumarin compounds are the main chemical active ingredients in Cortex Fraxini medicinal materials, which have obvious effect in the treatment of primary hyperuricemia (Zhou et al., 2018).
Nowadays, numerous methods exist for the quantitative analysis of target ingredients of Chinese herbal medicines or their formulas, including high-performance liquid chromatography (HPLC), ultra-performance liquid chromatography (UPLC), liquid chromatography–mass spectrometry (LC-MS), gas chromatography–mass spectrometry (GC-MS), ultra-high-performance supercritical fluid chromatography (UHPSFC), Fourier-transform infrared (FTIR) spectroscopy, excitation–emission matrix (EEM) fluorescence spectroscopy, terahertz (THz) spectroscopy, and proton nuclear magnetic resonance (1H NMR) spectroscopy. Among these methods, EEM spectroscopy has the advantages of rapidity, simplicity, low cost, high sensitivity, and non-destructiveness. At present, a large number of reports on the analysis of ingredients in foods and medicines by fluorescence spectroscopy combined with chemometrics methods have been reported, and a few examples include those of Bai et al. (2018), Liu et al. (2019), Wang et al. (2017), and Li et al. (2021). These successful examples demonstrated that fluorescence spectroscopy combined with chemometrics methods can be regarded as an effective way to quantitatively analyze target components in complex systems.
Aesculin and aesculetin are the main effective components of Cortex Fraxini. At present, many analytical methods have been applied to analyze one or both components of aesculin and aesculetin, including HPLC (Wang et al., 2019), LC-MS (Li et al., 2013), capillary electrophoresis (CE) (Li et al., 2005), GC-MS (Wang et al., 2016b), and electrochemical analysis (Sheng et al., 2020). In our research, we intend to quantitatively analyze these two components based on EEM spectra because of its advantages of simplicity, low cost, and high sensitivity. Owing to the complexity of the Cortex Fraxini samples, unknown interferences may be present in the measured data, and the fluorescence signals of aesculin and aesculetin have a high degree of overlap with each other, making simultaneous quantitative analysis difficult by using conventional fluorescence methods. To realize the accurate quantitative analysis purposes, appropriate algorithms should be explored and employed.
The aim of this work was to explore different chemometrics strategies, such as lasso regression (LAR), interval partial least squares (iPLS), and multidimensional partial least squares (N-PLS) methods, in combination with EEM spectra for the quantitative determination of aesculin and aesculetin in Cortex Fraxini samples. Among these three methods, LAR is an important machine learning technique that can be applied for analyzing data suffering from multicollinearity (Gao et al., 2022), iPLS is a feature interval extraction method on the basis of PLS that aims to minimize multicollinearity problems to improve the accuracy of the PLS model (Abreu et al., 2015), and N-PLS is a second-order multivariate calibration algorithm that can be used for three-way data modeling even in the presence of multicollinearity problems (Lopez-Fornieles et al., 2022). To the best of our knowledge, there exist no published reports of the analysis of the aesculin and aesculetin in Cortex Fraxini samples by using the above-mentioned methods. The obtained results of each method were fully validated by statistical parameters, and the potentials of the methods were evaluated and compared. The comparison results showed that the N-PLS method gave the most satisfactory quantitative analysis results. Furthermore, we compared the most satisfactory results achieved from the N-PLS method with those obtained by the UPLC method, which further proved the reliability and accuracy of the explored method.
In the following subsections, a brief introduction is given to the three employed methods, LAR, iPLS, and N-PLS.
The LAR method is an important machine learning technique for analyzing data suffering from multilinearity (Yang and Wen, 2018). The basic idea of LAR is to minimize the sum of squared residuals under the constraint that the sum of the absolute values of the regression coefficients is less than a constant, so that some regression coefficients strictly equal to zero can be generated and an interpretable model can be obtained (Tkachenko et al., 2021) when the regression coefficients are zero and the corresponding variables are not selected, thus eliminating irrelevant information variables and improving the predictive accuracy of the model and its interpretability.
The iPLS algorithm can be used to extract the feature bands and remove a large amount of useless information and noisy variables. It divides the entire spectral region into several subintervals of equal width. For each interval, a local PLS is established. If a subinterval contains more information and less noise, the performance of the corresponding model will be better (Wu et al., 2015). Therefore, in each subinterval, the root mean squared errors for cross-validation (RMSECV) are calculated, and the subinterval with the minimum RMSECV value is taken as the characteristic band and selected for further use. For cross-validation, an individual sample is taken from the calibration set and a model is established by the remaining samples. Then, the model is applied to predict the removed sample. The calculation formula of RMSECV is as follows (Zhang et al., 2021):
where m is the sample numbers of the calibration set,
N-PLS (Bro, 1996) is an extension of partial least squares (PLS) regression to higher-order arrays; it has been used in many quantitative analysis studies (Bro, 1996; Luo et al., 2016). During the construction of the N-PLS models, it is important to choose the proper number of latent variables (LVs). Some necessary and useful information may be missed if the number of LVs is too small, whereas some useless information or even interferences will be involved in the model if the number of LVs is more than required (Yang et al., 2018). Therefore, the proper number of LVs should be determined carefully. In this study, the proper number of LVs was chosen on the basis of the minimum predicted residual error sum of squares (PRESS) for each model (Thomas, 2003). The calculation formula of PRESS is as follows (Khajehsharifi and Eskandari, 2011):
where m is the sample numbers of the calibration set and
The performance of the established models should be validated by statistical parameters. For the above purpose, the following parameters have been employed: the correlation coefficient for calibration (Rc) and prediction (Rp) and the root mean squared errors for calibration (RMSEC) and prediction (RMSEP). The correlation coefficient is a measure of the linearity between the calculated and actual values of the model, and the root mean squared error is a commonly used index to measure the error in quantitative models. A successful calibration model should have higher values of Rc and Rp and lower values of RMSEC and RMSEP.
Aesculin and aesculetin were purchased from Chengdu MUST BIO-TECHNOLOGY CO., LTD. (purity higher than 98%). The molecular structures of the two compounds are illustrated in Figure 1. Ultra-pure water was purchased from Watsons. Methanol was of HPLC grade and other chemicals were of analytical grade.
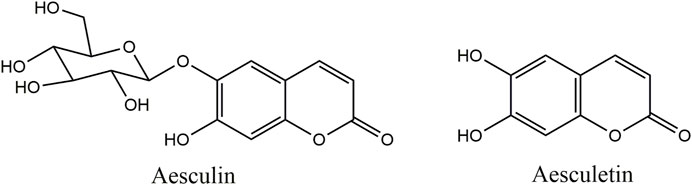
FIGURE 1. Molecular structures of aesculin and aesculetin.
Six Cortex Fraxini samples were purchased from local drug stores (Jiangmen, Guangdong, China) and then pulverized with a traditional Chinese medicine grinder.
Fluorescence data of all samples were measured by a fully automatic and integrated FluoroMax-4 instrument with a 150 w ozone-free xenon light source, excitation monochromator, reference detector, sample cell, emission monochromator, and signal detector. The spectral data were obtained by scanning the samples at excitation wavelengths ranging from 200 nm to 600 nm and emission wavelengths ranging from 200 nm to 600 nm with steps of 10 nm.
The multifunctional ultrasonic cleaner (GS-060A) was purchased from Shenzhen Keneng Cleaning Equipment Co., Ltd.
The UPLC chromatograms were carried out on Waters UPLC H-class instrument coupled with a PAD e
The implementation of the N-PLS and iPLS algorithms was on the eclipse platform, and the version number was 4.19.0; the jdk version was 1.7.0_13-b20, the tomcat version was 7.0, and the computer language was java. The implementation of the LAR algorithm was on the pycharm platform, and the computer language was python.
Stock solutions of aesculin (745 μg/ml) and aesculetin (1,060 μg/ml) were prepared by dissolving the standards in methanol, and they were stored at 4°C in the freezer. Working solutions were prepared by appropriate dilution of the stock solutions with methanol. Britton–Robinson buffer solution (BR buffer) (0.2 mol/L, pH = 9) was used to stabilize the fluorescence intensity of aesculin and aesculetin.
A series of 21 mixed standard solution samples was prepared. The concentrations of aesculin and aesculetin were in the range of 0.002–1.020 μg/ml and 0.009–4.000 μg/ml, respectively, and the detailed concentrations of the aesculin and aesculetin are shown in Supplementary Tables S1, S2, respectively (in the Supporting information).
The purchased Cortex Fraxini samples were crushed into powder by a pulverizer for better extraction of aesculin and aesculetin. We referred to some Chinese literature and found that the active substances in Cortex Fraxini can be better extracted by soaking the sample in methanol for 24 h and then extracting by ultrasonication for 30 min. Thus, in this study, the powdered Cortex Fraxini samples were soaked in methanol for 24 h at room temperature and then treated with ultrasonication for 30 min. They were then filtered and transferred to a 50.0 ml volumetric flask, left at room temperature, and appropriately diluted with methanol during use.
For the recovery test, the six actual samples were all spiked with a certain amount of aesculin and aesculetin, respectively. The recovery values were calculated as
For all of the above samples, 2 ml of BR buffer was added and then the samples were diluted to the mark in 10.0 ml volumetric flasks with ultra-pure water. Each mixed standard sample was measured once, and each spiked and actual sample was measured three times to obtain the average value.
In EEM spectra, Raman and Rayleigh scatterings are unrelated to the chemical sample composition (Andersen and Bro, 2003), and the existence of Raman and Rayleigh scatterings may have some influence on the final analytical results. The EEM spectra of aesculin and aesculetin are presented in Figure 2; Figure 2A is with Raman and Rayleigh scatterings, and Figure 2B is without scatterings. Moreover, one can see that there is a high degree of overlap between the two signals. Therefore, it is difficult to determine the concentration of the two components by the ordinary fluorescence method. In the present study, the scatterings are first removed and then the missing data is filled by interpolation by using new data consistent with the rest of the EEM spectrum (Bahram et al., 2006). As can be seen from Figure 2B, the scatterings have been removed successfully. In order to obtain satisfactory analytical results, in the present study, three well-known chemometrics methods, namely LAR, iPLS, and N-PLS, were employed, and the results obtained are compared and discussed herein.
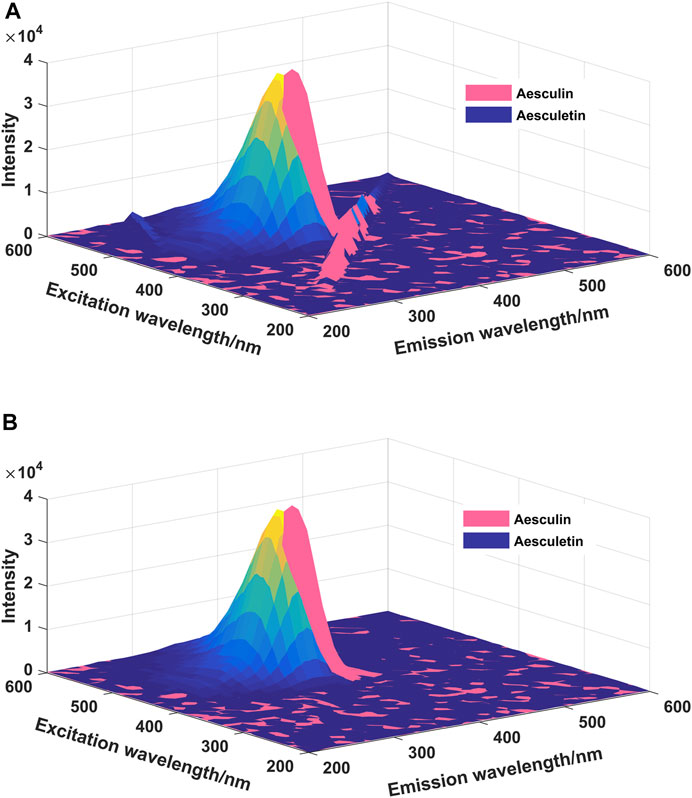
FIGURE 2. The EEM spectra of aesculin (0.16 μg/ml) and aesculetin (1 μg/ml). (A): Scatterings are not eliminated; (B): Scatterings are eliminated.
The EEM spectra matrices without scatterings were arranged in a three-way array with the dimensions of 41 (emission wavelength points) × 41 (excitation wavelength points) × sample numbers. To explore the main characteristics of the employed methods, the mixed standard samples were divided into calibration and prediction sets; three quarters of the samples were selected as the calibration set and used to establish the calibration model, and the remaining ones were selected as the prediction set and applied to validate the performance of the established model. For the calibration set, the matrix size was 41 × 41 × 16, and for the prediction set the matrix size was 41 × 41 × 5.
A suitable method was the vital factor for model establishment. Three algorithms, namely LAR, iPLS, and N-PLS, were applied individually to build calibration models. The performances of the established models were compared with each other by evaluation of Rc, Rp, RMSEC, and RMSEP.
The first method explored was the LAR method. The existence of multicollinearity may cause the model to shift greatly and cannot simulate the overall view of data. LAR is an important machine learning technique for analyzing data that suffer from multilinearity. Before the LAR model establishment, the contour values (Li et al., 2015) of the EEM spectra of all samples were extracted for dimensionality reduction purposes. The process of extracting the contour values is equivalent to the process of extracting the emission wavelength values by fixing the excitation wavelength. A plot of the contour values of the EEM spectrum of a sample is presented in Supplementary Figure S2. After extraction of the contour values, the data matrix of the calibration set had a size of 16 (sample number) × 41 (emission wavelength points). For the prediction set, the matrix had a size of 5 (sample number) × 41 (emission wavelength points). By application of this method, the irrelevant information variables was eliminated and a regression model was obtained for each target compound. In this case, the LAR model for each target compound was described as follows:
The LAR model for aesculin:
The LAR model for aesculetin:
In the above models,
To assess the prediction ability of the established models, they were estimated by prediction sets; the statistical results are shown in Table 1. As can be seen, the values of Rc were 1.0000 and 0.9967 and of RMSEC were 0.0023 and 0.1174 for aesculin and aesculetin, respectively, demonstrating that the established models have good linearity and can be applied to the prediction set. For prediction purposes, Rp values of 0.9921 and 0.9767 (Figure 3) and RMSEP values of 0.0680 and 0.2507 were obtained for aesculin and aesculetin, respectively.
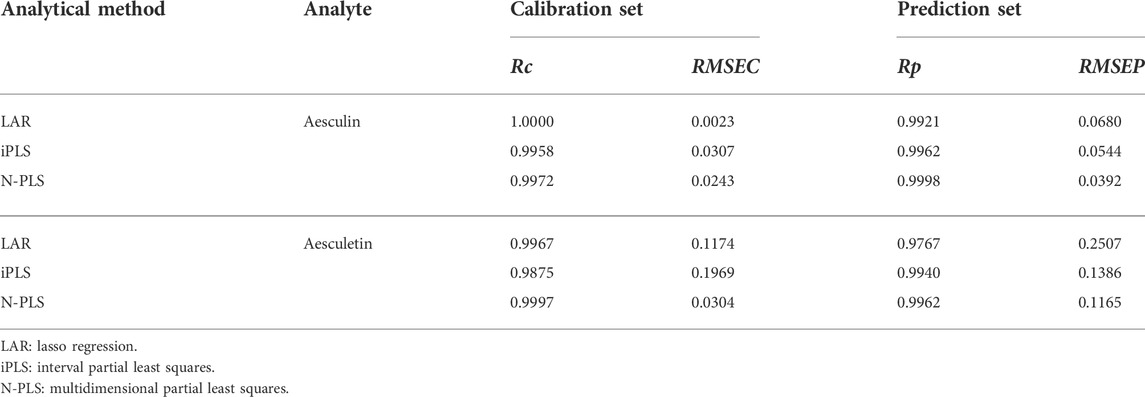
TABLE 1. Statistical parameters related to the calibration and prediction models of aesculin and aesceletin established by different methods.
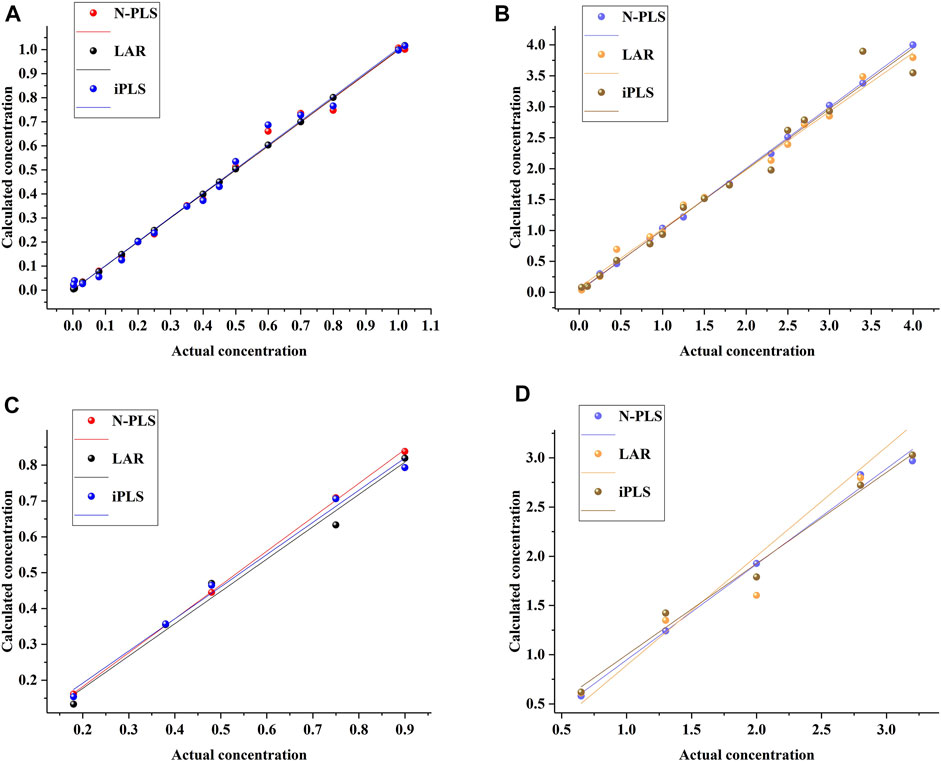
FIGURE 3. The relationship between the actual concentrations and calculated concentrations by using different methods for aesculin (A) and aesculetin (B) in the calibration set and aesculin (C) and aesculetin (D) in the prediction set.
In addition, as can be seen from Table 2, the recovery values were in the range of 80.04%–103.36%, and 76.65%–106.03% for aesculin and aesculetin, respectively. One can conclude that not all recovery results were satisfactory, such as the recovery of aesculetin (76.65%) obtained from Cortex Fraxini 4. We suspect the possible reason is that the unknown interference and useless information in the spectra has an impact on the final analysis results. Therefore, as described in the following section, a method that can be used to extract characteristic variables to improve the accuracy of the analytical results was explored.
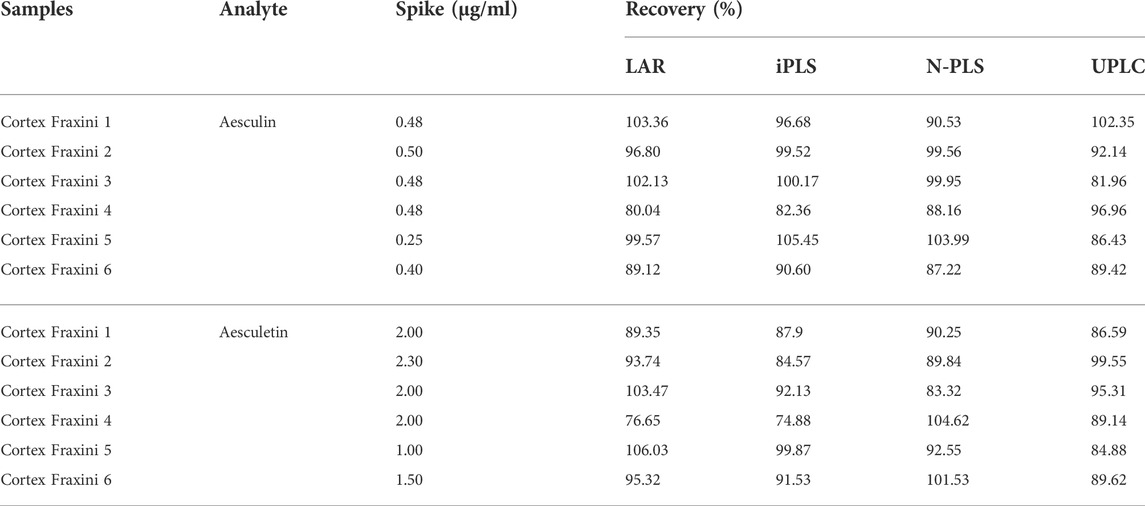
TABLE 2. Recovery values obtained by different methods.
The iPLS method can be used to extract the characteristic intervals from the given spectral data to obtain more accurate analytical results. In the present study, the iPLS method was also performed on the contour values, and 8 intervals were determined for further analysis. Then, one optimum interval and corresponding PLS component was determined according to the minimum RMSECV value. In the present study, the interval in the emission wavelength range of 310–350 nm is determined for both aesculin and aesculetin, and the optimization numbers of the PLS component are 2 and 1, respectively. The corresponding statistical parameters of the established iPLS models are summarized in Table 1.
As can be seen from Table 1, the iPLS models have higher Rp values and lower RMSEP values than that of LAR models, demonstrating that the iPLS method has good feature extraction ability and can be applied to improve the accuracy of the established models.
After model evaluation, the recovery values were also calculated; as can be seen from Table 2, the recovery values were in the range of 82.36%–105.45%, and 74.88%–99.87% for aesculin and aesculetin, respectively. The same phenomenon occurred as with the LAR method in that the recovery of aesculetin (74.88%) in Cortex Fraxini 4 was not satisfactory. From this perspective, we suspect that one possible reason was that some important information from the contour values might be lost, so a high-order chemometrics method was considered to deal with the EEM spectral data.
The calibration set with the size of 41 × 41 × 16 was applied to establish the calibration model, and the performance of the established models was evaluated by using the prediction set. In the process of establishing the N-PLS models, the optimal number of LVs should first be determined. In the present study, the optimum number of LVs for the N-PLS models was indicated by the minimum PRESS value versus the number of LVs (Supplementary Figure S1). For aesculin (Supplementary Figure S1A), the minimum PRESS value can be determined with 2 LVs, and for aesculetin (Supplementary Figure S1B), the local minimum PRESS value can be determined with 5 LVs. The statistical parameters of the N-PLS models are summarized in Table 1.
As can be seen from Table 1, the results from the calibration set show that the N-PLS method yielded satisfactory Rc values of 0.9972 and 0.9997 and RMSEC values of 0.0243 and 0.0304 for aesculin and aesculetin, respectively, demonstrating that the established models have the ability to accurately calculate the prediction set. The established models were then applied to the prediction set, and values were obtained for Rp of 0.9998 and 0.9962, and RMSEP of 0.0392 and 0.1165 for aesculin and aesculetin, respectively, which proved that good predictions were obtained.
Next, the spike recovery experiment was performed. As can be seen from Table 2, the recovery values were in the range of 87.22%–103.99% for aesculin, and 83.32%–104.62% for aesculetin. Compared with the results of the previous LAR and iPLS methods, the linearity, predictive ability, and accuracy of the N-PLS models were improved. However, owing to the same phenomenon that occurred with the LAR and iPLS methods, the recovery values of aesculetin in Cortex Fraxini 4 were nearly the same and not satisfactory, so we decided that it was necessary to further verify which method gives the most reliable recovery values.
A UPLC method was developed to further confirm the accuracy and reliability of the presented strategies. The two analytes and the backgrounds can be separated properly and completely under the chromatographic conditions mentioned above, and thus they can be quantified accurately based on peak areas. The chromatograms of aesculin, aesculetin, and a Cortex Fraxini sample are shown in Supplementary Figure S3. For a comprehensive comparison, the concentrations of aesculin and aesculetin used for UPLC and fluorescence were the same. In the measurement process, the samples with lower concentrations were not detected (Supplementary Tables S1, S2); thus, the calibration equations of aesculin and aesculetin were established from samples 1 to 14 in the calibration set. The statistical parameters of the calibration equations are summarized in Table 3; the low RMSEC and RMSEP values and high Rc and Rp values illustrate the accuracy of the UPLC method. The recoveries of aesculin and aesculetin by UPLC are shown in Table 2. First, we can see that the recovery rates of aesculin (81.96%–102.35%) and aesculetin (84.88%–99.55%) were satisfactory. One can then conclude that the accuracy of the UPLC and N-PLS methods is comparable. The separation of complex samples with UPLC requires some effort to find suitable conditions. A comparison of the comprehensive results of the N-PLS and UPLC methods shows that EEM fluorescence coupled with the chemometrics method can be regarded as a reliable and accurate approach to determine the two components in Cortex Fraxini samples simultaneously.
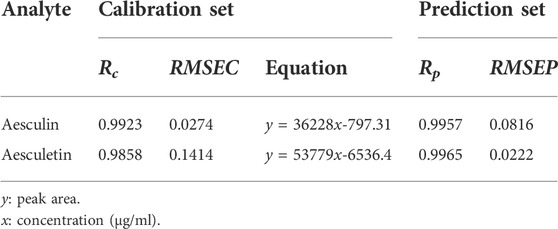
TABLE 3. Analytical results related to the calibration and prediction results for aesculin and aesculetin based on the UPLC method.
The above comparisons show that the analytical results of the N-PLS method on the EEM spectra are more accurate and reliable than the LAR and iPLS methods on the contour values. The reason may be that the higher-order N-PLS algorithm is less disturbed by the noise of the analysis system, so the quantitative analysis results obtained are more accurate (Pierce et al., 2011). Although the LAR and iPLS methods have not yielded satisfactory results, these strategies still have application values in proper analytical systems.
The present study reported a comparative study of three different algorithm (LAR, iPLS, and N-PLS) methods in combination with EEM spectroscopy for the determination of aesculin and aesculetin in traditional Chinese medicine. Satisfactory results were obtained with the N-PLS method on the basis of the EEM spectra despite the strong overlaps of the two analytes. The results presented herein show that the methodology proposed has the advantages of being simple, sensitive, and low cost. Consequently, EEM with the aid of proper chemometrics methods is a useful tool in processing the serious problem of overlapping and can be extended to other complex systems in the fields of food and the environment, such as body fluids.
The original contributions presented in the study are included in the article/Supplementary Materials; further inquiries can be directed to the corresponding author.
Z-Y L: Investigation, visualization, writing-original draft, writing-review and editing; X-K L: Investigation, visualization; YL: Visualization; NF: Supervision, review and editing, funding acquisition; X-Z Z: Supervision, review and editing, funding acquisition; Q-L L: Visualization; B-Q L: Investigation, resources, supervision, review and editing, funding acquisition, project administration.
The authors gratefully acknowledge the financial support from the Project of Young Innovative Talents in Colleges and Universities in Guangdong Province (2021KQNCX101), the Jiangmen City Science and Technology Basic Research Project (2020030102060005412), the team project of Wuyi University (2019td09), the High-level Talents for Scientific Research (2018AL003, 2018AL007), and the Department of Education of Guangdong Province (2020KCXTD036).
The authors declare that the research was conducted in the absence of any commercial or financial relationships that could be construed as a potential conflict of interest.
All claims expressed in this article are solely those of the authors and do not necessarily represent those of their affiliated organizations, or those of the publisher, the editors, and the reviewers. Any product that may be evaluated in this article, or claim that may be made by its manufacturer, is not guaranteed or endorsed by the publisher.
The Supplementary Material for this article can be found online at: https://www.frontiersin.org/articles/10.3389/fchem.2022.984010/full#supplementary-material
Abreu, R. E. L., Paz, J. E. M., Silva, A. C., Pontes, M. J. C., and Lemos, S. G. (2015). Ethanol fuel adulteration with methanol assessed by cyclic voltammetry and multivariate calibration. Fuel 156, 20–25. doi:10.1016/j.fuel.2015.04.024
Andersen, C. M., and Bro, R. (2003). Practical aspects of PARAFAC modeling of fluorescence excitation-emission data. J. Chemom. 17 (4), 200–215. doi:10.1002/cem.790
Bahram, M., Bro, R., Stedmon, C., and Afkhami, A. (2006). Handling of Rayleigh and Raman scatter for PARAFAC modeling of fluorescence data using interpolation. J. Chemom. 20 (3-4), 99–105. doi:10.1002/cem.978
Bai, X. M., Liu, T., Liu, D. L., and Wei, Y. J. (2018). Simultaneous determination of alpha-asarone and beta-asarone in Acorus tatarinowii using excitation-emission matrix fluorescence coupled with chemometrics methods. Spectrochimica Acta Part A Mol. Biomol. Spectrosc. 191, 195–202. doi:10.1016/j.saa.2017.10.011
Bro, R. (1996). Multiway calibration. Multilinear PLS. J. Chemom. 10, 47–61. doi:10.1002/(sici)1099-128x(199601)10:1<47::aid-cem400>3.0.co;2-c
Gao, W., Shu, T., Guan, Y., Ling, S., Liu, S., and Zhou, L. (2022). Novel strategy for establishment of an FT-Raman spectroscopy based quantitative model for poplar holocellulose content determination. Carbohydr. Polym. 277, 118793. doi:10.1016/j.carbpol.2021.118793
Khajehsharifi, H., and Eskandari, Z. (2011). Potentiality of partial least-squares multivariate calibration in the spectrophotometric analysis of binary mixtures of purine bases. Monatsh. Chem. 142 (8), 773–778. doi:10.1007/s00706-011-0513-7
Li, B. Q., Chen, J., Li, J. J., Wang, X., Zhai, H. L., and Zhang, X. Y. (2015). High-performance liquid chromatography with photodiode array detection and chemometrics method for the analysis of multiple components in the traditional Chinese medicine Shuanghuanglian oral liquid. J. Sep. Sci. 38 (24), 4187–4195. doi:10.1002/jssc.201500712
Li, C., Chen, A., Chen, X., Ma, X., Chen, X., and Hu, Z. (2005). Non-aqueous capillary electrophoresis for separation and simultaneous determination of fraxin, esculin and esculetin in Cortex fraxini and its medicinal preparations. Biomed. Chromatogr. 19 (9), 696–702. doi:10.1002/bmc.497
Li, M.-X., Li, Y.-Z., Chen, Y., Wang, T., Yang, J., Fu, H.-Y., et al. (2021). Excitation-emission matrix fluorescence spectroscopy combined with chemometrics methods for rapid identification and quantification of adulteration in Atractylodes macrocephala Koidz. Microchem. J. 171, 106884. doi:10.1016/j.microc.2021.106884
Li, Y., Guo, H., Wu, Y., Geng, Q., Dong, D., Wu, H., et al. (2013). A sensitive and selective method for determination of aesculin in Cortex fraxini by liquid chromatography quadrupole time-of-flight tandem mass spectrometry and application in pharmacokinetic study. J. Anal. Methods Chem. 2013, 1–6. doi:10.1155/2013/432465
Liu, T., Li, X. G., Wang, J. Y., Liu, D. L., and Wei, Y. J. (2019). Time-resolved fluorescence and chemometrics-assisted excitation-emission fluorescence for qualitative and quantitative analysis of scopoletin and scopolin in Erycibe obtusifolia Benth. Spectrochimica Acta Part A Mol. Biomol. Spectrosc. 219, 96–103. doi:10.1016/j.saa.2019.04.019
Lopez-Fornieles, E., Brunel, G., Rancon, F., Gaci, B., Metz, M., Devaux, N., et al. (2022). Potential of multiway PLS (N-PLS) regression method to analyse time-series of multispectral images: A case study in agriculture. Remote Sens. 14 (1), 216. doi:10.3390/rs14010216
Luo, L., Bao, S., Mao, J., and Tang, D. (2016). Quality prediction and quality-relevant monitoring with multilinear PLS for batch processes. Chemom. Intell. Lab. Syst. 150, 9–22. doi:10.1016/j.chemolab.2015.11.004
Pierce, K. M., Schale, S. P., Le, T., and Larson, J. C. (2011). An advanced analytical Chemistry experiment using gas ChromatographyMass spectrometry, MATLAB, and chemometrics to predict biodiesel blend percent composition. J. Chem. Educ. 88, 806–810. doi:10.1021/ed100917x
Preeti Chandra, R. K., Saxena, A., Srivastava, M., Bahadur, L., Pal, M., Pratap Singh, B., et al. (2016). Quantitative determination of multi markers in five varieties of Withania somnifera using ultra-high performance liquid chromatography with hybrid triple quadrupole linear ion trap mass spectrometer combined with multivariate analysis: Application to pharmaceutical dosage forms. J. Pharm. Biomed. Anal. 129 (10), 419–426. doi:10.1016/j.jpba.2016.07.032
Sheng, K., Li, L., Zhang, Q., and Wang, Y. (2020). A highly sensitive sensor based on electropolymerization for electrochemical detection of esculetin. Microchem. J. 159, 105368. doi:10.1016/j.microc.2020.105368
Thomas, E. V. (2003). Non-parametric statistical methods for multivariate calibration model selection and comparison. J. Chemom. 17 (12), 653–659. doi:10.1002/cem.833
Tkachenko, S. N., Tkachenko, I. A., Shpilevaya, S. G., and Dedkov, V. P. (2021). Modelling the production process of Roman snail using RIDGE and LASSO regression. J. Phys. Conf. Ser. 1902, 012134. doi:10.1088/1742-6596/1902/1/012134
Wang, L., Wu, H. L., Yin, X. L., Hu, Y., Gu, H. W., and Yu, R. Q. (2017). Simultaneous determination of umbelliferone and scopoletin in Tibetan medicine Saussurea laniceps and traditional Chinese medicine Radix angelicae pubescentis using excitation-emission matrix fluorescence coupled with second-order calibration method. Spectrochimica Acta Part A Mol. Biomol. Spectrosc. 170, 104–110. doi:10.1016/j.saa.2016.07.018
Wang, Y., Han, F., Song, A., Wang, M., Zhao, M., and Zhao, C. (2016b). Rapid characterization of the chemical constituents of Cortex Fraxini by homogenate extraction followed by UHPLC coupled with Fourier transform ion cyclotron resonance mass spectrometry and GC-MS. J. Sep. Sci. 39 (22), 4325–4334. doi:10.1002/jssc.201600851
Wang, Y., Xu, Q., Shen, Z., Wang, Y., Dong, L., Fu, S., et al. (2019). Simultaneous determination of eight active compounds in baitouweng decotion and its single herbs. J. Chromatogr. Sci. 57 (6), 502–510. doi:10.1093/chromsci/bmz022
Wang, Y., Zhao, M., Xin, Y., Liu, J., Wang, M., and Zhao, C. (2016a). 1H NMR and MS based metabolomics study of the therapeutic effect of Cortex Fraxini on hyperuricemic rats. J. Ethnopharmacol. 185, 272–281. doi:10.1016/j.jep.2016.03.043
Wu, X., Yang, Z., Ji, G., Chen, X., and Yuan, M. (2015). Using consensus interval partial least square in near infrared spectra analysis. Chemom. Intell. Lab. Syst. 144 (15), 56–62. doi:10.1016/j.chemolab.2015.03.008
Yang, R., Dong, G., Sun, X., Yang, Y., Yu, Y., Liu, H., et al. (2018). Feasibility of the simultaneous determination of polycyclic aromatic hydrocarbons based on two-dimensional fluorescence correlation spectroscopy. Spectrochimica Acta Part A Mol. Biomol. Spectrosc. 190, 342–346. doi:10.1016/j.saa.2017.09.061
Yang, X., and Wen, W. (2018). Ridge and lasso regression models for cross-version defect prediction. IEEE Trans. Reliab. 67, 885–896. doi:10.1109/tr.2018.2847353
Zhang, L.-p., Li, Z.-y., Geng, X., Zhang, Y.-f., Tie, D., Chen, X., et al. (2021). Analysis of Chinese herbal compound preparations by ballpoint connector supported solvent microextraction and high-performance liquid chromatography with ultraviolet detection. Instrum. Sci. Technol. 50 (1), 69–82. doi:10.1080/10739149.2021.1955708
Keywords: Cortex Fraxini, excitation-emission matrix fluorescence, second-order calibration, machine learning, quantitative analysis, UPLC
Citation: Li ZY, Li XK, Lin Y, Feng N, Zhang X-Z, Li Q-L and Li BQ (2022) A comparative study of three chemometrics methods combined with excitation–emission matrix fluorescence for quantification of the bioactive compounds aesculin and aesculetin in Cortex Fraxini. Front. Chem. 10:984010. doi: 10.3389/fchem.2022.984010
Received: 01 July 2022; Accepted: 04 August 2022;
Published: 07 September 2022.
Edited by:
Shao-Hua Wang, Lanzhou University, ChinaReviewed by:
Bo Yin, Qinghai Normal University, ChinaCopyright © 2022 Li, Li, Lin, Feng, Zhang, Li and Li. This is an open-access article distributed under the terms of the Creative Commons Attribution License (CC BY). The use, distribution or reproduction in other forums is permitted, provided the original author(s) and the copyright owner(s) are credited and that the original publication in this journal is cited, in accordance with accepted academic practice. No use, distribution or reproduction is permitted which does not comply with these terms.
*Correspondence: Bao Qiong Li, bGlicTIwMTQwNkAxNjMuY29t
Disclaimer: All claims expressed in this article are solely those of the authors and do not necessarily represent those of their affiliated organizations, or those of the publisher, the editors and the reviewers. Any product that may be evaluated in this article or claim that may be made by its manufacturer is not guaranteed or endorsed by the publisher.
Research integrity at Frontiers
Learn more about the work of our research integrity team to safeguard the quality of each article we publish.