
94% of researchers rate our articles as excellent or good
Learn more about the work of our research integrity team to safeguard the quality of each article we publish.
Find out more
ORIGINAL RESEARCH article
Front. Chem., 01 September 2022
Sec. Medicinal and Pharmaceutical Chemistry
Volume 10 - 2022 | https://doi.org/10.3389/fchem.2022.948714
This article is part of the Research TopicAdvances in Natural Product Chemistry: Yunnan University 100th AnniversaryView all 11 articles
 Xiang-Yu Chen1,2,3,4†Tao Liu1,2,3,4†
 Yu-Ze Hu5Tian-Tian Qiao1,2,3,4Xiu-Juan Wu1,2,3,4Ping-Hua Sun5Chui-Wen Qian1,2,3,4,6Zhe Ren1,2,3,4,6*Jun-Xia Zheng7*
 Yi-Fei Wang1,2,3,4,6*
Twelve new guaianolide sesquiterpene lactones (1–12), along with ten known analogs (13–22) were isolated from an EtOH extract of the dried aerial parts of Artemisia vulgaris L. The new structures were elucidated via abundant spectroscopic data analyses (HRESIMS, IR, 1D, and 2D NMR), and the absolute configurations of these compounds were determined by X-ray crystallography and ECD calculations. The compounds (1−22) were identified as guaiane-type sesquiterpenes with characteristic α-methylene-γ-lactone and α,β-unsaturated carbonyl moieties. All compounds were tested for their inhibitory activity against NO production in lipopolysaccharide-stimulated RAW264.7 macrophages. The isolated sesquiterpenoids dose-dependently exhibited an NO production inhibitory activity by inhibiting the expression of inducible NO oxidase (iNOS) and cyclooxygenase-2 (COX-2) with IC50 values ranging from 1.0 to 3.6 μM. The inhibitory effect on the NO production of the compounds (1–4 and 6–22) is better than that of the positive control (dexamethasone). The different substitutions of compounds on C-8 influence anti-inflammatory effects, as evidenced by the in silico analysis of related binding interactions of new compounds (1–12) with iNOS.
Artemisia vulgaris L. (mugwort), belonging to the family of Asteraceae, is widespread throughout Asia, North America, and Europe (Weston et al., 2005). A. vulgaris, as a kind of traditional medicinal plant, has been extensively used for relieving pain and treating gynecological symptoms in folks (Hershoff, 2001; Pires et al., 2009). The chemical constituents of A. vulgaris contain mainly polysaccharides, flavonoids, terpenoids, and sterols, showing anti-tumor, anti-inflammatory, hepatoprotective, anti-oxidant, immunomodulatory, anti-allergic, and anti-bacterial activities (Schmid-Grendelmeier et al., 2003; Blagojević et al., 2006; Saleh et al., 2014; Abiri et al., 2018; Soon et al., 2019; Ekiert et al., 2020). Previous phytochemical investigations reported that sesquiterpenoids are among the most critical ingredients of secondary metabolites in the genus Artemisia and have strong application values in contemporary medicine, food, and the perfume industry (Duke and Bogenschutz, 1994; Bora and Sharma, 2011; Rasheed et al., 2017; Sundararajan and Kumari, 2017). It is widely known that artemisinin and arglabin are promising potent remedies in the treatment of malaria and cancer (Lone et al., 2015; Kumari et al., 2019). A. vulgaris and Artemisia annua L. are very similar in many aspects (Funk, 2009). Therefore, A. vulgaris is regarded as an abundant producer of biologically effective sesquiterpene lactones, prompting us to select it for a detailed study.
Inflammation is an essential immune response to pathogens, toxins, and local injuries. The beneficial effects in the physiological or acute inflammation might turn deleterious in a persistent or over-inflammatory response. Macrophage is a primary cell type in directing the host’s inflammatory and immune processes, and the excessive release of nitric oxide is an essential sign of an inflammatory response. Testing the inhibitory effect of compounds on NO’s release in macrophages is an integral approach for revealing novel small molecules with anti-inflammatory activities. Our investigation for architecturally unique and effective chemical constituents from A. vulgaris led to the isolation and structural elucidation of 22 compounds, including 12 new sesquiterpenoids. And, all the compounds were assessed for anti-inflammatory effects by LPS-induced RAW264.7 macrophage cells.
UV spectra were attained on a JASCO V-730 spectrophotometer. IR data were obtained on a Nicolet iS50 spectrometer (Thermo Fisher Scientific, United States) using KBr pellets. Optical rotations were measured using a JASCO P-2000 polarimeter at room temperature. HRESIMS spectra were recorded with an AB Sciex Triple-TOF 5600+ apparatus. ECD measurements were conducted on a Chirascan Plus spectrometer (Applied Photophysics, United Kingdom). 1D and 2D NMR spectra were obtained on a Bruker AVANCE III 500 or 600 MHz instruments. Chemical shifts were reported in ppm (δ) with coupling constants (J) in hertz. The residual signals of CDCl3 were used as references. Single crystal X-ray diffraction (Rigaku Oxford Diffraction Supernova Dual Source) was used to measure the crystal structures. Silica gel (100–200 and 200–300 meshes, Qingdao Marine Chemical Co., Ltd., China), Sephadex LH-20 gel (GE Healthcare, Sweden), YMC ODS-A-HG gel (50 μm, YMC, Japan), and MCI gel (SaiPuRuiSi. Beijing, China) were used to perform column chromatography (CC). Semi-Preparative HPLC was performed on a Wufeng LC-100 apparatus (Shanghai Wufeng Co., Ltd., China) using photodiode array (PDA) UV analysis at 210 nm with a YMC-Pack ODS-A column (250 × 10 mm, 5 μm, 3 ml/min).
The whole plant of A. vulgaris was collected from Tangyin city, Henan Province, China, in May 2018 and authenticated by Yifei Wang (College of Life Science and Technology, Jinan University). A specimen (No. 201805) was deposited in Guangzhou Jinan Biomedicine Research and Development Center, Jinan University.
After drying and grinding, the plant sample (40.0 kg) of A. vulgaris was extracted with 95% EtOH at room temperature (360 L, 3 times) in order to afford a residue (3.6 kg), which was suspended in H2O and extracted with EtOAc and PE (8 L, 3 times) to get an EtOAc partition and a PE partition, successively. The EtOAc partition (1.1 kg) was applied to the MCI gel column using gradient mixtures (10 × 150 cm, H2O-MeOH, 60:40 to 0:100), yielding 9 fractions (Fr. 1-9). Fr. 7 (120.0 g) was subsequently chromatographed on a silica gel column (100–200 mesh, 10 × 47 cm, EtOAc-PE, from 12:88 to 100:0) to afford five subfractions (Fr. 7.1–7.5). Fr. 7-2 was separated by Sephadex LH-20 column (2 × 110 cm, MeOH-CH2Cl2, 50:50) to remove pigments and obtain Fr. 7.2.1 and Fr. 7.2.2. Fr. 7.2.2 (5.7 g) was passed through an opening ODS CC (5.0 × 17.5 cm, H2O-MeOH, 50:50–100:0), and the afforded fractions were divided into Fr. 7.2.2.1–7.2.2.14, as instructed by the TLC analysis. The 14 fractions were analyzed on the HPLC-MS, and all were identified to be separated on a silica gel column (200–300 mesh, 2.5 × 5.5 cm) eluted with a stepwise gradient of EtOAc-PE (5:95 to 100:0) in the next step. Subsequently, further isolation of Fr. 7.2.2.10 (503.0 mg) on Si CC provided four subfractions (Fr. 7.2.2.10a–7.2.2.10d). The obtained Fr. 7.2.2.10b (377.0 mg) was purified by semi-preparative HPLC (H2O-MeCN, 60:40, flow rate: 3.0 ml min−1) to yield compounds 1 (36.5 mg, tR = 69.0 min), 2 (22.6 mg, tR = 74.9 min), and 3 (28.5 mg, tR = 80.4 min). Fr. 7.2.2.9 (433.0 mg) was subjected to Si CC to obtain four subfractions (Fr. 7.2.2.9a-7.2.2.9d). The obtained Fr. 7.2.2.9b (237.0 mg) was further purified by semi-preparative HPLC (H2O-MeOH, 40:60, 3.0 ml min−1) to give compounds 7 (12.7 mg, tR = 42.9 min), 13 (36.9 mg, tR = 46.8 min), and 4 (27.0 mg, tR = 49.5 min). Fr. 7.2.2.6 (483.0 mg) was subjected to Si CC to obtain six subfractions (Fr. 7.2.2.6a–7.2.2.6f). The obtained Fr. 7.2.2.6d (55.0 mg) was further purified by semi-preparative HPLC (H2O-MeCN, 59:41, 3.0 ml min−1) to give compound 18 (13.2 mg, tR = 50.0 min). Using similar separation procedures, 17 (4.1 mg, tR = 37.8 min), 6 (26.4 mg, tR = 39.2 min), and 16 (9.2 mg, tR = 57.2 min) were obtained from Fr. 7.2.2.6e (149.0 mg). Fr. 7.2.2.7 (452.3 mg) was subjected to Si CC eluted by EtOAc-PE to yield Fr. 7.2.2.7a–7.2.2.7d. Fr. 7.2.2.7b (138.8 mg), which was purified by semi-preparative HPLC (H2O-MeCN, 55:45, 3.0 ml min−1) to afford compound 15 (10.4 mg, tR = 53.0 min) and Fr. 7.2.2.7b.1 (19.8 mg). Compound 5 (2.4 mg, tR = 38.9 min) was further obtained from Fr. 7.2.2.7b.1 by semi-preparative HPLC (H2O-MeOH, 40:60, 3.0 ml min−1). In a similar way, Fr. 7.2.2.8 (542.1 mg) was treated with an Si CC yielding six sections (Fr. 7.2.2.8a–7.2.2.8f), and finally semi-preparative HPLC (H2O-MeCN, 59:41, 3.0 ml min−1) to generate compound 14 (18.4 mg, tR = 51.9 min) from Fr. 7.2.2.8d (100.2 mg). Compound 19 (16.3 mg) was precipitated from Fr. 7.2.2.8e (140.7 mg) in the form of crystals. Fr. 7.2.2.2 (300.1 mg) was then separated on Si CC to give Fr. 7.2.2.2a–7.2.2.2c. Compound 20 (18.0 mg, tR = 50.0 min) was obtained from Fr. 7.2.2.2b (181.0 mg) and 22 (12.1 mg, tR = 57.3 min) was obtained from Fr. 7.2.2.2c (31.8 mg) via semi-preparative HPLC (H2O-MeCN, 71:29, 3.0 ml min−1). Fr. 7.2.2.3 (241.8 mg) was subjected to Si CC to obtain two subfractions (Fr. 7.2.2.3a–7.2.2.3b). Fr. 7.2.2.3b (154.4 mg) was further subjected to semi-preparative HPLC (H2O-MeCN, 67:33, 3.0 ml min−1) to afford 11 (4.3 mg, tR = 46.7 min) and 21 (16.9 mg, tR = 52.1 min). Fr. 7.2.2.4 (204.4 mg) was separated by Si CC to give five subfractions (Fr. 7.2.2.4a–7.2.2.4e), and Fr. 7.2.2.4c (57.3 mg) was purified by semi-preparative HPLC (H2O-MeCN, 62:38, 3.0 ml min−1), yielding 9 (5.1 mg, tR = 39.0 min) and 10 (2.8 mg, tR = 44.7 min). Compound 12 (12.0 mg, tR = 35.2 min) was obtained from Fr. 7.2.2.4b (77 mg) by semi-preparative HPLC (H2O-MeCN, 62:38, 3.0 ml min−1). Fr. 7.2.2.5 (370.0 mg) was further subjected to CC over silica gel to yield four subfractions, followed by purification with semi-preparative HPLC (H2O-MeCN, 60:40, 3.0 ml min−1) to afford 8 (19.8 mg, tR = 54.6 min).
Colorless oil; [α]D20 + 142 (c 0.125, MeOH); UV (MeOH) λmax (log ε) 208 (3.64) nm; IR (KBr) νmax/cm−1: 3,432, 2,925, 1,767, 1,711, 1,643, 1,380, 1,273, 1,229, 1,145, 1,004. 1H and 13C NMR data (Tables 1, 3); HRESIMS m/z 367.1504 [M + Na]+ (calcd for C20H24O5Na, 367.1516).
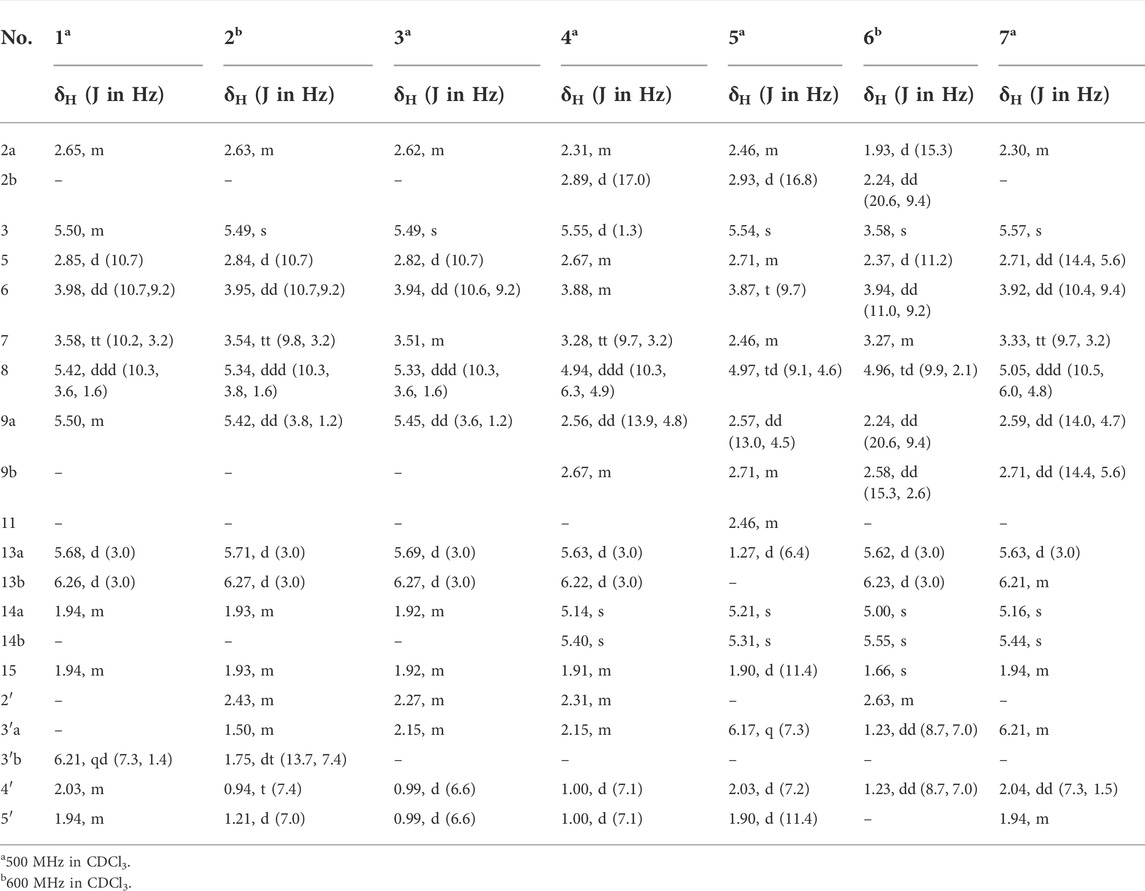
TABLE 1. 1H NMR spectroscopic data for compounds 1–7.
White powder; [α]D20 + 80 (c 0.251, MeOH); UV (MeOH) λmax (log ε) 206 (3.53) nm; IR (KBr) νmax/cm−1: 3,465, 2,968, 1,769, 1,732, 1,660, 1,379, 1,273, 1,242, 1,144, 1,006. 1H and 13C NMR data (Tables 1, 3); HRESIMS m/z 369.1662 [M + Na]+ (calcd for C20H26O5Na, 369.1672).
Colorless oil; [α]D20 + 75 (c 0.525, MeOH); UV (MeOH) λmax (log ε) 207 (3.03) nm; IR (KBr) νmax/cm−1: 3,455, 2,959, 1,769, 1,735, 1,659, 1,370, 1,274, 1,245, 1,149, 1,005. 1H and 13C NMR data (Tables 1, 3); HRESIMS m/z 369.1664 [M + Na]+ (calcd for C20H26O5Na, 369.1672).
Colorless oil; [α]D20 + 165 (c 0.387, MeOH); UV (MeOH) λmax (log ε) 206 (3.82) nm; IR (KBr) νmax/cm−1: 3,460, 2,958, 1,769, 1,735, 1,655, 1,366, 1,293, 1,264, 1,147, 1,010. 1H and 13C NMR data (Tables 1, 3); HRESIMS m/z 347.1862 [M + H]+ (calcd for C20H26O5, 347.1853).
Colorless oil; [α]D20 + 130 (c 0.132, MeOH); UV (MeOH) λmax (log ε)216 (3.60) nm; IR (KBr) νmax/cm−1: 3,469, 2,940, 1,773, 1,712, 1,640, 1,379, 1,232, 1,157, 1,004. 1H and 13C NMR data (Tables 1, 3); HRESIMS m/z 369.1660 [M + Na]+ (calcd for C20H26O5Na, 369.1672).
White powder; [α]D20 + 113 (c 0.18, MeOH); UV (MeOH) λmax (log ε) 207 (3.65) nm; IR (KBr) νmax/cm−1: 3495,2975, 1772, 1731, 1387, 1268, 1144, 1075, 965. 1H and 13C NMR data (Tables 1, 3); HRESIMS m/z 371.1450 [M + Na]+ (calcd for C19H24O6Na, 371.1465).
Colorless oil; [α]D20 + 158 (c 0.15, MeOH); UV (MeOH) λmax (log ε) 208 (3.49) nm; IR (KBr) νmax/cm−1: 3,445, 2,925, 1,768, 1,713, 1,646, 1,454, 1,263, 1,235, 1,145, 1,008. 1H and 13C NMR data (Tables 1, 3); HRESIMS m/z 345.1703 [M + H]+ (calcd for C20H24O5, 345.1697).
White powder; [α]D20 + 105 (c 0.215, MeOH); UV (MeOH) λmax (log ε) 207 (3.50) nm; IR (KBr) νmax/cm−1: 3,476, 2,934, 1,769, 1,730, 1,658, 1,469, 1,275, 1,250, 1,146, 1,011. 1H and 13C NMR data (Tables 2, 3); HRESIMS m/z 371.1456 [M + Na]+ (calcd for C19H24O6Na, 371.1465).
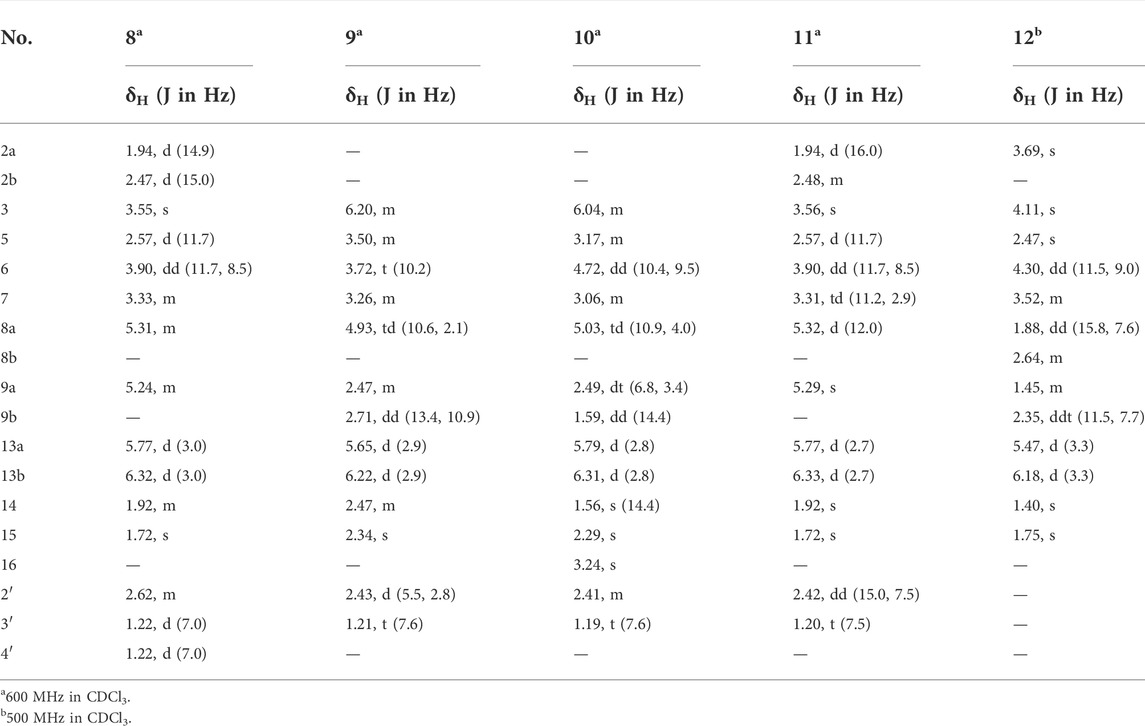
TABLE 2. 1H NMR spectroscopic data for compounds 8–12.
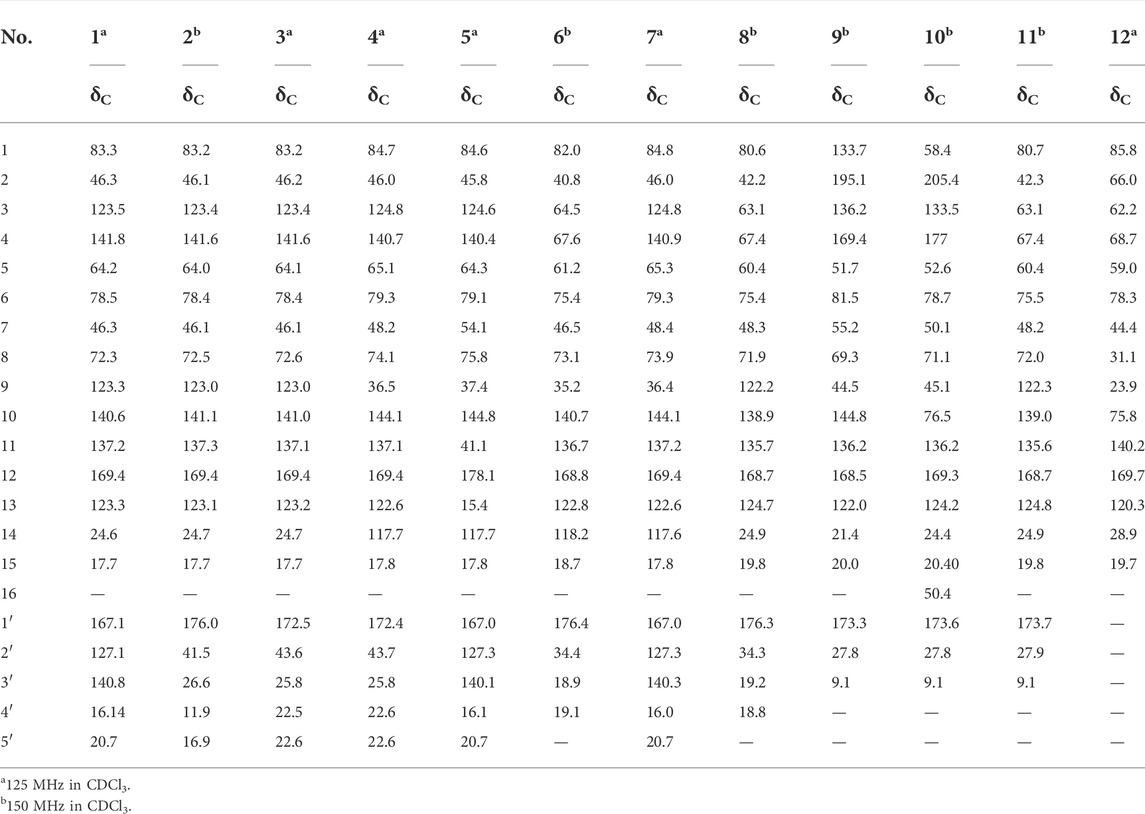
TABLE 3. 13C NMR spectroscopic data for compounds 8–12.
Colorless oil; [α]D20 + 74 (c 0.38, MeOH); UV (MeOH) λmax (log ε) 257 (2.68) nm; IR (KBr) νmax/cm−1: 2,942, 1,773, 1,737, 1,688, 1,433, 1,255, 1,197, 1,137, 1,000. 1H and 13C NMR data (Tables 2, 3); HRESIMS m/z 317.1370 [M + H]+ (calcd for C18H20O5, 317.1384).
White powder; [α]D20 + 127 (c 0.18, MeOH); UV (MeOH) λmax (log ε) 223 (4.33) nm; IR (KBr) νmax/cm−1: 2,944, 1,770, 1,736, 1,629, 1,460, 1,269, 1,183, 1,143, 1,022. 1H and 13C NMR data (Tables 2, 3); HRESIMS m/z 349.1644 [M + H]+ (calcd for C19H24O6, 349.1646).
White powder; [α]D20 + 103 (c 0.23, MeOH); UV (MeOH) λmax (log ε) 208 (4.38) nm; IR (KBr) νmax/cm−1: 3,465, 2,933, 1,761, 1,736, 1,373, 1,274, 1,241, 1,142, 999. 1H and 13C NMR data (Tables 2, 3); HRESIMS m/z 357.1301 [M + Na]+ (calcd for C18H22O6Na, 357.1309).
White powder; [α]D20 + 131 (c 0.18, MeOH); UV (MeOH) λmax (log ε) 211 (3.96) nm; IR (KBr) νmax/cm−1: 3,328, 2,942, 1,769, 1,642, 1,452, 1,390, 1,253, 1,143, 1,018, 936. 1H and 13C NMR data (Tables 2, 3); HRESIMS m/z 315.1008 [M + H]+ (calcd for C15H19ClO5, 315.0994).
All crystals were obtained by recrystallization from MeOH. The X-ray diffraction data of compounds 6, 8, 10, and 12 were collected on an Agilent SuperNova four-circle instrument by means of Cu Kα radiation. The structures were solved by direct methods and refined by the full-matrix least-squares process on F2 using the SHELXTL or the Olex2 software package. X-ray data can be obtained free from the Cambridge Crystallographic Data Centre via https://www.ccdc.cam.ac.uk/structures/.
Crystal data for C19H24O6 (M = 348.38 g/mol): orthorhombic, space group P212121 (no. 19), a = 8.6975 (2) Å, b = 9.7500 (2) Å, c = 20.3304 (5) Å, V = 1,724.03 (7) Å3, Z = 4, T = 170.00 (10) K, μ(Cu Kα) = 0.823 mm−1, Dcalc = 1.342 g/cm3, 9,848 reflections measured (8.698° ≤ 2Θ ≤ 147.768°), 3423 unique (Rint = 0.0325, Rsigma = 0.0320) which were used in all calculations. The final R1 was 0.0356 (I > 2σ (I)) and wR2 was 0.0914 (all data). The goodness of fit on F2 was 1.047. Flack parameter: −0.04 (9). CCDC 2164101.
Crystal data for C19H24O6 (M = 348.38 g/mol): orthorhombic, space group P212121 (no. 19), a = 9.34750 (10) Å, b = 10.61860 (10) Å, c = 17.3505 (2) Å, V = 1,722.16 (3) Å3, Z = 4, T = 179.99 (10) K, μ(Cu Kα) = 0.824 mm−1, Dcalc = 1.344 g/cm3, 18,414 reflections measured (9.766° ≤ 2Θ ≤ 147.578°), 3,462 unique (Rint = 0.0271, Rsigma = 0.0160) which were used in all calculations. The final R1 was 0.0293 (I > 2σ(I)) and wR2 was 0.0776 (all data). The goodness of fit on F2 was 1.090. Flack parameter: 0.01 (5). CCDC 2164105.
Crystal data for C19H24O6 (M = 348.38 g/mol): monoclinic, space group P21 (no. 4), a = 8.4422 (4) Å, b = 7.1913 (4) Å, c = 15.2596 (6) Å, β = 99.791 (4)°, V = 912.92 (8) Å3, Z = 2, T = 169.99 (10) K, μ(Cu Kα) = 0.777 mm−1, Dcalc = 1.267 g/cm3, 10,067 reflections measured (5.878° ≤ 2Θ ≤ 148.026°), 3411 unique (Rint = 0.0440, Rsigma = 0.0498) which were used in all calculations. The final R1 was 0.0445 (I > 2σ(I)) and wR2 was 0.1126 (all data). The goodness of fit on F2 was 1.053. Flack parameter: −0.08 (15). CCDC 2164102.
Crystal data for C15H19ClO5 (M = 314.75 g/mol): orthorhombic, space group P212121 (no. 19), a = 5.80960 (10) Å, b = 14.6880 (2) Å, c = 16.6063 (2) Å, V = 1417.04 (4) Å3, Z = 4, T = 200.00 (10) K, μ(Cu Kα) = 2.575 mm−1, Dcalc = 1.475 g/cm3, 14,845 reflections measured (8.036° ≤ 2Θ ≤ 147.536°), 2,827 unique (Rint = 0.0403, Rsigma = 0.0232) which were used in all calculations. The final R1 was 0.0300 (I > 2σ(I)) and wR2 was 0.0760 (all data). The goodness of fit on F2 was 1.090. Flack parameter: 0.002 (7). CCDC 2164103.
Conformational analyses for new compounds were carried out using MOE software with MMFF94s. The obtained stable conformers were optimized at the b3lyp/6-31+g(d) level in the gas phase and further subjected to ECD calculations at cam-b3lyp/6-31+g(d) level in the PCM model of methanol using the Gaussian 09 program. The ECD spectra were weighted according to the Boltzmann distributions.
For the cytotoxicity assay, RAW 264.7 cells were grown in DMEM containing 10% FBS and cultured at 37°C. Then, the cells were seeded in a 96-well plate (1 × 10⁴ cells/well) before the cells were incubated for 24 h in various concentrations of compounds (3.125–200 μM). Cell viability was examined using a CCK8-kit. The CCK8 solution (5 µl) was added to each well and incubated for 1–2 h at 37°C. The OD value at 450 nm was quantified by Graphpad software, and the corresponding 50% cytotoxic concentration (CC50) of the compounds was subsequently obtained.
The level of accumulated nitrite in the culture media reflected the level of NO using the classic Griess reagent (Beyotime, Jiangsu, China). The RAW264.7 cells were seeded in a 96-well plate with a 6 ×10⁴ cells/ml density for the indicated time. Then, the cells were pretreated for 1 h with test compounds (0.25–4 μM), followed by stimulation with LPS (1 μg/ml) for 18 h. Finally, 50 ul of the culture supernatant was mixed with an equal amount of the Griess reagent, and the optical densities at 570 nm were read using a microplate reader. The nitric oxide concentration of the samples was calculated according to the standard curve.
RAW264.7 cells were seeded in a six-well plate (10 × 105 cells/well) for the indicated time. Cells were pretreated with compound 1 (0.5, 1, and 4 μM) for 1 h and then stimulated with LPS (1 ug/mL) for 18 h. Total cellular RNA was extracted with Trizol reagent (TIANGEN, Beijing, China). One microgram of RNA per sample was reverse-transcribed into cDNA using the PrimeScript RT Reagent Kit (TAKARA, Dalian, China). qPCR assays were performed by the CFX96 Touch Real-Time PCR Detection System (Bio-Rad). The following primers were used: iNOS (forward, 5′-AAA CCC CAG GTG CTA TTC CC-3′; reverse, 5′-TGG GTC CTC TGG TCA AAC TC-3′), COX-2 (forward, 5′-ATT CCA AAC CAG CAG ACT CAT A-3′; reverse, CTT GAG TTT GAA GTG GTA ACC G-3′), and GAPDH (forward, 5′- GTC ATT GAG AGC AAT GCC AG-3′; reverse, 5′-GTG TTC CTA CCC CCA ATG TG-3′). All relative gene expression levels were normalized to the internal reference (GAPDH).
RAW264.7 cells with the indicated treatment were harvested and treated in a RIPA lysis buffer (Beyotime, Shanghai, China) containing a protease and phosphatase inhibitor cocktail (Beyotime, Shanghai, China) to obtain the lysates. Then, the total proteins were measured using the bicinchoninic acid (BCA) protein assay kit (Beyotime, Shanghai, China) and regulated by a loading buffer and the RIPA lysis buffer. The samples were separated by sodium dodecyl sulfate polyacrylamide gel electrophoresis (SDS-PAGE) and then transferred to polyvinylidene difluoride membranes (Millipore), followed by blocking with 5% non-fat milk. The membranes were incubated with primary antibodies overnight at 4°C, followed by incubation with specific secondary antibodies. Finally, the protein bands were detected using the ImageJ software (Bio-Rad, Hercules, CA, United States).
In order to explore the possibility of compounds 1–6 binding to the INOS target, Autodock vina and AutoDockTools-1.5.6 (Vina, 2010; Forli et al., 2016) were used to predict the free binding energy. Autodock vina used the Broyden-Fletcher-Goldfarb-Shanno (BFGS) 19 method to obtain the optimal conformation (Nguyen et al., 2020). First, the three-dimensional structure of INOS (PDB ID:3E6T) was obtained from the Protein Data Bank (http://www.rcsb.org) (Burley et al., 2021), whose resolution was 2.5 Å. The three-dimensional structure of compounds 1–6 was built and optimized by ChemDraw Ultra 8.0. Pymol molecular graphics software and AutodockTools-1.5.6 were used to remove ligand, dehydrate, hydrogenate, and charge the target (Liang, 2003; Seeliger and de Groot, 2010). The cubic grid box was calculated by AutoDockTools-1.5.6 positioned at the center of (122.65, 114.0, 36.63) with a spacing of 0.375 Å. All docking parameters were set to default values, but the modes and exhaustiveness were set to 10. The docking results were further analyzed and presented using pymol.
Artemvulactone H (1), obtained as a colorless oil, had a molecular formula of C20H24O5 deduced from the molecular ion at m/z 367.1504 ([M + Na]+, calcd for 367.1516) in the HRESIMS, indicating nine degrees of unsaturation. The IR absorptions of 1 suggested typical absorption bands for hydroxy (3,432 cm−1), carbonyl (1,767 and 1,711 cm−1), and olefinic (1,643 cm−1) functionalities. The 1H NMR spectrum (Table 1) of 1 displayed signals for a vinyl methyl observed at δH 1.94 (3H, m, H-15), a pair of terminal olefinic protons at δH 5.68 (1H, d, J = 3.0 Hz, H-13a), and 6.26 (1H, d, J = 3.0 Hz, H-13b), two oxygenated methines at δH 3.98 (1H, dd, 10.7, 9.2 Hz, H-6), and 5.42 (1H, ddd, 10.3, 3.6, 1.6 Hz, H-8). Apart from these dates, the 13C NMR (Table 3) and DEPT (Supplementary Figure S3) data of 1 with the aid of HSQC analysis exhibited 15 carbon resonances for 2 methyls, 2 methylenes, 6 methines, and 5 quarternary carbons. Comparison of the NMR spectra of 1 (Tables 1, 3) with 1α-hydroxy-3(4), 9(10), 11(13)-trien-8α-senecioyloxyguai-12,6α-olide showed that they had a closely relative stereochemistry except for a different ester side chain, indicating that 1 was a characteristic guaiane-type sesquiterpene lactone skeleton (Huang et al., 2010). A mixture of the 1H NMR spectrum at δH 6.21 (1H, qd, 7.3, 1.4 Hz, H-3′), 2.03 (3H, m, H-4′), and 1.94 (3H, m H-5′) and the 13C NMR spectrum at δc 167.1 (C-1′), 127.1 (C-2′), 140.8 (C-3′), 16.14 (C-4′), and 20.7 (C-5′) of 1 displayed signals for an angeloyloxy group. The aforementioned conclusion was confirmed again by the correlation of H-3′/H3-4′ in the 1H–1H COSY spectrum and the correlations from H-3′ to C-1′, C-2′, and C-4′, from H3-4′ to C-2′, C-3′, and C-5′, and from H3-5′ to C-1′, C-2′, and C-3′ in the HMBC. The proton signal at δH 5.42 (H-8) disclosed a 3J coupling with the carbonyl carbon signal at δC 167.1 (C-1′), indicating the connection of this group to C-8. The 1H–1H COSY data revealed two discrete proton spin systems, which were H-5/H-6/H-7/H-8, and H-3′/H3-4′. The HMBC correlations of H-6, H-7/C-12, H-5/C-6, and C-7 located the lactone group at C-6 and C-7 (Figure 1). Furthermore, the anguloid group and hydroxyl group were located at C-8 and C-1 based on the correlations of H-8 to C-1′, H3-14 to C-1, H-3 to C-1, and H-5 to C-1 in the HMBC experiment.
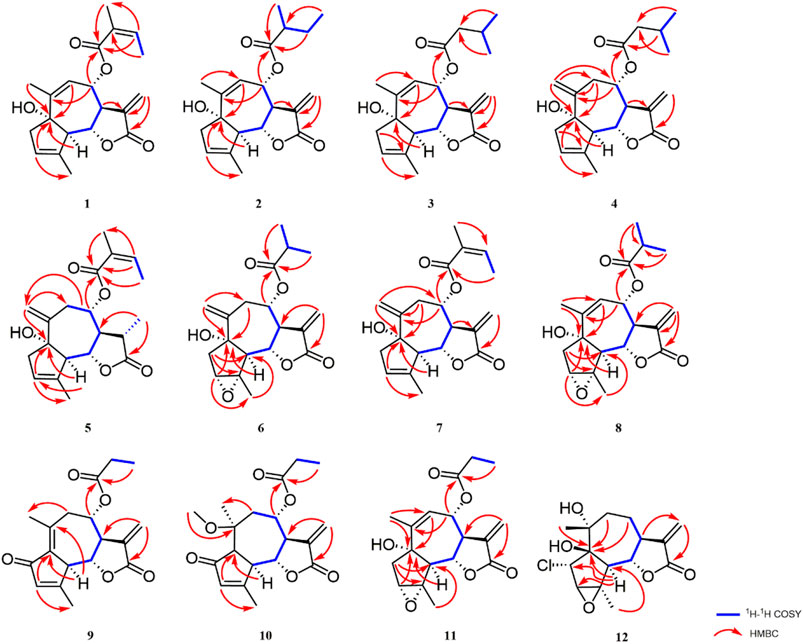
FIGURE 1. Key HMBC and 1H–1H COSY correlations of compounds 1–12.
The relative configuration was determined by the correlations between H-7/H2-13, H-7/H-5, and H-6/H-8 in the NOESY spectrum (Figure 2). The absolute configuration of 1 was assigned according to the ECD calculations on the arbitrarily chosen enantiomers. Based on the evidence mentioned previously, the stereochemistry of 1 was eventually assigned as 1S,5R,6S,7R,8S.
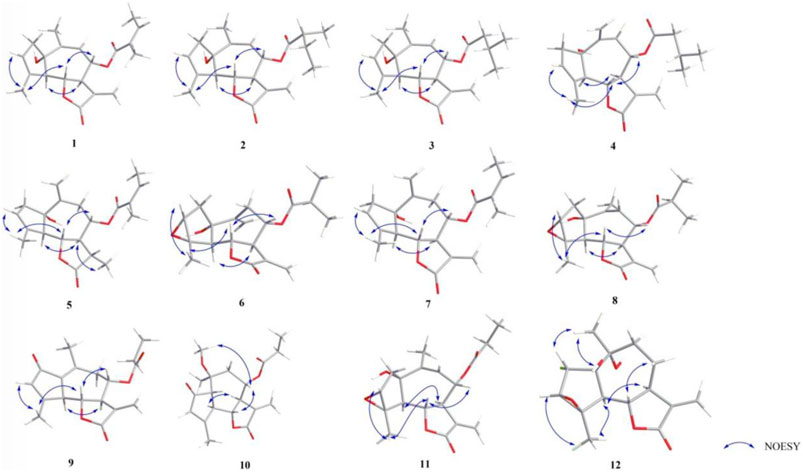
FIGURE 2. NOESY correlations of compounds 1–12.
Artemvulactone I (2) was obtained as a white amorphous powder. The molecular formula of 2 (C20H26O5) was established by the [M + Na]+ ion peak at m/z 369.1662 (calcd for 369.1672) in the HRESIMS (Supplementary Figure S18). The existence of hydroxy (3,465 cm−1), carbonyl (1,769 and 1,732 cm−1), and olefinic (1651 cm−1) groups were reflected in the IR spectrum (Supplementary Figure S20). The 1H/13C-NMR (Tables 1, 3), 1H–1H COSY, HMQC, and HMBC spectra of 2 were similar to 1, with a difference in the C-8 substituent. The angeloyloxy group in 1 was replaced by the 2′-methylbutyryloxy unit in 2. 1H NMR signals supported the aforementioned deduction at δH 2.43 (1H, m, H-2′), 1.50 (1H, m, H-3′a), 1.75 (1H, dt, 13.7, 7.4 Hz, H-3′b), 0.94 (3H, t, 7.4 Hz, H-4′), and 1.21 (3H, d, 7.0 Hz, H-5′) and the 13C NMR signals at δC 176.0 (C-1′), 41.5 (C-2′), 26.6 (C-3′), 11.9 (C-4′), and 16.9 (C-5′) of 2. The absolute configuration of 2 was compared to 1, which was determined by the NOESY and ECD spectra as shown.
Artemvulactone J (3) and Artemvulactone K (4) were both obtained as colorless oils and had the same molecular formula of C20H26O6 as that of 2 by HRESIMS. Similar to 2, their NMR spectra revealed that 3 and 4 also possessed a guaianolide skeleton with characteristic α-methylene-γ-lactone [δH 5.69 (1H, d, 3.0 Hz, H-13a), 6.27(1H, d, 3.0 Hz, H-13b), δC 137.1 (C-11), 169.4 (C-12), 123.2(C-13)]. The 1H and 13C NMR spectra of 3 were almost superimposable to those of 2 except for the absence of 2′-methylbutyryloxy moiety. The 1H NMR signals at δH 2.27 (2H, m, H-2′), 2.15 (1H, m, H-3′), 0.99 (3H, d, 6.6, H-4′), and 0.99 (3H, d, 6.6, H-5′) indicated that 3 has an isovaleryloxy moiety rather than a 2′-methylbutyryloxy group, which was supported by the 1H–1H COSY cross peaks of H2-2′/H-3′/H3-4′(H3-5′) and HMBC spectrum from H-8 to C-1′ and H2-2′/H-3′ to C-1′. The 1D NMR spectra of 4 (Tables 1, 3) were very similar to compound 3, except that a pair of terminal olefinic protons at δH 5.14 (1H, s, H-14a) and 5.40 (1H, s, H-14b) in 4. The relative configurations of compounds 3 and 4 were determined by NOESY correlations and were similar to those of 2. The 1S,5R,6S,7R,8S absolute configuration of compounds 3 and 4 (Figure 3) was verified based on comparing its ECD spectrum with that of 2.
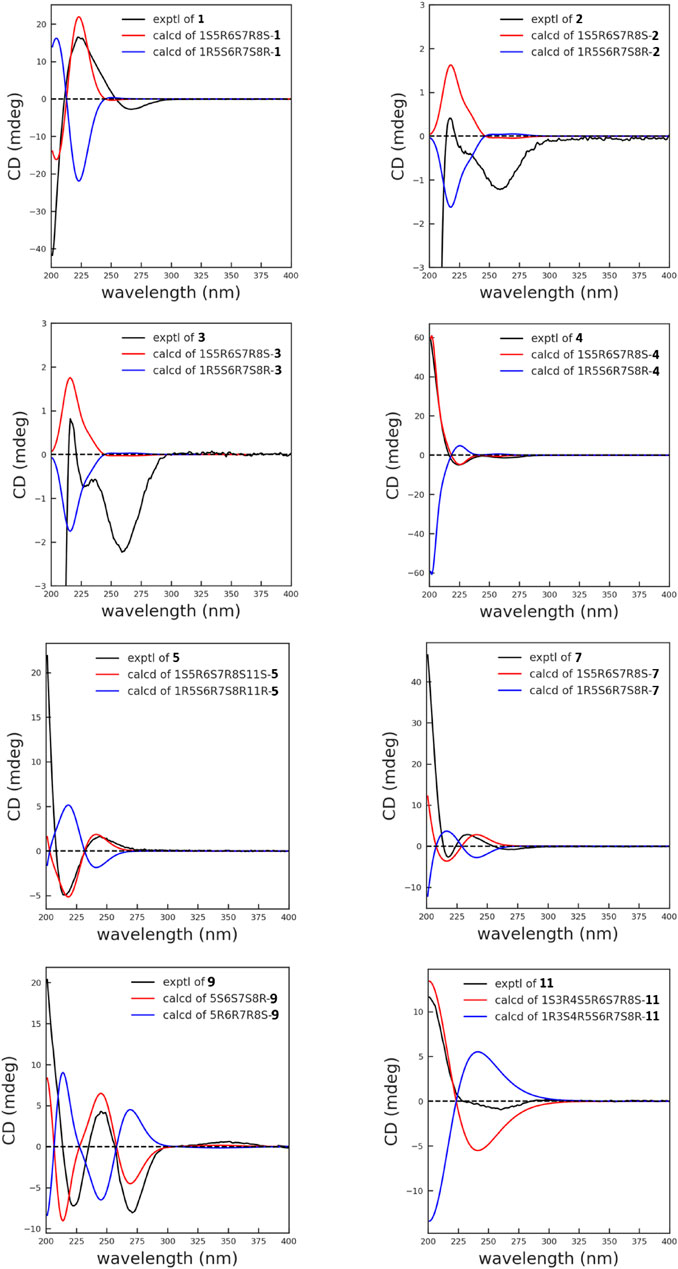
FIGURE 3. Experimental and calculated ECD spectra of compounds 1–5, 7, 9, and 11 in MeOH.
Artemvulactone L (5) was determined as C20H26O5 by HRESIMS ([M + Na]+, m/z 369.1660, calcd for 369.1672). The IR spectrum revealed the presence of hydroxy (3,469 cm−1), carbonyl (1,773 and 1,712 cm−1), and olefinic (1640 cm−1) groups. The 1H and 13C NMR spectra of 5 (Tables 1, 3) were comparable to 1 except for the presence of a pair of terminal olefinic protons at δH 5.21(1H, s, H-14a), δH 5.31(1H, s, H-14b), and the absence of a terminal double bond at C-13. The HMBC correlation between the proton signal at δH 4.97 (1H, td, 9.1, 4.6 Hz, H-8) and the carbonyl carbon signal at δC 167.0 (C-1′) demonstrated an angeloyl group attached to C-8 (Figure 1). Finally, the stereochemistry of 5 was determined in a manner similar to that of 1.
Artemvulactone M (6) was determined as C19H24O6 according to the HRESIMS ([M + Na]+, m/z 371.1450, calcd for 371.1465). The IR absorption bands at 3,495, 1,772, and 1,731 cm−1 were marks of hydroxy and carbonyl groups. The 1H and 13C NMR spectra of 6 were comparable to 4, but the isovaleryloxy group is absent. It could be aided by the HMBC correlation between the proton signal at δH 4.96 (1H, td, 9.9, 2.1 Hz, H-8) and the carbonyl carbon signal at δC 176.4 (C-1′). In addition, the main difference was ascribed to the absence of a cyclic olefinic bond at C-3 and C-4 in 6, but an additional ring connected via an oxygen atom. The aforementioned reasoning was based on the correlation of H-2′/H3-3′ (H3-4′) in the 1H−1H COSY spectrum and the cross peak from H-2′/H3-3′ (H3-4′) to C-1′ in the HMBC spectrum (Figure 1). The single-crystal X-ray diffraction experiment with Cu Kα radiation [CCDC,2164101] confirmed the 2D structure of 6 and defined its absolute configuration as 1S,3R,4S,5R,6S,7R,8S. Therefore, the absolute configuration of compound 6 was established as shown (Figure 4).
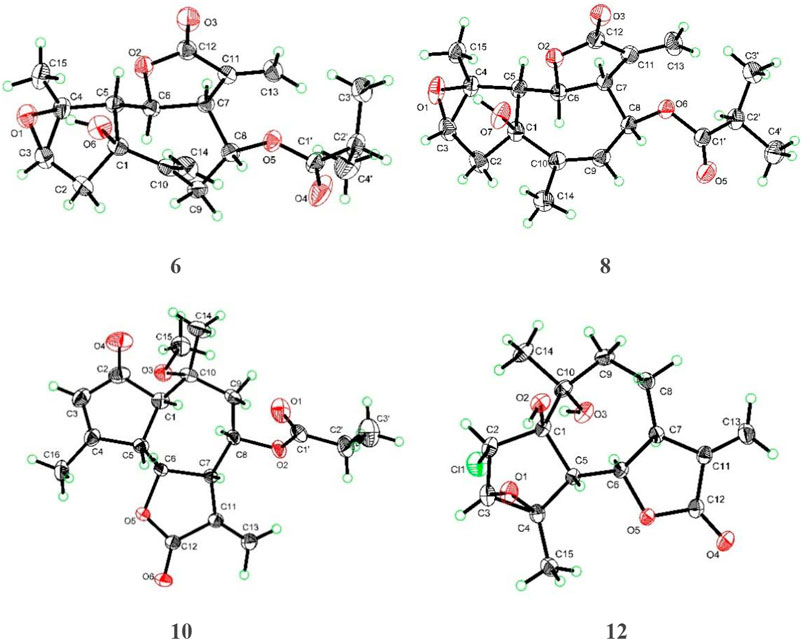
FIGURE 4. X-ray crystallographic analysis of compounds 6, 8, 10, and 12.
Artemvulactone N (7) was obtained as a colorless oil. The molecular formula C20H24O5 was deduced from the HRESIMS at m/z 345.1703 [M + H]+ (calcd for 345.1697). The IR spectra revealed that 7 possessed hydroxy, carbonyl, and olefinic groups. In the NMR spectra of 7 (Tables 1, 3), the signals at δH 5.16 (1H, s, H-14a), 5.44 (1H, s, H-14b), δC 144.1 (C-10), and 117.6 (C-14) revealed that a terminal double bond was located at C-10, which was supported by the HMBC correlations from H2-14 to C-1 and C-8. The NMR spectra of 7 (Tables 1, 3) were very similar to compound 4, except that the isovaleryloxy substituent at C-8 in 4 was replaced by an angeloyloxy group in 7. The absolute configuration of 1S,5R,6S,7R,8S was confirmed by the comparison of experimental and calculated ECD spectra (Figure 3).
Artemvulactone O (8) gave a molecular formula of C19H24O6 as defined by the HRESIMS ion at m/z 371.1456 [M + Na]+ (calcd for 371.1465). The presence of hydroxy (3,476 cm−1), carbonyl (1,769 and 1,730 cm−1), and olefinic (1,658 cm−1) functionalities was evident from the spectroscopic data. The 1H and 13C NMR spectra of 8 manifested that it was structurally similar to 6. The main difference was the position of a double bond, which was verified by the HMBC correlations from H3-14 to C-9 (Figure 1). The absolute configuration of 1S,3R,4S,5R,6S,7R,8S was determined by means of a single crystal X-ray crystallographic diffraction experiment with Cu Kα radiation (CCDC, 2164105, Figure 4).
Artemvulactone P (9) was isolated as a colorless oil. According to the HRESIMS ([M + H]+, m/z 317.1370, calcd for 317.1384) and the 1D NMR spectrum, the molecular formula of 9 was assigned as C18H20O5. The IR absorption bands at 1,773, 1,737, and 1,673 cm−1 confirmed the existence of carbonyl and olefinic groups, with one less hydroxyl group than compound 1. Additionally, the propionyl group was attached to oxygen-linked carbon at C-8, which could be demonstrated by the signals at δC 173.3 (C-1′), 27.8 (C-2′), and 9.1 (C-3′). In the 1D NMR spectrum, the characteristic signals of methylene [δH 2.65 (2H, m, H-2); δC 46.3 (C-2)] in 1 were replaced by a carbonyl in 9 at C-2 (δC 195.1). Based on the application of the TD-SCF ECD calculation method, the similarity of the calculated ECD spectrum with its experimental spectrum indicated the 5R,6R,7S,8R configuration of 9 (Figure 3).
Artemvulactone Q (10) showed the same molecular formula as that of compound 8. The carbonyl and olefinic groups also existed in the structure of 10, which were attributable to the IR absorptions at 1,770, 1,736, and 1,629 cm−1. The compound 10 differed from 9 by one more methoxy group and one less cyclic olefinic bond in its chemical structure at C-10. The aforementioned analysis was confirmed by the 1H–1H COSY correlations of H-1/H-9/H3-14/H3-16 and HMBC correlations from δH 3.24 (–OCH3) to δC 76.5 (C-10). The absolute configuration of compound 10 was established based on a single-crystal X-ray crystallographic diffraction experiment with Cu Kα radiation (Figure 4).
Artemvulactone R (11) was obtained as a white powder and assigned a molecular formula of C18H22O6 by HRESIMS and 13C NMR data. The IR absorption bands of 11 implied hydroxy, carbonyl, and olefinic groups. The 1D NMR data (Tables 2, 3) revealed a definite structural variation between 11 and 8. The main difference was that, compound 11 possessed one less methyl group at C-2′ [δH 2.42 (2H, dd, 15.0, 7.5 Hz, H-2′); δC 27.9 (C-2′)], which was defined based on the 1H−1H COSY correlations of H2-2′/H3-3′and HMBC correlations from H3-3′ to C-1′ and C-2′ (Figure 1). The calculated ECD spectrum for the absolute configuration was consistent with the experimental ECD spectrum of compound 11.
Artemvulactone S (12), isolated as a white powder, had the molecular formula of C15H19ClO5, implying six degrees of unsaturation. The IR absorption bands at 3,328, 1,769, and 1,642 cm−1 suggested hydroxy, carbonyl, and olefinic groups. The resonances for two methyl singlets at δΗ 1.40 (H3-14) and 1.75 (H3-15), a pair of terminal olefinic protons at δΗ 5.47 (1H, d, J = 3.3 Hz, H-13a) and 6.18 (1H, d, J = 3.3 Hz, H-13b) were observed in the 1H NMR spectrum. The 13C NMR and HSQC spectra revealed that 12 is a sesquiterpene lactone. And the absolute configuration of compound 12 was determined by single crystal X-ray diffraction (Cu Kα) (Figure 4).
Additionally, 10 known compounds were isolated and their structures were identified by comparing their physical and spectroscopic data with the reported data (Figure 5). The known compounds were identified as 1α-hydroxy-8α-methylbutyroxy-3(4),10(14),11(13)-trienguai-12,6α-olide (13) (Huang et al., 2010), 1α-hydroxy-8α-senecioyloxy-3(4),10(14),11(13)-trienguai-12,6α-olide (14) (Huang et al., 2010), 8-epi-Tiglylrupicolin B (15) (Ober et al., 1985), 8-angeloyloxy-1α-hydroxy-3α, 4α-epoxy-5α, 7αH-10(14), 11(13)-guaiadien-12,6α-olide (16) (Jin et al., 2004), 8-epi-isobutyrylrupicolin B (17) (Ober et al., 1984), 8-epi-isobutyrylrupicolin (18) (Ober et al., 1984), 3α,4α-epoxyrupicolin E (19) (Jin et al., 2004), dehydroleucodine (20) (de Heluani et al., 1989), (+)-Arteglasin A (21) (Lee et al., 1971), and Dehydromatricarin (22) (Bohlmann and Zdero, 1978).
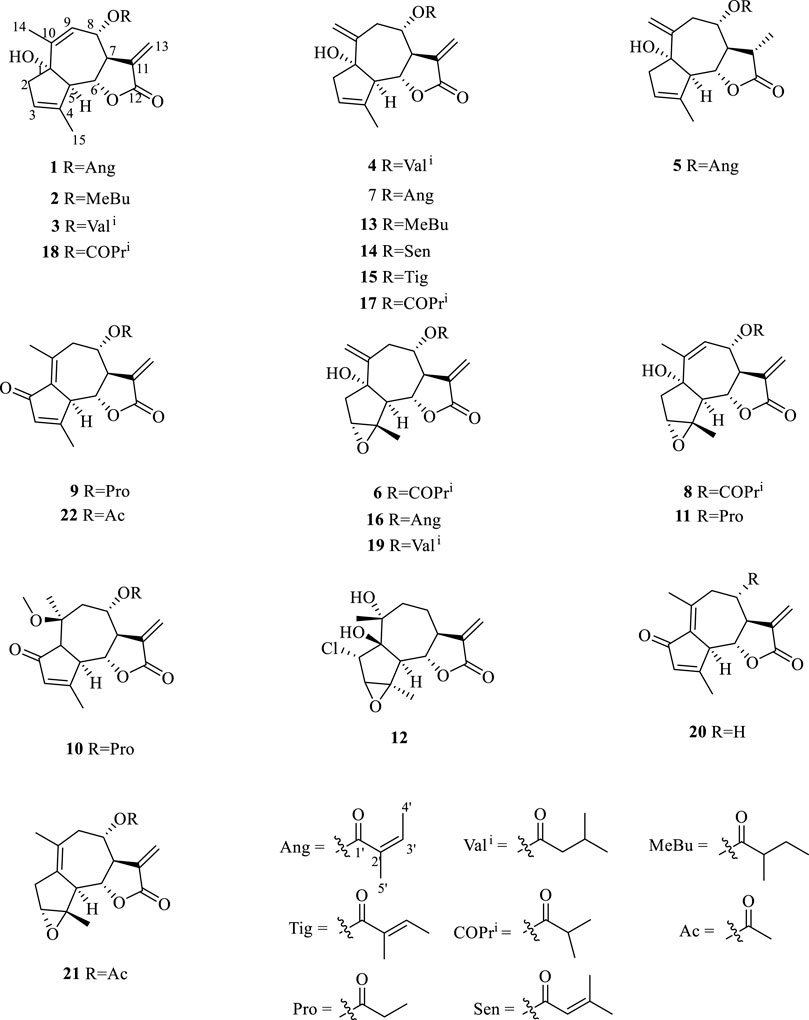
FIGURE 5. Structures of compounds 1–22 isolated from A. vulgaris.
Inhibition of NO overexpression is an essential indicator for evaluating small molecules with anti-inflammatory activities. Thus, the inhibitory effects of compounds 1–22 on LPS-mediated NO production were tested, and it was found that isolated sesquiterpenoids except compound 5 exhibited a concentration-dependent NO production inhibitory activity with IC50 values ranging from 1.0 to 3.6 μM (Table 4). It was preliminarily concluded that the isolated compounds had the potential to be developed into anti-inflammatory drugs.
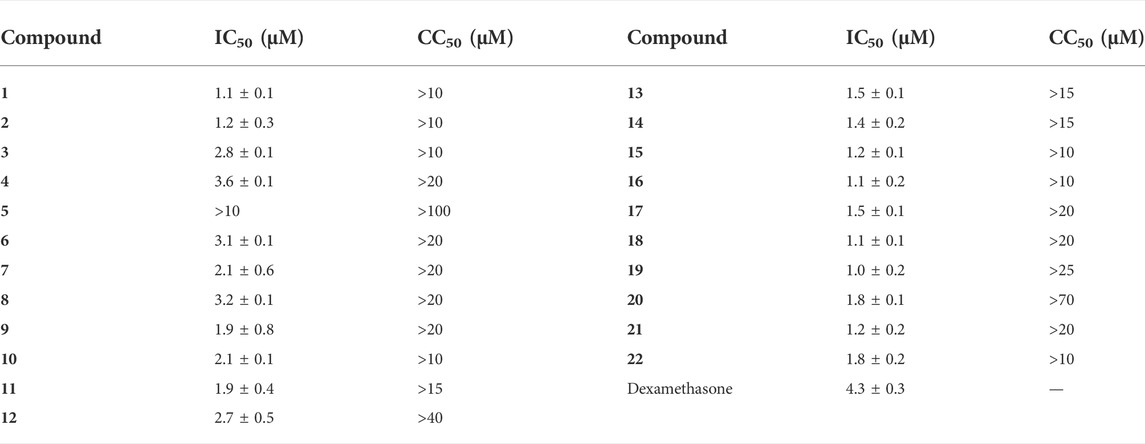
TABLE 4. Cytotoxicity against RAW264.7 cells and NO Inhibition of 1–12 and Dexamethasone toward LPS-Induced RAW264.7 cells (Mean ± SD).
NO production is directly related to the expressions of iNOS and COX-2. We selected the most active compound 1 for gene and protein level verification. The results of experiments demonstrated that compound 1 at 4 μM reduced more expressions of iNOS and COX-2 than the positive drug (Dexamethasone) in LPS-induced macrophages by quantitative real-time PCR and Western blotting (Figures 6, 7). By comparing the structure and activity of the compounds, we preliminarily summarize the structure–activity relationship of guaiane-type sesquiterpene lactones in inhibiting inflammation: α-methylene-γ-lactone, α,β-unsaturated carbonyl moieties, and the ester side chain at C-8 are critical for cytotoxic activity.
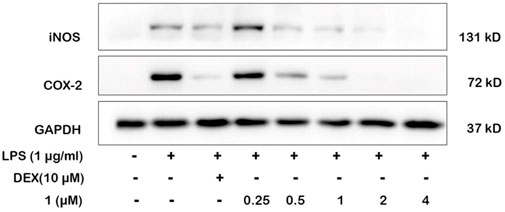
FIGURE 6. Effects of 1 and positive control on iNOS and COX-2 protein levels in RAW264.7 cells by Western blotting. Cells were pretreated with different concentrations of 1 (0.25, 0.5, 1, 2, and 4 μM) and DEX (10 μM) for 1 h and then stimulated with LPS (1 μg/ml) for 24 h.
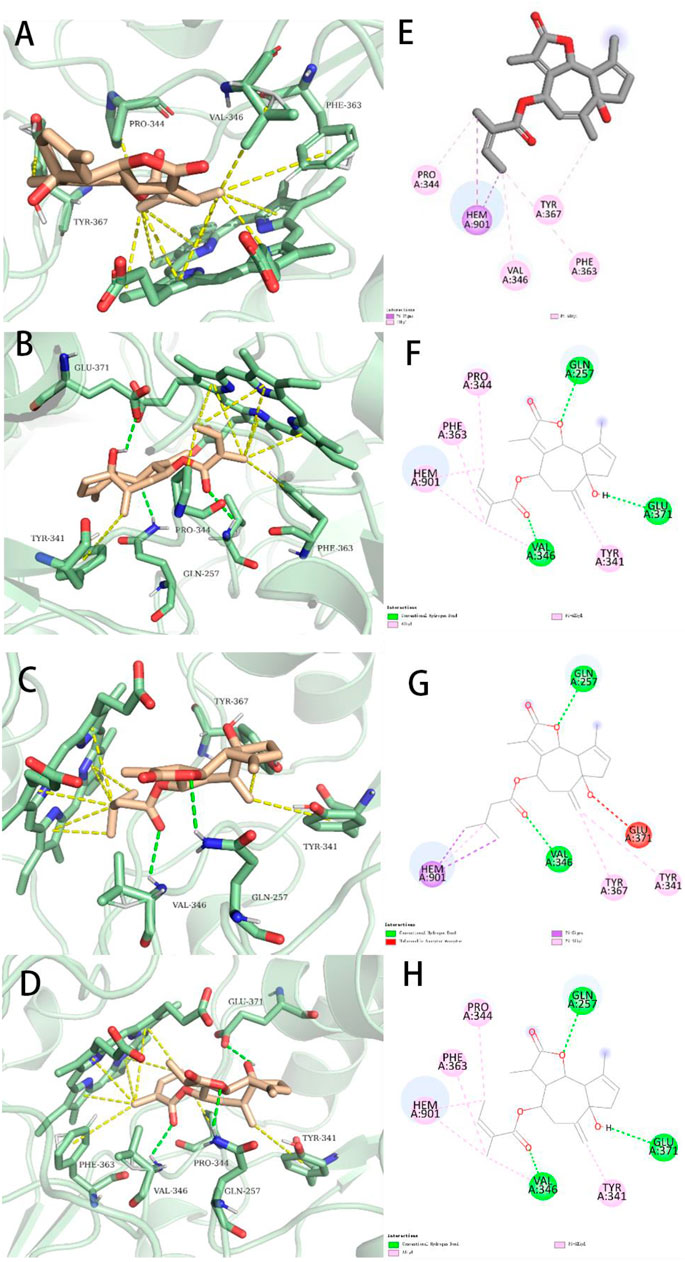
FIGURE 7. Representations of lowest energy docking poses of compounds 1 (A), 7 (B), 4 (C), and 5 (D) bound to the iNOS protein (PDB ID:3E6T). Intermolecular interactions between iNOS and compounds 1 (E), 7 (F), 4 (G), and 5 (H) are highlighted by 2-D interaction maps.
To better compare the binding ability of docking compounds, dexamethasone and INOS were used for redocking. Molecular docking results showed that 1–12 and dexamethasone had a good interaction with the INOS targets by targeting residues in pockets. Figure 8 revealed the predicted geometry of 1, 7, 4 and 5 bound to the INOS protein. It was conformable to the results obtained through biological experiments. The free-binding energy and the number of binding residues are shown in Table 5, and that compounds 7, 5, and 4 were predicted to possess a stronger association with the protein. Previous research has shown that the type of substituent at C-8 also affects the compound activity: isovaleryloxy > acetyl > angeloyloxy > methylbutyryloxy (Sun et al., 2020). Combined with biological experiments, the hydroxyl group at C-1 was inferred to influence compound activity, and the following trend in activity for the side chain was summarized: angeloyloxy > methylbutyryloxy > isovaleryloxy. The aforementioned information rationalizes the results of molecular docking and biological experiments.
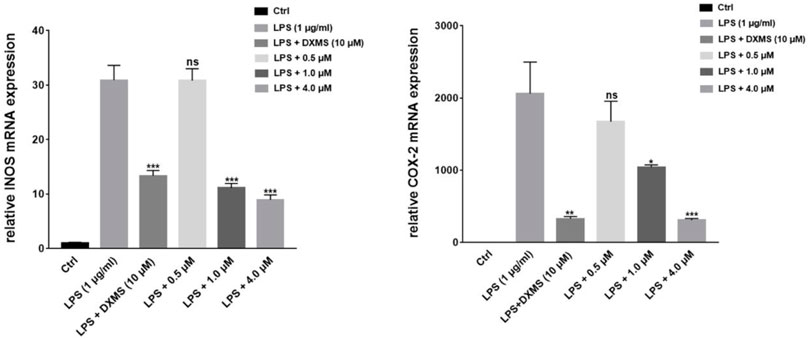
FIGURE 8. Compound 1 on the downregulation of LPS-induced iNOS and COX-2 mRNA expression in RAW264.7 cells. *p < 0.05, **p < 0.01, ***p < 0.001, compared to the LPS-treated groups.
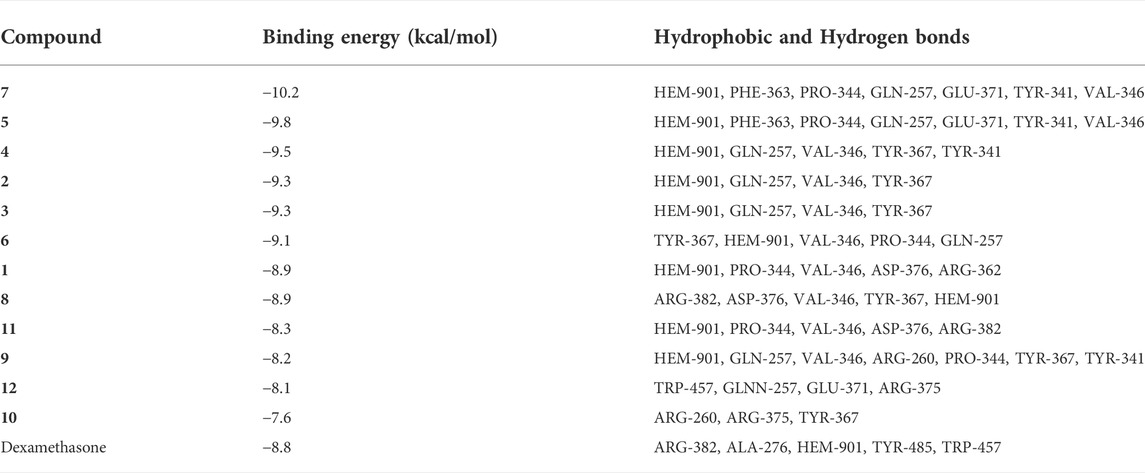
TABLE 5. Binding energy, Hydrophobic and Hydrogen bonds formed between INOS (PDB ID:3E6T) and ligands (1–12 and INOS co-crystal ligand 2650707-81-4).
In conclusion, in our endeavor to search for anti-inflammatory compounds from Artemisia vulgaris L., 12 new and 10 known guaiane-type sesquiterpenoids were isolated and identified, of which compound 1 was the most potent inhibitor on NO release in LPS-stimulated RAW264.7 cells. The biological data confirmed that the expression of inflammatory enzymes of iNOS and COX-2 was suppressed by 1 in LPS-stimulated RAW264.7 cells. The binding interactions of compound 1 with iNOS also confirmed the conclusion. Further mechanisms need to be further explored. Accordingly, 1 displayed the therapeutic potential for modulating inflammation.
The datasets presented in this study can be found in online repositories. The names of the repository/repositories and accession number(s) can be found in the article/Supplementary Material.
All authors listed have made a substantial, direct, and intellectual contribution to the work and approved it for publication.
This work was supported by the Guangdong Province Modern Agricultural Industry Technology System Innovation Team Project (Grant No. 2020KJ142 and 2021KJ142) and the Key Research and Development Plan of Guangzhou (Grant No. 202206010008).
Authors C-WQ, ZR, and Y-FW were employed by the company GuangZhou (Jinan) Biomedical Research and Development Center Co., Ltd.
The remaining authors declare that the research was conducted in the absence of any commercial or financial relationships that could be construed as a potential conflict of interest.
All claims expressed in this article are solely those of the authors and do not necessarily represent those of their affiliated organizations, or those of the publisher, the editors, and the reviewers. Any product that may be evaluated in this article, or claim that may be made by its manufacturer, is not guaranteed or endorsed by the publisher.
The Supplementary Material for this article can be found online at: https://www.frontiersin.org/articles/10.3389/fchem.2022.948714/full#supplementary-material
Abiri, R., Silva, A. L. M., de Mesquita, L. S. S., de Mesquita, J. W. C., Atabaki, N., de Almeida, E. B., et al. (2018). Towards a better understanding of Artemisia vulgaris: Botany, phytochemistry, pharmacological and biotechnological potential. Food Res. Int. 109, 403–415. doi:10.1016/j.foodres.2018.03.072
Blagojević, P., Radulović, N., Palić, R., and Stojanović, G. (2006). Chemical composition of the essential oils of Serbian wild-growing Artemisia absinthium and Artemisia vulgaris. J. Agric. Food Chem. 54 (13), 4780–4789. doi:10.1021/jf060123o
Bohlmann, F., and Zdero, C. (1978). New sesquiterpenes and acetylenes from Athanasia and Pentzia species. Phytochemistry 17 (9), 1595–1599. doi:10.1016/s0031-9422(00)94650-8
Bora, K. S., and Sharma, A. (2011). The genus Artemisia: A comprehensive review. Pharm. Biol. 49 (1), 101–109. doi:10.3109/13880209.2010.497815
Burley, S. K., Bhikadiya, C., Bi, C., Bittrich, S., Chen, L., Crichlow, G. V., et al. (2021). RCSB protein Data Bank: Powerful new tools for exploring 3D structures of biological macromolecules for basic and applied research and education in fundamental biology, biomedicine, biotechnology, bioengineering and energy sciences. Nucleic Acids Res. 49 (D1), D437–D451. doi:10.1093/nar/gkaa1038
de Heluani, C. S., de Lampasona, M. P., Catalán, C. A., Goedken, V. L., Gutiérrez, A. B., Herz, W., et al. (1989). Guaianolides, heliangolides and other constituents from Stevia alpina. Phytochemistry 28 (7), 1931–1935. doi:10.1016/s0031-9422(00)97889-0
Duke, J., and Bogenschutz, M. J. (1994). Dr. Duke's phytochemical and ethnobotanical databases. Washington, DC: USDA, Agricultural Research Service.
Ekiert, H., Pajor, J., Klin, P., Rzepiela, A., Ślesak, H., Szopa, A., et al. (2020). Significance of Artemisia vulgaris L.(Common Mugwort) in the history of medicine and its possible contemporary applications substantiated by phytochemical and pharmacological studies. Molecules 25 (19), 4415. doi:10.3390/molecules25194415
Forli, S., Huey, R., Pique, M. E., Sanner, M. F., Goodsell, D. S., Olson, A. J., et al. (2016). Computational protein–ligand docking and virtual drug screening with the AutoDock suite. Nat. Protoc. 11 (5), 905–919. doi:10.1038/nprot.2016.051
Funk, V. A. (2009). Systematics, evolution, and biogeography of Compositae. Bratislava, Slovakia: International Association for Plant Taxonomy.
Hershoff, A. (2001). Herbal remedies: A quick and easy guide to common disorders and their herbal remedies. Penguin: Herbal Remedies.
Huang, Z., Pei, Y., Liu, C., Lin, S., Tang, J., Huang, D., et al. (2010). Highly oxygenated guaianolides from Artemisia dubia. Planta Med. 76 (15), 1710–1716. doi:10.1055/s-0030-1249957
Jin, H. Z., Lee, J. H., Lee, D., Hong, Y. S., Kim, Y. H., Lee, J. J., et al. (2004). Inhibitors of the LPS-induced NF-B activation from Artemisia sylvatica. Phytochemistry 65 (15), 2247–2253. doi:10.1016/j.phytochem.2004.06.034
Kumari, A., Karnatak, M., Singh, D., Shankar, R., Jat, J. L., Sharma, S., et al. (2019). Current scenario of artemisinin and its analogues for antimalarial activity. Eur. J. Med. Chem. 163, 804–829. doi:10.1016/j.ejmech.2018.12.007
Lee, K. H., Matsueda, S., and Geissman, T. A. (1971). Sesquiterpene lactones of Artemisia: New guaianolides from fall growth of A. Douglasiana. Phytochemistry 10 (2), 405–410. doi:10.1016/s0031-9422(00)94057-3
Liang, M. P. (2003). WebFEATURE: An interactive web tool for identifying and visualizing functional sites on macromolecular structures. Nucleic Acids Res. 31 (13), 3324–3327. doi:10.1093/nar/gkg553
Lone, S. H., Bhat, K. A., and Khuroo, M. A. (2015). Arglabin: From isolation to antitumor evaluation. Chem. Biol. Interact. 240, 180–198. doi:10.1016/j.cbi.2015.08.015
Nguyen, N. T., Nguyen, T. H., Pham, T. N. H., Huy, N. T., Bay, M. V., Pham, M. Q., et al. (2020). Autodock vina adopts more accurate binding poses but Autodock4 forms better binding affinity. J. Chem. Inf. Model. 60 (1), 204–211. doi:10.1021/acs.jcim.9b00778
Ober, A. G., Quijano, L., Urbatsch, L. E., and Fischer, N. H. (1984). Guaianolides from calea subcordata. Phytochemistry 23 (6), 1289–1292. doi:10.1016/s0031-9422(00)80443-4
Ober, A. G., Urbatsch, L. E., and Fischer, N. H. (1985). Guaianolides and chromenes from Calea species. Phytochemistry 24 (4), 795–799. doi:10.1016/s0031-9422(00)84897-9
Pires, J. M., Mendes, F. R., Negri, G., Almeida, J. M. D., and Carlini, E. A. (2009). Antinociceptive peripheral effect of Achillea millefolium L. And Artemisia vulgaris L.: Both plants known popularly by brand names of analgesic drugs. Phytother. Res. 23 (2), 212–219. doi:10.1002/ptr.2589
Rasheed, T., Bilal, M., Iqbal, H. M. N., and Li, C. (2017). Green biosynthesis of silver nanoparticles using leaves extract of Artemisia vulgaris and their potential biomedical applications. Colloids Surfaces B Biointerfaces 158, 408–415. doi:10.1016/j.colsurfb.2017.07.020
Saleh, A. M., Aljada, A., Rizvi, S. A., Nasr, A., Alaskar, A. S., Williams, J. D., et al. (2014). In vitro cytotoxicity of Artemisia vulgaris L. essential oil is mediated by a mitochondria-dependent apoptosis in HL-60 leukemic cell line. BMC Complement. Altern. Med. 14 (1), 226. doi:10.1186/1472-6882-14-226
Schmid-Grendelmeier, P., Holzmann, D., Himly, M., Weichel, M., Tresch, S., Rückert, B., et al. (2003). Native Art v 1 and recombinant Art v 1 are able to induce humoral and T cell-mediated in vitro and in vivo responses in mugwort allergy. J. Allergy Clin. Immunol. 111 (6), 1328–1336. doi:10.1067/mai.2003.1495
Seeliger, D., and de Groot, B. L. (2010). Ligand docking and binding site analysis with PyMOL and Autodock/Vina. J. Comput. Aided. Mol. Des. 24 (5), 417–422. doi:10.1007/s10822-010-9352-6
Soon, L., Ng, P. Q., Chellian, J., Madheswaran, T., Panneerselvam, J., Gupta, G., et al. (2019). Therapeutic potential of Artemisia vulgaris: An insight into underlying immunological mechanisms. J. Environ. Pathol. Toxicol. Oncol. 38 (3), 205–216. doi:10.1615/jenvironpatholtoxicoloncol.2019029397
Sun, Y., Ju, Y., Liu, C., Du, K., and Meng, D. (2020). Polyhydroxyl guaianolide terpenoids as potential NF-кB inhibitors induced cytotoxicity in human gastric adenocarcinoma cell line. Bioorg. Chem. 95, 103551. doi:10.1016/j.bioorg.2019.103551
Sundararajan, B., and Kumari, B. R. (2017). Novel synthesis of gold nanoparticles using Artemisia vulgaris L. leaf extract and their efficacy of larvicidal activity against dengue fever vector Aedes aegypti L. J. Trace Elem. Med. Biol. 43, 187–196. doi:10.1016/j.jtemb.2017.03.008
Vina, A. (2010). Improving the speed and accuracy of docking with a new scoring function, efficient optimization, and multithreading Trott, Oleg; Olson. Arthur. J. J. Comput. Chem. 31 (2), 455–461.
Weston, L. A., Barney, J. N., and DiTommaso, A. (2005). A review of the biology and ecology of three invasive perennials in New York state: Japanese knotweed (polygonum cuspidatum), mugwort (Artemisia vulgaris) and pale swallow-wort (vincetoxicum rossicum). Plant and Soil 277 (1), 53–69. doi:10.1007/s11104-005-3102-x
Keywords: Artemisia vulgaris L., new structures, guaianolide sesquiterpene lactones, anti-inflammatory, in silico
Citation: Chen X-Y, Liu T, Hu Y-Z, Qiao T-T, Wu X-J, Sun P-H, Qian C-W, Ren Z, Zheng J-X and Wang Y-F (2022) Sesquiterpene lactones from Artemisia vulgaris L. as potential NO inhibitors in LPS-induced RAW264.7 macrophage cells. Front. Chem. 10:948714. doi: 10.3389/fchem.2022.948714
Received: 20 May 2022; Accepted: 30 June 2022;
Published: 01 September 2022.
Edited by:
Jian-Wei Dong, Qujing Normal University, ChinaReviewed by:
Huai Xiao, Dali University, ChinaCopyright © 2022 Chen, Liu, Hu, Qiao, Wu, Sun, Qian, Ren, Zheng and Wang. This is an open-access article distributed under the terms of the Creative Commons Attribution License (CC BY). The use, distribution or reproduction in other forums is permitted, provided the original author(s) and the copyright owner(s) are credited and that the original publication in this journal is cited, in accordance with accepted academic practice. No use, distribution or reproduction is permitted which does not comply with these terms.
*Correspondence: Zhe Ren, cno2MkAxNjMuY29t; Jun-Xia Zheng, anVueGlhemhlbmdAZ2R1dC5lZHUuY24=; Yi-Fei Wang, dHdhbmcteWZAMTYzLmNvbQ==
†These authors have contributed equally to this work
Disclaimer: All claims expressed in this article are solely those of the authors and do not necessarily represent those of their affiliated organizations, or those of the publisher, the editors and the reviewers. Any product that may be evaluated in this article or claim that may be made by its manufacturer is not guaranteed or endorsed by the publisher.
Research integrity at Frontiers
Learn more about the work of our research integrity team to safeguard the quality of each article we publish.