 Muhammad Ajmal
 Jia-Wen Wei
 Yan Zhao
 Yi-Hong Liu
 Ping-Ping Wu
 Yao-Qun Li
- Department of Chemistry and the MOE Key Laboratory of Spectrochemical Analysis and Instrumentation, College of Chemistry and Chemical Engineering, Xiamen University, Xiamen, China
Early and sensitive detection of δ-aminolevulinic acid (δ-ALA) and porphobilinogen (PBG) is the cornerstone of diagnosis and effective treatment for acute porphyria. However, at present, the quantifying strategies demand multiple solvent extraction steps or chromatographic approaches to separate δ-ALA and PBG prior to quantification. These methods are both time-consuming and laborious. Otherwise, in conventional spectrofluorimetry, the overlapping spectra of the two analytes cause false diagnosis. To overcome this challenge, we present a two-step approach based on derivative matrix-isopotential synchronous fluorescence spectrometry (DMISFS) and the Hantzsch reaction, realizing the simple and simultaneous detection of δ-ALA and PBG in urine samples. The first step is chemical derivatization of the analytes by Hantzsch reaction. The second step is the determination of the target analytes by combining MISFS and the first derivative technique. The proposed approach accomplishes following advantages: 1) The MISFS technique improves the spectral resolution and resolves severe spectral overlap of the analytes, alleviating tedious and complicated pre-separation processes; 2) First derivative technique removes the background interference of δ-ALA on PBG and vice versa, ensuring high sensitivity; 3) Both the analytes can be determined simultaneously via single scanning, enabling rapid detection. The obtained detection limits for δ-ALA and PBG were 0.04 μmol L−1 and 0.3 μmol L−1, respectively. Within-run precisions (intra and inter-day CVs) for both the analytes were <5%. Further, this study would serve to enhance the availability of early and reliable quantitative diagnosis for acute porphyria in both scientific and clinical laboratories.
Introduction
Porphyrins play a pivotal role in chlorophyll, hemoglobin, and certain enzymes (Killiny et al., 2020). For human bodies, their synthetic sequence leads to the production of haem. However, any abnormality in the haem biosynthetic pathway can give rise to a class of genetic disorders, known as the porphyrias (Ajmal et al., 2019; Fujiwara et al., 2020; Jaramillo-Calle et al., 2021). The porphyrias are broadly categorized as either acute or non-acute. Amongst acute intermittent porphyria (AIP), hereditary coproporphyria (HP) and variegate porphyria (VP), AIP is the most common type of acute porphyria. It is caused by reduced activity of porphobilinogen deaminase (PBGD), which is the third enzyme in the haem pathway (Bechara et al., 2021). The disease (AIP) is characterized by deadly episodes of neurovisceral attacks featured by hypertension, autonomic dysfunction, and abdominal pain (Lin et al., 2011). As δ-aminolevulinic acid (δ-ALA) and porphobilinogen (PBG) are the well documented precursors for the biosynthetic pathway of haem, disorders of their urinary concentrations bear remarkable diagnostic and therapeutic significance for acute porphyria. However, unlike AIP, HP, and VP, where the urinary concentrations for both δ-ALA and PBG are raised, elevated concentration of δ-ALA alone without raising PBG marks the presence of diseases like ALA-D deficiency porphyria (ADP), hereditary tyrosinaemia type I, and lead toxicity (van’t Klooster et al., 2017). Although PBG concentration in urine is recommended as the first identification test for an acute attack (Herrick and McColl, 2005), yet simultaneous detection of δ-ALA and PBG is essential for the differential screening of the aforementioned conditions.
The classical method for the qualitative determination of urinary PBG constitutes the colorimetric analysis after reaction with Ehrlich’s reagent (p-dimethylaminobenzaldehyde, DMAB) in acid solution forming a red compound. In this process, equal amounts of urine and Ehrlich’s reagent are mixed and PBG is obtained in the aqueous phase (Watson and schwartz, 1941). This method was later revised and simplified by Hoesch (Lamon and Redeker, 1974). However, these methods lack adequate selectivity and sensitivity for quantitative measurements, as the interfering compounds are extracted from the urinary sample before initiating the reaction. As the most prevalent alternative, Mauzerall and Granick’s method allows the quantification of both δ-ALA and PBG with the help of multiple sample extraction steps. In this method, urinary samples are purified by using different cation and anion-exchange columns before derivatization with Ehrlich’s reagent and precise spectrophotometric determination at 553 nm (Mauzerall and Granick, 1956). Driven by these methods, a plethora of assays (Zhang et al., 2011; Benton et al., 2012; Carichon et al., 2014) have been introduced to achieve simple and speedy quantification of δ-ALA and PBG. Despite their huge contribution towards the detection, the existing screening methods still meet the challenge to separately determine δ-ALA and PBG in complex environments with interference from plentiful coexisting compounds reacting with Ehrlich’s reagent (Marver et al., 1966; Pierach et al., 1977). Therefore, complicated and lengthy purification processes to reduce background interference from coexisting components become unavoidable, which deprives most hospitals of rapid detection for acute porphyria in patients with neuropathic abdominal issues. This delay usually results in awfully misdirected treatment (Bissell, 2015). Clearly, a simple, rapid and reliable method for direct and simultaneous determination of δ-ALA and PBG is of important significance.
Chemical derivatization is widely used to enhance the detection sensitivity and retain δ-ALA and/or PBG on columns in chromatography-based approaches (Hijaz and Killiny, 2016). Modified Hantzsch reaction is reckoned as one of the most frequently employed derivatization agent for δ-ALA, as it entails the detection based on fluorescence (Tomokuni et al., 1992; Oishi et al., 1996; Donnelly et al., 2006; Kanto et al., 2013). Fluorescence spectrometry has been a powerful tool for the identification, monitoring, and quantification of various analytes in a broad range of environments, on account of high selectivity and sensitivity (Ou-Yang et al., 2018; Tsumura et al., 2018; Cheng et al., 2019; Zhai et al., 2020; Ding et al., 2022; Remolina et al., 2022; Wang et al., 2022). Despite the extensive use, the considerable background fluorescence and the spectral overlap contributed by the interfering components are liable to pose a formidable diagnostic challenge for conventional fluorescence spectrometry in case of complex multi-component analysis. The technological advancement of synchronous fluorescence spectrometry (SFS) in biological applications shows great promise in solving this problem by taking advantage of spectral simplification, band narrowing, and minimized scattering interference (Lecrenier et al., 2018; Elmas et al., 2019; Kumar, 2019; Ouyang et al., 2019; Zhao et al., 2020). SFS exploits simultaneous scanning for excitation and emission wavelengths. With the passage of time, SFS has been transformed into a number of branches, including conventional constant-wavelength SFS (defined with constant Δλ), constant-energy SFS, variable angle SFS, and matrix-isopotential SFS. Constant-energy SFS deals with maintaining a constant energy difference of the excitation and emission photons (Li et al., 2010). In variable-angle SFS, the excitation and emission wavelengths are varied simultaneously but at different rates (Samokhvalov, 2020).
Matrix-isopotential synchronous fluorescence spectrometry (MISFS), a branch of SFS, specializes in eliminating the unknown fluorescence matrix background and determining the individual compounds in complex matrices simultaneously (Pulgarín and Molina, 1994). This technique proceeds by establishing a cut in the combined fluorescence spectrum for maintaining a constant matrix background. Subsequently, the cut is accompanied by the matrix-isopotential trajectory, which joins together the points of equal fluorescence intensity. Most importantly, as the selected trajectory passes all through the emission and excitation wavelength maxima of the target components in the matrix, the sensitivity is increased markedly (Li et al., 2010). Derivative spectrofluorimetry serves as an analytical tool which can transform the normal spectrum of a spectral curve into a derivative spectrum. Finally, MISFS in combination with the first derivative technique emerges as an ideal platform for multi-component detections by minimizing the unknown and unspecific background fluorescence from urine, and by resolving the spectra of adjacently overlapping mixtures, without resorting to pre-analytical purification processes (Pulgarín et al., 2014).
Capitalizing on our previous knowledge regarding the porphyrins and the porphyria (Huang et al., 2010; Shindi et al., 2010; Liu et al., 2012; Ajmal et al., 2019), we combine derivative matrix-isopotential synchronous fluorescence spectrometry (DMISFS) and the Hantzsch reaction to eliminate the long-standing problems of interference and laborious pre-analytical purifications for the simple, speedy and simultaneous determination of δ-ALA and PBG in the urine. While it is common to use the Hantzsch reaction for the fluorescent detection of δ-ALA, to our knowledge, there exists no precedent for either the detection of PBG alone or simultaneously with δ-ALA involving Hantzsch reaction or DMISFS. Thus, our work is envisioned to serve as a novel diagnostic tool for patients with severe abdominal pain in both clinical and scientific applications. This work also displays great promise as potential alternative to the present day kits for quantitative detection of δ-ALA/PBG.
Experimental
Materials and Reagents
δ-ALA hydrochloride, acetylacetone reagent, and Formaldehyde (37%, V/V in water) were provided by Aladdin-Reagent (Shanghai, China). Porphobilinogen was purchased from Sigma-Aldrich (St. Louis, MO, United States). Methanol HPLC grade, glacial acetic acid, and hydrochloric acid were supplied by J&K (China). The aqueous solutions were prepared by purified water. The ultrapure water was obtained from a Millipore Milli-Q water purifying system (Millipore, Bedford, MA, United States), with a specific resistance of 18.2 MΩ cm.
Stock solutions for δ-ALA and PBG were prepared as 3 and 1 mM, respectively, in amber-colored volumetric flasks and were preserved in the refrigerator until use. Samples for both the analytes were prepared following a procedure reported previously (Ajmal et al., 2019). Calibration plots were obtained by spiking different solutions with concentrations as 0–5 µM for δ-ALA and 0–15 µM for PBG. Acetylacetone reagent was formulated by mixing acetylacetone, ethanol, and water in a ratio of 15:10:75, respectively. Formaldehyde solution was prepared by 3.7–fold dilution of commercially available formaldehyde solution and was stored in darkness (Oishi et al., 1996).
Urine Samples
Urine specimens from apparently healthy individuals were collected, anonymized, stored in dark containers, and refrigerated at −20°C. The obtained samples were generally analyzed within an hour from their collection time. This research was carried out according to the regulations and guidelines of the National Ethics Committee for the Biomedical Research in China. All experiments complied with the institutional guidelines and relevant laws approved by the Medical Ethics Committee of Xiamen University. Informed consent was obtained from the volunteers participating in this study.
Fluorescence Study
All the fluorimetric experiments were conducted on a laboratory-assembled MYF spectrofluorometer (Huang et al., 2010; Liu et al., 2016; Ajmal et al., 2019). The instrument was equipped with 150-W xenon lamp as the excitation source. For the two monochromators, the slits were fixed at 5 nm band passes. To control the monochromators and obtain the excitation and emission spectra, a software package framed in Turbo C 2.0 was used. This software permits the export of the obtained fluorescence data into the format of ASCII file. ASCII file is employed in the FTOTAL program, which is written on Visual BASIC (Pulgarín and Molina, 1993). This program favors the representation of three-dimensional (3D) spectra of the individual compounds from their corresponding excitation and emission spectra. These 3D spectra can also be displayed as a contour map or an isometric projection. For recording the MISF spectrum, FTOTAL achieves the intensity values for the excitation wavelengths by applying the specific function which combines points of identical intensity on the matrix comprehensive fluorescence spectrum (Wu et al., 1999). This combination of equal intensity points is called the isopotential scanning trajectory. The first derivative spectra were then acquired directly via electronic differential device equipped with the spectrofluorometer without a phase converter. A quartz cuvette with a path length of 1.0 × 1.0 cm was utilized for all the fluorescence measurements.
Results and Discussion
Conventional Fluorescence Spectra
We commenced our study by obtaining conventional fluorescence spectra for δ-ALA and PBG. Figure 1 exhibits the location of the excitation maxima of δ-ALA and PBG at 394.4 and 399.7 nm, respectively. And the corresponding emission maxima of δ-ALA and PBG at 467.3 and 481.6 nm, respectively. However, in this case, fluorescence bands of δ-ALA and PBG were closely overlapped on account of their almost identical molecular structures, indicating the fact that the presence of one component would overwhelmingly influence the other and hence their simultaneous quantitative detection using the conventional fluorescence spectrometry might well be difficult without resorting to the tedious and lengthy pre-separation processes.
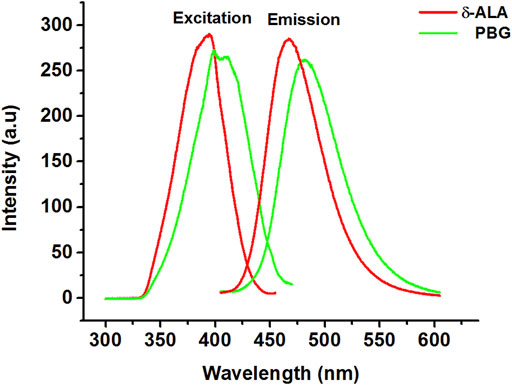
FIGURE 1. Excitation and emission spectra of δ-ALA (2.5 μmol L−1, red solid lines, λex = 394.4 nm; λem = 467.3 nm) and PBG (6.5 μmol L−1, green solid lines, λex = 399.7 nm; λem = 481.6 nm).
Total Fluorescence Spectra
Theoretical three-dimensional (3D) spectra for both δ-ALA and PBG were obtained for selecting suitable scanning path of MISF. 3D spectra not only provide wide scope and comprehensive structural information, but can also furnish spectral features invisible in the conventional fluorescence spectra. These spectra were extracted from pair of emission and excitation spectra of both δ-ALA and PBG by using a home-made program (FTOTAL) and projected as the isometric presentation, where the emission spectra were plotted at corresponding increments of the excitation wavelengths. Subsequently, 3D spectra were efficiently transformed into two-dimensional contour plots by connecting the points of identical fluorescence intensity of the emission and excitation wavelengths. As shown in Figure 2, the superposition of the contour plots of δ-ALA and PBG leads to the overlapping in the maximum intensity regions of the analytes. This serious overlap disabled the individual detections owing to the spectral interference from the background signal.
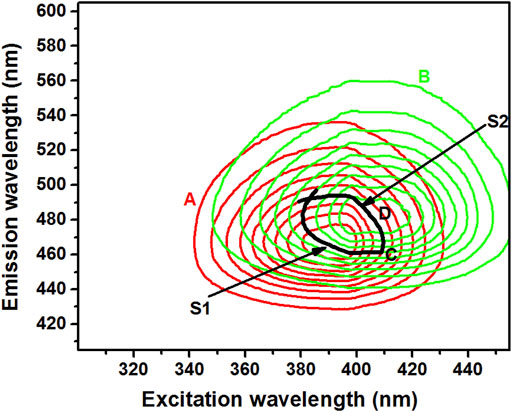
FIGURE 2. Contour maps of δ-ALA [(A), 2.5 μmol L−1, red solid line], PBG [(B), 6.5 μmol L−1, green solid line], point of contact (C) and the selected isopotential scanning route [(D), black solid line].
Optimum Scanning Route Selection
The careful evaluation of the 2D contour plots of δ-ALA and PBG favored the selection of an optimum matrix-isopotential scanning trajectory by making a cut in the total fluorescence spectra of the two analytes. The selection of this trajectory was critically significant in establishing the suitable DMISFS method for the rapid and simultaneous detection of δ-ALA and PBG, since it could offer the DMISF spectra with the maximum fluorescence and minimum interference. In the selected trajectory, from left to right, the first section (S1) was a part of PBG contour lines, while the second section (S2) belonged to δ-ALA contour lines. Section1 (PBG) of the isopotential trajectory was chosen to pass through the highest possible wavelengths of δ-ALA: ex = 391 nm, em = 465.4 nm. Similarly, section 2 (δ-ALA), was selected to go through the highest possible wavelengths of PBG: ex = 403.6 nm, em = 484.3 nm. Later, these sections were combined at the crossing point, highlighted by the “C” sign to establish a complete scanning path as a matrix isopotential synchronous fluorescence (MISF) scanning route for the simultaneous detection of δ-ALA and PBG (Figure 2). The trajectory was highlighted by the sign “D”. This isopotential scanning route was used for both MISF and DMISF based detections. When this selected path was used for acquiring luminescence spectra of δ-ALA and PBG in the presence of urinary fluorescent matrix, the same spectrum was obtained for the targets as in complete isolation, thereby, maintaining high sensitivity.
Figure 3 shows MISF spectra for δ-ALA and PBG. For appropriate presentation and quantitative determinations, the MISF spectra were outlined with the determination series plotted as the x-axis, while the MISF intensity set as the y-axis. Moreover, the determination series demonstrate the coordinate orders of all the positions (ex, em) employed for the selection of the isopotential scanning path, beginning from the extreme left up to the extreme right.
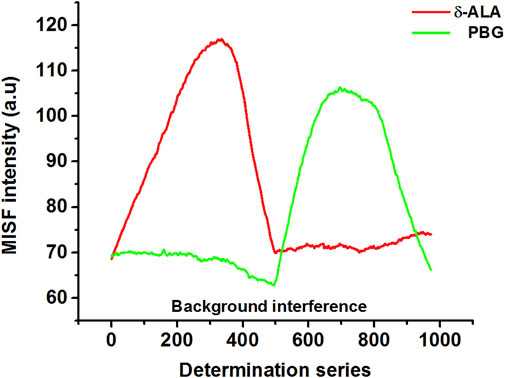
FIGURE 3. MISF spectra of δ-ALA (2.5 μmol L−1, red solid line) and PBG (6.5 μmol L−1, green solid line).
Although the spectral bands of δ-ALA and PBG were satisfactorily resolved, their quantitative measurement using MISFS technique alone might still not be precise owing to the background interference of one component on the other. First-derivative technique has been an effective tool of background elimination and spectrum enhancement, which can improve resolution ability of fine spectral structures and identify subtle spectral changes. Considering the fact that the scanning path was selected isopotentially, this issue was resolved by using the first-derivative technique in which the baseline involvement of both analytes in the normal MISF spectrum offered no interference in the first-derivative MISF spectrum. Coupling MISF technique with the first-derivative, it was possible to resolve the interference caused by the spectral overlap and determine both δ-ALA and PBG separately with high sensitivity and selectivity (Figure 4). Figure 4 displays the elimination of PBG signal in the first section while retaining the net-derivative signal of δ-ALA, and vice versa for the second section. DMISF spectra of δ-ALA and PBG were scanned by the selected scanning path. The measurements corresponding to the peak maxima in the DMISF spectra of δ-ALA and PBG, highlighted as “A and B” on Figure 4, were applied for setting up their calibration plots.
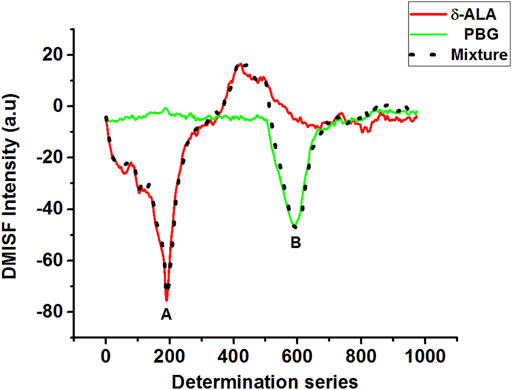
FIGURE 4. DMISF spectra of δ-ALA (2.5 μmol L−1, red solid line), PBG (6.5 μmol L−1, green solid line), and their mixture, black dotted line. (A,B) refer to the detection points of δ-ALA and PBG respectively.
Calibration plots for both δ-ALA and PBG were constructed by diluting appropriate aliquots of each analyte to verify their mutual independence at the selected detection points. The independence of δ-ALA detection point was displayed by obtaining DMISF spectra in mixtures having 0–5 μmol L−1 δ-ALA while the PBG concentration was fixed as 8 μmol L−1. Likewise, the independence of PBG detection point was exhibited by conducting the DMISF spectra in mixtures with 0–15 μmol L−1 PBG while δ-ALA concentration was fixed, as 1.5 μmol L−1 (Figures 5, 6). As portrayed by Figures 5, 6, the DMISF spectra for δ-ALA and PBG at their respective detection points were mutually independent and well resolved, thereby, could well be quantified simultaneously in just a single scan within 90s. Moreover, the calibration plots were prepared by employing the linear regression method. The relationship between the analyte concentration and the DMISF signal at their respective detection points was linear up to the concentrations of 5 and 15 μmol L−1 for δ-ALA and PBG, respectively. The achieved correlation coefficient, 0.998 for both the analytes separately and individually, indicated good linearity.
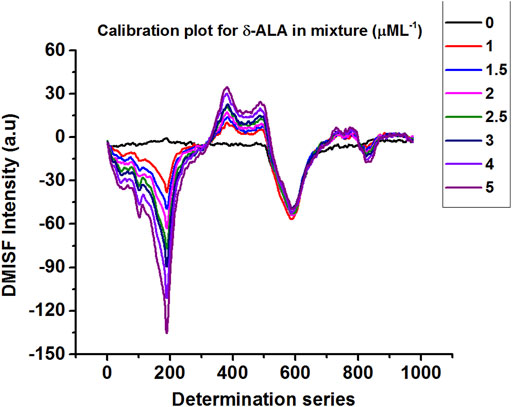
FIGURE 5. DMISF spectra of 8 μmol L−1 PBG with increasing amount of δ-ALA 0–5 μmol L−1.
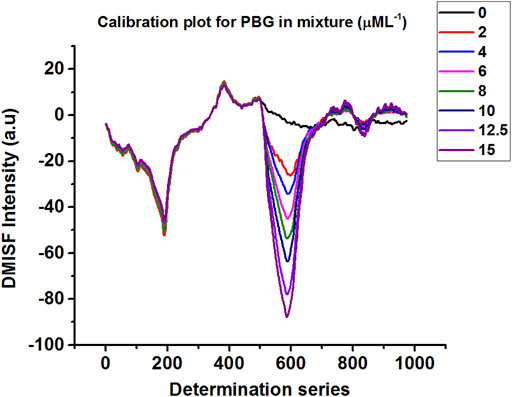
FIGURE 6. DMISF spectra of 1.5 μmol L−1 δ-ALA with increasing amount of PBG 0–15 μmol L−1.
Limits of Detection and Quantification
In compliance with IUPAC definition, the limits of detection were estimated as 0.04 and 0.31 μmol L−1 for δ-ALA and PBG respectively. The results were obtained with the equation CLOD = 3Sb/m, where Sb symbolizes the standard deviation of the blank measurements (n = 16) and m refers to the slope of the calibration curve for the corresponding analyte. For the limits of quantification, the equation 10Sb/m, was used. The limits of quantification was found as 0.15 μmol L−1 for δ-ALA and 1.04 μmol L−1 for PBG. The detection limits achieved by the proposed method are satisfactory for the routine analysis of δ-ALA and PBG in urine samples.
Application of the Method to Spiked Urine Samples
In order to investigate the potentiality of the proposed method towards the quantitative determination of δ-ALA and PBG, the DMISF spectra for a number of urine samples spiked with the target analytes with contrasting ratios were obtained at the isopotential scanning path. Previously constructed calibration plots were used for obtaining the concentrations of both components. The findings of these assays indicate the applicability of the present method for the precise quantification of δ-ALA and PBG in their mixtures (Table 1, Supplementary Figures S1A–E, ESI).
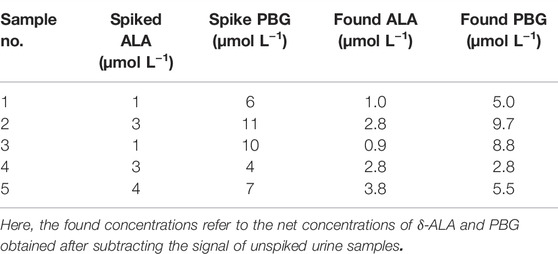
TABLE 1. Urine samples spiked with δ-ALA and PBG and obtained concentrations.
Precision of the Method
The within-run precision for the present method was demonstrated by repeatedly analyzing δ-ALA and PBG in a randomly obtained urine sample, from an apparently healthy subject. To be precise, the random urinary sample was analyzed for intra-day CVs (ten times a day) and inter-day CVs (six times during 6 days). The used sample was stored at −20°C. The between-run precision for intra-day CVs turned out be 3.0 and 3.1% for δ-ALA and PBG, respectively (Supplementary Figure S2A, ESI). However for inter-day, the CVs were 4.3 and 4.0% for δ-ALA and PBG, respectively (Supplementary Figure S2B, ESI).
Conclusion
Based on the combination of Hantzsch reaction, MISFS and the first-derivative technique, a direct and straightforward strategy was proposed aiming at the simultaneous quantification of δ-ALA and PBG in urinary samples for early diagnosis and treatment of acute porphyria. Compared with the previously reported methods, DMISFS effectively removed the spectral overlap and minimized the influence of unknown background fluorescence, making a seminal contribution as a highly sensitive technique which demanded no pre-analytical purification processes, no complicated operations and could rapidly quantify both the analytes in a single scanning within 90 s. Moreover, the present method offered improved recovery, selectivity, and limits of detections. The present method was also examined for the detection of δ-ALA and PBG in urine samples without any significant interference. This work stands out as a successful effort to not only furnish a reliable alternative for the laboratory-based diagnosis of δ-ALA and PBG but also for the commercially available screening kits with a number of added advantages. The present method is also believed to strengthen the international strives against the acute porphyria by providing prompt analysis of δ-ALA and PBG.
Data Availability Statement
The original contributions presented in the study are included in the article/Supplementary Material, further inquiries can be directed to the corresponding author.
Ethics Statement
The studies involving human participants were reviewed and approved by The Medical Ethics Committee of Xiamen University, Xiamen University. The patients/participants provided their written informed consent to participate in this study.
Author Contributions
MA performed the design, experiments, data analysis, and manuscript writing for this work. J-WW contributed to discussions, suggestions and writing. YZ provides supports in lab instruments and experiments. Y-HL contributed to suggestions in experimental methodology. P-PW provided technical support and lab management during the study. Y-QL supervised the project, provided advices in the research, and made writing revisions.
Funding
This work was financially supported by the National Natural Science Foundation of China (No. 21874110).
Conflict of Interest
The authors declare that the research was conducted in the absence of any commercial or financial relationships that could be construed as a potential conflict of interest.
Publisher’s Note
All claims expressed in this article are solely those of the authors and do not necessarily represent those of their affiliated organizations, or those of the publisher, the editors and the reviewers. Any product that may be evaluated in this article, or claim that may be made by its manufacturer, is not guaranteed or endorsed by the publisher.
Supplementary Material
The Supplementary Material for this article can be found online at: https://www.frontiersin.org/articles/10.3389/fchem.2022.920468/full#supplementary-material
References
Ajmal, M., Shindi, A. A. F., Liu, Y.-H., Zhao, Y., Wu, P.-P., Wei, J.-W., et al. (2019). Derivative Matrix-Isopotential Synchronous Spectrofluorimetry: A Solution for the Direct Determination of Urinary δ-aminolevulinic Acid. New J. Chem. 43 (46), 18092–18097. doi:10.1039/c9nj04261j
Bechara, E. J. H., Ramos, L. D., and Stevani, C. V. (2021). 5-Aminolevulinic Acid: A Matter of Life and Caveats. J. Photochem. Photobiol. 7, 100036. doi:10.1016/j.jpap.2021.100036
Benton, C. M., Couchman, L., Marsden, J. T., Rees, D. C., Moniz, C., and Lim, C. K. (2012). Direct and Simultaneous Determination of 5-aminolaevulinic Acid and Porphobilinogen in Urine by Hydrophilic Interaction Liquid Chromatography-Electrospray Ionisation/tandem Mass Spectrometry. Biomed. Chromatogr. 26 (8), 1033–1040. doi:10.1002/bmc.2770
Carichon, M., Pallet, N., Schmitt, C., Lefebvre, T., Gouya, L., Talbi, N., et al. (2014). Urinary Metabolic Fingerprint of Acute Intermittent Porphyria Analyzed by 1H NMR Spectroscopy. Anal. Chem. 86 (4), 2166–2174. doi:10.1021/ac403837r
Cheng, T., Huang, W., Gao, D., Yang, Z., Zhang, C., Zhang, H., et al. (2019). Michael Addition/S,N-Intramolecular Rearrangement Sequence Enables Selective Fluorescence Detection of Cysteine and Homocysteine. Anal. Chem. 91 (16), 10894–10900. doi:10.1021/acs.analchem.9b02814
Ding, S., Hu, H., Yue, X., Feng, K., Gao, X., Dong, Q., et al. (2022). A Fluorescent Biosensor Based on Quantum Dot-Labeled Streptavidin and Poly-L-Lysine for the Rapid Detection of Salmonella in Milk. J. Dairy Sci. 105 (4), 2895–2907. doi:10.3168/jds.2021-21229
Donnelly, R. F., Morrow, D. I. J., McCarron, P. A., Juzenas, P., and Woolfson, A. D. (2006). Pharmaceutical Analysis of 5-aminolevulinic Acid in Solution and in Tissues. J. Photochem. Photobiol. B Biol. 82 (1), 59–71. doi:10.1016/j.jphotobiol.2005.08.007
Fujiwara, H., Takahara, N., Tateishi, K., Tanaka, M., Kanai, S., Kato, H., et al. (2020). 5-Aminolevulinic Acid-Mediated Photodynamic Activity in Patient-Derived Cholangiocarcinoma Organoids. Surg. Oncol. 35, 484–490. doi:10.1016/j.suronc.2020.10.011
Herrick, A. L., and McColl, K. E. L. (2005). Acute Intermittent Porphyria. Best Pract. Res. Clin. Gastroenterology 19 (2), 235–249. doi:10.1016/j.bpg.2004.10.006
Hijaz, F., and Killiny, N. (2016). A Gas Chromatography-Mass Spectrometry Method for the Determination of Delta-Aminolevulinic Acid in Plant Leaves. J. Chromatogr. A 1447, 57–63. doi:10.1016/j.chroma.2016.04.041
Huang, W., Liu, Q., Zhu, E.-Y., Shindi, A. A. F., and Li, Y.-Q. (2010). Rapid Simultaneous Determination of Protoporphyrin IX, Uroporphyrin III and Coproporphyrin III in Human Whole Blood by Non-linear Variable-Angle Synchronous Fluorescence Technique Coupled with Partial Least Squares. Talanta 82 (4), 1516–1520. doi:10.1016/j.talanta.2010.07.034
Jaramillo-Calle, D. A., Martinez, Y. A., Balwani, M., Fernandez, C., and Toro, M. (2021). Porphyria Attacks in Prepubertal Children and Adolescents. Mol. Genet. Metabolism 133 (3), 242–249. doi:10.1016/j.ymgme.2021.04.008
Kanto, U., Jutamanee, K., Osotsapar, Y., Chai-arree, W., Jintanawich, W., Promdang, S., et al. (2013). Quantification of 5-aminolevulinic Acid in Swine Manure Extract by HPLC-Fluorescence. J. Liq. Chromatogr. Relat. Technol. 36 (19), 2731–2748. doi:10.1080/10826076.2012.725693
Karuk Elmas, Ş. N., Arslan, F. N., Akin, G., Kenar, A., Janssen, H.-G., and Yilmaz, I. (2019). Synchronous Fluorescence Spectroscopy Combined with Chemometrics for Rapid Assessment of Cold-Pressed Grape Seed Oil Adulteration: Qualitative and Quantitative Study. Talanta 196, 22–31. doi:10.1016/j.talanta.2018.12.026
Killiny, N., Nehela, Y., Hijaz, F., Gonzalez-Blanco, P., Hajeri, S., and Gowda, S. (2020). Knock-down of δ-aminolevulinic Acid Dehydratase via Virus-Induced Gene Silencing Alters the microRNA Biogenesis and Causes Stress-Related Reactions in Citrus Plants. Plant Sci. 299, 110622. doi:10.1016/j.plantsci.2020.110622
Kumar, K. (2019). Application of Akaike Information Criterion Assisted Probabilistic Latent Semantic Analysis on Non-trilinear Total Synchronous Fluorescence Spectroscopic Data Sets: Automatizing Fluorescence Based Multicomponent Mixture Analysis. Anal. Chim. Acta 1062, 60–67. doi:10.1016/j.aca.2019.03.009
Lamon, J., With, T. K., and Redeker, A. G. (1974). The Hoesch Test: Bedside Screening for Urinary Porphobilinogen in Patients with Suspected Porphyria. Clin. Chem. 20 (11), 1438–1440. doi:10.1093/clinchem/20.11.1438
Lecrenier, M.-C., Baeten, V., Taira, A., and Abbas, O. (2018). Synchronous Fluorescence Spectroscopy for Detecting Blood Meal and Blood Products. Talanta 189, 166–173. doi:10.1016/j.talanta.2018.06.076
Li, Y. Q., Li, X. Y., Shindi, A. A. F., Zou, Z. X., Liu, Q., Lin, L. R., et al. (2010). “Synchronous Fluorescence Spectroscopy and its Applications in Clinical Analysis and Food Safety Evaluation,” in Reviews in Fluorescence 2010 (Berlin,Germany: Springer), 95
Lin, C. S.-Y., Lee, M.-J., Park, S. B., and Kiernan, M. C. (2011). Purple Pigments: The Pathophysiology of Acute Porphyric Neuropathy. Clin. Neurophysiol. 122 (12), 2336–2344. doi:10.1016/j.clinph.2011.07.036
Liu, Q., Huang, W., Shindi, A. A. F., and Li, Y.-Q. (2012). A Novel Rapid Method for Simultaneous Determination of Three Diagnostically Important Porphyrins in Erythrocytes Using Hyphenated Synchronous Fluorescence Techniques. Talanta 88, 663–668. doi:10.1016/j.talanta.2011.11.057
Liu, Y.-H., Wu, P.-P., Liu, Q., Luo, H.-D., Cao, S.-H., Lin, G.-C., et al. (2016). A Simple Fluorescence Spectroscopic Approach for Simultaneous and Rapid Detection of Four Polycyclic Aromatic Hydrocarbons (PAH4) in Vegetable Oils. Food Anal. Methods 9, 3209–3217. doi:10.1007/s12161-016-0515-5
Marver, H. S., Tschudy, D. P., Perlroth, M. G., Collins, A., and Hunter, G. (1966). The Determination of Aminoketones in Biological Fluids. Anal. Biochem. 14, 53–60. doi:10.1016/0003-2697(66)90055-8
Mauzerall, D., and Granick, S. (1956). The Occurrence and Determination of Δ-Aminolevulinic Acid and Porphobilinogen in Urine. J. Biol. Chem. 219 (1), 435–446. doi:10.1016/s0021-9258(18)65809-0
Montgomery Bissell, D. (2015). “The Porphyrias,” in Rosenberg's Molecular and Genetic Basis of Neurological and Psychiatric Disease (Netherlands: Elsevier), 731–749. doi:10.1016/b978-0-12-410529-4.00066-8
Oishi, H., Nomiyama, H., Nomiyama, K., and Tomokuni, K. (1996). Fluorometric HPLC Determination of Δ-Aminolevulinic Acid (ALA) in the Plasma and Urine of Lead Workers: Biological Indicators of Lead Exposure. J. Anal. Toxicol. 20 (2), 106–110. doi:10.1093/jat/20.2.106
Ou-Yang, J., Li, Y., Jiang, W.-L., He, S.-Y., Liu, H.-W., and Li, C.-Y. (2018). Fluorescence-Guided Cancer Diagnosis and Surgery by a Zero Cross-Talk Ratiometric Near-Infrared γ-Glutamyltranspeptidase Fluorescent Probe. Anal. Chem. 91 (1), 1056–1063. doi:10.1021/acs.analchem.8b04416
Ouyang, X., Wang, S.-Y., Liu, T., Ren, Y.-A., Wang, M.-F., Chen, F.-F., et al. (2019). Functional Modulation of Cytochrome C upon Specific Binding to DNA Nanoribbons. Chem. Commun. 55 (93), 14074–14077. doi:10.1039/c9cc05427h
Pierach, C. A., Cardinal, R., Bossenmaier, I., and Watson, C. J. (1977). Comparison of the Hoesch and the Watson-Schwartz Tests for Urinary Porphobilinogen. Clin. Chem. 23 (9), 1666–1668. doi:10.1093/clinchem/23.9.1666
Pulgarín, J. A. M., Bermejo, L. F. G., and Rodríguez, S. B. (2014). Matrix Isopotential Synchronous Fluorescence Spectrometry for the Determination of Gibberellic Acid in Watermelon after Ultraviolet-Irradiation. RSC Adv. 4 (11), 5671
Pulgarín, J. M., and Molina, A. (1994). Determination of Nafcillin and Methicillin by Different Spectrofluorimetric Techniques. Talanta 41 (1), 21–30.
Pulgarín, J. M., and Molina, A. (1993). FTOTAL, A Program to Process Total Luminescence Spectra. Comput. Chem. 17 (4), 341
Remolina, M. C. R., Li, Z., and Peleato, N. M. (2022). Application of Machine Learning Methods for Rapid Fluorescence-Based Detection of Naphthenic Acids and Phenol in Natural Surface Waters. J. Hazard. Mater. 430, 128491. doi:10.1016/j.jhazmat.2022.128491
Samokhvalov, A. (2020). Analysis of Various Solid Samples by Synchronous Fluorescence Spectroscopy and Related Methods: A Review. Talanta 216, 120944. doi:10.1016/j.talanta.2020.120944
Shindi, A. A. F., Zhou, P.-C., Zou, Z.-X., and Li, Y.-Q. (2010). A Novel, Selective, and Rapid Fluorimetric Method for the Simultaneous Analysis of Coproporphyrin and Uroporphyrin in Urine. Anal. Chim. Acta 664 (1), 89–94. doi:10.1016/j.aca.2010.01.062
Tomokuni, K., Ichiba, M., and Hirai, Y. (1992). Measurement of Urinary Delta-Aminolevulinic Acid (ALA) by Fluorometric HPLC and Colorimetric Methods. Ind. Health 30 (3-4), 119–128. doi:10.2486/indhealth.30.119
Tsumura, S., Enoki, T., and Ooyama, Y. (2018). A Colorimetric and Fluorescent Sensor for Water in Acetonitrile Based on Intramolecular Charge Transfer: D-(π-A)2-type Pyridine-Boron Trifluoride Complex. Chem. Commun. 54 (72), 10144–10147. doi:10.1039/c8cc06257a
van 't Klooster, C. C., Uil, J. J., van der Leeuw, J., Eppens, E. F., and Marczinski, S. C. (2017). Unusual Cause of Abdominal Pain and Anemia. Clin. Chem. 63 (12), 1806–1809. doi:10.1373/clinchem.2016.267823
Wang, M., Ateia, M., Hatano, Y., Miyanaga, K., and Yoshimura, C. (2022). Novel Fluorescence-Based Method for Rapid Quantification of Live Bacteria in River Water and Treated Wastewater. Environ. Sci. Adv. 10, 1039. doi:10.1039/d1va00017a
Watson, C. J., and Schwartz, S. (1941). A Simple Test for Urinary Porphobilinogen. Exp. Biol. Med. 47 (2), 393–394. doi:10.3181/00379727-47-13152p
Wu, C., Sui, W., and Li, Y. (1999). FPATH, a Program to Design the Optimum Scanning Route for Non-linear Variable-Angle Synchronous Fluorescence. Chem. J. Chin. Univ. 20, 422.
Zhai, Y.-Y., Liu, Q., Cai, W.-P., Cao, S.-H., Zhang, L.-X., and Li, Y.-Q. (2020). Metallic Nanofilm Enhanced Fluorescence Cell Imaging: A Study of Distance-Dependent Intensity and Lifetime by Optical Sectioning Microscopy. J. Phys. Chem. B 124 (14), 2760–2768. doi:10.1021/acs.jpcb.9b11390
Zhang, J., Yasuda, M., Desnick, R. J., Balwani, M., Bishop, D., and Yu, C. (2011). A LC-MS/MS Method for the Specific, Sensitive, and Simultaneous Quantification of 5-aminolevulinic Acid and Porphobilinogen. J. Chromatogr. B 879 (24), 2389–2396. doi:10.1016/j.jchromb.2011.06.034
Keywords: matrix-isopotential synchronous fluorescence spectrometry, δ-aminolevulinic acid, porphobilinogen, simultaneous detection, derivative technique
Citation: Ajmal M, Wei J-W, Zhao Y, Liu Y-H, Wu P-P and Li Y-Q (2022) Derivative Matrix-Isopotential Synchronous Spectrofluorimetry and Hantzsch Reaction: A Direct Route to Simultaneous Determination of Urinary δ-Aminolevulinic Acid and Porphobilinogen. Front. Chem. 10:920468. doi: 10.3389/fchem.2022.920468
Received: 14 April 2022; Accepted: 13 May 2022;
Published: 31 May 2022.
Edited by:
Muhammad Asif, Wuhan Institute of Technology, ChinaReviewed by:
Muhammad Wajid Ullah, Jiangsu University, ChinaDilshad Hussain, University of Karachi, Pakistan
Copyright © 2022 Ajmal, Wei, Zhao, Liu, Wu and Li. This is an open-access article distributed under the terms of the Creative Commons Attribution License (CC BY). The use, distribution or reproduction in other forums is permitted, provided the original author(s) and the copyright owner(s) are credited and that the original publication in this journal is cited, in accordance with accepted academic practice. No use, distribution or reproduction is permitted which does not comply with these terms.
*Correspondence: Yao-Qun Li, eWFvcXVubGlAeG11LmVkdS5jbg==