 Chao Hu1
 Haiping Huang
- 1Jiangxi Provincial Key Laboratory of Functional Molecular Materials Chemistry, School of Chemistry and Chemical Engineering, Jiangxi University of Science and Technology, Ganzhou, China
- 2Key Laboratory of Testing and Tracing of Rare Earth Products for State Market Regulation, Jiangxi University of Science and Technology, Ganzhou, China
via simple hydrothermal method, CeO2 was in-situ grown onto the CNTs to form CeO2/CNTs nanocomposites were synthesized with cerium nitrate as Ce resource. The morphology and structure were characterized by transmission electron microscopy and X-ray diffraction. The characterizations reveal that CeO2 nanoparticles are uniformly dispersed onto the surface of the pre-acidified CNTs. The electrochemical property of the synthesized nanocomposite was investigated in 0.1 M KCl electrolyte containing 2 mM [Fe(CN)6]3-/4-. The nanocomposites were employed to fabricate electrochemical sensor for phenol detection. The linear range for phenol detection measured by the differential pulse voltammetry method is 1–500 μM. The sensor also exhibits good selectivity, reproducibility and stability. When applied for the river and tap water analysis, it shows good recovery rate.
Introduction
At present, human life is inseparable from chemical products. As the chemical industry brings great convenience to our daily lives, it also damages our environment, making the global water pollution problem more and more serious (Lopez-Pacheco et al., 2019; Liu J. et al., 2021). Phenol is such a common pollutant in the chemical industrial wastewater, which can cause pollution to water bodies and the atmosphere, and also has strong chemical toxicity to human beings (Gruzdev et al., 2015; Singh and Chandra, 2019; Wang and Chen, 2020). Excessive exposure to water containing phenol can cause damage to the skin and eyes, and it also causes nerve damage and increases the risk of cancer (Singh and Chandra, 2019). Not only the World Health Organization (WHO) lists it as the third category of carcinogens, the European Union (EU) and the US Environmental Protection Agency also list it as an important environmental pollutant (Diaz-Gonzalez et al., 2016). What’s more, because phenol is difficult to degrade in the natural environment, its environmental pollution will eventually destroy the ecology system. Therefore, it is urgent to develop a technology that can quickly detect the phenol content in river water. At present, the main methods for detecting phenol includes spectrophotometry, gas chromatography-mass spectrometry, liquid/solid phase extraction/microextraction, high-performance liquid chromatography, etc (Alcudia-Leon et al., 2011; Jaworek, 2018; Liu W. et al., 2021) However, the operations for these methods are relatively complex, and the instruments are expensive, which limit their rapid and wide detection. Compared with the previous analysis methods, electrochemical analysis has the advantages of good stability, high sensitivity, low cost, and easy operation (Curulli, 2020; Tajik et al., 2020). Owing to these advantages, it is widely employed for the electrochemical detection of inorganic ions, small organic molecules and bio-molecules, etc.
One key factor in improving the performance of electrochemical sensors is to find suitable materials for modifying working electrodes (Ferrier and Honeychurch, 2021). So far, scientists have done a lot of research on this, and many materials with excellent electrochemical properties have been used to improve the performance of sensors (Abbas and Amin, 2022; Shao et al., 2022). Among them, the carbon nanotube is treated as an ideal material for the chemical modified electrode owing to excellent performance (Zhang and Du, 2020; Billing, 2021). Carbon nanotubes are composed of pure carbon atoms that interact through strong sp2 carbon-carbon bonds. They exhibit the unique carbon network geometry of tubular structures in nanoscale diameters and microscale lengths. The strong chemical bonds in the carbon network make CNTs the most fascinating nanomaterials. Because of the unique physical and chemical properties such as high mechanical strength, large surface area and electrical conductivity, it is widely utilized in the electrochemical fields such as electrochemical sensor (Wang J. et al., 2018), electrochemical catalyst (Tafete et al., 2022), supercapacitor (Yang et al., 2020), etc.
Due to the unique electronic configuration, rare earth elements are currently the hot-topic research materials (Huang and Zhu, 2019). Take Cerium (Ce) as an example, Ce is a member of the lanthanide family of metals, and it is the most abundant element of the rare earth metals found in the earth crust (Algethami et al., 2018). It is easy to lose outer electrons to form compounds of different valence states, thus making its chemical properties very active. The oxide of cerium, called ceria, is a rare earth semiconductor material with a low price and a wide range of applications. CeO2 has a cubic fluorite structure, in which the Ce element has two oxidation states Ce4+ and Ce3+. It is widely used in luminescent materials (Huang et al., 2021) catalysts (Zhu et al., 2019), electrode materials (Xiao et al., 2018; Huang et al., 2019), and so on. For the purpose of further exploring the electrochemical application of CeO2, in this study, a simple hydrothermal route was used to in situ grow CeO2 nanoparticles on the surface of carbon nanotubes. The synthesized CeO2/CNTs composites were employed to construct a phenol electrochemical sensor. The experimental results show that the CeO2/CNTs modified electrode has a good detection effect on phenol.
Experimental
Preparation of CeO2/CNTs
First, the CNTs were acidified with a mixed acid solution (V98% concentrated sulfuric acid: V68% concentrated nitric acid = 3:1) at 90°C for 4 h under stirring and refluxing. Ce(NO3)3·6H2O was used as the cerium source to synthesize CeO2/CNTs composite material in one step by hydrothermal method. Dissolve 1.2 g Ce(NO3)3·6H2O and 0.1 g treated CNTs into 60 ml deionized water. After adjust the solution to pH = 9.0 with 0.5 M NaOH and stir for 1 h, it was then transferred into the autoclave and reacted at 160°C for 24 h. After that, it was allowed to cool naturally, and the product was centrifuged, washed, dried under vacuum, and ground. The similar route was used to prepare CeO2 nanoparticles without the addition of treated CNT at the beginning.
Preparation of Electrochemical Sensor
The modified glassy carbon electrodes (GCE, Φ = 4 mm) of CeO2/CNTs/GCE, CeO2/GCE and CNTs/GCE were used as working electrode. All the cyclic voltammetric (CV) and differential pulse voltammetric (DPV) responses were recorded on electrochemical workstation.
Other detailed experimental procedures and apparatus parameters are provided in the Supplementary Material.
Results and Discussion
Material Characterization
TEM and XRD technologies were employed for the purpose of intuitively observing the morphology and structure of the nanomaterials. Shown in Figures 1A,B is the TEM image of CeO2 nanoparticles and CeO2/CNTs nanocomposites. It can be seen that CeO2 nanoparticles are grown uniformly on the surface of CNTs. In the XRD spectra of Figure 1C, the diffraction peak at 26° in the curve 1) is the characteristic peak of CNTs. For CeO2, it can be seen from curve b in Figure 1C that a series of sharp diffraction peaks appear at 28.3°, 33.1°, 47.5°, 58.2°, which are correspond to the (111), (200), (220), (311) planes of CeO2 (Xiao et al., 2019). This is also consistent with the standard XRD spectrum of CeO2 (curve d, JCPDS card No. 34–0,394). And all these peaks are appeared in the CeO2/CNTs nanocomposite (curve c), proving the successful preparation of CeO2/CNTs composite.
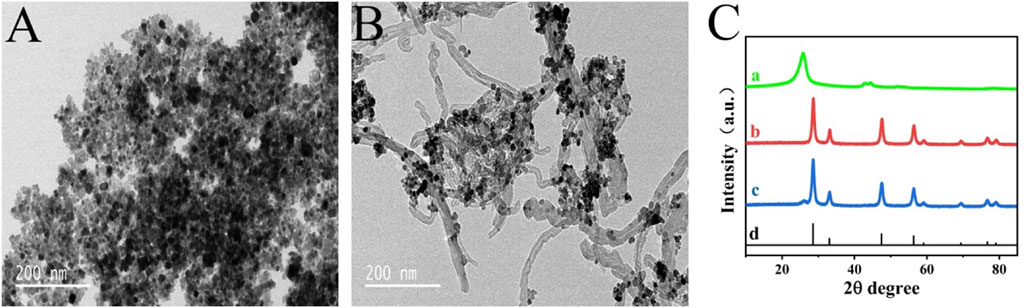
FIGURE 1. TEM images of CeO2 (A), CeO2/CNTs (B), and XRD patterns (C) of CNTs (a), CeO2 (b), CeO2/CNTs (c) and standard spectrum of CeO2 (d).
Cyclic Voltammetric Response of Different Electrodes
To study the electrochemical property of the nanocomposites, the CV responses of different nanocomposites modified electrode were recorded in 0.1 M KCl electrolyte containing 2 mM [Fe(CN)6]3-/4-, which are shown in Figure 2A. Compared with bare GCE (curve a), CeO2/GCE (curve b) shows a little bigger CV response. This confirms that as a rare earth semiconductor material, CeO2 can still promote the electron transfer between the electrode and the electrolyte. Nevertheless, the peak current is dramatically enlarged after CNTs are modified onto the GCE as CNTs/GCE (curve c), due to the excellent conductivity of CNTs. And the peak current is further enlarged for CeO2/CNTs/GCE (curve d). This proves that the binary composite of CeO2/CNTs owes the best electrochemical performance than single CNT or CeO2.
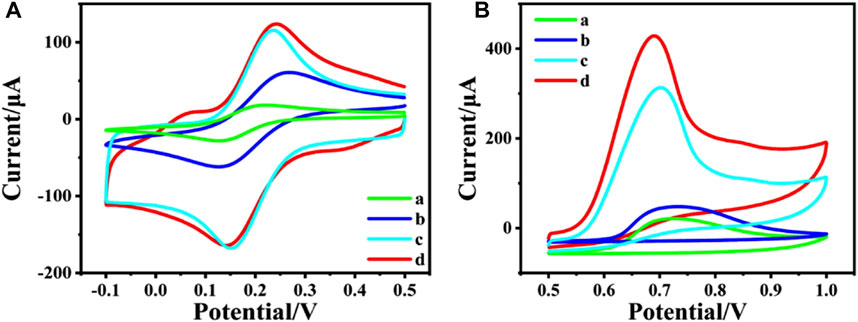
FIGURE 2. CVs of different electrode in 2 mM [Fe(CN)6]3-/4- + 0.1 M KCl (A) and in phosphate buffer (pH = 5.0, 0.1 M) containing 2 mM phenol (B). (a) bare GCE, (b) CeO2/GCE, (c) CNTs/GCE and (d) CeO2/CNTs/GCE. Scan rate: 50 mV s−1.
In order to investigate the electrochemical catalytic effect of the different nanomaterial towards oxidation of phenol, CV tests were performed on different modified electrodes in 0.1 M phosphate buffer containing 2 mM phenol in Figure 2B. It can be found that both CeO2/GCE (curve b in Figure 2B) and CNTs/GCE (curve c in Figure 2B) responses are better than the bare GCE (curve a in Figure 2B), which means both CeO2 nanoparticles and carbon nanotubes have a certain catalytic effect toward the electrochemical oxidation of phenol. And CeO2/CNTs/GCE (curve d in Figure 2B) has the largest oxidation peak compared to other modified electrodes. This shows that CeO2/CNTs nanomaterials have the best electrochemical catalytic effect on phenol. This is due to the synergistic catalysis effect between CeO2 nanoparticles and CNTs.
Effect of Scan Rate
The electrochemical kinetic behavior of the as-prepared electrode was studied by CV in phosphate buffer (pH = 5.0, 0.1 M) containing 1 mM phenol (Figure 3). When the scan rate enlarges from 10 to 200 mV s−1, the oxidation peak current increases accordingly (Figure 3A). Figure 3B shows the linear curve of peak current value vs. the scan rate, where Ip (μA) = 44.00961 + 1.00644 v (mV·s−1) with R2 = 0.98044. It confirms the kinetic behavior of CeO2/CNTs/GCE is a surface-controlled process.
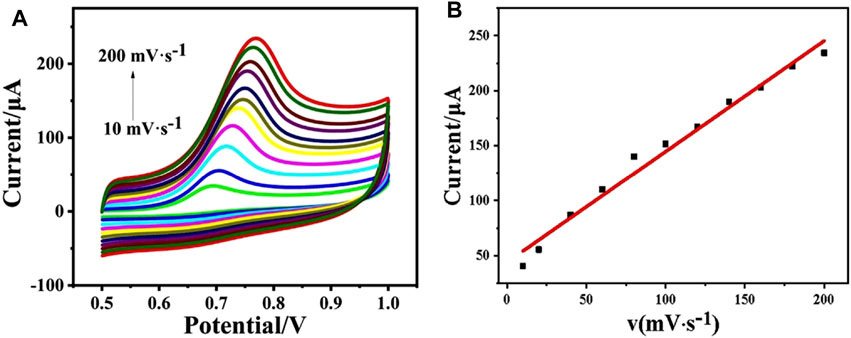
FIGURE 3. CVs of CeO2/CNTs/GCE in phosphate buffer (pH = 5.0, 0.1 M) with 1 mM phenol at different scan rates (10–200) mV·s−1 (A), and the linear curve of the peak current vs. the scan rate (B).
Effect of the pH Value
During electrochemical analysis, the pH value of the solution plays an important role for the target determination. Herein, in order to study the effect of pH on the electrochemical performance of CeO2/CNTs/GCE, the CV behaviors of CeO2/CNTs/GCE in electrolytes with different pH values were recorded. As shown in Figure 4A, when the pH value increases from 4.0 to 8.0, the oxidation peak potential obviously shifts to the lower voltage direction. Figure 4B is the linear curve between the pH value of the solution and the oxidation peak potential of phenol, where Ep(V) = 0.99462–0.05473pH with R2 = 0.98843. Through calculation, the ratio value between the involved number of protons and electrons in the reaction is approximately 1. This is consistent with the transfer number of protons and electrons in the phenol oxidation reaction. At the same time, it is observed in Figure 4A that the electrode has the largest response current at pH = 5.0, so subsequent electrochemical experiments are carried out under the optimal pH value of 5.0.
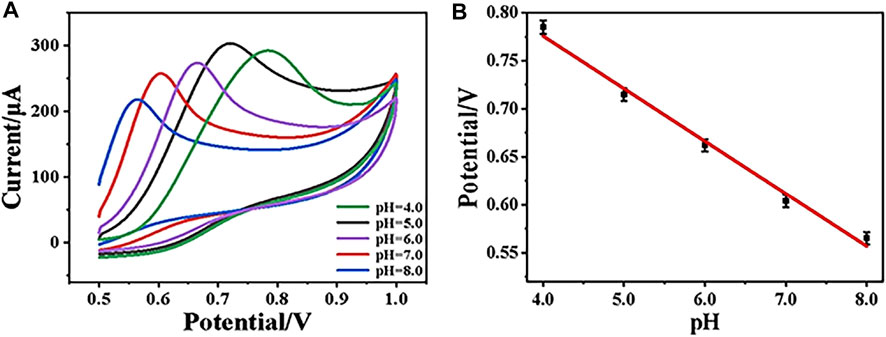
FIGURE 4. CVs of CeO2/CNTs/GCE in electrolyte with pH from 4.0 to 8.0 (A), and the linear curve of peak potential vs. pH (B).
Determination of Phenol
Under the optimal condition, the DPV response of CeO2/CNTs/GCE upon the addition of different concentration of phenol was recorded. Figure 5A is the DPV signals recorded in a phosphate buffer (pH = 5.0) with different phenol concentrations in the range of 1–500 μM. It can be seen from Figure 5A that as phenol concentration gradually increases, the corresponding oxidation peak current also increases. Drawn from the DPV curves, the linear equation (Figure 5B) between the DPV peak current (Ip) and the phenol concentration (cphenol) is Ip(μA) = 0.252 + 0.105 cphenol (μM) with R2 = 0.992. The detection limit for phenol is 0.3 μM. In contrast to other published electrochemical sensors, as shown in Table 1, CeO2/CNTs/GCE has a lower detection limit and a wide detection range. It shows that the sensor in this system exhibits satisfied performance.
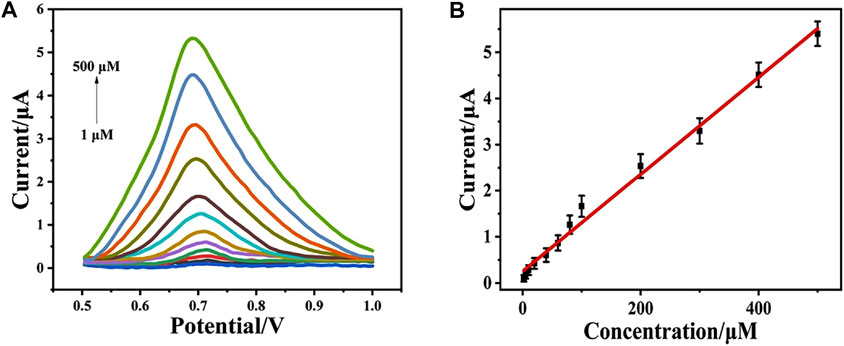
FIGURE 5. DPVs for CeO2/CNTs in phosphate buffer (pH = 5.0, 0.1 M) with different concentrations of phenol (1–500 μM) (A) and the corresponding plots of the oxidation peak currents at peak potentials vs. the concentrations of phenol (B).
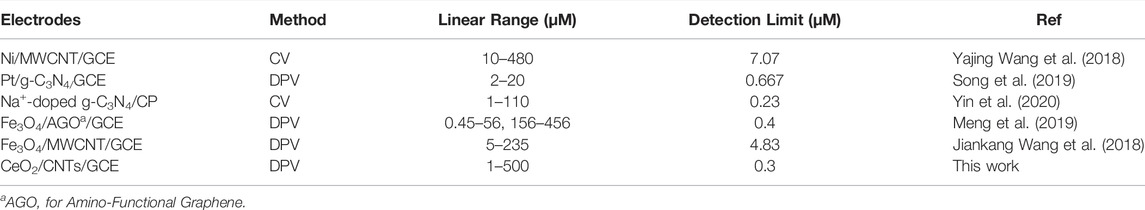
TABLE 1. Comparison of different sensor performance.
Selectivity and Reproducibility
In order to study the selectivity of the electrochemical sensor, other common substances are added into 0.1 M phosphate buffer (pH = 5.0) with 1 mM phenol, so as to record interfere effect for the electrochemical response of phenol. Based on the previous report about the anti-interference investigation for phenol detection, potassium chloride, calcium chloride, sodium chloride, iron chloride, sodium nitrate, magnesium chloride, hydroquinone (HQ) and catechol (CC) are chosen for anti-interference research. The result is shown in Figure 6. After adding different interferences (0.1 mM) into electrolyte, the electrochemical signal almost remains unchanged as compared to solo phenol detection. This illustrates that the prepared sensor has good selectivity. To investigate the repeatability of the sensor modification, five CeO2/CNTs modified electrodes were fabricated under the same conditions to measure 100 μM phenol solution. The calculated relative standard deviation (RSD) is 5.76%, which shows that the sensor has good reproducibility. And the stability is studied by measuring the CV response of the sensor in 100 μM phenol solution after stored in a desiccator for 1 week. Its signal value was 98.6% of the initial value.
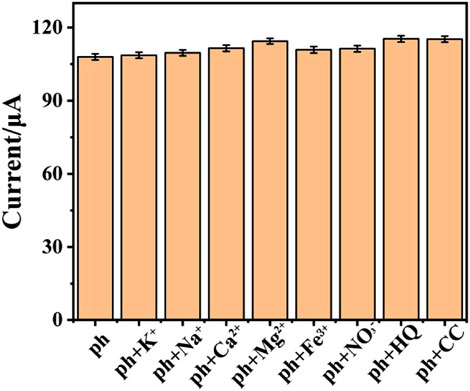
FIGURE 6. The selectivity study of CeO2/CNTs/GCE upon addition of different interferences.
Real Sample Detection
DPV determinations of phenol in real samples of river and tap water were estimated using standard addition method to assess the possibility for real sample detection. Table 2 shows the actual sample detection results. The results show that the sensor in this system has good recovery rate and RSD in both river and tap water analysis. This proves that CeO2/CNTs/GCE is a reliable and effective platform for phenol detection in real sample.
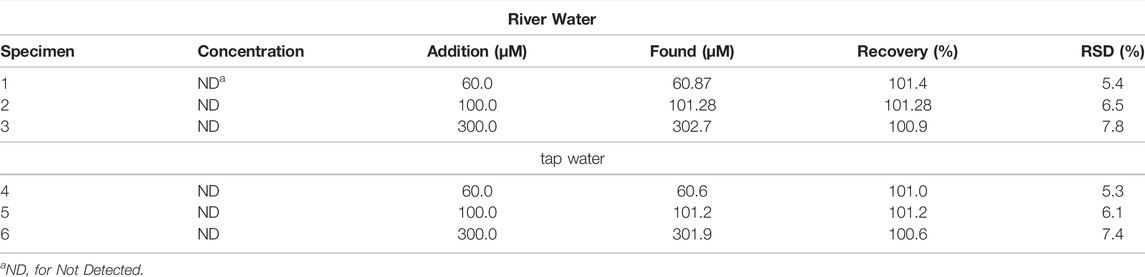
TABLE 2. Real sample detection in river water and tap water.
Conclusion
CeO2/CNTs nanocomposites were synthesized by hydrothermal method. CeO2 nanoparticles are obtained with cerium nitrate as Ce resource. TEM images reveal that CeO2 nanoparticles are uniformly dispersed onto the surface of the pre-acidified CNTs. XRD spectra show that all the characteristic peaks of CNT and CeO2 are appeared in the CeO2/CNT nanocomposite. The CV responses in 0.1 M KCl electrolyte containing 2 mM [Fe(CN)6]3-/4- prove that, as compared to the bare CNTs and CeO2, the CeO2/CNTs/GCE owes the best electrochemical performance. When applied for the electrochemical catalytic effect towards oxidation of phenol, CeO2/CNTs nanomaterials have the best catalytic effect on phenol oxidation. The CeO2/CNTs nanocomposites based electrochemical sensor displays wide linear range, good selectivity, reproducibility and stability, as well as the potential application for real sample detection.
Data Availability Statement
The original contributions presented in the study are included in the article/Supplementary Material, further inquiries can be directed to the corresponding author.
Author Contributions
CH was responsible for experimental studies and the draft preparation. HH was responsible for the submission, final revision, and financial support to this research. YY and YH were responsible for experiments and characterization. S-JL and H-RW contributed to reviewing and supervising the project. All authors contributed to the article and approved the submitted version.
Funding
This work thanks for financial support from the National Natural Science Foundation of China (Grant Nos. 22061019), Jiangxi Provincial Key Laboratory of Functional Molecular Materials Chemistry (20212BCD42018), the Youth Jinggang Scholars Program in Jiangxi Province and Qingjiang Excellent Young Talents Program of Jiangxi University of Science and Technology.
Conflict of Interest
The authors declare that the research was conducted in the absence of any commercial or financial relationships that could be construed as a potential conflict of interest.
Publisher’s Note
All claims expressed in this article are solely those of the authors and do not necessarily represent those of their affiliated organizations, or those of the publisher, the editors and the reviewers. Any product that may be evaluated in this article, or claim that may be made by its manufacturer, is not guaranteed or endorsed by the publisher.
Supplementary Material
The Supplementary Material for this article can be found online at: https://www.frontiersin.org/articles/10.3389/fchem.2022.907777/full#supplementary-material
References
Abbas, A., and Amin, H. M. A. (2022). Silver Nanoparticles Modified Electrodes for Electroanalysis: An Updated Review and a Perspective. Microchem. J. 175, 107166. doi:10.1016/j.microc.2021.107166
Alcudia-León, M. C., Lucena, R., Cárdenas, S., and Valcárcel, M. (2011). Determination of Phenols in Waters by Stir Membrane Liquid-Liquid-Liquid Microextraction Coupled to Liquid Chromatography with Ultraviolet Detection. J. Chromatogr. A 1218 (16), 2176–2181. doi:10.1016/j.chroma.2011.02.033
Algethami, F. K., Marwani, H. M., Asiri, A. M., and Rahman, M. M. (2018). Comparative Performances of Phenolic Sensors Based on Various CeO2-Carbon Material Nanocomposites for Environmental Safety. Sr 38 (4), 467–477. doi:10.1108/sr-11-2017-0235
Billing, B. K. (2021). Carbon Nanotubes and its Potential Application in Sensing. Chemistryselect 6 (36), 9571–9590. doi:10.1002/slct.202102636
Curulli, A. (2020). Nanomaterials in Electrochemical Sensing Area: Applications and Challenges in Food Analysis. Molecules 25 (23), 5759. doi:10.3390/molecules25235759
Díaz-González, M., Gutiérrez-Capitán, M., Niu, P., Baldi, A., Jiménez-Jorquera, C., and Fernández-Sánchez, C. (2016). Electrochemical Devices for the Detection of Priority Pollutants Listed in the EU Water Framework Directive. TrAC Trends Anal. Chem. 77, 186–202. doi:10.1016/j.trac.2015.11.023
Ferrier, D. C., and Honeychurch, K. C. (2021). Carbon Nanotube (CNT)-Based Biosensors. Biosensors 11 (12), 486. doi:10.3390/bios11120486
Gruzdev, I. V., Zenkevich, I. G., and Kondratenok, B. M. (2015). Derivatization in Gas Chromatographic Determination of Phenol and Aniline Traces in Aqueous Media. Russ. Chem. Rev. 84 (6), 653–664. doi:10.1070/rcr4553
Huang, H., Chen, Y., Chen, Z., Chen, J., Hu, Y., and Zhu, J.-J. (2021). Electrochemical Sensor Based on Ce-MOF/carbon Nanotube Composite for the Simultaneous Discrimination of Hydroquinone and Catechol. J. Hazard. Mater. 416, 125895. doi:10.1016/j.jhazmat.2021.125895
Huang, H., and Zhu, J.-J. (2019). The Electrochemical Applications of Rare Earth-Based Nanomaterials. Analyst 144 (23), 6789–6811. doi:10.1039/c9an01562k
Huang, W., Tan, Y., Li, D., Du, H., Hu, X., Li, G., et al. (2019). Improved Photo-Luminescence by Co-doped Lithium in the Phosphor System CeO2:Eu3+. J. Luminescence 206, 432–439. doi:10.1016/j.jlumin.2018.10.072
Jaworek, K. (2018). Determination of Aromatic Hydrocarbons, Phenols, and Polycyclic Aromatic Hydrocarbons in Water by Stir Bar Sorptive Extraction and Gas Chromatography-Mass Spectrometry. Anal. Lett. 51 (4), 469–482. doi:10.1080/00032719.2017.1338712
Liu, J., Zhang, L., Lu, G., Jiang, R., Yan, Z., and Li, Y. (2021). Occurrence, Toxicity and Ecological Risk of Bisphenol A Analogues in Aquatic Environment - A Review. Ecotoxicol. Environ. Saf. 208, 111481. doi:10.1016/j.ecoenv.2020.111481
Liu, W., Xie, M., Hao, X., Xu, Q., Jiang, X., Liu, T., et al. (2021). Rapid Synergistic Cloud Point Extraction for Simultaneous Determination of Five Polar Phenols in Environmental Water Samples via High Performance Liquid Chromatography with Fluorescence Detection. Microchem. J. 164, 105963. doi:10.1016/j.microc.2021.105963
López-Pacheco, I. Y., Silva-Núñez, A., Salinas-Salazar, C., Arévalo-Gallegos, A., Lizarazo-Holguin, L. A., Barceló, D., et al. (2019). Anthropogenic Contaminants of High Concern: Existence in Water Resources and Their Adverse Effects. Sci. Total Environ. 690, 1068–1088. doi:10.1016/j.scitotenv.2019.07.052
Meng, Z., Li, M., Li, C., Liu, X., and Lei, Z. (2019). A Sensitive Phenol Electrochemical Sensor Based on Magnetic Oxide/Amino-Functional Graphene Nanocomposite. Int. J. Electrochem. Sci. 14 (3), 3126–3137. doi:10.20964/2019.03.25
Shao, J., Wang, C., Shen, Y., Shi, J., and Ding, D. (2022). Electrochemical Sensors and Biosensors for the Analysis of Tea Components: A Bibliometric Review. Front. Chem. 9, 818461. doi:10.3389/fchem.2021.818461
Singh, A. K., and Chandra, R. (2019). Pollutants Released from the Pulp Paper Industry: Aquatic Toxicity and Their Health Hazards. Aquat. Toxicol. 211, 202–216. doi:10.1016/j.aquatox.2019.04.007
Song, B. B., Zhen, Y. F., Yin, H. Y., and Song, X. C. (2019). Electrochemical Sensor Based on Platinum Nanoparticles Modified Graphite-like Carbon Nitride for Detection of Phenol. J. Nanosci. Nanotechnol. 19 (7), 4020–4025. doi:10.1166/jnn.2019.16297
Tafete, G. A., Thothadri, G., and Abera, M. K. (2022). “A Review on Carbon Nanotube-Based Composites for Electrocatalyst Applications,” in Fullerenes, Nanotubes and Carbon Nanostructures, 1–9. doi:10.1080/1536383x.2022.2028278
Tajik, S., Beitollahi, H., Nejad, F. G., Zhang, K., Le, Q. V., Jang, H. W., et al. (2020). Recent Advances in Electrochemical Sensors and Biosensors for Detecting Bisphenol A. Sensors 20 (12), 3364. doi:10.3390/s20123364
Wang, J., and Chen, H. (2020). Catalytic Ozonation for Water and Wastewater Treatment: Recent Advances and Perspective. Sci. Total Environ. 704, 135249. doi:10.1016/j.scitotenv.2019.135249
Wang, J., Wang, Y., Yao, Z., Liu, C., Xu, Y., and Jiang, Z. (2018). Preparation of Fe3O4/MWCNT Nano-Hybrid and its Application as Phenol Sensor. Mat. Res. Express 5 (7), 075003. doi:10.1088/2053-1591/aace38
Wang, Y., Wang, J., Yao, Z., Liu, C., Xie, T., Deng, Q., et al. (2018). Ni Nanoparticle Anchored on MWCNT as a Novel Electrochemical Sensor for Detection of Phenol. Nano 13 (11), 1850134. doi:10.1142/s1793292018501345
Xiao, X., Wang, Y., Zhang, D., Gong, J., Ma, J., Yang, T., et al. (2019). Synthesis of Pumpkin-like CeO2 Microstructures and Electrochemical Detection for Phenol. Inorg. Nano-Metal Chem. 49 (10), 349–353. doi:10.1080/24701556.2019.1661438
Xiao, X., Wang, Y., Zhang, D., Gong, J., Zhang, Y., Ma, J., et al. (2018). Synthesis of Columnar‐shaped CeO 2 and Electrochemical Sensor for Detecting Phenol. Micro & Nano Lett. 13 (10), 1382–1385. doi:10.1049/mnl.2018.5163
Yang, X., Li, J., Hou, C., Zhang, Q., Li, Y., and Wang, H. (2020). Skeleton-Structure WS2@CNT Thin-Film Hybrid Electrodes for High-Performance Quasi-Solid-State Flexible Supercapacitors. Front. Chem. 8, 442. doi:10.3389/fchem.2020.00442
Yin, H. Y., Zheng, Y. F., and Wang, L. (2020). Electrochemical sensor based on Na+ -doped g-C3 N4 for detection of phenol. Bull. Mat. Sci. 43 (1), 110. doi:10.1007/s12034-020-2081-0
Zhang, C., and Du, X. (2020). Electrochemical Sensors Based on Carbon Nanomaterial Used in Diagnosing Metabolic Disease. Front. Chem. 8, 651. doi:10.3389/fchem.2020.00651
Keywords: carbon nanotube, phenol, electrochemical sensor, nanocomposites, cerium dioxide
Citation: Hu C, Huang H, Yan Y, Hu Y, Liu S-J and Wen H-R (2022) Simple Synthesis of CeO2 Nanoparticle Composites In Situ Grown on Carbon Nanotubes for Phenol Detection. Front. Chem. 10:907777. doi: 10.3389/fchem.2022.907777
Received: 30 March 2022; Accepted: 27 April 2022;
Published: 17 May 2022.
Edited by:
Cheng Ma, Yangzhou University, ChinaReviewed by:
Hongcheng Pan, Guilin University of Technology, ChinaChang-Jie Mao, Anhui University, China
Copyright © 2022 Hu, Huang, Yan, Hu, Liu and Wen. This is an open-access article distributed under the terms of the Creative Commons Attribution License (CC BY). The use, distribution or reproduction in other forums is permitted, provided the original author(s) and the copyright owner(s) are credited and that the original publication in this journal is cited, in accordance with accepted academic practice. No use, distribution or reproduction is permitted which does not comply with these terms.
*Correspondence: Haiping Huang, aHVhbmdocEBqeHVzdC5lZHUuY24=