- 1Department of Pharmacology and Toxicology, Isfahan Pharmaceutical Sciences Research Center, School of Pharmacy and Pharmaceutical Sciences, Isfahan University of Medical Sciences, Isfahan, Iran
- 2Department of Chemistry, Kerman Branch, Islamic Azad University, Kerman, Iran
- 3Noncommunicable Diseases Research Center, Bam University of Medical Sciences, Bam, Iran
- 4Bam University of Medical Sciences, Bam, Iran
- 5Department of Environmental Health Engineering, School of Public Health, Bam University of Medical Sciences, Bam, Iran
This study synthesized a La2O3@snowflake-like Cu2S composite to fabricate an electrochemical sensor for sensitively simultaneous detection of diclofenac and chlorzoxazone exploiting an easy hydrothermal approach, followed by analysis with XRD, FE-SEM, and EDX methods. According to voltammetric studies, the electrocatalytic diclofenac and chlorzoxazone oxidations on the electrode modified with La2O3@SF-L Cu2S composites were increased, with greater oxidation currents, as well as the oxidation potential was significantly decreased due to synergetic impact of La2O3@SF-L Cu2S composites when compared with the pure SF-L Cu2S NS-modified electrode. The differential pulse voltammetry findings showed wide straight lines (0.01–900.0 μM) for La2O3 NP@SF-L Cu2S NS-modified electrode with a limit of detection (LOD) of 1.7 and 2.3 nM for the detection of diclofenac and chlorzoxazone, respectively. In addition, the limit of quantification was calculated to be 5.7 and 7.6 nM for diclofenac and chlorzoxazone, respectively. The diffusion coefficient was calculated to be 1.16 × 10⁻⁵and 8.4 × 10⁻⁶ cm2/s for diclofenac and chlorzoxazone oxidation on the modified electrode, respectively. Our proposed electrode was examined for applicability by detecting diclofenac and chlorzoxazone in real specimens.
1 Introduction
The treatment of osteoarthritis and rheumatoid arthritis as well as the relief of painful symptoms associated with musculoskeletal conditions are now possible with the simultaneous administration of many drugs. Thus, single-pill combinations (SPCs) were formulated to facilitate administration. This issue emphasizes the development of effective analytical approaches for the simultaneous detection of coadministered drugs in the presence of associated agents and impurities. One of the SPCs is a combination of diclofenac sodium and chlorzoxazone (Ahmed et al., 2020).
Chlorzoxazone (5-chloro-3H-benzooxazol-2-one) as a potent muscle relaxant is prescribed for painful musculoskeletal conditions with central function. The drug primarily affects the spinal cord and subcortical areas, thus inhibiting multisynaptic reflex arcs implicated in the production and maintenance of skeletal muscle spasms of various causes. The reduction of muscle tone and tension, and thus relief of spasms and pain associated with musculoskeletal disorders can occur with this drug (Abbar and Nandibewoor, 2012a). Sodium [o- (2,6-dichloroanilino) phenyl] acetate (diclofenac sodium or DS) belongs to the nonsteroidal anti-inflammatory drug (NSAID), which exhibits anti-inflammatory, analgesic, and antipyretic activity (Eteya et al., 2019). It is prescribed to manage many painful and inflammatory diseases, including renal colic, rheumatoid arthritis, soft tissue disorders, osteoarthritis, acute gout, migraine, and dysmenorrhea (Sweetman, 2005; Al-Turki et al., 2010). Concomitant administration of diclofenac sodium and chlorzoxazone is used to relieve moderate to severe pain associated with musculoskeletal spasms. Despite all this, serious side effects have been reported for this formulation such as heart attack and stroke, especially in long-term administration. Other reported side effects include gastrointestinal disorders, aplastic anemia, renal dysfunction, and agranulocytosis (Sweetman, 2005). Accordingly, the detection of trace amounts of these drugs in biological and pharmaceutical media is essential for therapeutic purposes and drug production. Various techniques were employed for the simultaneous detection of diclofenac and chlorzoxazone, such as absorbance difference spectrophotometry (Saheb et al., 2004), the spectrophotometric Q-absorbance ratio method (Patel and Prajapati, 2013), and the HPLC technique (Ahmed et al., 2020) exploiting CN-bonded phase column. However, the disadvantages of these methods are the need for derivatization and the time required for extraction (Zhang et al., 2010; Jahani, 2018; Setoudeh et al., 2020).
Among these, voltammetry is the proposed method for bypassing such problems due to its unique advantages such as rapid response, inherent selectivity, great sensitivity, simplicity, cost-effectiveness, and relatively short analysis time to determine organic molecules such as drugs and relevant molecules in biological fluids and pharmaceutical doses (Maaref et al., 2018; József et al., 2019; Salajegheh et al., 2019; Sargazi et al., 2019; Shetti et al., 2019; Kulkarni et al., 2020; Malode et al., 2020; Vakili Fathabadi et al., 2020; Liu et al., 2021a; Foroughi et al., 2021; Obireddy and Lai, 2021; Obireddy and Lai, 2022). An effective strategy to increase the electrochemical performance of sensors is to design composites by integrating highly electrocatalytic active materials with excellent conductivity materials, resulting in the electrode surface modification (Zhang et al., 2016; Foroughi and Ranjbar, 2017; Shetti et al., 2018; Fathi et al., 2020; Azizabadi et al., 2021; Liu et al., 2021b; Li et al., 2021; Liang et al., 2022; Qi et al., 2022).
Much research is currently being done on semiconductor nanostructures as part of active and integrated electrochemical nano-devices. Selecting a semiconductor material possessing a suitable bandgap is the most basic action in this research. In addition, if a material is abundant, non-toxic, green, and recyclable, it can be easily grown into various nanostructures using cost-effective techniques on different substrates (Mousavi-Kamazani et al., 2013; Guan et al., 2020). One of the suitable options to meet the aforementioned conditions with a 1.21-eV bandgap is copper (I) sulfide. Depending on the stoichiometric properties, copper sulfides can take many crystalline phases, from copper-rich Cu2S phases to copper-poor CuS2 phases (Mousavi-Kamazani et al., 2016). The pure production of each phase is of particular importance, especially in the case of chalcocite copper (I) sulfide (Cu2S) which is a widely used material in various fields (Kristl et al., 2013; Brewer and Arnold, 2014).
Lanthanum oxide (La2O3) is one of the important oxides belonging to the family of rare earth oxides. This p-type semiconductor with a 5.5-eV bandgap has been previously applied in different fields, such as in luminescence equipment, electromagnetic devices, super-capacitors, photoelectro-chemical cells, catalysts, gas sensors, and Li-ion batteries (Larsen et al., 2003). In addition to these advantages, La2O3 is a promising candidate as an alternative to the production of green sensors in detecting a variety of pollutants due to its unique properties such as greater capacity, admirable chemical and thermal stability, large dielectric constant (ε) of 27, less toxicity, broad voltage range, and less oxide leakage current. A significant elevation has been reported in the catalytic activity mediated by nanocomposites containing La2O3 loaded on various nanoparticles (NPs) (Lee et al., 2015; Zhou et al., 2016; Li et al., 2017; Yadav et al., 2017; Salinas et al., 2018; Jaffar et al., 2019; Umar et al., 2020).
For the first time, we synthesized and characterized the effective material, La2O3 nanoparticles (NPs)@snowflake(SF)-like Cu2S nanostructure (La2O3 NP@SF-L Cu2S NS composite), to modify the glassy carbon electrode. In addition, the literature review showed no studies on the electroanalysis and simultaneous detection of diclofenac and chlorzoxazone exploiting modified electrodes with novel nanocomposites. Voltammetric peaks were determined for diclofenac and chlorzoxazone on the proposed modified electrode. Great sensitivity and low limit of detections (LOD) were reported for these species because of the potent electrocatalytic potentials of La2O3 NP@SF-L Cu2S NS. The analytical behaviors of this sensor were examined for the simultaneous detection of diclofenac and chlorzoxazone using the voltammetric method. At last, the applicability of this sensor was determined to detect these compounds in the real samples.
2 Experimental
2.1 Solutions and Reagents
Sigma-Aldrich (Sigma-Aldrich, United States) was the selected company to prepare diclofenac, chlorzoxazone, ethylenediamine, thiourea ((NH2)2CS), lanthanum chloride hexahydrate (LaCl3·6H2O), and copper(II) chloride dihydrate (CuCl2·2H2O). Diclofenac and chlorzoxazone solutions (1.0 × 10⁻² M) were applied freshly by pouring certain levels of diclofenac and chlorzoxazone into distilled deionized water (100 ml) in a volumetric flask, which was maintained in dark at cool condition. The serial dilution was performed with phosphate buffer solution (PBS) to prepare more dilute solutions. The stock solutions of 0.1 M Na2HPO4 and 0.1 M NaH2PO4 were blended to prepare 0.1 M PBS and then adjusted to the desired pH via NaOH or HCl. All used reagents had analytical grade, and double distilled deionized water was utilized to prepare the solutions. No more purification was performed for any of the chemicals.
2.2 Equipment
X-ray diffractometer (Philips analytical PC-APD), radiation of graphite mono-chromatic Cu (α1, λ1 = 1.54056 Å), and radiation of Kα (α2, λ2 = 1.54439 Å) were used for X-ray powder diffraction (XRD) performed for the structural analysis of the product. The La2O3@SF-L Cu2S composite morphology was analyzed by using a KYKY-EM3200 digital scanning electron microscope (SEM). The chemical composition was determined by EDX spectrometry. SAMA500 electroanalyzer (SAMA Research Center, Iran) equipped with a personal computer was applied to carry out the electrochemical measurements. The used three-electrode system included an unmodified or modified glassy carbon electrode (GCE) as the working electrode, a saturated calomel electrode (SCE) as the reference electrode, and Pt wire as the auxiliary electrode. All electrochemical measurements were under a pure nitrogen atmosphere at an ambient temperature.
2.3 Fabrication of the Proposed La2O3@SF-L Cu2S Composites
In the present study, a simple hydrothermal protocol was performed to construct La2O3@SF-L Cu2S composites. Thus, LaCl3·6H2O (0, 10, 20, and 30 wt%) and 170.48 mg of CuCl2·2H2O were poured into 50 ml of ethylenediamine. For this, 228.36 mg of (NH2)2CS was appended to obtain well-dispersed reactants while constantly stirring for 2 h, followed by placing a Teflon-lined stainless steel autoclave (150 ml) at different temperatures of 70, 80, and 90°C for 8 h. Next, the solutions were cooled down and the resulting products were removed and washed several times with distilled water and ethanol, followed by drying in an oven at 80°C for 8 h and storing for further testing.
2.4 Fabrication of Modified Electrode
The pretreatment of the GCE was performed using 0.05 μm of alumina slurry on a polishing cloth, and then washed with water and sonicated for 5 min in water. The matters adsorbed on the electrode surface were removed through ultrasonication in ethanol and double-distilled water for 5 min. The bare GCE (BGCE) modification was carried out by La2O3@SF-L Cu2S composites. Then, La2O3@SF-L Cu2S composites (1 mg) were distributed and ultrasonicated for an hour for the collection of stock solution with La2O3@SF-L Cu2S composites in 1 ml of an aqueous solution. The concentration of suspension is 1 mg/1 ml. Next, an aliquot of La2O3@SF-L Cu2S composites/H2O suspension solution (5 µl) was placed on the carbon working electrode, and subsequently, the solvent was evaporated at the ambient temperature.
2.5 Electrochemical Approach (Characterization and Testing)
Cyclic voltammetry (CV), chronoamperometry (CHA), and differential pulse voltammetry (DPV) were applied for electrochemical studies and quantification of diclofenac and chlorzoxazone, respectively.
CV is performed to a phosphate buffer (0.1 M, pH = 7.0) with and without the presence of diclofenac and chlorzoxazone (275.0 μM), starting at the equilibrium potential in the anodic direction using a potential window of 0.24–0.93 V at different scan rates. Anodic peaks are analyzed in order to establish the relation between the maximum current intensity of the anodic peaks with the scan rate.
Under optimized conditions, CHA experiments were carried out at an applied potential of 0.63 and 0.89 V versus SCE using different concentrations of diclofenac and chlorzoxazone, respectively.
In order to achieve the higher analytical response (anodic current), the optimal conditions for DPV measurements were as follows: PBS, pH 7.0, modulation amplitude of 0.02505 V, modulation time of 30 ms, interval time of 200 ms, step potential of 10 mV, initial potential = 200 mV, and end potential of 940 mV. To achieve the DP voltammograms of diclofenac and chlorzoxazone, appropriate volumes of the stock solutions of drugs were added to the cell containing supporting electrolytes on total bulk of 25 ml.
2.6 Analysis of Real Specimens
We procured the tablet solutions by completely powdering and combining five diclofenac (labeled 100 mg, Shafa Co., Tehran: Iran). Then, we used the ultrasonic bath for 4 min in order to dissolve a sufficient volume of the resulting fine powders of diclofenac in 0.1 M phosphate buffer pH = 7.0. Consequently, various volumes of all solutions have been transferred into a 25.0 ml voltammetric cell, and a standard addition procedure has been used to analyze diclofenac.
The human samples (urine and blood serum) were collected from healthy subjects and stored at −20°C for next testing. In the experiments, 2.5 ml of samples were poured into PB (22.5 ml)-containing vials, and then added with a certain volume of diclofenac or chlorzoxazone stock solution and subsequently poured into electrochemical cells.
3 Results and Discussion
3.1 Characterization of La2O3 NP@SF-L Cu2S NS Composite
The SF-L Cu2S NS formation was confirmed by the SEM images. It was found that Cu2S is composed of one or more dendrites at 70°C, as shown in Figure 1A. Figures 1B,C (SEM images) show snowflake structures for the as-produced Cu2S specimens at 80°C. Images of a snowflake with high magnification (Figure 1C) reveal a pattern with 6x symmetry so that different large ferns emerge from a common center, which is branched in the center and along an angle of 60° from the center. The six dendritic petals have a length of approximately 2–3 µm. Further details obviously show a long central backbone and highly symmetrical secondary branches for each fern that grows preferably in two distinct directions rather than randomly. Figure 1C shows unprecedented six-branched dendrites and more branch growth. SF-L Cu2S NS is broken down with increasing reaction temperature up to 90°C and forms a sheet-like morphology (Figure 1D). Different reaction temperatures create significant differences in the morphology of Cu2S owing to the degree of effective coordination of ethylenediamine. The [Cu(En)2]2+ complex is formed by ethylenediamine via the copper cation at 80°C, which may initially form the nucleus and crystalline growth of Cu2S, and subsequently the snowflake structures. Because of the volatility of ethylenediamine, the solution forms the reduced complex at higher reaction temperatures up to 90°C. Therefore, the morphology of the as-produced Cu2S specimens is influenced by higher temperatures.
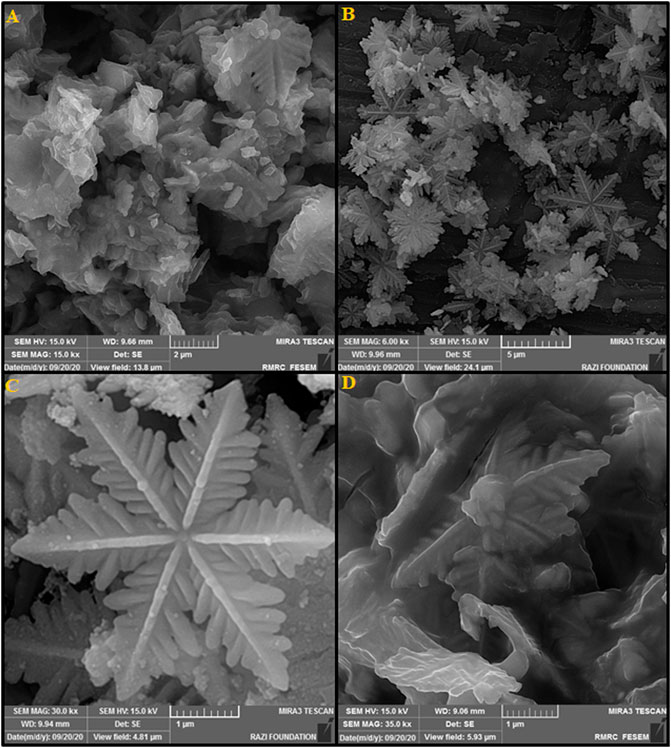
FIGURE 1. FESEM images of the La2O3 NP@SF-L Cu2S NS composite under various reaction temperatures: (A) 70°C, (B,C) 80°C, and (D) 90°C.
The SEM images taken from La2O3@SF-L Cu2S composites in the presence of different loading levels of La2O3 are shown in Figure 2. Limited NPs have been gathered onto the SF-L Cu2S NS surface, for La2O3@SF-L Cu2S composites with 10 wt% La2O3 (Figure 2A). According to Figures 2B–D showing the SEM images taken from La2O3@SF-L Cu2S composites with 20 wt% La2O3, the SEM images display the limited-layered La2O3 NP coating on the SF-L Cu2S NS surface in the case of right amount of La2O3 loading, which means ultrathin La2O3 NPs similar to pure La2O3 NP as seen in Figure 2F. For La2O3@SF-L Cu2S composites (30 wt% La2O3), the amount of La2O3 precursors is critical as probably because of aggregating to form NPs (Figure 2E), the snowflake-like structure is completely destroyed and forms an amorphous mass that suppresses the catalytic activity of the catalysts. Hence, the optimal wt% was selected to be 20 wt% La2O3 for next electrochemical testing.
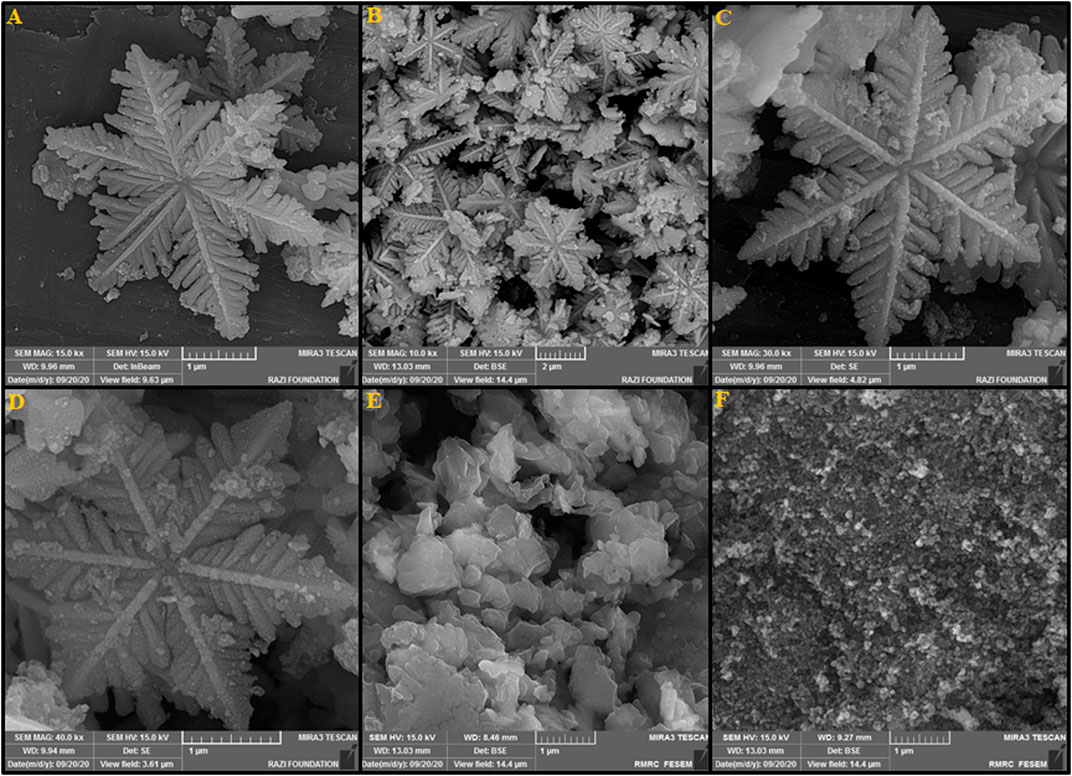
FIGURE 2. FESEM images of the La2O3 NP@SF-L Cu2S NS composite with different La2O3 loading amounts: (A) 10 wt% La2O3, (B–D) 20 wt% La2O3, and (E) 30 wt% La2O3. (F) The FESEM image of La2O3 NP.
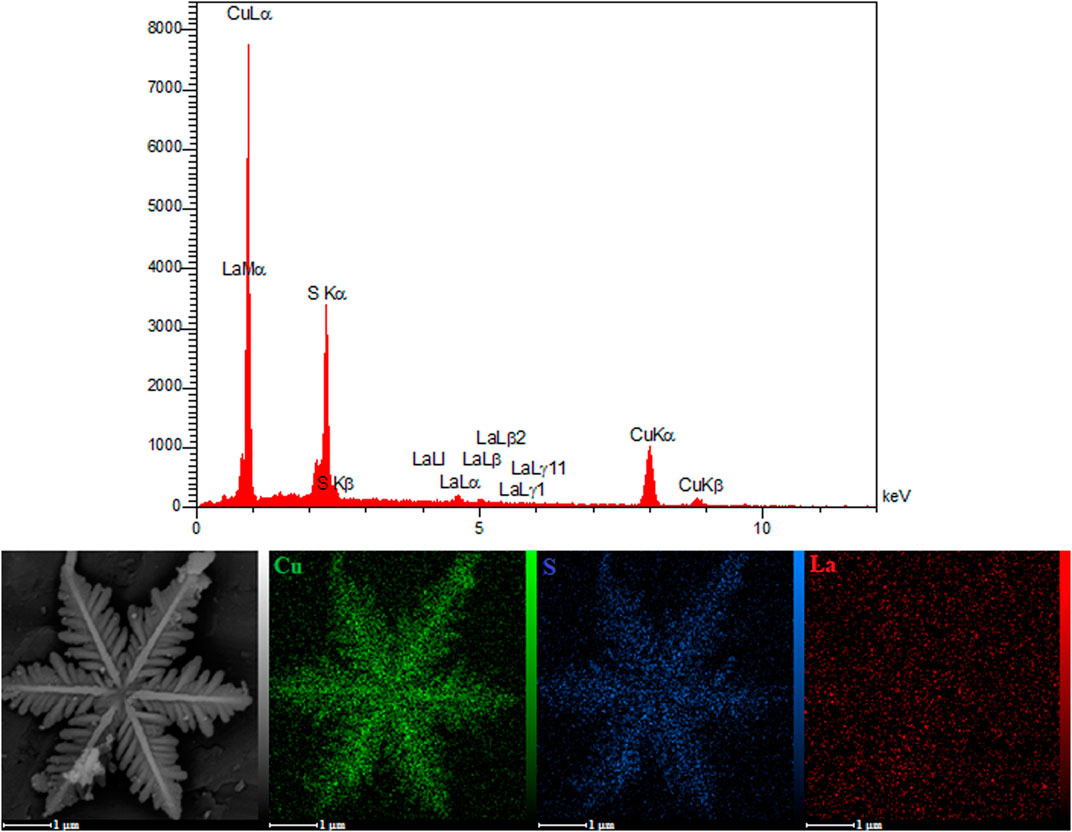
As seen in Figure 3, the EDS analysis and the mapping images for the La2O3 NP@SF-L Cu2S NS composite with 20 wt% La2O3 confirmed uniform dispersion of each Cu, S, and La elements, and also uniform aggregation of the La2O3 NPs on the SF-L Cu2S NS surface.
Figure 4A shows the XRD spectra taken from the as-produced SF-L Cu2S NS at 80°C. The positions of the XRD peaks prepared from the specimens are well consistent with the theoretical amounts of the orthorhombic stage of Cu2S (JCPDS 02–1294) (Chen et al., 2008). There were not any characteristic peaks as a result of any impurity, highlighting the excellent product purity. The intensity and sharpness of the peaks of XRD show well-crystallized Cu2S, and therefore decreased resistance of electron transfer. The XRD spectra from La2O3 NPs (La2O3 NP) are shown in Figure 4B. Based on the XRD patterns, various diffraction peaks can be seen for La2O3 NP with the polycrystalline morphology. Thus, each La2O3 NP diffraction peak is fully indexed in the structure of the quadrilateral crystal system (JCPDS Case No. 83–1348), highlighting a pure phase for the powder with hexagonal La2O3. Figure 4C attributes all sharp and obvious peaks at La2O3 NP@SF-L Cu2S NS patterns containing various amounts of La2O3 NP loading with 20 wt% La2O3 NP to orthorhombic Cu2S (JCPDS 02–1294) and hexagonal La2O3 (JCPDS 83–1348) (Kabir et al., 2018), which means successful fabrication of La2O3@SF-L Cu2S composites.
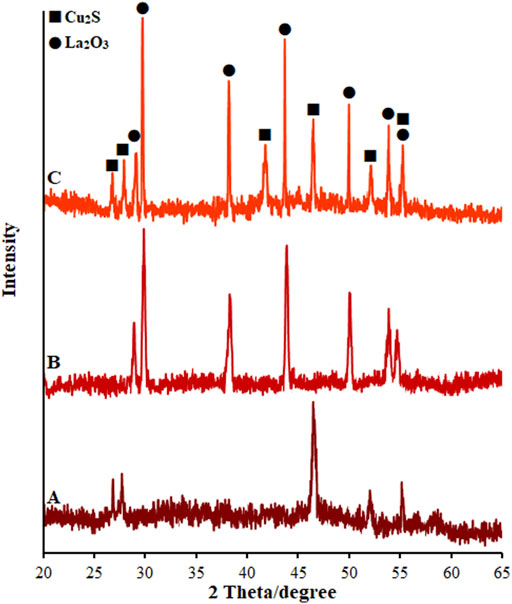
FIGURE 4. XRD pattern of (A) SF-L Cu2S NS, (B) La2O3 NP, and (C) La2O3 NP@SF-L Cu2S NS composite (20 wt% La2O3).
3.2 Electrochemical Characterization of the La2O3@SF-L Cu2S/GCE Sensor
The CV curves for a bare GCE, SF-L Cu2S/GCE, and La2O3@SF-L Cu2S/GCE in the redox probe were plotted for the characterization of the modified GCE surface. As seen in Figure 5A, two reversible redox peaks are observed for a bare GCE, SF-L Cu2S/GCE, and La2O3@SF-L Cu2S/GCE, with a peak-to-peak difference (ΔEp) of 0.29, 0.24, and 0.17 V, respectively. The La2O3@SF-L Cu2S/GCE had an enhancement in the peak current corresponding to greater porosity of the La2O3@SF-L Cu2S composite-modified electrode surface. The redox probe electron transfer on the modified electrode surface can be facilitated by such excellent morphology of La2O3@SF-L Cu2S composites. The properties of La2O3@SF-L Cu2S composites were electrochemically determined using the EIS approach. In this method, the charge–transfer resistance (Rct) is a factor to monitor the redox probe electron transfer kinetics at the electrode interface, which means substrate attachment on the modified electrode surface. Figure 5B shows Nyquist plots of the bare GCE, SF-L Cu2S/GCE, and La2O3@SF-L Cu2S/GCE in the redox probe. Figure 4B shows a large semicircular part for bare GCE at high frequencies, as a great charge transfer resistance (Rct = 1248 Ω) corresponding to low charge and mass transfer rate on the bare GCE surface. Dramatically reduced Rcts (561 and 329 Ω) were calculated for SF-L Cu2S NS and La2O3@SF-L Cu2S composites loaded on the GCE surface, probably due to the potent ability of SF-L Cu2S NS and La2O3@SF-L Cu2S composites to amplify the electron transfer and enhance the electrode surface area.
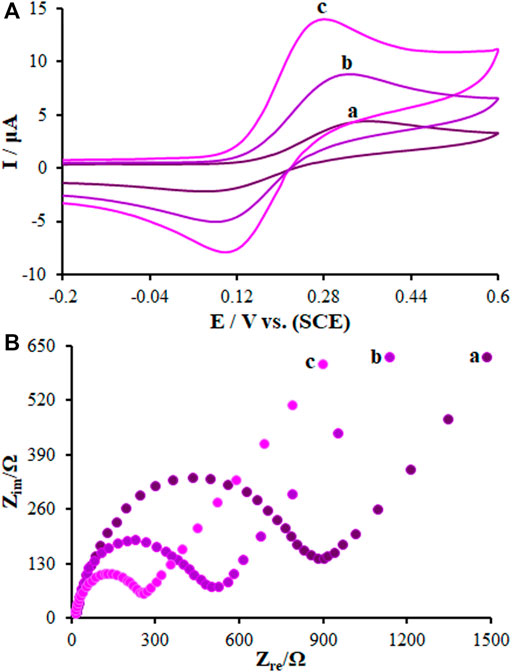
FIGURE 5. (A) CVs of (a) BGCE, (b) SF-L Cu2S/GCE, and (c) La2O3@SF-L Cu2S/GCE in the presence of 0.4 mM [Fe(CN)6]3- solution in aqueous 0.1 M KCl. (B) EIS diagrams for 0.1 mM [Fe(CN)6]3- solution at (a) BGCE, (b) SF-L Cu2S/GCE, and (c) La2O3@SF-L Cu2S/GCE in aqueous 0.1 M KCl. Frequency range 100 KHz to 0.1 Hz.
The Randles–Sevcik Eq. 1 was computed to analyze the efficacy of the embedded sensor, the bare GCE, SF-L Cu2S/GCE, and La2O3@SF-L Cu2S/GCE (Figure 6) (Bard and Faulkner, 2001):
where all symbols possess normal meaning. The A values are 0.082, 0.17, and 0.27 cm2 for the surfaces of the bare GCE, SF-L Cu2S/GCE, and La2O3@SF-L Cu2S/GCE, respectively.
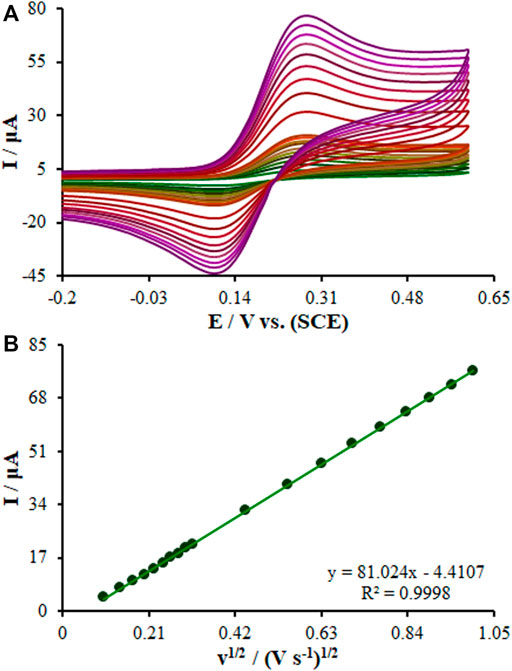
FIGURE 6. (A) CVs of La2O3@SF-L Cu2S/GCE in the presence of 0.4 mM [Fe(CN)6]3- solution in aqueous 0.1 M KCl at various scan rates (from inner to outer curve): 10, 20, 30, 40, 50, 60, 70, 80, 90, 100, 200, 300, 400, 500, 600, 700, 800, 900, and 1000 mV/s. (B) The plot of peak currents vs υ1/2.
The electrode surface modification was evaluated by calculating the standard heterogeneous rate constant (k0) based on the EIS, Eq. 2 (Bard and Faulkner, 2001):
where k0 stands for the rate constant for electron standard transfer that is heterogeneous (cm/s), R for global gas constant (squared with 8.314 J/K/mol), T for the temperature of the thermodynamic process (298.15 K), F for the Faraday constant values (96.485 C/mol), Rct for electron transfer resistance (Ω), A for the electrode surface area (cm2), and C for the concentration of 0.1 mM [Fe(CN)6]3-/4- solution.
The k0 values were 2.6 × 10⁻², 2.8 × 10⁻², and 3.0 × 10⁻² cm/s for the bare GCE, SF-L Cu2S/GCE, and La2O3@SF-L Cu2S/GCE, respectively. K0 values approach the redox couple’s kinetic potential. Therefore, a system with a higher value of k0 balances under lower time conditions compared to that with a lower value of k0, so this will be a longer balance. Hence, a higher value of k0 would be achieved than La2O3@SF-L Cu2S/GCE > SF-L Cu2S/GCE > GCE as for the La2O3@SF-L Cu2S/GCE sensor, which means greater swift electron transfer than the other electrodes.
3.3 Voltammetric Responses of Diclofenac and Chlorzoxazone
Electrochemical responses of diclofenac and chlorzoxazone (275.0 μM each) mixture in 0.1 M PBS (pH = 7) on the La2O3@SF-L Cu2S/GCE, SF-L Cu2S/GCE, and bare GCE (BGCE) surfaces were analyzed using the cyclic voltammetry (CV) method. Based on Figure 7 (curve a), the diclofenac and chlorzoxazone oxidation peaks merged (0.73 V) with a very low peak current at the BGCE. On the other hand, two clear peaks were seen for diclofenac and chlorzoxazone on the modified SF-L Cu2S/GCE at 0.64 and 0.86 V, respectively (Figure 7 (curve b)). According to Figure 7 (curve b), the peak currents for diclofenac and chlorzoxazone on SF-L Cu2S/GCE are many times higher than BGCE due to the catalytic activity of SF-L Cu2S NS. In addition, in Figure 7 (curve c), the potential of the peaks was shifted to a less positive potential (0.59 and 0.84 V for diclofenac and chlorzoxazone, respectively) than SF-L Cu2S/GCE and BGCE. Figure 7 (curve c) shows an elevation in the peak current following the augmentation of La2O3 NP to the SF-L Cu2S NS due to the large surface area and high conductivity of La2O3@SF-L Cu2S composites. The separation rates of diclofenac–chlorzoxazone oxidation peak potentials were estimated at 0.25 V, which were sufficient for the simultaneous detection of these compounds.
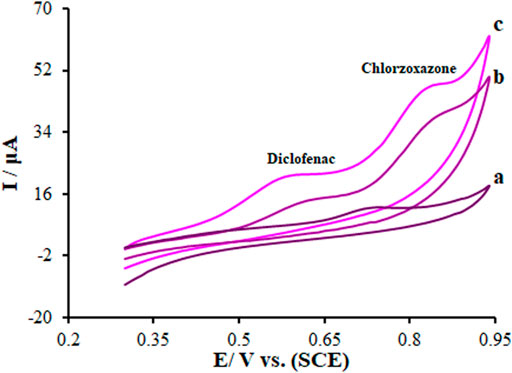
FIGURE 7. CVs of (A) BGCE, (B) SF-L Cu2S/GCE, and (C) La2O3@SF-L Cu2S/GCE in the presence of diclofenac (275.0 µM) and chlorzoxazone (275.0 µM) at a pH 7.0, respectively. In all cases, the scan rate was 50 mV s−1.
3.4 The pH Effect on Diclofenac and Chlorzoxazone Oxidation
The electrolyte pH significantly affects the electrooxidation of diclofenac and chlorzoxazone due to the participation of protons in the electrode reaction. The CV method was performed to analyze the pH impact on the signal of La2O3@SF-L Cu2S/GCE exploiting buffer solutions (0.1 M) at different pH values of 4.0–8.0, and the results can be seen in Figure 8. A slight elevation occurred in the peak currents of diclofenac and chlorzoxazone by elevating the solution pH until 7.0 and then reduction. The pH value of 7.0 resulted in the greatest peak current for the two compounds. A gradual increase in the solution pH caused the shift of peak oxidation potential of diclofenac and chlorzoxazone to less positive values, indicating the participation of protons in the electrode reactions. The PBS at the pH value of 7.0 caused the optimal reaction for peak current and peak shape, and negatively shift, suggesting pH 7.0 as the best value for subsequent tests. Figure 8B shows the plot of Ep versus pH for diclofenac and chlorzoxazone in the working pH range. There was a linear relationship between Ep values of two compounds and buffer solution pH, as follows:
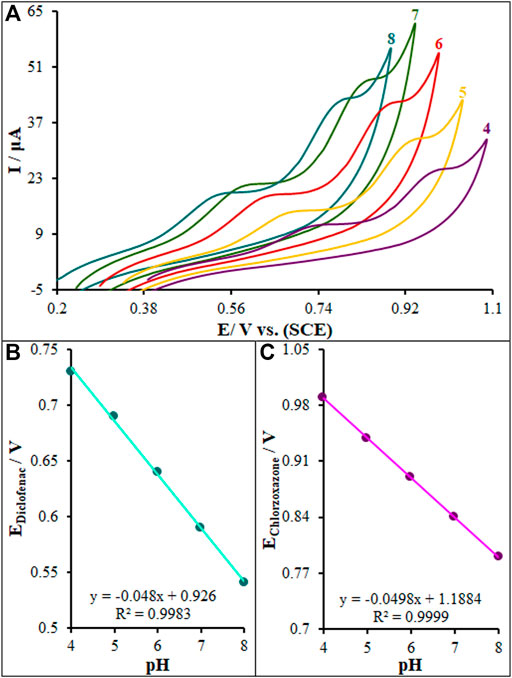
FIGURE 8. Effect of pH on the peak current for the oxidation of diclofenac (275.0 µM) and chlorzoxazone (275.0 µM); pH = 4–8. In all cases, the scan rate was 50 mV s−1.
As for slopes of 0.048 and 0.0498 mV/pH for diclofenac and chlorzoxazone, respectively, they were close to the predicted Nernstian value for an equal electron and proton electrochemical process (Bard and Faulkner, 2001). In conclusion, equal numbers of protons and electrons play a role in the electrode processes.
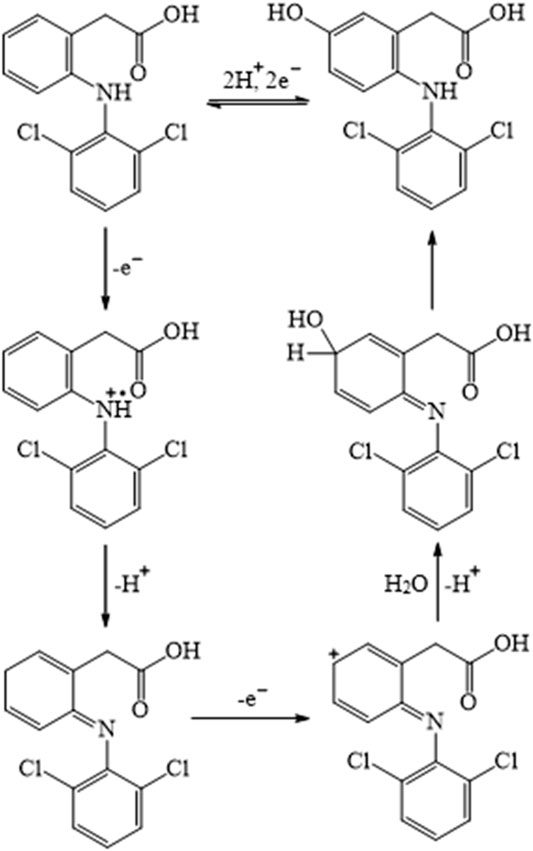
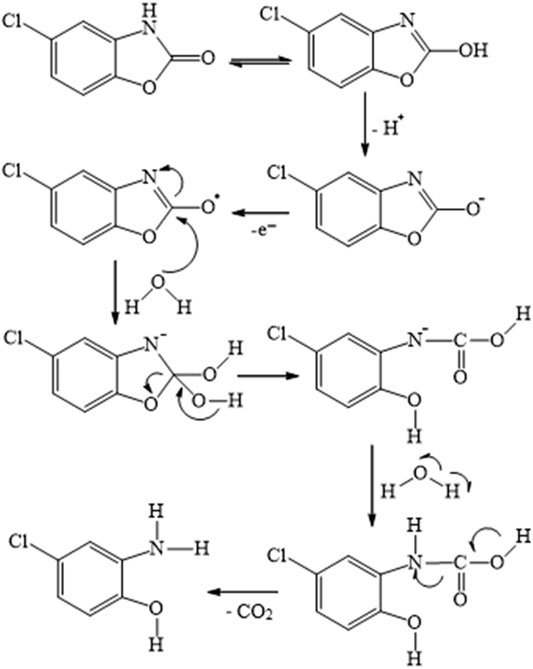
In the proposed method, the total involvement of protons and electrons of diclofenac was found to be two. So, the following Scheme S1 was predicted as a likely electrooxidation mechanism of diclofenac. In addition, chlorzoxazone oxidation is a one-electron one-proton process, the possible product of oxidation is found to be 2-amino-4-chloro-phenol with the liberation of carbon dioxide, and the mechanism is as shown in Scheme S2. These observations were in accordance with earlier reports (Abbar and Nandibewoor, 2012a; Honakeri et al., 2020).
3.5 The Scan Rate Effect on Electrochemical Responses of Diclofenac and Chlorzoxazone
The CV method was employed to evaluate the scan rate effect on the oxidation peak current of diclofenac and chlorzoxazone on the La2O3@SF-L Cu2S/GCE. Figure 9A shows an elevation in the intensity of peak current by raising the scan rate. Based on Figure 9B, the current directly fitted the square root of scan rates (10–1000 mV/s), strongly suggesting diffusion-controlled redox reactions of diclofenac and chlorzoxazone. At last, 50 mV/s was selected as the optimal scan rate to achieve the best performance for peak currents and peak separation.
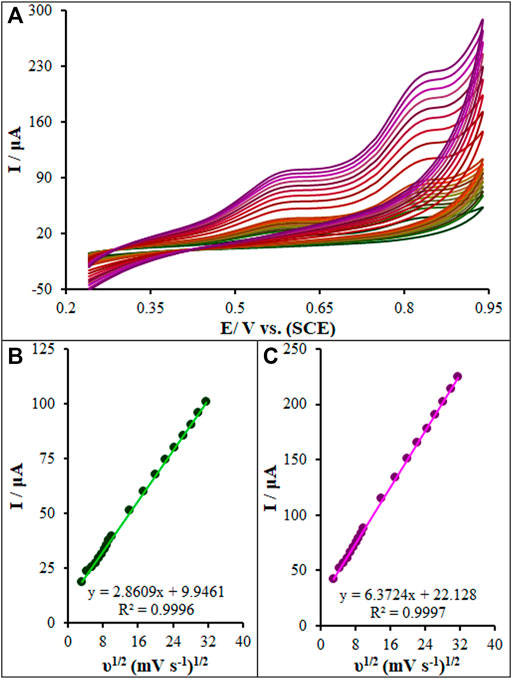
FIGURE 9. (A) CVs of La2O3@SF-L Cu2S/GCE in pH 7.0 in the presence of diclofenac (275.0 µM) and chlorzoxazone (275.0 µM) at various scan rates (from inner to outer curve): 10, 20, 30, 40, 50, 60, 70, 80, 90, 100, 200, 300, 400, 500, 600, 700, 800, 900, and 1000 mV/s. (B) The plots of peak currents vs υ1/2.
3.6 The Chronoamperometric Measurements
The chronoamperometric measurements of diclofenac and chlorzoxazone on the La2O3@SF-L Cu2S/GCE were performed in the working electrode potential at 0.63 and 0.89 V versus SCE for different diclofenac and chlorzoxazone concentrations, respectively, in PBS at the pH value of 7.0 (Figures 10A,E). For an electrical agent with a certain diffusion coefficient (D), the Cottrell equation was considered to describe the electrochemical reaction current with a mass transport-limited rate (Bard and Faulkner, 2001).
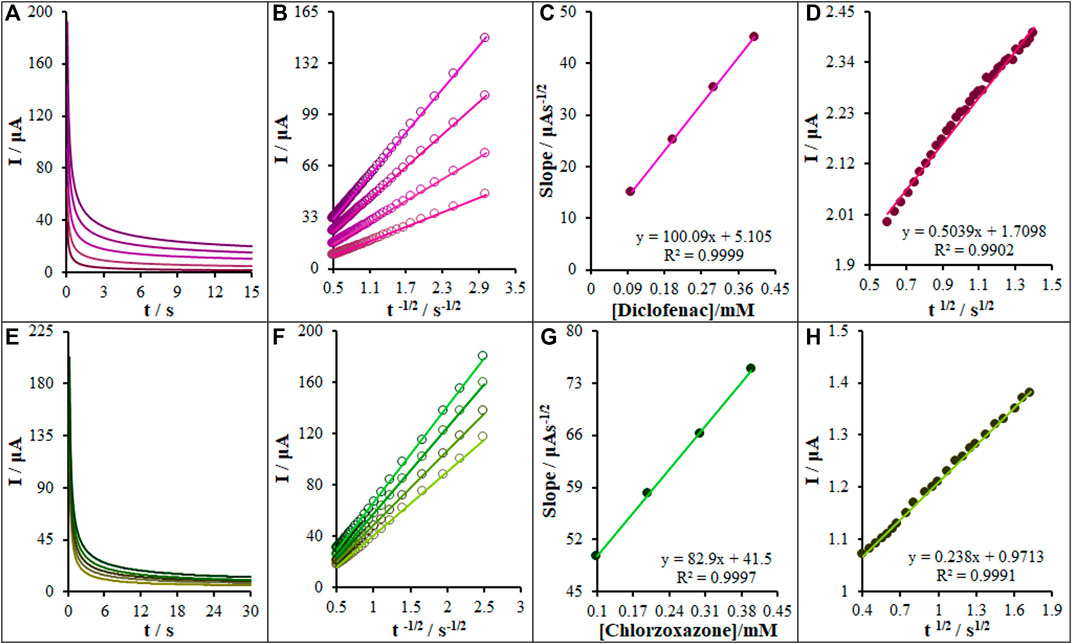
FIGURE 10. (A) Chronoamperograms obtained at La2O3@SF-L Cu2S/GCE in 0.1 M PBS (pH 7.0) for different concentrations of diclofenac (from inner to outer curve): 0.0, 0.1, 0.2, 0.3, and 0.4 mM. (B) Plots of I vs t−1/2 obtained from chronoamperograms 2–5. (C) The plot of the slope of the straight lines against diclofenac concentration. (D) The plot of IC/IL vs. t1/2 obtained from chronoamperograms one and two. (E) Chronoamperograms obtained at the La2O3@SF-L Cu2S/GCE in 0.1 M PBS (pH 7.0) for different concentrations of chlorzoxazone (from inner to outer curve): 0.0, 0.1, 0.2, 0.3, and 0.4 mM. (F) Plots of I vs t−1/2 obtained from chronoamperograms 2–5. (G) The plot of the slope of the straight lines against chlorzoxazone concentration. (H) The plot of IC/IL vs. t1/2 obtained from chronoamperograms one and two.
A plot of I versus t−1/2 is linear under diffusion control (Figures 10B,F); the D value for diclofenac and chlorzoxazone can be calculated on the basis of the linear region slope of Cottrell’s plot (Figures 10C,G). The DDiclofenac and DChlorzoxazone values were, respectively, 1.16 × 10⁻⁵ and 3.2 × 10⁻⁵ cm2/s.
Chronoamperometry was recruited to compute the constant of the catalytic rate (k) for the reaction of the La2O3@SF-L Cu2S/GCE with diclofenac and chlorzoxazone based on the Galus method (Galus, 1976):
where IC stands for diclofenac and chlorzoxazone catalytic currents on the La2O3@SF-L Cu2S/GCE, IL for limiting current without diclofenac and chlorzoxazone, and
where t stands for elapsed time (in seconds). Accordingly, the slope from the plot of IC/IL versus t1/2 is recruited to compute the catalytic process constant (k) for the concentrations of diclofenac and chlorzoxazone. Figures 10E,H show the plots from chronoamperograms in Figures 10A,E. Based on the slopes, the mean values of k were 8.1×10³ and 1.8 × 10³ M−1 s−1. The k value can explain the sharp property of the catalytic peak for diclofenac and chlorzoxazone catalytic oxidation on the La2O3@SF-L Cu2S/GCE surface.
3.7 Quantification of Diclofenac and Chlorzoxazone
Diclofenac and chlorzoxazone quantifications were performed using differential pulse voltammetry (DPV) (Figures 11A,C). One clear linear segment with varied slopes can be observed on voltammograms related to the plot of diclofenac and chlorzoxazone concentration versus peak current, as seen in Figures 11B,D. Electrocatalytic peak currents from the oxidation of diclofenac and chlorzoxazone on the La2O3@SF-L Cu2S/GCE surface had a linear correlation with different concentrations of diclofenac and chlorzoxazone (0.01–900.0 μM). The limit of detections (LOD, 3Sb/m) were computed to be 1.7 and 2.3 nM for diclofenac and chlorzoxazone, respectively, where Sb stands for the standard deviation of blank and m for the slope of calibration plot. In addition, the limit of quantifications (LOQ, 3Sb/m) were calculated to be 5.7 and 7.6 nM for diclofenac and chlorzoxazone, respectively.
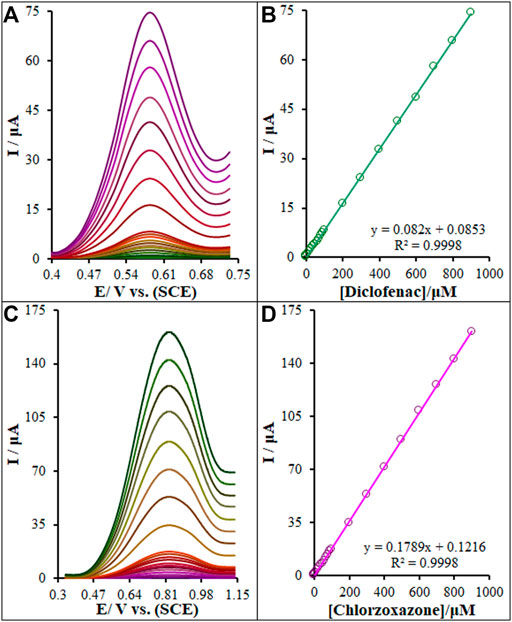
FIGURE 11. (A) and (C) DPVs of the La2O3@SF-L Cu2S/GCE in 0.1 M (pH 7.0) containing different concentrations of diclofenac and chlorzoxazone, respectively (from inner to outer curve): 0.01, 0.1, 1.0, 10.0, 20.0, 30.0, 40.0, 50.0, 60.0, 70.0, 80.0, 90.0, 100.0, 200.0, 300.0, 400.0, 500.0, 600.0, 700.0, 800.0, and 900.0 µM. (B) and (D) Plots of the electrocatalytic peak currents as a function of diclofenac and chlorzoxazone concentrations in the range of 0.01–900.0 µM, respectively.
3.8 Simultaneous Detection of Diclofenac and Chlorzoxazone
According to Figure 12A, we found two well-separated peaks and two peak currents increased linearly with the increase of the concentrations of diclofenac and chlorzoxazone. This demonstrates the feasibility of the simultaneous determination of the aforementioned species in the mixture solution applying DPV. The sensitivity of the modified electrode toward the oxidation of diclofenac and chlorzoxazone was found to be 0.082 μA μM−1 and 0.1789 μA μM−1, respectively, which is very close to the values obtained in the absence of another one’s (0.0828 μA μM−1 and 0.1785 μA μM−1, see Section 3.7) (Figures 12B,C). These results are indicative that the oxidation processes of these compounds at the La2O3@SF-L Cu2S/GCE are independent, and therefore, simultaneous determination of their mixtures is possible without significant interferences. Five consecutive detections of diclofenac and chlorzoxazone (100.0 μM) showed a relative standard deviation (RSD%) of 1.8 and 2.2, respectively, confirming the effectiveness of the proposed electrode for the simultaneous detection of diclofenac and chlorzoxazone.
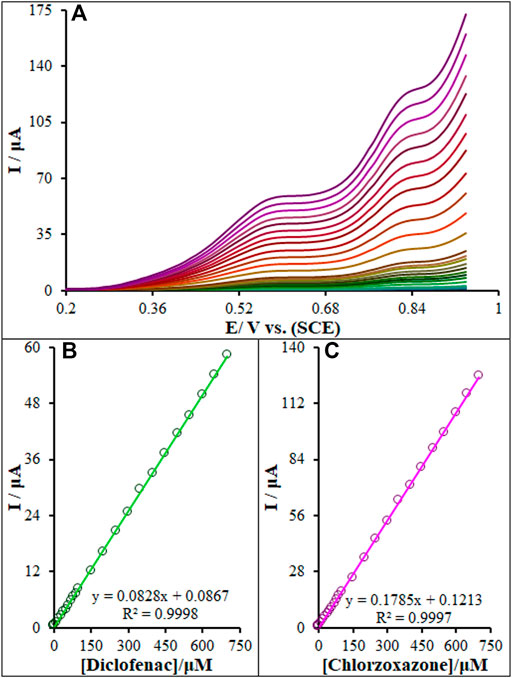
FIGURE 12. (A) DPVs of La2O3@SF-L Cu2S/GCE in 0.1 M (pH 7.0) containing different concentrations of diclofenac and chlorzoxazone (from inner to outer curve): 0.01, 0.1, 1.0, 10.0, 20.0, 30.0, 40.0, 50.0, 60.0, 70.0, 80.0, 90.0, 100.0, 150.0, 200.0, 250.0, 300.0, 350.0, 400.0, 450.0, 500.0, 550.0, 600.0, 650.0, and 700.0 µM. (B) and (C) Plots of the electrocatalytic peak currents as a function of diclofenac and chlorzoxazone concentrations in the range of 0.01–700.0 µM, respectively.
3.9 Interference Measurements
The coexistence of diclofenac and chlorzoxazone in real samples emphasizes the necessity of examining their interference for the selective determination of one species. In each test, the concentration of a species was variable while keeping constant another one’s concentrations, and the results of which are shown in Figures 13A,C. Figure 13A shows an elevation in the diclofenac oxidation peak current by increasing its concentration, while the chlorzoxazone oxidation peak current was constant. Figure 13B shows that the voltammetric peak of diclofenac oxidation elevated linearly in line by increasing their concentration, but the oxidation peak current of chlorzoxazone was constant. According to the results, peak currents were linearly correlated with diclofenac (or chlorzoxazone) concentrations, while no change occurred in the other compound; this demonstrates the independent implementation of diclofenac and chlorzoxazone oxidation on the La2O3@SF-L Cu2S/GCE.
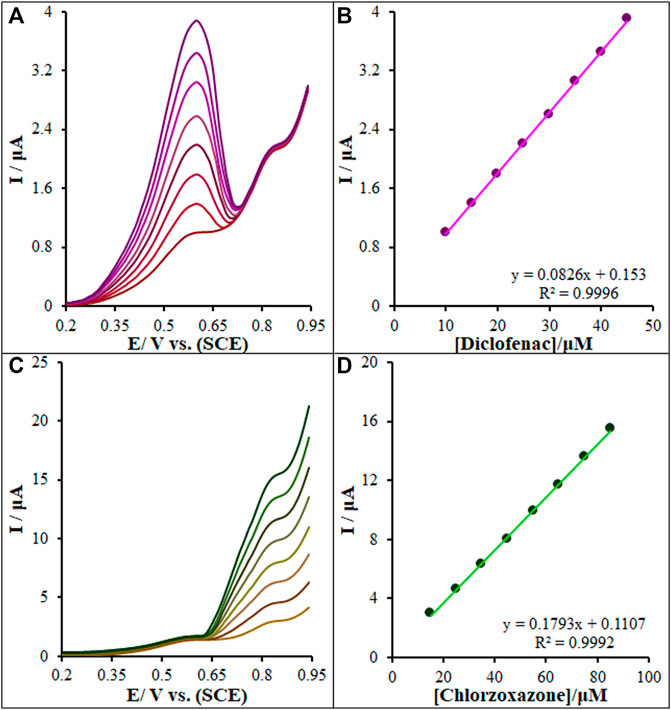
FIGURE 13. (A) DPVs of La2O3@SF-L Cu2S/GCE in 0.1 M (pH 7.0) containing 15.0 µM of chlorzoxazone, and different concentrations of diclofenac (from inner to outer curve): 10.0, 15.0, 20.0, 25.0, 30.0, 35.0, 40.0, and 45.0 µM. (B) Analytical curve from diclofenac. (C) 15.0 µM of diclofenac, and different concentrations of chlorzoxazone (from inner to outer curve): 15.0, 25.0, 35.0, 45.0, 55.0, 65.0, 75.0, and 85.0 µM. (D) Analytical curve from chlorzoxazone.
3.10 Analysis of Real Specimens
Diclofenac tablets, human blood serum, and urine samples were analyzed to assess the analytical applicability of the proposed method for simultaneous detection of diclofenac and chlorzoxazone. Thus, the diclofenac and chlorzoxazone levels were measured in these specimens. The samples spiked with a certain level of diclofenac and chlorzoxazone were analyzed to examine the method’s reliability (Table 1). The obtained recovery was between 97.4% and 102.4% for diclofenac and chlorzoxazone, confirming the applicability of the proposed electrode for simultaneous detection of diclofenac and chlorzoxazone.

TABLE 1. Application of La2O3@SF-L Cu2S/GCE for concurrent determination of diclofenac and chlorzoxazone in diclofenac tablets, human blood serum, and urine samples. All concentrations are in µM.
3.11 Reproducibility, Repeatability, and Stability
The DPV method was used to study the stability, reproducibility, and repeatability of the electrochemically fabricated sensor under optimized conditions. After six consecutive applications of the La2O3@SF-L Cu2S/GCE to measure the 10.0 µM of diclofenac and chlorzoxazone solution, no distinct change was found in the DPV response. The relative standard deviation (RSD%) of 0.94% confirmed the satisfactory repeatability of the proposed sensor. The DPV method was performed additionally to assess the electrode reproducibility. Six consecutive measurements were carried out to evaluate reproducibility, followed by calculating RSD%. The intra-electrode and interelectrode RSD% was about 1.25% and 2.83%, respectively. The stability of the modified electrochemical sensor was analyzed as well. The electrodes were left in an ambient room for 3 weeks, and there was no significant fluctuation in peak current (2.6%), confirming the appropriate stability of the La2O3@SF-L Cu2S/GCE under optimized conditions. The selectivity of the method was evaluated by testing the 10.0 µM diclofenac and chlorzoxazone solution in exposure to several compounds with potential interferents containing 100-fold sucrose, ascorbic acid, citric acid, dopamine, vitamin B6, uric acid, vitamin B2, glucose, and starch. According to the results (the signal change of less than 3%), no significant interference was seen between those compounds and diclofenac and chlorzoxazone detection. The proposed method subsequently demonstrated a considerable selectivity for diclofenac and chlorzoxazone detection.
3.12 Comparison of Our Method With Others in the Literature
The comparison of analytical efficacy between the as-fabricated electrode and other electrochemical methods was performed individually for each of diclofenac and chlorzoxazone (Tables 2). Based on Table 2, the performance of our proposed electrochemical electrode for sensing diclofenac and chlorzoxazone displayed a comparable linear range, and better detection limit and sensitivity than other methods (Goyal et al., 2010; Abbar and Nandibewoor, 2012a; Abbar and Nandibewoor, 2012b; Chethana et al., 2012; Ihos et al., 2012; Razmi et al., 2013; Honakeri et al., 2020; Zayed and Issa, 2020; Meti et al., 2021; Ngoc Hoa et al., 2021). Accordingly, the as-fabricated sensor is potentially able to determine the trace amounts of studied drugs in various media. Moreover, the electrode used for sensor fabrication is a GCE that has various advantages like cost-effectiveness, facile modification, admirable accessibility, and lower background current when compared with other electrodes such as diamond and carbon paste electrodes. As seen in Table 2, the electrode as-fabricated for electrochemically sensing diclofenac and chlorzoxazone generally showed admirable properties for measurement speed, sensitivity, detection limit, linear range, and sensitivity when compared with other electrochemical methods reported in the literature.
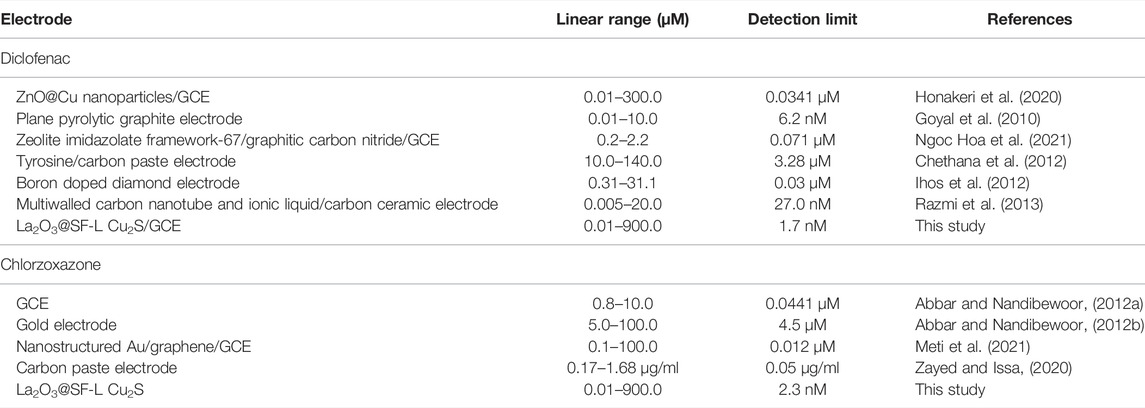
TABLE 2. Performance comparison of La2O3@SF-L Cu2S/GCE for the simultaneous determination of diclofenac and chlorzoxazone with other electroanalytical methods.
4 Conclusion
The current study aimed to develop a La2O3@SF-L Cu2S composite-modified glassy carbon electrode for simultaneous detection of diclofenac and chlorzoxazone in biological and pharmaceutical specimens. An excellent electrocatalytic potential was obtained for the proposed electrochemical sensor toward the oxidations of diclofenac and chlorzoxazone because of the synergetic activity of La2O3 and SF-L Cu2S on the electrode surface. The applicability of our modified electrode was examined for successful simultaneous detection of diclofenac and chlorzoxazone in drug tablets and urine specimens.
Data Availability Statement
The original contributions presented in the study are included in the article/Supplementary Material; further inquiries can be directed to the corresponding authors.
Ethics Statement
The studies involving human participants were reviewed and approved by the Ethics committee of the Islamic Azad University of Kerman. The patients/participants provided their written informed consent to participate in this study.
Author Contributions
All authors contributed to the study’s conception and design. Material preparation and analysis were performed by MF and SJ. The first draft of the manuscript was written by HN, and all authors commented on previous versions of the manuscript. All authors read and approved the final manuscript. HN: writing—original draft preparation. MF and SJ: formal analysis and investigation. AT and BB: validation. NN-P: methodology.
Conflict of Interest
The authors declare that the research was conducted in the absence of any commercial or financial relationships that could be construed as a potential conflict of interest.
Publisher’s Note
All claims expressed in this article are solely those of the authors and do not necessarily represent those of their affiliated organizations, or those of the publisher, the editors, and the reviewers. Any product that may be evaluated in this article, or claim that may be made by its manufacturer, is not guaranteed or endorsed by the publisher.
References
Abbar, J. C., and Nandibewoor, S. T. (2012a). Development of Electrochemical Method for the Determination of Chlorzoxazone Drug and its Analytical Applications to Pharmaceutical Dosage Form and Human Biological Fluids. Ind. Eng. Chem. Res. 51, 111–118. doi:10.1021/ie2021812
Abbar, J., and Nandibewoor, S. (2012b). Voltammetric Behavior of Chlorzoxazone and its Electroanalytical Determination in Pharmaceutical Dosage Form and Urine at Gold Electrode. Crit. Rev. Anal. Chem. 42, 272–281. doi:10.1080/10408347.2012.680336
Ahmed, H. M., Elshamy, Y. S., Talaat, W., Labib, H. F., and Belal, T. S. (2020). Simultaneous Analysis of Chlorzoxazone, Diclofenac Sodium and Tramadol Hydrochloride in Presence of Three Potential Impurities Using Validated HPLC-DAD and HPTLC Methods. Microchem. J. 153, 104505. doi:10.1016/j.microc.2019.104505
Al-Turki, D. A., Abou-Zeid, L. A., Shehata, I. A., and Al-Omar, M. A. (2010). Therapeutic and Toxic Effects of New NSAIDs and Related Compounds: A Review and Prospective Studyffects of New NSAIDS and Related Compounds: a Review and Prospective Study. Int. J. Pharmacol. 6, 813–825. doi:10.3923/ijp.2010.813.825
Azizabadi, O., Akbarzadeh, F., Danshina, S., Chauhan, N. P. S., and Sargazi, G. (2021). An Efficient Ultrasonic Assisted Reverse Micelle Synthesis Route for Fe3O4@Cu-MOF/core-Shell Nanostructures and its Antibacterial Activities. J. Solid State Chem. 294, 121897. doi:10.1016/j.jssc.2020.121897
Bard, A. J., and Faulkner, L. R. (2001). Electrochemical Methods: Fundamentals and Applications. second ed.. New York: Wiley.
Brewer, A. S., and Arnold, M. S. (2014). Field-effect Measurements of Mobility and Carrier Concentration of Cu 2 S Colloidal Quantum Dot Thin Films after Ligand Exchange. Thin Solid Films 567, 91–95. doi:10.1016/j.tsf.2014.07.015
Chen, Y.-B., Chen, L., and Wu, L.-M. (2008). The Structure-Controlling Solventless Synthesis and Optical Properties of Uniform Cu2S Nanodisks. Chem. Eur. J. 14, 11069–11075. doi:10.1002/chem.200801447
Chethana, B. K., Basavanna, S., and Arthoba Naik, Y. (2012). Voltammetric Determination of Diclofenac Sodium Using Tyrosine-Modified Carbon Paste Electrode. Ind. Eng. Chem. Res. 51, 10287–10295. doi:10.1021/ie202921e
Eteya, M. M., Rounaghi, G. H., and Deiminiat, B. (2019). Fabrication of a New Electrochemical Sensor Based on Au Pt Bimetallic Nanoparticles Decorated Multi-Walled Carbon Nanotubes for Determination of Diclofenac. Microchem. J. 144, 254–260. doi:10.1016/j.microc.2018.09.009
Fathi, Z., Jahani, S., Zandi, M. S., and Foroughi, M. M. (2020). Synthesis of Bifunctional Cabbage Flower-like Ho3+/NiO Nanostructures as a Modifier for Simultaneous Determination of Methotrexate and Carbamazepine. Anal. Bioanal. Chem. 412, 1011–1024. doi:10.1007/s00216-019-02326-8
Foroughi, M. M., Jahani, S., Aramesh-Boroujeni, Z., Rostaminasab Dolatabad, M., and Shahbazkhani, K. (2021). Synthesis of 3D Cubic of Eu3+/Cu2O with Clover-like Faces Nanostructures and Their Application as an Electrochemical Sensor for Determination of Antiretroviral Drug Nevirapine. Ceram. Int. 47, 19727–19736. doi:10.1016/j.ceramint.2021.03.311
Foroughi, M. M., and Ranjbar, M. (2017). Microwave-assisted Synthesis and Characterization Photoluminescence Properties: a Fast, Efficient Route to Produce ZnO/GrO Nanocrystalline. J. Mater Sci. Mater Electron 28, 1359–1363. doi:10.1007/s10854-016-5668-x
Goyal, R. N., Chatterjee, S., and Agrawal, B. (2010). Electrochemical Investigations of Diclofenac at Edge Plane Pyrolytic Graphite Electrode and its Determination in Human Urine. Sensors Actuators B Chem. 145, 743–748. doi:10.1016/j.snb.2010.01.038
Guan, H., Huang, S., Ding, J., Tian, F., Xu, Q., and Zhao, J. (2020). Chemical Environment and Magnetic Moment Effects on Point Defect Formations in CoCrNi-Based Concentrated Solid-Solution Alloys. Acta Mater. 187, 122–134. doi:10.1016/j.actamat.2020.01.044
Honakeri, N. C., Malode, S. J., Kulkarni, R. M., and Shetti, N. P. (2020). Electrochemical Behavior of Diclofenac Sodium at Coreshell Nanostructure Modified Electrode and its Analysis in Human Urine and Pharmaceutical Samples. Sensors Int. 1, 100002. doi:10.1016/j.sintl.2020.100002
Ihos, M., Remes, A., and Manea, F. (2012). Electrochemical Determination of Diclofenac Using Boron-Doped Diamond Electrode. J. Environ. Prot. Ecol. 13, 2096–2103.
Jaffar, B. M., Swart, H. C., Seed Ahmed, H. A. A., Yousif, A., and Kroon, R. E. (2019). Luminescence Properties of Bi Doped La2O3 Powder Phosphor. J. Luminescence 209, 217–224. doi:10.1016/j.jlumin.2019.01.044
Jahani, S. (2018). Evaluation of the Usefulness of an Electrochemical Sensor in Detecting Ascorbic Acid Using a Graphite Screen-Printed Electrode Modified with NiFe2O4 Nanoparticles. Anal. Bioanal. Elctrochem. 10, 739–750.
József, P., Dávid, N., Sándor, K., and Áron, B. (2019). A Comparison Study of Analytical Performance of Chromium Speciation Methods. Microchem. J. 149, 103985. doi:10.1016/j.microc.2019.05.058
Kabir, H., Nandyala, S. H., Rahman, M. M., Kabir, M. A., and Stamboulis, A. (2018). Influence of Calcination on the Sol-Gel Synthesis of Lanthanum Oxide Nanoparticles. Appl. Phys. A 124, 820–831. doi:10.1007/s00339-018-2246-5
Kristl, M., Hojnik, N., Gyergyek, S., and Drofenik, M. (2013). Sonochemical Preparation of Copper Sulfides with Different Phases in Aqueous Solutions. Mater. Res. Bull. 48, 1184–1188. doi:10.1016/j.materresbull.2012.12.020
Kulkarni, D. R., Malode, S. J., Keerthi Prabhu, K., Ayachit, N. H., Kulkarni, R. M., and Shetti, N. P. (2020). Development of a Novel Nanosensor Using Ca-Doped ZnO for Antihistamine Drug. Mater. Chem. Phys. 246, 122791. doi:10.1016/j.matchemphys.2020.122791
Larsen, T. H., Sigman, M., Ghezelbash, A., Doty, R. C., and Korgel, B. A. (2003). Solventless Synthesis of Copper Sulfide Nanorods by Thermolysis of a Single Source Thiolate-Derived Precursor. J. Am. Chem. Soc. 125, 5638–5639. doi:10.1021/ja0342087
Lee, J. W., Park, H. G., Jeong, H. C., and Seo, D. S. (2015). Enhanced Electro-Optical Properties of Electrically Controlled Birefringence Cells on Solution-Derived Lanthanum Oxide Films Treated with Ion Beam Irradiation. ECS Solid State Lett. 4, R13–R16. doi:10.1149/2.0021503ssl
Li, Y., Guan, B., Maclennan, A., Hu, Y., Li, D., Zhao, J., et al. (2017). Porous Waxberry-like MnO 2 /La 2 O 3 Microspheres for High Performance Asymmetric Supercapacitor. Electrochimica Acta 241, 395–405. doi:10.1016/j.electacta.2017.04.175
Li, H., Xu, P., Liu, D., He, J., Zu, H., Song, J., et al. (2021). Low-voltage and Fast-Response SnO2 Nanotubes/perovskite Heterostructure Photodetector. Nanotechnology 32, 375202. doi:10.1088/1361-6528/ac05e7
Liang, Z. M., Wang, G. Y., Sun, Z. B., Wang, D. L., Wang, L. W., and Liang, Y. M. (2022). Rapidly Improved Tensile Strength of 6N01 Al Alloy FSW Joints by Electropulsing and Artificial Aging Treatment. Mater. Sci. Eng. A 841, 143056. doi:10.1016/j.msea.2022.143056
Liu, L., Zhang, X., Zhu, Q., Li, K., Lu, Y., Zhou, X., et al. (2021). Ultrasensitive Detection of Endocrine Disruptors via Superfine Plasmonic Spectral Combs. Light Sci. Appl. 10, 181. doi:10.1038/s41377-021-00618-2
Liu, W., Zheng, Y., Wang, Z., Wang, Z., Yang, J., Chen, M., et al. (2021). Ultrasensitive Exhaled Breath Sensors Based on Anti‐Resonant Hollow Core Fiber with In Situ Grown ZnO‐Bi 2 O 3 Nanosheets. Adv. Mat. Interfaces 8, 2001978. doi:10.1002/admi.202001978
Maaref, H., Foroughi, M. M., Sheikhhosseini, E., and Akhgar, M. R. (2018). Electrocatalytic Oxidation of Sulfite and its Highly Sensitive Determination on Graphite Screen Printed Electrode Modified with New Schiff Base Compound. Anal. Bioanal. Electrochem. 10, 1080–1092.
Malode, S. J., Keerthi, P. K., Shetti, N. P., and Kulkarni, R. M. (2020). Electroanalysis of Carbendazim Using MWCNT/Ca‐ZnO Modified Electrode. Electroanalysis 32, 1590–1599. doi:10.1002/elan.201900776
Meti, M. D., Abbar, J. C., Lin, J., Han, Q., Zheng, Y., Wang, Y., et al. (2021). Nanostructured Au-Graphene Modified Electrode for Electrosensing of Chlorzoxazone and its Biomedical Applications. Mater. Chem. Phys. 266, 124538. doi:10.1016/j.matchemphys.2021.124538
Mousavi-Kamazani, M., Salavati-Niasari, M., and Sadeghinia, M. (2013). Synthesis and Characterization of Cu2S Nanostructures via Cyclic Microwave Radiation. Superlattices Microstruct. 63, 248–257. doi:10.1016/j.spmi.2013.08.023
Mousavi-Kamazani, M., Zarghami, Z., and Salavati-Niasari, M. (2016). Facile and Novel Chemical Synthesis, Characterization, and Formation Mechanism of Copper Sulfide (Cu2S, Cu2S/CuS, CuS) Nanostructures for Increasing the Efficiency of Solar Cells. J. Phys. Chem. C 120, 2096–2108. doi:10.1021/acs.jpcc.5b11566
Ngoc Hoa, D. T., Thanh Tu, N. T., Thanh Son, L. V., Truong Son, L. V., Tam Toan, T. T., Minh Thong, P. L., et al. (2021). Electrochemical Determination of Diclofenac by Using ZIF-67/g-C3n4 Modified Electrode. Adsorp. Sci. Technol. 2021, 896286. doi:10.1155/2021/7896286
Obireddy, S. R., and Lai, W. F. (2021). Preparation and Characterization of 2-hydroxyethyl Starch Microparticles for Co-delivery of Multiple Bioactive Agents. Drug Deliv. 28 (2021), 1562–1568. doi:10.1080/10717544.2021.1955043
Obireddy, S. R., and Lai, W.-F. (2022). ROS-generating Amine-Functionalized Magnetic Nanoparticles Coupled with Carboxymethyl Chitosan for pH-Responsive Release of Doxorubicin. Int. J. Nanomedicine 17, 589–601. doi:10.2147/ijn.s338897
Patel, S. A., and Prajapati, K. M. (2013). Spectrophotometric Estimation of Chlorzoxazone and Diclofenac Sodium in Synthetic Mixture by Q-Absorbance Ratio Method. Int. J. Chemtech. Res. 5, 2034–2040.
Qi, H., Hu, Z., Yang, Z., Zhang, J., Wu, J. J., Cheng, C., et al. (2022). Capacitive Aptasensor Coupled with Microfluidic Enrichment for Real-Time Detection of Trace SARS-CoV-2 Nucleocapsid Protein. Anal. Chem. 94, 2812–2819. doi:10.1021/acs.analchem.1c04296
Razmi, H., Sarhang-Zadeh, K., and Mohammad-Rezaei, R. (2013). Electrochemical Behavior and Voltammetric Determination of Diclofenac at a Multi-Walled Carbon Nanotube-Ionic Liquid Composite Modified Carbon Ceramic Electrode. Anal. Lett. 46, 1885–1896. doi:10.1080/00032719.2013.777919
Saheb, D. J., Reddy, N. R., and Chakravarthy, I. (2004). Simultaneous Determination of Paracetamol and Diclofenac Sodium from Combined Dosage Forms by Absorbance Difference Method. Asian J. Chem. 16, 767–772.
Salajegheh, M., Ansari, M., Foroghi, M. M., and Kazemipour, M. (2019). Computational Design as a Green Approach for Facile Preparation of Molecularly Imprinted Polyarginine-Sodium Alginate-Multiwalled Carbon Nanotubes Composite Film on Glassy Carbon Electrode for Theophylline Sensing. J. Pharm. Biomed. Analysis 162, 215–224. doi:10.1016/j.jpba.2018.09.032
Salinas, D., Sepúlveda, C., Escalona, N., GFierro, J. L., and Pecchi, G. (2018). Sol-gel La 2 O 3 -ZrO 2 Mixed Oxide Catalysts for Biodiesel Production. J. Energy Chem. 27, 565–572. doi:10.1016/j.jechem.2017.11.003
Sargazi, G., Afzali, D., and Mostafavi, A. (2019). A Novel Microwave Assisted Reverse Micelle Fabrication Route for Th (IV)-MOFs as Highly Efficient Adsorbent Nanostructures with Controllable Structural Properties to CO and CH4 Adsorption: Design, and a Systematic Study. Appl. Organometal Chem. 33, e4816. doi:10.1002/aoc.4816
Setoudeh, N., Jahani, S., Kazemipour, M., Foroughi, M. M., and Hassani Nadiki, H. (2020). Zeolitic Imidazolate Frameworks and Cobalt-Tannic Acid Nanocomposite Modified Carbon Paste Electrode for Simultaneous Determination of Dopamine, Uric Acid, Acetaminophen and Tryptophan: Investigation of Kinetic Parameters of Surface Electrode and its Analytical Performance. J. Electroanal. Chem. 863, 114045. doi:10.1016/j.jelechem.2020.114045
Shetti, N. P., Malode, S. J., Bukkitgar, S. D., Bagihalli, G. B., Kulkarni, R. M., Pujari, S. B., et al. (2019). Electro-oxidation and Determination of Nimesulide at Nanosilica Modified Sensor. Mater. Sci. Energy Technol. 2, 396–400. doi:10.1016/j.mset.2019.03.005
Shetti, N. P., Nayak, D. S., and Malode, S. J. (2018). Electrochemical Behavior of Azo Food Dye at Nanoclay Modified Carbon Electrode-A Nanomolar Determination. Vacuum 155, 524–530. doi:10.1016/j.vacuum.2018.06.050
Sweetman, S. C. (2005). Martindale: The Complete Drug Reference. 34th ed.. London: Pharmaceutical Press.
Umar, A., Ibrahim, A. A., Kumar, R., Almas, T., Sandal, P., Al-Assiri, M. S., et al. (2020). Fern Shaped La2O3 Nanostructures as Potential Scaffold for Efficient Hydroquinone Chemical Sensing Application. Ceram. Int. 46, 5141–5148. doi:10.1016/j.ceramint.2019.10.258
Vakili Fathabadi, M., Hashemipour Rafsanjani, H., Foroughi, M. M., Jahani, S., and Arefi Nia, N. (2020). Synthesis of Magnetic Ordered Mesoporous Carbons (OMC) as an Electrochemical Platform for Ultrasensitive and Simultaneous Detection of Thebaine and Papaverine. J. Electrochem. Soc. 167, 027509. doi:10.1149/1945-7111/ab6446
Yadav, A. A., Lokhande, A. C., Kim, J. H., and Lokhande, C. D. (2017). Enhanced Sensitivity and Selectivity of CO2 Gas Sensor Based on Modified La2O3 Nanorods. J. Alloys Compd. 723, 880–886. doi:10.1016/j.jallcom.2017.06.223
Zayed, S. I. M., and Issa, Y. M. (2020). Differential Pulse Anodic Voltammetric Determination of Chlorzoxazone in Pharmaceutical Formulation Using Carbon Paste Electrode. Acta Chim. Slov. 67, 1053–1060. doi:10.17344/acsi.2020.5731
Zhang, H., Zhao, J., Liu, H., Liu, R., Wang, H., and Liu, J. (2010). Electrochemical Determination of Diphenols and Their Mixtures at the Multiwall Carbon Nanotubes/poly (3-methylthiophene) Modified Glassy Carbon Electrode. Microchim. Acta 169, 277–282. doi:10.1007/s00604-010-0349-6
Zhang, X., Tang, Y., Zhang, F., and Lee, C.-S. (2016). A Novel Aluminum-Graphite Dual-Ion Battery. Adv. Energy Mat. 6, 1502588. doi:10.1002/aenm.201502588
Keywords: diclofenac, chlorzoxazone, nanocomposite, voltammetry, modified electrode
Citation: Baniahmad B, Hassani Nadiki H, Jahani S, Nezamabadi-Pour N, Toolabi A and Foroughi MM (2022) Simultaneous Electrochemical Determination of Chlorzoxazone and Diclofenac on an Efficient Modified Glassy Carbon Electrode by Lanthanum Oxide@ Copper(I) Sulfide Composite. Front. Chem. 10:889590. doi: 10.3389/fchem.2022.889590
Received: 04 March 2022; Accepted: 27 April 2022;
Published: 17 June 2022.
Edited by:
Dhammanand Jagdeo Shirale, Kavayitri Bahinabai Chaudhari North Maharashtra University, IndiaReviewed by:
Nagaraj P. Shetti, KLE Technological University, IndiaFlorica Manea, Politehnica University of Timișoara, Romania
Copyright © 2022 Baniahmad, Hassani Nadiki, Jahani, Nezamabadi-Pour, Toolabi and Foroughi. This is an open-access article distributed under the terms of the Creative Commons Attribution License (CC BY). The use, distribution or reproduction in other forums is permitted, provided the original author(s) and the copyright owner(s) are credited and that the original publication in this journal is cited, in accordance with accepted academic practice. No use, distribution or reproduction is permitted which does not comply with these terms.
*Correspondence: Shohreh Jahani, c2hvaHJlX2phaGFuaUB5YWhvby5jb20=; Mohammad Mehdi Foroughi, Zm9yb3VnaGlAaWF1ay5hYy5pcg==
 Bahar Baniahmad1
 Mohammad Mehdi Foroughi