 Duan Xianzhe
 Li Nan2,3*
- 1School of Resource & Environment and Safety Engineering, University of South China, Hengyang, China
- 2Hunan Key Laboratory of Rare Metal Minerals Exploitation and Geological Disposal of Wastes, Hengyang, China
- 3College of Chemistry and Chemical Engineering, University of South China, Hengyang, China
Thermal analysis is widely used for the measurement of the relationship between temperature and physical properties of the materials. Many studies have reported different thermal analysis methods, including thermogravimetry (TG), derivative thermogravimetry (DTG), differential heat analysis (DTA), and differential scanning calorimetry (DSC), but few comprehensively studied the factors influencing TG-DTA by the combined thermogravimetry–differential thermal methods. In this study, taking chalcanthite as the research object, the thermogravimetric–differential thermal analyses were systematically conducted by using synchronous thermal analyzer technology. The results demonstrate that 1) DTA curves of low- and medium-weight chalcanthite show five dehydration endothermic peaks, while TG curves do not display obvious weight-loss steps; DTA and TG curves of high-weight chalcanthite samples, on the other hand, illustrate three endothermic peaks, indicating three-step loss of crystalline water; 2) higher weight of samples may cause longer time of internal heat transfer and larger temperature gradient, consequently resulting in the expansion of DTA peak shape and the decline of resolution as well as the increase of the peak temperature; 3) the weight-loss deviation between the measured and theoretical data is relatively higher in the low-weight samples than that in the medium- and high-weight samples; 4) the heating rate can increase the DTA curve peak and thermal inertia and the temperature at the thermodynamic equilibrium, causing the temperature lagging behind and the overall peak moving toward high temperature; 5) sample grinding may destroy the structure of the crystal, thereby breaking the relatively weak chemical bond, and thus affects the structure of thermogravimetric–differential thermal analyses. These suggest that the sample weight, heating rate, and sample grinding probably have significant effects on the thermogravimetric–differential thermal analyses. Therefore, proper experimental conditions are needed to obtain the accurate results during the thermogravimetric–differential thermal analyses. This study can provide a basis and reference for future synchronous thermal analyses.
Introduction
Thermal analysis is a technique for measuring the relationship between temperature and physical properties of the materials at various temperatures controlled by different processes (Chihara, 1999). Many studies have reported different thermal analysis methods, including thermogravimetry (TG), derivative thermogravimetry (DTG), differential heat analysis (DTA), and differential scanning calorimetry (DSC), which are widely used to study the physical and chemical changes of materials and obtain important information about materials including composition, stability, chemical reaction process, and physicochemical and thermodynamic properties (Liu and Shan, 2000, 2006; Zhao et al., 2001; Bhosekar et al., 2006; Chaudhary et al., 2013a; Chaudhary et al., 2015; Chaudhary et al., 2016; Charmas et al., 2019; EL-Sayed and Mostafa, 2021; Meireles et al., 2021). There are many factors affecting the thermogravimetry curve, such as the crucible and instrument sensitivity as well as the effects of operating conditions (e.g., sample weight, heating rate, granularity, and filling conditions) (Gao et al., 2002; Prabhumirashi and Khoje, 2002; Liu et al., 2006; Vlaev et al., 2008). However, few studies comprehensively studied the factors influencing TG-DTA by the combined thermogravimetry–differential thermal methods. Compared with separate TG or DSC methods, the synchronous thermal analyzer has the following significant advantages: 1) it can eliminate the negative influences of weighing, sample uniformity, heating rate consistency, atmospheric pressure, and flow difference; 2) the TG and DTA curves have much better correspondence, making the results more accurate.
Chalcanthite, a typical crystalline aquo-compound, is widely used in electroplating, textile printing, pigments, and pesticides (Chen, 2014a). It is a good research object to investigate the influencing factors of synchronous thermal analyses. Many studies have reported differential thermal (Pan et al., 1988), thermogravimetry (Chen and Yu, 2001; Li et al., 2008; Chen, 2014b), and synchronous thermal (Lu et al., 2001) analyses of chalcanthite, but the factors affecting the thermogravimetric–differential thermal analyses remain unclear. In this study, we systematically investigate the effects of sample weight, heating rate, and sample grinding on the thermogravimetry–differential heat analyses of chalcanthite with an aim to provide a basis and reference for future synchronous thermal analyses.
Materials and Methods
Experimental Reagent
Analyzed pure chalcanthite and alumina crucible were used.
Experimental Instrument
The HCT-4-type synchronous thermal analyzer (Beijing Hengjiu Experimental Equipment Co., Ltd.) was used.
Experimental Methods
Contrast Experiments With Different Weight of Samples
Chalcanthite crystals of 5.2, 9.6, and 28.7 mg were accurately weighed and then put in the alumina crucible, with the empty alumina crucible as the reference. The temperature was set from 25 to 400°C in the air atmosphere at the heating rate of 5°C/min, maintaining 400°C for 5 min, and the samples were then collected to obtain the thermogravimetric–differential thermal analysis spectrogram.
Contrast Experiments at Different Heating Rates
Accurately weighed three chalcanthite samples of 9.6 mg were put in the alumina crucible, with the empty alumina crucible as the reference. The temperature was raised from 25 to 400°C in the air atmosphere at the heating rates of 3, 5, and 10°C/min. The final temperature of 400°C was maintained for 5 min. The thermogravimetric–differential thermal data were finally obtained for the samples collected.
Contrast Experiments With Ground and Non-Ground Chalcanthite Samples
Two ground and non-ground chalcanthite samples of 9.6 mg were weighed and then placed in the alumina crucible, with the empty aluminum crucible as the reference. The temperature was raised from 25 to 400°C at the heating rate of 5°C/min in the air atmosphere, keeping the time for 5 min, and the thermogravimetric–differential thermal analyses were conducted for the samples obtained.
Results and Discussion
Effect of the Sample Weight on the DTA, TG, and DTG Spectrograms
Chalcanthite crystals of 5.2, 9.6, and 28.7 mg were collected, respectively, with the corresponding results of DTA, TG, and DTG obtained (Figures 1, 2;Table 1).
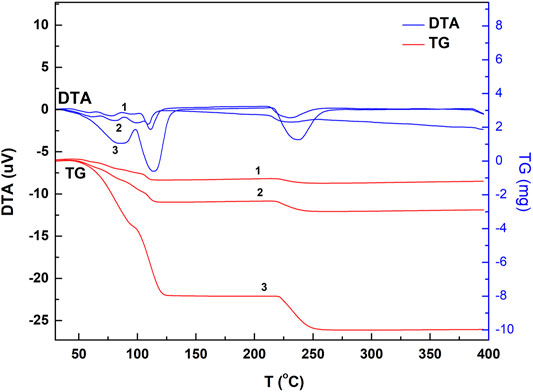
FIGURE 1. DTA and TG spectrogram of the chalcanthite crystals of different weight. Note: upper curves 1, 2, and 3 are DTA profiles of low-, medium-, and high-weight chalcanthite crystals, respectively, while lower curves 1, 2, and 3 are TG profiles of low-, medium-, and high-weight chalcanthite crystals, respectively.
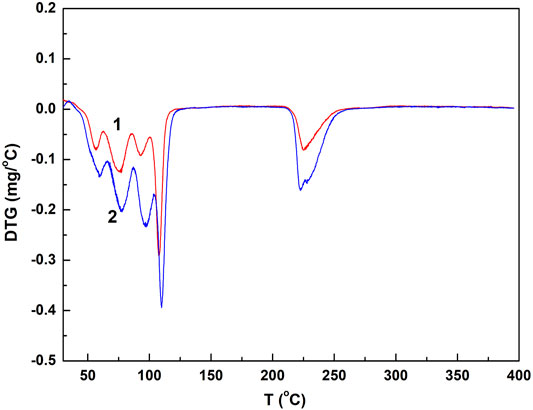
FIGURE 2. DTG spectrogram of the low- and medium-weight chalcanthite crystals. Note: curves 1 and 2 are DTG profiles of low- and medium-weight chalcanthite crystals, respectively.
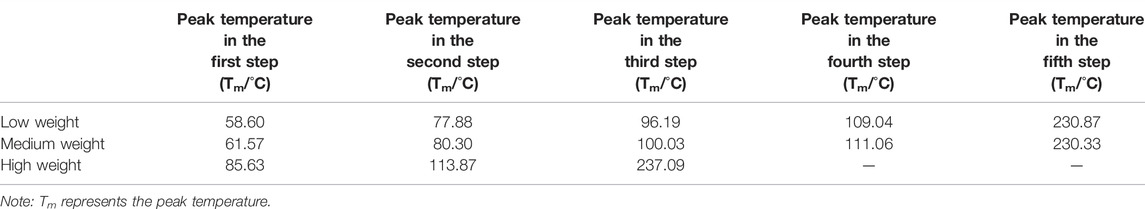
TABLE 1. Peak temperature data of chalcanthite with different weights obtained according to the thermogravimetry curve corresponding to the differential thermal peak.
From Figure 1; Table 1, it can be seen that the DTA curves of low- and medium-weight chalcanthite show five dehydration endothermic peaks, while the TG curves do not show the obvious weight-loss step. In addition, the peak temperature of DTA curves increases with the weight of samples during each weight-loss step (Table 1). However, the DTG curves of low- and medium-weight chalcanthite crystals show five maximum reaction rate peaks, indicating that the crystalline water of these crystals is lost in five steps (Figure 2). A total of three endothermic peaks in DTA curves and three obvious steps in TG curves of high-weight chalcanthite samples indicate that the crystalline water is lost in three steps in the high-weight case (Figure 1; Table 2). These altogether suggest that increasing weight of samples probably increases the internal heat transfer time and the temperature gradient, consequently resulting in the expansion of DTA peak shape and the decline of resolution as well as the increase of the peak temperature (i.e., more significant temperature lag) (Chaudhary et al., 2012; 2013b). Therefore, the weight of the sample should reasonably be reduced within the sensitivity range of thermobalance (Song et al., 2011). For some materials with low thermal sensitivity and weight-loss rate, higher weight can be used, but the sample weight should be controlled within the sensitivity range of the thermogravimetric analyzer (Wang and Xiao, 2005).
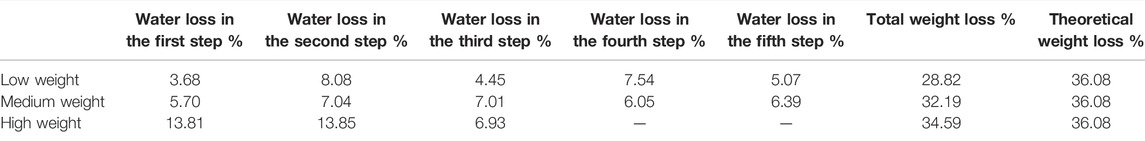
TABLE 2. Weight-loss data of chalcanthite with different weights obtained according to the thermogravimetry curve corresponding to the differential thermal peak.
The weight-loss data (Table 2) of the chalcanthite samples with different weight are obtained according to the thermogravimetry curve corresponding to the differential thermal peak. From Table 2, it can be seen that low-weight samples have relatively larger weight-loss deviation between the measured and theoretical data than the medium- and high-weight samples due to their higher sensitivity requirements of the comprehensive thermal analyzer.
Effect of the Heating Rate on the TG-DTA Spectrogram
Chalcanthite samples of 9.6 mg were heated at 3, 5, and 10°C/min, respectively, with the corresponding results of DTA and TG obtained (Figure 3).
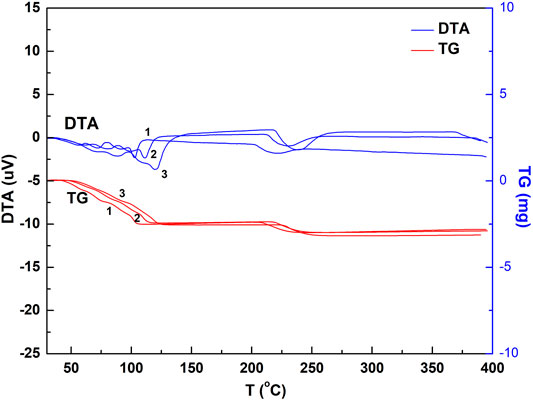
FIGURE 3. DTA and TG spectrogram of the chalcanthite crystals at different heating rates. Note: upper curves 1, 2, and 3 are DTA profiles of the chalcanthite crystals at heating rates of 3, 5, and 10°C/min, respectively, while lower curves 1, 2, and 3 are TG profiles of chalcanthite crystals at heating rates of 3, 5, and 10°C/min, respectively.
As seen in Figure 3, the heating rate increases the DTA curve peak, enhancing the peak sensitivity. This may be due to the temperature difference increased by the thermal effect per unit time (Chen, 2003). Table 3 shows that the heating rate increases the initial temperature extrapolated by water loss of each step. This may be attributed to the increase of thermal inertia by the heating rate. In addition, the shape of the curve also significantly changes by increasing the heating rate, that is, the peak becomes wider (Figure 3). The increasing heating rate results in the increase of the temperature at the thermodynamic equilibrium, accompanied by the temperature lagging behind and the overall peak moving toward high temperature. Nevertheless, the weight-loss value is almost not affected. While the appropriate heating rate is a key factor for improving the experimental accuracy, it is related to the sample’s nature. For samples with poor thermal conductivity, the heating rate can be appropriately reduced in the case of high instrument sensitivity; otherwise, it should be increased (Shen and Yang, 2005).
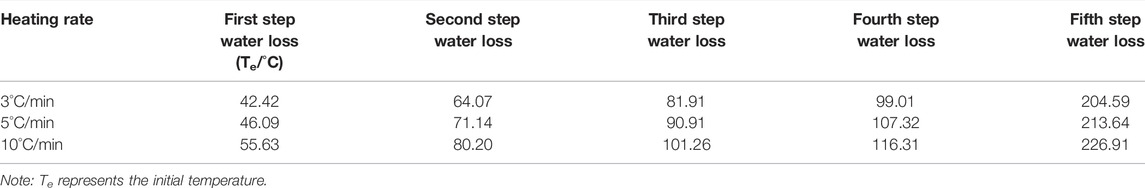
TABLE 3. Extrapolated initial temperature by water loss of chalcanthite at different heating rates.
Effect of the Sample Granularity
The ground and non-ground chalcanthite samples of 9.6 mg were weighed, respectively, with the corresponding results of DTA and TG obtained (Figure 4).
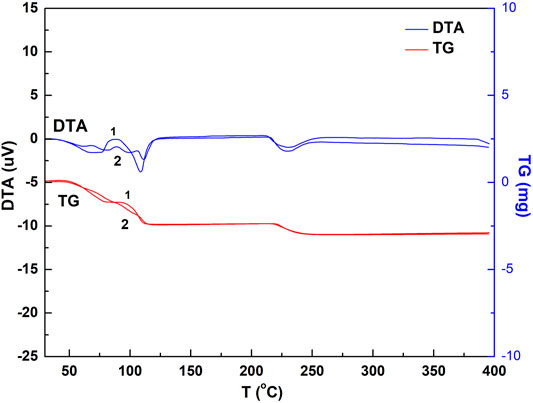
FIGURE 4. DTA and TG spectrogram of the chalcanthite crystals with and without grinding. Note: upper curves 1 and 2 are DTA profiles of ground and non-ground chalcanthite, respectively, while lower curves 1 and 2 are TG profiles of the ground and non-ground chalcanthite crystals, respectively.
Figure 4 shows three water-loss heat absorption peaks in the DTA curve and three obvious steps in the TG profile of the ground chalcanthite, indicating that the water is lost in three steps. This may demonstrate that the grinding may destroy the chalcanthite crystal structure, resulting in the break of the relatively weak bond. In addition, the grinding has a notable effect on the weight-loss stage, producing three obvious steps of the TG curve but an insignificant effect on the weight-loss value.
Conclusion
In this study, taking chalcanthite as a research object, the synchronous thermal analyses under different conditions were conducted, and the following conclusions were drawn: 1) five dehydration endothermic peaks were obtained in the DTA curves of low- and medium-weight chalcanthite, whereas insignificant weight-loss steps were displayed in the TG curves; on the other hand, DTA and TG curves of high-weight chalcanthite samples exhibit three endothermic peaks, demonstrating three-step loss of crystalline water; 2) increasing weight of samples may cause longer time of internal heat transfer and larger temperature gradient, thus leading to the expansion of DTA peak shape and the decline of resolution as well as the increase of the peak temperature; 3) low-weight samples possess relatively larger weight-loss deviation between the measured and theoretical data than the medium- and high-weight samples; 4) the heating rate can increase the DTA curve peak, thermal inertia, and the temperature at the thermodynamic equilibrium, causing the temperature lagging behind and the overall peak moving toward high temperature; 5) sample grinding may destroy the structure of the crystal, thereby breaking the relatively weak chemical bond and consequently influencing the structure of thermogravimetric–differential thermal analyses; 6) proper experimental conditions should be considered for accurate measurements during the thermogravimetric–differential thermal analyses.
Data Availability Statement
The original contributions presented in the study are included in the article/Supplementary Material, further inquiries can be directed to the corresponding authors.
Author Contributions
The study was designed and planned by LN, DX, WY, and TZ. The experimental work was performed by LN, DX, and WY. Data analysis was performed by LN, DX, and TZ. The first draft of the manuscript was compiled by LN and DX. All authors revised and contributed to manuscript revision and completion. All authors are accountable for the content of the manuscript.
Funding
This work was financially supported by the Hengyang City Guidance Plan Project (No. 202121014464), and Talent Foundations of University of South China (Nos. 2014XQD08, 2018XQD22).
Conflict of Interest
The authors declare that the research was conducted in the absence of any commercial or financial relationships that could be construed as a potential conflict of interest.
Publisher’s Note
All claims expressed in this article are solely those of the authors and do not necessarily represent those of their affiliated organizations, or those of the publisher, the editors, and the reviewers. Any product that may be evaluated in this article, or claim that may be made by its manufacturer, is not guaranteed or endorsed by the publisher.
Acknowledgments
We thank two reviewers for their constructive comments and suggestions, which greatly helped to strengthen this study. Dr. Vinoth Kumar Ponnusamy is also acknowledged for his editorial handling work.
References
Bhosekar, G., Jess, I., and Näther, C. (2006). On the Preparation of Coordination Polymers by Controlled Thermal Decomposition: Synthesis, Crystal Structures, and Thermal Properties of Zinc Halide Pyrazine Coordination Compounds. Inorg. Chem. 45, 6508–6515. doi:10.1021/ic060298f
Charmas, B., Kucio, K., Sydorchuk, V., Khalameida, S., Zięzio, M., and Nowicka, A. (2019). Characterization of Multimodal Silicas Using TG/DTG/DTA, Q-TG, and DSC Methods. Colloids Inter. 3 (1), 1–18. doi:10.3390/colloids3010006
Chaudhary, R. G., Ali, P., Gandhare, N. V., Tanna, J. A., and Juneja, H. D. (2016). Thermal Decomposition Kinetics of Some Transition Metal Coordination Polymers of Fumaroyl Bis (Paramethoxyphenylcarbamide) Using DTG/DTA Techniques. Arab. J. Chem. 12 (7), 1070–1082. doi:10.1016/j.arabjc.2016.03.008
Chaudhary, R. G., Juneja, H. D., and Gandhare, N. V. (2013b). Evaluation of Kinetic Parameters from TG/DTG Data of Chelate Polymer Compounds of Isophthaoylbis(paramethoxyphenylcarbamide). J. Chin. Adv. Mater. Soc. 1 (4), 305–316. doi:10.1080/22243682.2013.871210
Chaudhary, R. G., Juneja, H. D., and Gharpure, M. P. (2013a). Thermal Degradation Behaviour of Some Metal Chelate Polymer Compounds with Bis(bidentate) Ligand by TG/DTG/DTA. J. Therm. Anal. Calorim. 112 (2), 637–647. doi:10.1007/s10973-012-2616-8
Chaudhary, R. G., Juneja, H. D., Pagadala, R., Gandhare, N. V., and Gharpure, M. P. (2015). Synthesis, Characterisation and thermal Degradation Behaviour of Some Coordination Polymers by Using TG-DTG and DTA Techniques. J. Saudi Chem. Soc. 19 (4), 442–453. doi:10.1016/j.jscs.2014.06.002
Chen, D. (2014a). The Purity of Chalcanthite Was Determined by thermal Weight-Loss Method. Chem. Tech. Dev. 43 (09), 35–36. doi:10.3969/j.issn.1671x9905.2014.09.014
Chen, D. (2014b). Thermal Weight-Loss Analysis of Crystalline Water of Chalcanthite. Liaoning Chem. Indust. 43 (12), 1472–1474. CNKI:SUN:LNHG.0.2014-12-002
Chen, L. W. (2003). Discussion on the Factors of Thermogravimetry Analysis Technology. Henan. Chem. Indust. 3 (01), 47–48. CNKI:SUN:HNHU.0.2003-01-022
Chen, Q. Y., and Yu, Y. (2001). Study of Copper Sulfate Crystals by thermal Reanalysis. J. Dandong Text. Spec. 8 (3), 8–9. doi:10.3969/j.issn.1673-4939.2001.03.005
Chihara, H. (1999). Proceedings of the Fifth Intenational Conference on thermal Analysis. Washington, D.C., United States: IEEE Computer Society, 55–56.
El-Sayed, S. A., and Mostafa, M. E. (2021). Kinetics, Thermodynamics, and Combustion Characteristics of Poinciana Pods Using TG/DTG/DTA Techniques. Biomass Conv. Bioref.. doi:10.1007/s13399-021-02021-8
Gao, Z., Amasaki, I., and Nakada, M. (2002). A Description of Kinetics of thermal Decomposition of Calcium Oxalate Monohydrate by Means of the Accommodated Rn Model. Thermochim. Acta 385, 95–103. doi:10.1016/s0040-6031(01)00706-7
Li, G., Zhou, X. F., Cheng, Y. K., and Huang, C. G. (2008). Analysis of the Material Phase and thermal Properties of the mineral Choleric Alum. J. Drug Analy. 28 (12), 2103–2105. CNKI:SUN:YWFX.0.2008-12-042
Liu, Z. H., and Shan, L. Z. (2000). Chemical Analysis Manual: Volume VIII. Beijing: Chemical Industry Press, 4–5.
Liu, Z. H., Xu, G. H., and Zhang, H. L. (2006). Thermal Analysis Instrument. Beijing: Chemical Industry Press, 6–8.
Lu, B., Yu, H. J., and Wu, K. Z. (2001). Thermodynamic Calculation of the Dehydration Mechanism of Chalcanthite. J. Hebei Norm. Univ.(Nat. Sci. Edit). 25 (2), 211–213. doi:10.3969/j.issn.1000-5854.2001.02.021
Meireles, B. R. L. D. A., Alcântara, M. A., Polari, I. D. L. B., Souza, A. G. D., Santos, N. A. D., Grisi, C. V. B., et al. (2021). Catole Coconut (Syagrus Cearensis) Oil: Physicochemical Characterization and Thermo-Oxidative Stability by TG/DTG/DTA and Rancimat. J. Therm. Anal. Calorim. 147, 3591–3598. doi:10.1007/s10973-021-10789-0
Pan, Y. X., Feng, Z. Y., and Wu, Y. S. (1988). Differential thermal Analysis (DTA) Method Studies the Water Loss Process of Chalcanthite. J. Inorg. Chem. 4 (3), 101–107.
Prabhumirashi, L. S., and Khoje, J. K. (2002). TGA and DTA studies on en and tmn complexes of Cu(II) chloride, nitrate, sulphate, acetate and oxalate. Thermochim. Acta 383, 109–118. doi:10.1016/s0040-6031(01)00683-9
Shen, Q., and Yang, C. A. (2005). Qing, Yang Chang'an. Study on Factors of Differential Heat Analysis. J. Shanxi .Univ. Sci. Tech. 23 (05), 64–74. doi:10.3969/j.issn.1000-5811.2005.05.014
Song, J., Zhao, W., Song, G., and Wang, L. (2011). Analysis of the Influencing Factors during the Thermogravimetry Test. Chem. Auto. Instrum. 38 (07), 894–896.
Vlaev, L., Nedelchev, N., Gyurova, K., and Zagorcheva, M. (2008). A Comparative Study of Non-isothermal Kinetics of Decomposition of Calcium Oxalate Monohydrate. J. Anal. Appl. Pyrolysis. 81, 253–262. doi:10.1016/j.jaap.2007.12.003
Wang, S. Q., and Xiao, X. Q. (2005). Study and Exploration of the Factors of Thermogravimetryanalysis Curve. Hebei Chem. Indust. 28 (04), 78–79. CNKI:SUN:HHGZ.0.2005-04-041
Keywords: synchronous thermal analyzer, thermogravimetric analyses, differential thermal analyses, chalcanthite, influencing factors
Citation: Xianzhe D, Nan L, Yuyuan W and Zhenping T (2022) Systematical Study on the Influencing Factors of Synchronous Thermal Analyses of Samples-Taking the Chalcanthite as an Example. Front. Chem. 10:863083. doi: 10.3389/fchem.2022.863083
Received: 26 January 2022; Accepted: 09 March 2022;
Published: 13 April 2022.
Edited by:
Vinoth Kumar Ponnusamy, Kaohsiung Medical University, TaiwanReviewed by:
Yang Xiao, Xi’an University of Science and Technology, ChinaRatiram Gomaji Chaudhary, Seth Kesarimal Porwal College, India
Copyright © 2022 Xianzhe, Nan, Yuyuan and Zhenping. This is an open-access article distributed under the terms of the Creative Commons Attribution License (CC BY). The use, distribution or reproduction in other forums is permitted, provided the original author(s) and the copyright owner(s) are credited and that the original publication in this journal is cited, in accordance with accepted academic practice. No use, distribution or reproduction is permitted which does not comply with these terms.
*Correspondence: Li Nan, bGluYW4xOTg1MTAxOEAxNjMuY29t; Tang Zhenping, dGFuZ3poZW5waW5nQHVzYy5lZHUuY24=