 Mimi Fan1,2†Zhihui Pan1†Chunjuan Wang2Yang Guo2Jingran Sun1Mingzhu Liu1Bo Peng2*
 Jin Wu1*Yanjun Fang1*
- 1The Key Laboratory of Risk Assessment and Control Technology for Environment and Food Safety, Tianjin Institute of Environment and Operational Medicine, Tianjin, China
- 2College of Chemistry and Chemical Engineering, Northwest Normal University, Lanzhou, China
A novel ratiometric fluorescence probe based on nitrogen-doped blue carbon dots (NCDs) and red gold nanoclusters (Au NCs) for mercuric ion (Hg2+) has been prepared and characterized. A user friendly fluorescent test paper based sensor combined with smartphone was fabricated for rapid visual and quantitative detection. Hg2+ can specifically bind to Au+ on the surface of Au NCs, leading to the quench of red fluorescence while the fluorescence intensity of the NCDs with blue fluorescence remained unchanged as a internal standard signal. The implement of paper-based sensor address some common drawback in analytical process such as the detection time, analysis cost. In a further demonstration, a homemade detection device with smartphone was used to qualify the Hg2+. After adding different concentration of Hg2+, red, purple, and blue colors were obtained on the detection zones of the fluorescent test paper. The Android App Color Grab was used to identify the red, green and blue (RGB) values of fluorescent color. The rapid visual and quantitative detection of Hg2+ was accomplished with the detection limit of 2.7 nM for fluorescence, 25 nM for smartphone and 32 nM for paper strip. The developed multi-mode detection platform was successfully applied to the detection of mercury ions in water samples with acceptable recoveries. The NCDs and Au NCs probe facilitate the one-site environmental monitoring for Hg2+ with “naked-eye” and smartphone.
Introduction
The presence of heavy metal mercury ions in environmental pollutants and foodstuffs are of great concern (Irvine et al., 2017; Gao et al., 2021). Hg2+ is difficult to decomposed in the environment, can easily bioaccumulate in the human body and causing seriously harm to creatures and human beings (Liu et al., 2013; Ping et al., 2018). Owing to the strong binding capacity between Hg2+ and many proteins or enzymes in vivo, mercury accumulates in some organs of the body over time, which can lead to chronic poisoning (Onyido et al., 2004; Wang et al., 2020a). Therefore, it is necessary to develop a more rapid and simpler determination method for Hg2+ in environmental pollutants and food samples.
Conventional methods for Hg2+ determination include atomic absorption spectrometry (Erxleben and Ruzicka, 2005), inductively coupled plasma mass spectrometry (ICP-MS) (Serafimovski et al., 2008), fluorescence, colorimetric and electrochemical methods (Nazeeruddin et al., 2006; Fayazi et al., 2016), and surface-enhanced Raman scattering (Du et al., 2013). Although these instrumental methods have very good accuracy and accuracy in many detection scenes, most of them need expensive purchase and maintenance cost, time-consuming manipulation steps and special training for measurement accuracy, precision and sensitivity. Conventional fluorescence methods have the advantages of high sensitivity and selectivity, and easy implementation, which have been widely employed in Hg2+ assays (Chen et al., 2015). Furthermore, fluorescence methods based on nitrogen-doped carbon quantum dots (Fu et al., 2022), boron and nitrogen co-doped graphene quantum dots (Liu et al., 2020), and water-soluble N-acetyl-l-cysteine-capped CdTe quantum dots (Rezaei et al., 2017) have been successfully applied for mercury ion detection.
The single-emission fluorescence detection of Hg2+ has inevitable limitations with respect to sensitivity, probe concentration, instrument factors or matrix effects in complex samples (Agarwalla et al., 2016; Zang et al., 2016). To minimize these limitations, ratio fluorescence analysis has been developed in recent years. By monitoring the change in the fluorescence intensity ratio of two or more fluorescent materials at different emission wavelengths, the method is more suitable for tracking analytical targets as many background interferences can be corrected (Sun et al., 2013; Yao et al., 2013). As noble photoluminescent materials, carbon quantum dots (CQDs) and gold nanoclusters (Au NCs) have excellent characteristics over traditional fluorescent dyes, such as favorable water solubility and biocompatibility, good optical features. These properties have proven to be conducive to the construction of ration fluorescence sensors based on CQDs and Au NCs (Yan et al., 2016; Wang et al., 2018).
Recently, blood analysis, pesticides, environmental hazard monitoring, and heavy metal ion determination have already been carried out using paper sensors (Zhou et al., 2016; Wang et al., 2018) owing to their low cost, portability, and ease of operation. However, most of these detection with fluorescent strips only provide qualitative data. The red, green, and blue (RGB) values of the ratiometric fluorescent paper strips can be extracted using a smartphone colorimetry for quantitative analysis of anions and cations (Zhang et al., 2019; Wang et al., 2020b). The utilization of paper sensors enables sensitive, visible, low-cost, and rapid detection of Hg2+ in water. By developing various specific applications, the enhanced functions of smartphones can be easily utilized (Peng et al., 2020). Hence, a fluorescent strip integrated with a visual analysis system on a smartphone will present great application prospects in the field of quantitative analysis.
In this study, we have developed an effective ratio fluorescence analysis method for the detection of mercury ions in water samples. The method is portable, rapid and quantitative by using a fluorescent paper-based sensor and smartphone. The ratio fluorescence probes were composed of nitrogen-doped blue carbon dots (NCDs) and red fluorescent Au NCs. Due to the interaction between mercury and gold ions in a closed shell layer (Hg2+ (4f145d10)-Au+ (4f145d10)), Hg2+ can specifically bind to Au+ on the surface of Au NCs (Xie et al., 2010; Chang and Chiang, 2013), which results in the destruction of the red Au NCs and the gradual quenching of their fluorescence intensity. As an internal standard signal, the blue fluorescence of NCDs remain constant owing to their outstanding photostability and chemical inertness. Therefore, the fluorescent color shift from red to pink, pink to purple, and purple to blue can be easily differentiated by visual detection, as well as picked up using a smartphone under UV light for quantitative analysis. The fluorescent paper-based sensor combined with a smartphone colorimetric kit make the detection of Hg2+ simpler, convenient, cost-effective.
Materials and Methods
Reagents and Instruments
All the reagents were bought from Aladdin and the reagents were of analytical grade. Ultrapure water (18.2 MΩ cm) was obtained using the Millipore water purification system (Millipore, MA, United States).
Fluorescence data were recorded on a FluoroMax-4 Compact Spectrofluorometric (HORIBA, United States). Transmission electron microscopy (TEM) images were recorded using a JEOL 2020 transmission electron microscope. The UV-visible (UV-vis) absorption was obtained using T6 New Century spectrometer. Fourier transform infrared (FT-IR) spectroscopy measurements were recorded on a UERTEX-70 FT-IR spectrometer (Thermo-Fisher, United States). X-ray photoelectron spectroscopy (XPS) analysis was performed using an EscaLab 250xi spectrometer. Powder patterns of the samples were collected using a MiniFlex600 X-ray powder diffractometer. The RGB color intensity of the fluorescence photographs were captured using a smartphone under a WFH-204B portable UV lamp (365 nm).
Preparation of NCDs and Au NCs
All glassware was washed with aqua regia (VHCl: VHNO3 = 3:1) before the start of each experiment. The NCDs and Au NCs were prepared according to a literature procedure (Xie et al., 2018) and (Xie et al., 2009), respectively.
Fluorescence Detection of Hg2+
By introducing various Hg2+ concentrations (0.05–2.5 µM) into the above ratio fluorescent probe solution, the sensitivity of the response to Hg2+ was assessed. Under 400 nm excitation, the 410–780 nm fluorescence spectrum was recorded. Fluorescent probe solutions were formulated by mixing NCDs and Au NCs in 2 ml phosphate buffered saline (PBS) buffer (10 mM, pH = 7.4) at a fluorescence intensity ratio of 1:1. In a homemade closed box, color changes were observed under a 365 nm UV lamp. A variety of common metal cations, including Na+, K+, Ca2+, Ni2+, Co2+, Cd2+, Ba2+, Fe3+, Zn2+, Cr3+, Al3+, Ag+, Mg2+, Pb2+, and Cu2+ were selected to investigate their selectivity and anti-interference ability.
Smartphone Colorimetric Detection of Hg2+
Different concentrations of Hg2+ were added into the 1:1 fluorescent probe solution, and under a 365 nm UV lamp, the corresponding fluorescent color images were captured using a homemade smartphone-based colorimetric device. The RGB values of the generated fluorescence color information were obtained using the free Android application Color Grab [loomatix (2021) Color Gr, 2021].
Paper-Based Fluorescent Sensor for the Detection of Hg2+
After the fluorescent paper sensor was developed according to the literature (Xie et al., 2019), the adjusted ratio fluorescent probe solution was added to the hydrophilic area to make it appear uniform and stable on the paper-based sensor. Different concentrations of the mercury ion solution were added to the hydrophilic area of the paper sensor. The RGB values were captured and recognized by the smartphone on Color Grab. The quantitative relationship between the color intensity and concentration was established for quantitative detection.
Analysis of Hg2+with Fluorescent Probe
Tap water and Yellow River water (Lanzhou, China) were used for the recovery experiments in this study. All Yellow River water and tap water samples were carried out on the same day of collection. All water samples were filtered twice with a 0.22 μm microporous membrane before used for experiments. Various concentrations of Hg2+ were added to the water samples, while the probe solution was used for detection. Three independent experiments were performed to determine.
Results and Discussion
The Design of the Ratio Fluorescent Probe
In the current design strategy, the mixing ratio of NCDs and Au NCs was adjusted to realize the visual mercury ion detection. The reaction mechanism is shown in Scheme 1. The NCDs play a background reference role in the sensing system, while the Au NCs were quenched at the Hg2+ reaction site. The working principle presents a special high affinity between Hg2+ and Au+ interactions; hence, the red fluorescence of Au NCs is quenched by Hg2+ (Yan et al., 2016; Sahu et al., 2020), while the blue fluorescence of NCDs is stable against Hg2+, leading to distinct ratiometric fluorescence changes when exposed to Hg2+(Scheme 1).
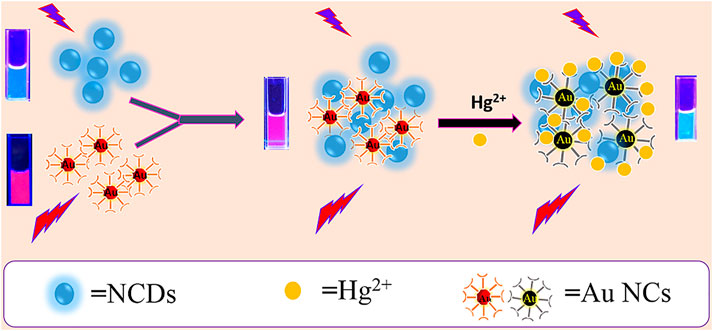
SCHEME 1. Schematic diagram of the formation principle and visualization of the ratio fluorescent probe for the detection of Hg2+.
Preparation of the Paper-Based Fluorescent Sensor
For rapid mercury ion detection, the paper-based sensor was designed according to reference (Xie et al., 2019). The preparation process is as follows: by using a hand-held puncher, 6 mm holes were punched into the fluorescent acetate filter paper to form hydrophilic reaction zones. Subsequently, 6 mm diameter holes were also punched into the sub-light black film paper, discarding the self-adhesive black paper and pasting together the two sub-optical black film paper sheets to form the hydrophobic barrier area. Finally, the filter paper containing the 6 mm diameter holes was pasted onto two sub-optical black film paper sheets to construct a fluorescent paper-based sensor with good affinity and water drainage. The construction process is illustrated in Figure 1.
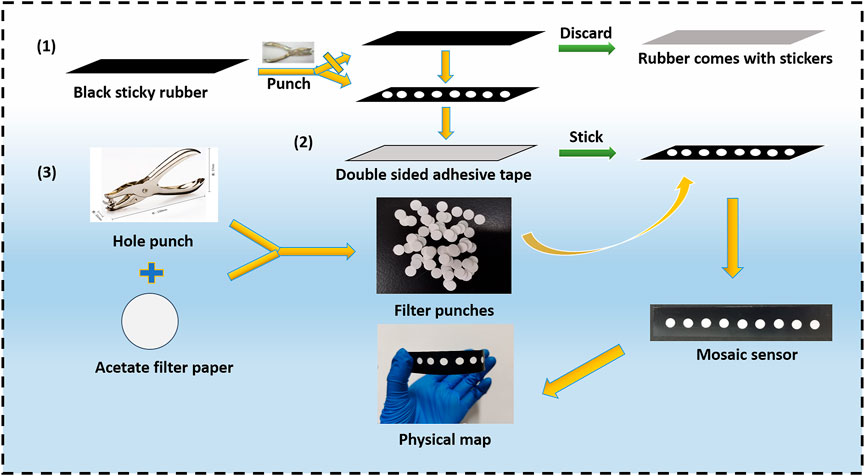
FIGURE 1. Schematic diagram of the paper-based sensor design.
Characterization of NCDs and Au NCs
The properties of the NCDs and Au NCs were characterized using TEM, UV-vis absorption spectroscopy, FT-IR spectroscopy, X-ray diffraction (XRD), XPS, and fluorescence spectroscopy. The NCDs and Au NCs were approximately 3–5 nm in size (Supplementary Figure S1A,B), which proves that the synthesized nanomaterials have uniform particle size and dispersion distribution in aqueous solution. The characteristic peaks at wavenumbers 1171 cm−1, 1310 cm−1, and 1390 cm−1 were assigned to the stretching vibrations of the C–O–C, C–N, and C–C bonds. The peak at 1650 cm−1 was assigned to the stretching vibration of C=O, while 2950 cm−1 and 3410 cm−1 were assigned to the stretching vibrations of the C–H or N–H/O–H bonds (Supplementary Figure S1C). A broad peak at 2θ = 19.48° was observed owing to the disordered carbon atoms and graphite lattice spacing (Supplementary Figure S1D). In the excitation wavelength range of 290–400 nm, the fluorescence intensity of the NCDs (Supplementary Figure S2A) varied with different amplitudes and reached a maximum at 360 nm. Similarly, when the excitation wavelength was adjusted to 330–410 nm, the fluorescence intensity of the Au NCs showed the same trend and reached the maximum value of 350 nm (Supplementary Figure S2B). To balance the excitation wavelength between the NCDs and Au NCs, 400 nm was selected as the optimal excitation wavelength. This clearly shows that the NCDs contain C, H, N, and O elements. The appearance of peaks at 284.77, 399.87, and 531.29 eV are assigned to the characteristic peaks of C 1s, N 1s and O 1s, respectively, which correlate well with the above FT-IR results (Supplementary Figure S2C). The high-resolution C 1s spectrum consists of three peaks at 284.71, 286.03, and 287.62 eV, which belong to the C−C, C−O, and C=O/COOH bonds, respectively (Supplementary Figure S2D). The high-resolution spectrum of the carbon point N 1s can be divided into three peaks at 398.97, 399.87, and 401.46 eV, related to the C−N−C, N−H and N−C=C bonds (Supplementary Figure S2E). The high-resolution spectrum of O 1s contains two peaks at 531.28 and 533.01 eV (Supplementary Figure S2F), which are related to the C=O and C−OH/C−O−C bonds. XPS analysis showed that there were −OH, −COOH, and −NH2 functional groups on the surface of the carbon point. As shown in the fluorescence spectra of the NCDs, the Au NCs and ratio fluorescent probe solutions are represented by letters a, b, and c, respectively (Supplementary Figure S3A). The ratio fluorescent probe solutions disperse well in water and exhibits dual-emission bands at 464 and 662 nm under excitation at 400 nm. Supplementary Figure S3B shows the UV−vis spectra. The black line represents the UV−vis absorption spectrum of NCDs. An acromion at 278 nm may be due to the n–π* excitation of the C=O group on the surface of the NCDs. The red line represents the UV−vis absorption spectrum of the Au NCs. No absorption was observed in the UV region. The blue line represents the UV−vis absorption spectrum of the ratio fluorescent probe solutions. The fluorescence intensity ratios (I464/I662) of the probe solutions remained steady over 1 h, proving their excellent photostability (Supplementary Figure S3C). Besides, the probe solutions were processed by centrifugation and found to have no significant increase or decrease in fluorescence intensity, and its fluorescence color was found to remain unchanged when photographed with a 365 nm UV lamp, indicating the good stability and usefulness of these ratiometric probe solutions.
Optimal Fluorescence Intensity Ratio
pH is above 8 or below 6, the fluorescence intensity ratio of the probe solutions start to increase (Supplementary Figure S3E). The fluorescence intensity of the probe solutions tends to be stable in the pH range 7–8. Therefore, 7.4 was selected as the optimal pH. Kinetic experiments showed that the probe solutions can respond to Hg2+ in less than 5 min (Supplementary Figure S3F). To further illustrate the effect of these two fluorescent materials, a Hg2+ solution with a concentration ranging from 0.05 to 2.5 µM was added to a solution of NCDs and Au NCs The signal responses were then recorded. With an increase in Hg2+ concentration, NCDs did not response toward Hg2+, and its fluorescence intensity and color remained unchanged (Supplementary Figure S4A), while Au NCs continuously responded toward Hg2+, and its fluorescence intensity gradually decreased (Supplementary Figure S4B). With regards to the fluorescence color, the red became darker and difficult to distinguish with the naked eye. When the fluorescence intensity ratios of the probe solutions (NCDs: Au NCs) were set to 1:1, 1:2, and 1:3, respectively (Supplementary Figures S4C–E), the response toward Hg2+ was examined, and color changes were recorded.
Response of the Ratio Fluorescent Probe to Hg2+
A clear fluorescence color change from red to blue was observed (Supplementary Figure S4F) at a 1:1 ratio. Figure 2A illustrates the close relationship between the changes in fluorescence intensity and Hg2+ concentration. A good linear correlation (R2 = 0.9935) was obtained from the standard curve for Hg2+ concentrations ranging from 0.05 to 2.5 µM (Figure 2B). The limit of detection (LOD) for Hg2+ was 2.7 nM based on the 3δ/slope. The linear range and LOD results were compared with those obtained using other methods (Table 1).
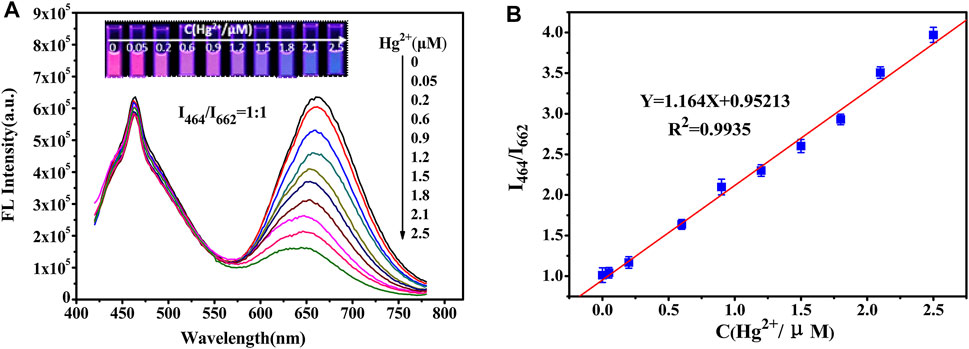
FIGURE 2. (A) Fluorescence spectra of the ratiometric fluorescent probes with the addition of Hg2+. The ratio of fluorescence intensity of NCDs to Au NCs is 1:1. The inset shows the corresponding fluorescence photographs taken under a 365 nm UV lamp. (B) Linear plot of the ratio of I464/I662 versus Hg2+ concentration.
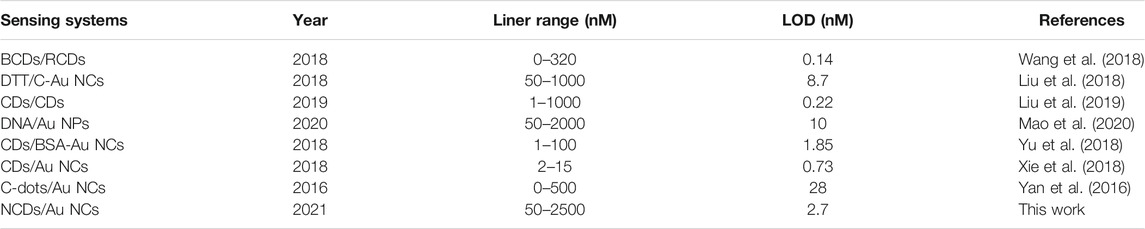
TABLE 1. Comparison of the current probe with reported fluorescent probes.
Smartphone Colorimetric Detection of Hg2+
As the Hg2+ concentration increase from 0.05 to 2.5 µM, fluorescence images show a shift from red to blue under 365 nm UV light. Figure 3A shows a schematic of Hg2+ detection using a smartphone. Coupled with a 365 nm UV light, the RGB values of the solution were detected and recorded immediately, as shown in Figure 3B.
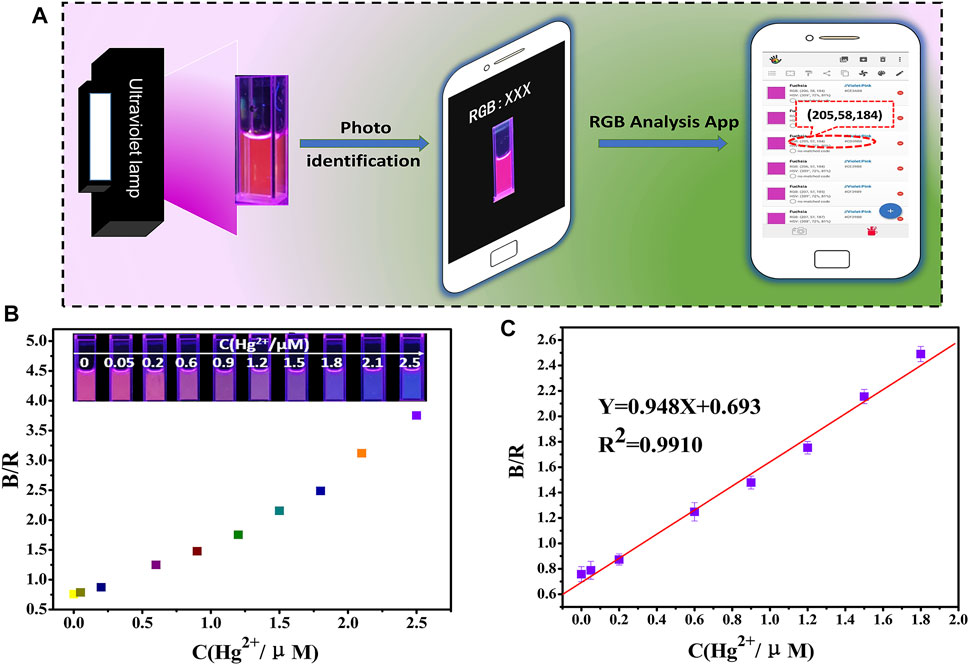
FIGURE 3. (A) Schematic drawing of the detection of Hg2+ using a smartphone; RGB analysis of the generated images via a color recognizer application; (B,C) detection of Hg2+ by the fluorescence probe solution combined with a smartphone.
Based on the analysis of the response results, the ratio of the blue and red channels (B/R) were selected to calculate the signal response values. The linear relationship between B/R and the Hg2+ concentration (0.05–1.8 µM) was obtained as shown in Figure 3C, with a linear equation of B/R = 0.948C + 0.693. Therefore, it seems that there is a good linear relationship between the signal response values and the Hg2+ concentration. The LOD was calculated to be 25 nM based on the 3δ/slope.
Detecting Hg2+ With the Paper-Based Fluorescent Sensor
To facilitate the visualization of Hg2+, the probe solution was repeatedly and uniformly added dropwise to the paper-based sensor. Under a 365 nm UV lamp, the paper-based sensor exhibited a highly uniform red luminescence. Figure 4A shows a schematic diagram of mercury ion detection by the paper-based sensor. The paper color appears as a gradient of red to pink violet and finally to dark blue with an increase in Hg2+ concentration from 0.05 to 2.5 µM (Figure 4B).
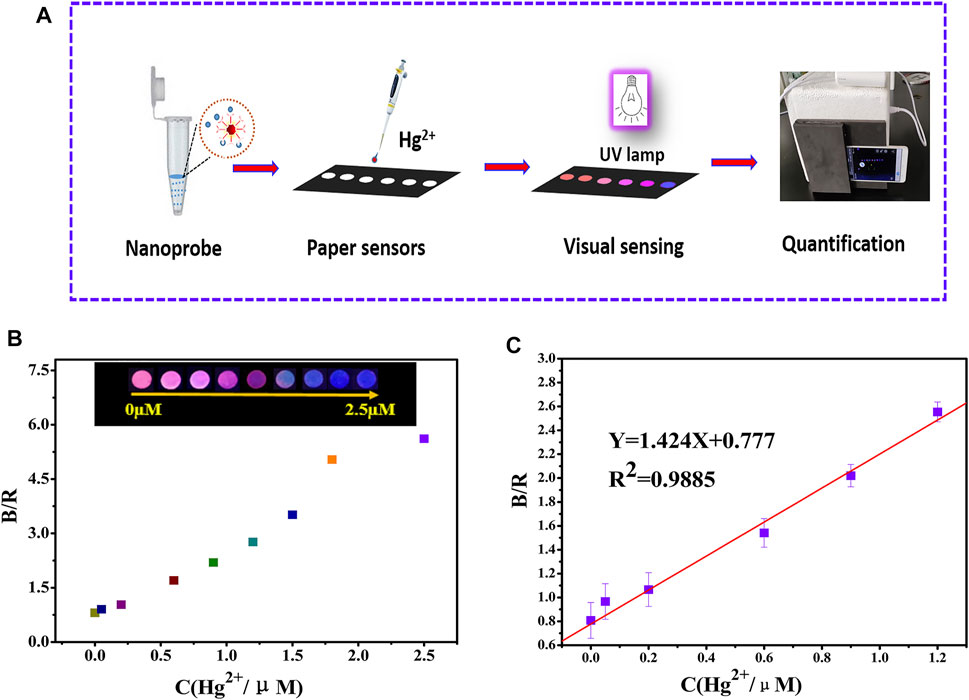
FIGURE 4. (A) The schematic diagram of visual and quantitative detection of mercury ions by the paper-based sensor platform; (B) smart phone recognition paper-based sensor detection of mercury ions and data (C).
The RGB values of the test paper were identified using the application Color Grab. The results are shown in Figure 4B, and good linearity was observed through the fitted linear equation (B/R = 1.424C + 0.777, R2 = 0.9885) when the Hg2+ concentration was in the range of 0.05–1.2 µM. The LOD was 32 nM based on the 3δ/slope (Figure 4C). As shown in Supplementary Figure S5C, the paper-based sensor was in the fluorescence color maintenance stage within 20 days at room temperature, and a distinct color variance still reemerged in the presence of 2.5 µM Hg2+.
In contrast, when different concentrations of mercury ion solutions were added to the paper-based sensor with the NCDs single probe solution, the blue fluorescence did not change under a 365 nm UV lamp (Supplementary Figure S5A), while the red fluorescence of Au NCs gradually weakened until it completely faded (Supplementary Figure S5B). It is difficult for the naked eye to separate color variations; however, the dual-emission ratio fluorescent paper sensor has a wide color range and is more suitable to observe for naked eye (Supplementary Figure S4F). These data suggest that the fluorescent paper chip sensor can simplify the detection process and achieve quantitative analysis of mercury ions using smartphones.
Selectivity and Anti-interference Ability
As shown in Figures 5A,C, the fluorescence intensity at 662 nm increased up to 80% when the Hg2+ concentration was at 2.5 µM. The value of I464/I662 did not change significantly with the addition of 25 μM of other metal cations (Na+, K+, Ca2+, Ni2+, Co2+, Cd2+, Ba2+, Fe3+, Zn2+, Cr3+, Al3+, Ag+, Mg2+, Pb2+, and Cu2+). Therefore, the fluorescent probe solution has a high selectivity toward Hg2+ because of the specific binding between the mercury ions and the functional groups on the Au NCs.
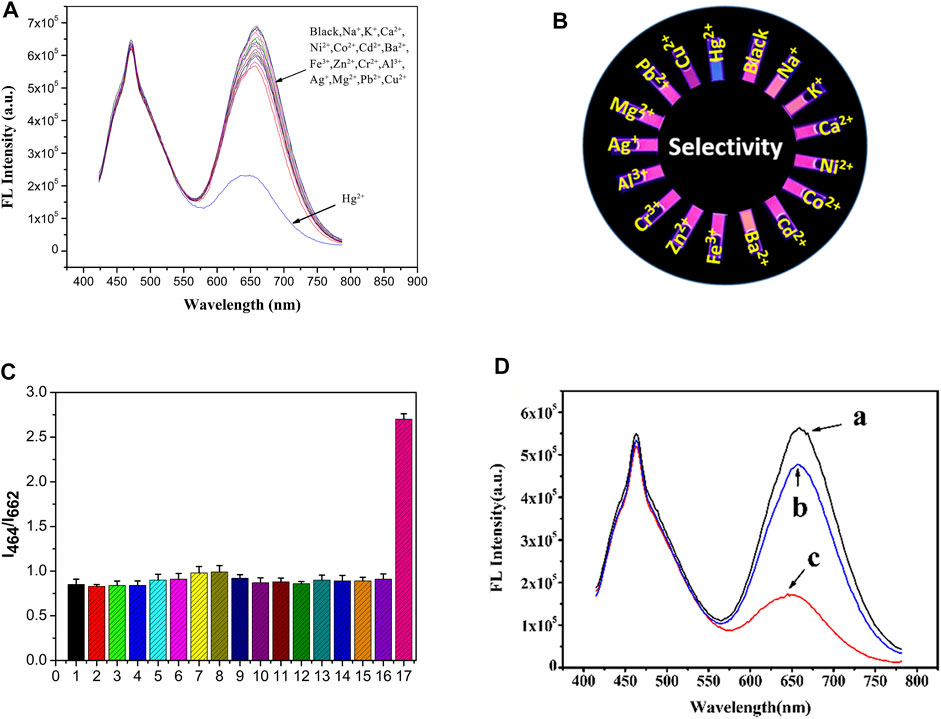
FIGURE 5. (A) Schematic diagram of the selective responses of the ratio fluorescent probe solutions to metal ions; (B) The corresponding fluorescence photos; (C) The histogram shows the selective responses of the fluorescence intensity (I464/I662) of the probe solutions to different metal cations, samples marked 1–17 represent 1. Blank, 2. Na+, 3. K+, 4. Ca2+, 5. Ni2+, 6. Co2+, 7. Cd2+, 8. Ba2+, 9. Fe3+, 10. Zn2+, 11. Cr3+, 12. Al3+, 13. Ag+, 14. Mg2+, 15. Pb2+, 16. Cu2+, 17. Hg2+; (D) The anti-interference performance of the ratio fluorescent probes; (A) without any addition of metal ions. (B) The addition of 25 μM of metal cations mentioned above together. (C) A subsequent addition of 2.5 μM Hg2+ in (B).
With the addition of 1 μM of the metal cations, the I464/I662 ratio increased by approximately 15% (Figure 5D). However, this phenomenon was significantly different after the addition of mercury ions. The corresponding fluorescence images (Figure 5B) were also photographed using a 365 nm UV lamp. The data suggests that the ratio fluorescent probe solution exhibits excellent selectivity and anti-interference capability for Hg2+. Cu2+ ion shows slight suppression effect on BSA-AuNCs fluorescence mainly results from its low concentration in the selectivity and anti-interference experiment. The pre-separation method should be adopted if the matrixes contain large amount of Cu2+ ion higher than 10 times.
Detection of Hg2+ in Real Samples
The ratio fluorescence probe solution was applied to determine the Hg2+ in tap water (from our laboratory) and Yellow River water samples (from An Ning, Lanzhou.). All the water samples were treated with ordinary qualitative filter paper and 0.22 μm Supor filters. Hg2+ at concentrations of 0.5, 1.2, 1.6, and 2.0 μM were spiked to test the rate of recovery. The results are shown in Table 2. The recovery rates obtained ranged from 90.5 to 107.6%. The results indicate that the designed probe solution has practical applicability for the detection of Hg2+ in water samples.
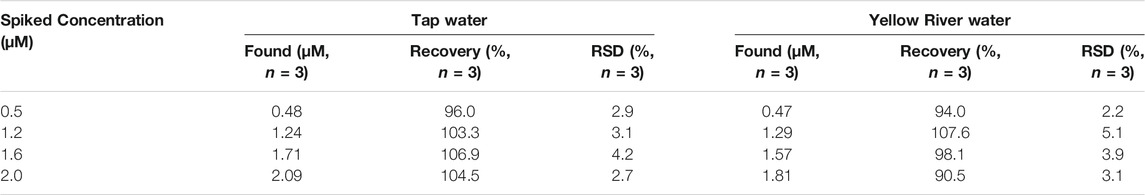
TABLE 2. The rate of recovery of Hg2+ in water samples (Using luminescence spectrometer).
Conclusion
In short, the designed dual-emission ratio fluorescent probe exhibits two characteristic emission peaks at 464 and 662 nm under 400 nm excitation by adjusting the fluorescence intensity ratio to 1:1. The fluorescence colorimetric signal (from red to blue) can be attributed to the variation in the fluorescence intensity ratio, which can be easily observed by the naked eye under an UV lamp. Compared to the individual probe, the fluorescence probe has good sensitivity and reliability. The ratio fluorescence probe can also be used for the fluorescence detection of Hg2+ in water samples. At the same time, using a smartphone to identify the RGB values of the probe solution can simplify the analysis equipment and achieve rapid colorimetric detection of mercury ions. The utilization of paper sensors with the assistance of a smartphone enables sensitive, visible, low-cost, and rapid detection of Hg2+ in aqueous medium.
Data Availability Statement
The original contributions presented in the study are included in the article/Supplementary Material, further inquiries can be directed to the corresponding authors.
Author Contributions
YF: Conceptualization, Methodology, Supervision, Writing–Review and Editing. JW: Data curation, Validation, Writing–Review and Editing. BP: Supervision, Writing–Review and Editing. MF and ZP: Data analysis, draft writing. CW: Conceptualization, Methodology. YG: Software. JS and ML: Funding acquisition, Supervision, Writing–Review and Editing.
Funding
The authors would like to thank the National Key Research and Development Program of China (2018YFC1603702), the special fund from key topics (17CXZ006), the National Natural Science Foundation of China (42177439) and the Tianjin Natural Science Foundation (20JCQNJC00860)for their financial support.
Conflict of Interest
The authors declare that the research was conducted in the absence of any commercial or financial relationships that could be construed as a potential conflict of interest.
Publisher’s Note
All claims expressed in this article are solely those of the authors and do not necessarily represent those of their affiliated organizations, or those of the publisher, the editors and the reviewers. Any product that may be evaluated in this article, or claim that may be made by its manufacturer, is not guaranteed or endorsed by the publisher.
Supplementary Material
The Supplementary Material for this article can be found online at: https://www.frontiersin.org/articles/10.3389/fchem.2022.859379/full#supplementary-material
References
Agarwalla, H., Mahajan, P. S., Sahu, D., Taye, N., Ganguly, B., Mhaske, S. B., et al. (2016). A Switch-On NIR Probe for Specific Detection of Hg2+ Ion in Aqueous Medium and in Mitochondria. Inorg. Chem. 55 (22), 12052–12060. doi:10.1021/acs.inorgchem.6b02233
Chang, P.-C. C. H.-T., and Chiang, C.-K. (2013). Synthesis of Fluorescent BSA–Au NCs for the Detection of Hg2+ Ions. J. Nanopart. Res. 15, 1336. doi:10.1007/s11051-012-1336-0
Chen, G., Guo, Z., Zeng, G., and Tang, L. (2015). Fluorescent and Colorimetric Sensors for Environmental Mercury Detection. Analyst 140, 5400–5443. doi:10.1039/c5an00389j
Du, Y., Liu, R., Liu, B., Wang, S., Han, M. Y., and Zhang, Z. (2013). Surface-Enhanced Raman Scattering Chip for Femtomolar Detection of Mercuric Ion (II) by Ligand Exchange. Anal. Chem. 85, 3160–3165. doi:10.1021/ac303358w
Erxleben, H., and Ruzicka, J. (2005). Atomic Absorption Spectroscopy for Mercury, Automated by Sequential Injection and Miniaturized in Lab-On-Valve System. Anal. Chem. 77 (16), 5124–5128. doi:10.1021/ac058007s
Fayazi, M., Taher, M. A., Afzali, D., and Mostafavi, A. (2016). Fe3O4 and MnO2 Assembled on Halloysite Nanotubes: A Highly Efficient Solid-phase Extractant for Electrochemical Detection of Mercury(II) Ions. Sensors Actuators B: Chem. 228, 1–9. doi:10.1016/j.snb.2015.12.107
Fu, W.-J., Peng, Z.-X., Dai, Y., Yang, Y.-F., Song, J.-Y., Sun, W., et al. (2022). Highly Fluorescent N Doped C-Dots as Sensor for Selective Detection of Hg2+ in Beverages. Spectrochimica Acta A: Mol. Biomol. Spectrosc. 265, 120392. doi:10.1016/j.saa.2021.120392
Gao, L., Lv, Q., Xia, N., Lin, Y., Lin, F., and Han, B. (2021). Detection of Mercury Ion with High Sensitivity and Selectivity Using a DNA/Graphene Oxide Hybrid Immobilized on Glass Slides. Biosensors 11, 300. doi:10.3390/bios11090300
Irvine, G., Tan, S., and Stillman, M. (2017). A Simple Metallothionein-Based Biosensor for Enhanced Detection of Arsenic and Mercury. Biosensors 7, 14. doi:10.3390/bios7010014
Liu, B., Zeng, F., Wu, S., Wang, J., and Tang, F. (2013). Ratiometric Sensing of Mercury(II) Based on a FRET Process on Silica Core-Shell Nanoparticles Acting as Vehicles. Microchim. Acta 180 (9), 845–853. doi:10.1007/s00604-013-1002-y
Liu, W., Wang, X., Wang, Y., Li, J., Shen, D., Kang, Q., et al. (2018). Ratiometric Fluorescence Sensor Based on Dithiothreitol Modified Carbon Dots-Gold Nanoclusters for the Sensitive Detection of Mercury Ions in Water Samples. Sensors Actuators B: Chem. 262, 810–817. doi:10.1016/j.snb.2018.01.222
Liu, Z., Jin, W., Wang, F., Li, T., Nie, J., Xiao, W., et al. (2019). Ratiometric Fluorescent Sensing of Pb2+ and Hg2+ with Two Types of Carbon Dot Nanohybrids Synthesized from the Same Biomass. Sensors Actuators B: Chem. 296, 126698. doi:10.1016/j.snb.2019.126698
Liu, Z., Mo, Z., Niu, X., Yang, X., Jiang, Y., Zhao, P., et al. (2020). Highly Sensitive Fluorescence Sensor for Mercury(II) Based on boron- and Nitrogen-Co-Doped Graphene Quantum Dots. J. Colloid Interf. Sci. 566, 357–368. doi:10.1016/j.jcis.2020.01.092
loomatix (2021). Color Grab. Loomatix Ltd. AvaliableAt: http://www.loomatix.com/(accessed June 30, 2021).
Mao, M.-X., Zheng, R., Peng, C.-F., and Wei, X.-L. (2020). DNA-gold Nanozyme-Modified Paper Device for Enhanced Colorimetric Detection of Mercury Ions. Biosensors 10 (12), 211. doi:10.3390/bios10120211
Nazeeruddin, M. K., Di Censo, D., Humphry-Baker, R., and Grätzel, M. (2006). Highly Selective and Reversible Optical, Colorimetric, and Electrochemical Detection of Mercury(II) by Amphiphilic Ruthenium Complexes Anchored onto Mesoporous Oxide Films. Adv. Funct. Mater. 16, 189–194. doi:10.1002/adfm.200500309
Onyido, I., Norris, A. R., and Buncel, E. (2004). Biomolecule−Mercury Interactions: Modalities of DNA Base−Mercury Binding Mechanisms. Remediation Strategies. Chem. Rev. 104 (12), 5911–5930. doi:10.1021/cr030443w
Peng, B., Xu, J., Fan, M., Guo, Y., Ma, Y., Zhou, M., et al. (2020). Smartphone Colorimetric Determination of Hydrogen Peroxide in Real Samples Based on B, N, and S Co-doped Carbon Dots Probe. Anal. Bioanal. Chem. 412 (4), 861–870. doi:10.1007/s00216-019-02284-1
Ping, Y., Ruiyi, L., Yongqiang, Y., Zaijun, L., Zhiguo, G., Guangli, W., et al. (2018). Pentaethylenehexamine and D-Penicillamine Co-functionalized Graphene Quantum Dots for Fluorescent Detection of Mercury(II) and Glutathione and Bioimaging. Spectrochimica Acta Part A: Mol. Biomol. Spectrosc. 203, 139–146. doi:10.1016/j.saa.2018.05.118
Rezaei, B., Shahshahanipour, M., Ensafi, A. A., and Farrokhpour, H. (2017). Development of Highly Selective and Sensitive Fluorimetric Label-free Mercury Aptasensor Based on cysteamine@CdTe/ZnS Quantum Dots, Experimental and Theoretical Investigation. Sensors Actuators B: Chem. 247, 400–407. doi:10.1016/j.snb.2017.03.082
Sahu, D., Mohapatra, P., and Swain, S. K. (2020). Highly orange Fluorescence Emission by Water Soluble Gold Nanoclusters for “Turn off” Sensing of Hg2+ Ion. J. Photochem. Photobiol. A: Chem. 386, 112098. doi:10.1016/j.jphotochem.2019.112098
Serafimovski, I., Karadjova, I., Stafilov, T., and Cvetković, J. (2008). Determination of Inorganic and Methylmercury in Fish by Cold Vapor Atomic Absorption Spectrometry and Inductively Coupled Plasma Atomic Emission Spectrometry. Microchemical J. 89, 42–47. doi:10.1016/j.microc.2007.11.003
Sun, W., Yu, J., Deng, R., Rong, Y., Fujimoto, B., Wu, C., et al. (2013). Semiconducting Polymer Dots Doped with Europium Complexes Showing Ultranarrow Emission and Long Luminescence Lifetime for Time-Gated Cellular Imaging. Angew. Chem. Int. Ed. 52 (43), 11294–11297. doi:10.1002/anie.201304822
Wang, H., Da, L., Yang, L., Chu, S., Yang, F., Yu, S., et al. (2020). Colorimetric Fluorescent Paper Strip with Smartphone Platform for Quantitative Detection of Cadmium Ions in Real Samples. J. Hazard. Mater. 392, 122506. doi:10.1016/j.jhazmat.2020.122506
Wang, X., Sun, X., Xu, Z., Pan, W., Yu, G., and Wang, J. (2020). An Ultrasmall Chitosan Nanosphere Encapsulating Carbon Dots and Rhodamine B as a Ratiometric Probe for the Determination of Hg2+. Microchim Acta 187 (12), 655. doi:10.1007/s00604-020-04627-7
Wang, Y., Yang, L., Liu, B., Yu, S., and Jiang, C. (2018). A Colorimetric Paper Sensor for Visual Detection of Mercury Ions Constructed with Dual-Emission Carbon Dots. New J. Chem. 42 (19), 15671–15677. doi:10.1039/c8nj03683g
Xie, G.-L., Yu, H., Deng, M.-H., Zhao, X.-L., and Yu, P. (2019). A Colorimetric Microfluidic Sensor Made by a Simple Instrumental-free Prototyping Process for Sensitive Quantitation of Copper. Chem. Pap. 73 (6), 1509–1517. doi:10.1007/s11696-019-00702-3
Xie, H., Dong, J., Duan, J., Waterhouse, G. I. N., Hou, J., and Ai, S. (2018). Visual and Ratiometric Fluorescence Detection of Hg2+ Based on a Dual-Emission Carbon Dots-Gold Nanoclusters Nanohybrid. Sensors Actuators B: Chem. 259, 1082–1089. doi:10.1016/j.snb.2017.12.149
Xie, J., Zheng, Y., and Ying, J. Y. (2010). Highly Selective and Ultrasensitive Detection ofHg2+ Based on Fluorescence Quenching of Au Nanoclusters by Hg2+-Au+ Interactions. Chem. Commun. 46, 961–963. doi:10.1039/b920748a
Xie, J., Zheng, Y., and Ying, J. Y. (2009). Protein-Directed Synthesis of Highly Fluorescent Gold Nanoclusters. J. Am. Chem. Soc. 131, 888–889. doi:10.1021/ja806804u
Yan, Y., Yu, H., Zhang, K., Sun, M., Zhang, Y., Wang, X., et al. (2016). Dual-emissive Nanohybrid of Carbon Dots and Gold Nanoclusters for Sensitive Determination of Mercuric Ions. Nano Res. 9 (7), 2088–2096. doi:10.1007/s12274-016-1099-5
Yao, J., Zhang, K., Zhu, H., Ma, F., Sun, M., Yu, H., et al. (2013). Efficient Ratiometric Fluorescence Probe Based on Dual-Emission Quantum Dots Hybrid for On-Site Determination of Copper Ions. Anal. Chem. 85 (13), 6461–6468. doi:10.1021/ac401011r
Yu, L., Zhang, L., Ren, G., Li, S., Zhu, B., Chai, F., et al. (2018). Multicolorful Fluorescent-Nanoprobe Composed of Au Nanocluster and Carbon Dots for Colorimetric and Fluorescent Sensing Hg2+ and Cr6+. Sensors Actuators B: Chem. 262, 678–686. doi:10.1016/j.snb.2018.01.192
Zang, J., Li, C., Zhou, K., Dong, H., Chen, B., Wang, F., et al. (2016). Nanomolar Hg2+ Detection Using β-Lactoglobulin-Stabilized Fluorescent Gold Nanoclusters in Beverage and Biological Media. Anal. Chem. 88 (20), 10275–10283. doi:10.1021/acs.analchem.6b03011
Zhang, J., Qian, J., Mei, Q., Yang, L., He, L., Liu, S., et al. (2019). Imaging-based Fluorescent Sensing Platform for Quantitative Monitoring and Visualizing of Fluoride Ions with Dual-Emission Quantum Dots Hybrid. Biosens. Bioelectron. 128, 61–67. doi:10.1016/j.bios.2018.12.044
Keywords: gold nanoclusters, fluorescent probe, paper-based sensor, visual quantitative detection, mercury ion
Citation: Fan M, Pan Z, Wang C, Guo Y, Sun J, Liu M, Peng B, Wu J and Fang Y (2022) Quantitative Visual Detection of Mercury Ions With Ratiometric Fluorescent Test Paper Sensor. Front. Chem. 10:859379. doi: 10.3389/fchem.2022.859379
Received: 21 January 2022; Accepted: 24 February 2022;
Published: 25 March 2022.
Edited by:
Shusheng Zhang, Linyi University, ChinaCopyright © 2022 Fan, Pan, Wang, Guo, Sun, Liu, Peng, Wu and Fang. This is an open-access article distributed under the terms of the Creative Commons Attribution License (CC BY). The use, distribution or reproduction in other forums is permitted, provided the original author(s) and the copyright owner(s) are credited and that the original publication in this journal is cited, in accordance with accepted academic practice. No use, distribution or reproduction is permitted which does not comply with these terms.
*Correspondence: Bo Peng, cGVuZ2JvQG53bnUuZWR1LmNvbQ==; Jin Wu, d3VqaW5sY2hAMTYzLmNvbQ==; Yanjun Fang, ZmFuZ3lqODZAMTI2LmNvbQ==
†These authors have contributed equally to this work and share first authorship