
94% of researchers rate our articles as excellent or good
Learn more about the work of our research integrity team to safeguard the quality of each article we publish.
Find out more
ORIGINAL RESEARCH article
Front. Chem. , 02 March 2022
Sec. Theoretical and Computational Chemistry
Volume 10 - 2022 | https://doi.org/10.3389/fchem.2022.843970
 Yi Hu1†Yufan Wu1†CuiPing Jiang1Zhuxian Wang1Chunyan Shen1Zhaoming Zhu1Hui Li2Quanfu Zeng1Yaqi Xue1Yuan Wang1Li Liu1Yankui Yi1Hongxia Zhu3*
 Qiang Liu1*
Licorice flavonoids (LCFs) are natural flavonoids isolated from Glycyrrhiza which are known to have anti-melanoma activities in vitro. However, the molecular mechanism of LCF anti-melanoma has not been fully understood. In this study, network pharmacology, 3D/2D-QSAR, molecular docking, and molecular dynamics (MD) simulation were used to explore the molecular mechanism of LCF anti-melanoma. First of all, we screened the key active components and targets of LCF anti-melanoma by network pharmacology. Then, the logIC50 values of the top 20 compounds were predicted by the 2D-QSAR pharmacophore model, and seven highly active compounds were screened successfully. An optimal 3D-QSAR pharmacophore model for predicting the activity of LCF compounds was established by the HipHop method. The effectiveness of the 3D-QSAR pharmacophore was verified by a training set of compounds with known activity, and the possible decisive therapeutic effect of the potency group was inferred. Finally, molecular docking and MD simulation were used to verify the effective pharmacophore. In conclusion, this study established the structure–activity relationship of LCF and provided theoretical guidance for the research of LCF anti-melanoma.
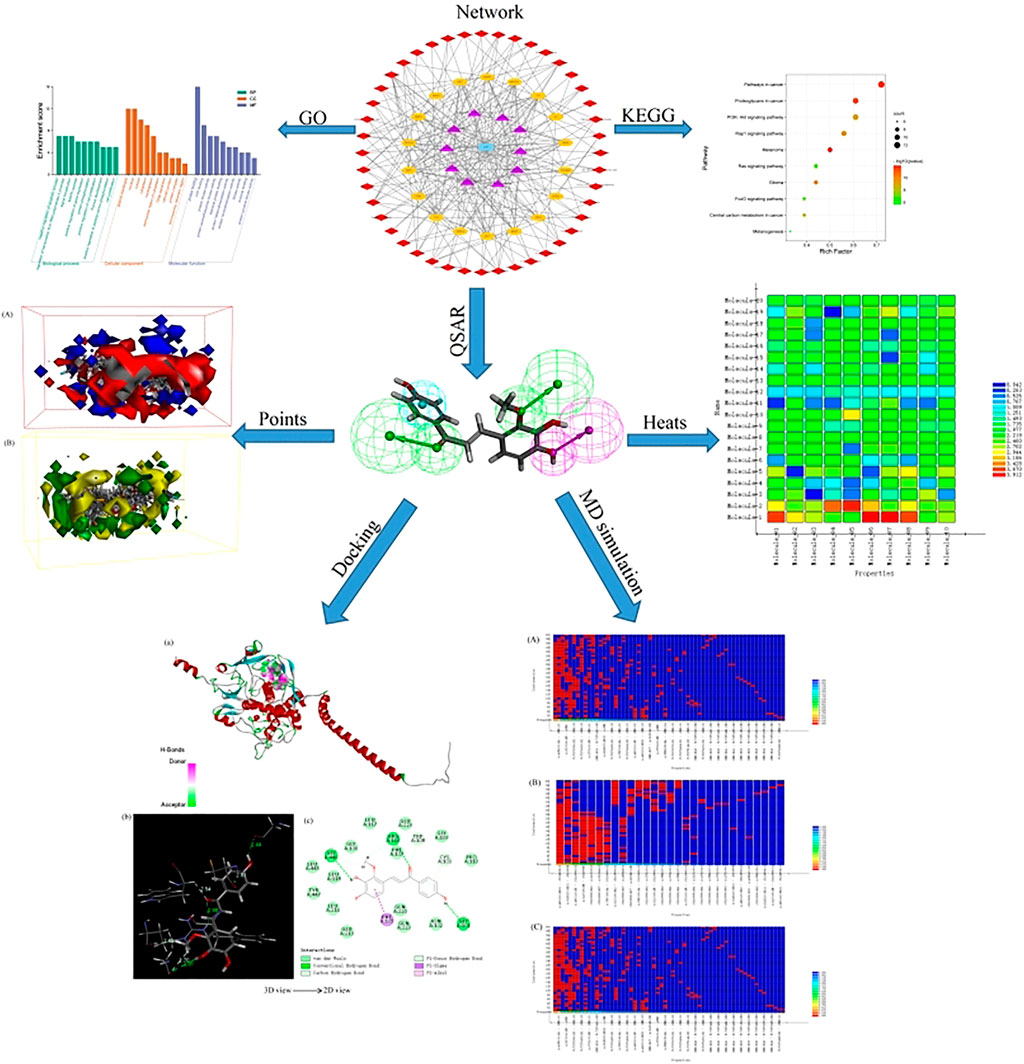
GRAPHICAL ABSTRACT
Melanoma is a common skin cancer with a high annual mortality rate, accounting for 80% of all skin cancer deaths, and is considered a serious health problem (Rastrelli et al., 2014). At present, surgical resection of melanoma is the most common treatment, but most patients with advanced melanoma are ineffective and prone to recurrence (Chen et al., 2019). In addition, the use of multidisciplinary methods such as chemotherapy, radiotherapy, and immunotherapy of melanoma is also a common treatment, but it will have an irreversible impact on skin, tissue, and organs (Liu et al., 2013; Lang et al., 2019). Therefore, more and more researchers have paid attention to finding an effective alternative therapy for melanoma (Naidoo et al., 2018; Zhang et al., 2018; Song et al., 2021).
In recent years, natural products have been widely used in medicine and pharmacology because of their potential chemotherapeutic activity (Kang et al., 2017). As an alternative therapy in modern medicine, natural products have been shown to have better antitumor activity with fewer side effects (Cho et al., 2015). LCF is a kind of natural active ingredient extracted from Glycyrrhiza and has a variety of biological activities, such as antioxidant, hepatotoxicity, anti-inflammatory, anti-ulcer, anti-allergy, antivirus, antitumor, and other biological activities (Uto et al., 2019). For example, among LCFs, licochalcone B reduces inflammation, migration, angiogenesis, and tumorigenesis and induces cell cycle arrest and apoptosis of various cancer cells in vitro and in vivo (Yuan et al., 2014; Oh et al., 2016). Isoliquiritigenin can inhibit cell proliferation and induce cell apoptosis by reducing hypoxia and glycolysis in B16F10 mouse melanoma cells (Wang et al., 2016). Although these studies have proved that LCFs have an antitumor biological function, there are few reports available on the molecular mechanism of LCF anti-melanoma.
Network pharmacology is a new subject derived from system biology, which combines computer biology with network analysis (Lv et al., 2020; Jiao et al., 2021). It can explain the pharmacological mechanism of drugs on complex diseases through multicomponent, multi-target, and multi-approach (Xia and Tang, 2021). Quantitative structure–activity relationship (QSAR) is the use of mathematical statistics to study and reveal the quantitative laws of change between the activity of a compound and its molecular structure or physicochemical characteristics, thereby allowing these “laws” to be used to assess new chemical entities (Wang et al., 2015; Alves et al., 2016; Yan et al., 2020). Therefore, if the bioactivity data of a series of structural analogs can be collected, the QSAR method can be used to predict the related activity of unknown compounds (Muratov et al., 2020; Yadav et al., 2020). For example, Tawassl et al. established a 2D-QSAR model of a pyrazole kinase inhibitor (EGFR) containing a thiourea skeleton using the QSAR method and successfully predicted its bioactivity as an EGFR kinase inhibitor using the 2D-QSAR model (Hajalsiddig et al., 2020). Gao et al. used known tyrosinase inhibitors to generate a 3D-QSAR model and successfully screened out tyrosinase inhibitors with high activity (Gao, 2018). Molecular docking is a method to predict the binding posture and affinity between the receptor protein and ligand through the interaction between the ligand and receptor, which can be used to explain the mechanism of action between drug targets (Ren et al., 2019; Avdovic et al., 2021). Molecular dynamics (MD) is one of the most commonly used methods in molecular simulation. This method is a key theoretical method to evaluate the stability and flexibility of molecules by dynamically describing the motion of molecules based on the molecular force field (Hildebrand et al., 2019; Avdović et al., 2022).
In this study, we screened the key active components and targets of LCF anti-melanoma by network pharmacology. Then, the logIC50 of tyrosinase was successfully predicted by the 2D-QSAR pharmacophore model, and the optimal 3D-QSAR pharmacophore model for predicting the activity of LCF compounds was constructed by the HipHop method. Finally, the molecular mechanism of LCF anti-melanoma was revealed by molecular docking and MD simulation.
In order to clarify the complex relationship between LCF and melanoma-related targets, network pharmacological methods were used to analyze the network. The UHPLC–Orbitrap-MS method was used to detect the relevant chemical components of LCF (Supplementary Table S1), and the compound was identified, and its structure was downloaded using the PubChem database (Supplementary Table S2), which was saved in the SDF format. The Swiss database was used to predict the target of each compound. Search for “melanoma” in the GeneCards database to collect relevant targets (relevance score >15). Draw a Venn diagram for the predicted targets of active ingredients and disease-related targets, take the intersection targets (Supplementary Figure S1; Supplementary Table S3), and get the potential target of LCF anti-melanoma. Then, enter the potential targets for melanoma treatment into the STRING database, and set the target as “Homo” to construct a protein–protein interaction (PPI) diagram of potential targets for melanoma treatment (Supplementary Figure S2). Potential target pathway enrichment was generated through the DAVID 6.8 database (Wang et al., 2021). Finally, Cytoscape v3.8.2 software (https://cytoscape.org/download.html) was used to construct a “C-T-P" network of 44 compounds, 18 targets, and 10 signaling pathways closely related to melanoma to elucidate the effective mechanism of LCF anti-melanoma. Among them, the “C-T-P” network diagram involves 73 nodes and 257 edges, and these “nodes” are used to represent compounds, targets, and paths. Associations between nodes are represented by an edge that analyzes the degree of association between nodes based on the degree value (Wang et al., 2020).
Different datasets of 32 experimentally identified tyrosinase inhibitors were obtained from the published literature (Gao, 2018; Zolghadri et al., 2019) (Figures 1, 2). The molecules were drawn by the ChemDraw module in ChemOffice, and the energy was minimized by the Minimization module in Discovery Studio software (Discovery Studio 2019; BIOVIA; San Diego, USA). The obtained conformations were used for subsequent analysis. All molecular modeling calculations were performed by Discovery Studio software. Compounds of 20 tyrosinase inhibitors were used to construct training sets for the formation of QSAR pharmacophores. To ensure the accuracy of the model, the selected tyrosinase inhibitor activity values span four quantity sets (0.029–420 μm), and 12 other compounds of tyrosinase inhibitors were selected to construct a test set (0.17–259 μm) to generate QSAR pharmacophore. The QSAR method was based on multiple linear regression (MLR), partial least squares (PLS), and other statistical methods to reveal the quantitative change law between the activity of compounds and their molecular structure or physicochemical characteristics. Therefore, in the construction of the QSAR model, the biological activity represented by the logIC50 value was the dependent variable, and its corresponding physical and chemical properties were the independent variables (Lagunin et al., 2018).
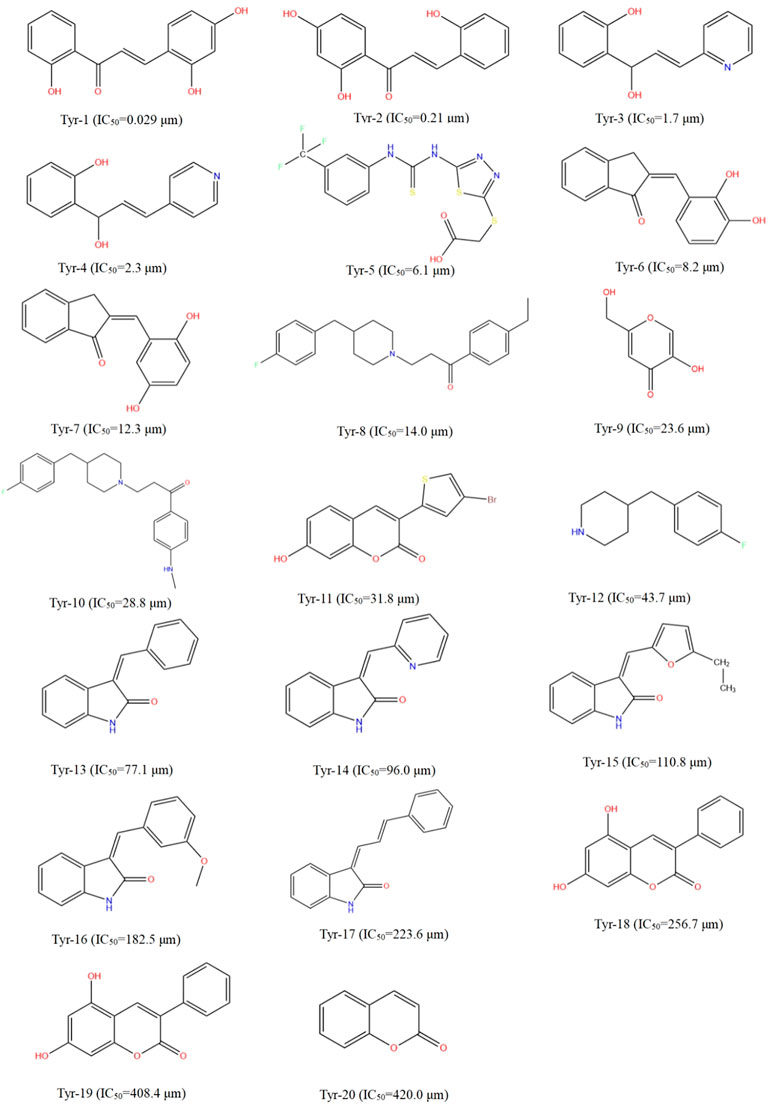
FIGURE 1. Structural formulae and corresponding IC50 values of 20 training set compounds.
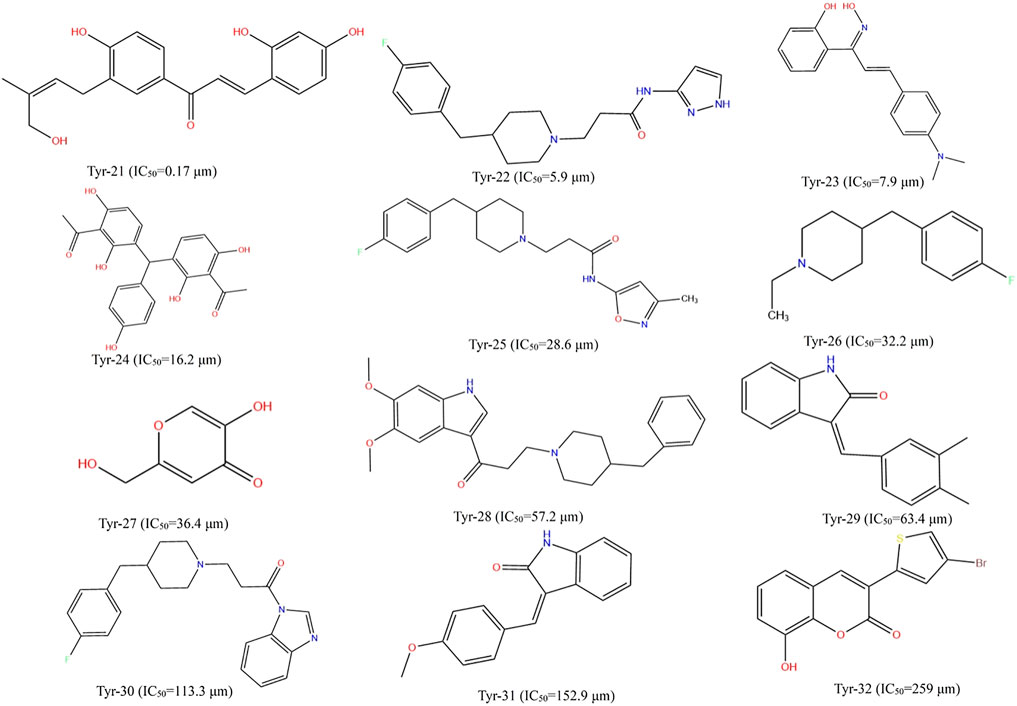
FIGURE 2. Structural formulae and corresponding IC50 values of 12 test set compounds.
This section uses Discovery Studio software to build the 2D-QSAR model. A computational molecular property module was used to calculate the 2D molecular properties of the training set and the test set (Taxak and Bharatam, 2013). Multiple linear regression (MLR) and partial least squares (PLS) were used to construct the structure–activity relationship model (Hajalsiddig et al., 2020). The biological activity of a compound was defined as logIC50, and the physicochemical parameters used in establishing the structure–activity relationship were the 2D properties of the compound calculated in the software, such as AlogP, molecular properties (molecular weight), molecular property count (Num_Aromic Rings, Num_-H_Acceptors, Num_H_Donors, Num_Ring, and Num_Rotatable Bond), and surface area and volume (Moner _ Decononal Surface) (Imran et al., 2015).
The 3D-QSAR pharmacophore model was constructed using the HipHop method of the Common Feature Pharmacophore Generation module under the Pharmacophore item in Discovery Studio software (Kim et al., 2021). The HipHop method constructs a pharmacophore model based on the known 3D structure and bioactivity data of a series of compounds and describes the common characteristics of their bioactivity. The established pharmacophore model can be used to explore the structure of the compound and its biological activity (Wang et al., 2008). Briefly, set the principal value of a compound with IC50 below 1 μm to 2 and the MaxOmitFeat value to 0 (all chemical characteristics of the compound are considered when constructing the pharmacophore model, and all the characteristic elements of the established pharmacophore must be matched). Set the principal and MaxOmitFeat values of compounds higher than 1 μm for IC50 to 1 (the conformational space should be referred to when modeling, but the modeling result can have a characteristic element that does not match it). Feature mapping was used to identify the characteristic elements of the training set, to study the molecules, including those main characteristic elements, and then set the obtained characteristic elements as the characteristic elements of the pharmacophore effect to be considered by HypoGen, namely hydrogen bond receptor (HBA), hydrogen bond donor (HBD), hydrophobic center (H), cationic group (PI), and aromatic ring center (R) were five items as possible pharmacophore characteristic elements (Fan et al., 2018). The range of each pharmacodynamic element was 0–5. The upper limit of 255 conformations for each compound was set, and only conformations with an energy difference of 10 kcal mol−1 from the lowest conformations were preserved. After calculation, only 10 pharmacophore models with the highest scores were retained (Jiang et al., 2016). The established pharmacophore model was verified by using the training set and ligand analyzer calorimeter. A good pharmacophore model should have a high matching performance to the active compounds.
A total of seven active molecules predicted by the pharmacophore model were selected as ligand molecules, and the Tyr with the highest score screened by network pharmacology was selected as a receptor protein, and the structure of tyrosinase (EC 1.14.18.1) protein was downloaded from PubChem. The Full Minimization module of Discovery Studio is used to minimize energy of small molecules, and the CHARMM force field is set to assign to the structure. This structure is used as the starting conformation to perform molecular docking (Ahmed et al., 2017). Molecular docking was performed using Discovery Studio software (Saxena et al., 2018). LibDockScore ≥90 indicates that the ligand and receptor affinity is strong, and the ligand binding is easier (Chen peng et al., 2021). The smaller the docking bond energy is, the more stable the complex of the ligand and protein is (Chen Weijian et al., 2021). The result with the highest score for molecular docking will be presented as the final conformation, from which the interaction energy after docking can be calculated. The associated free energy can be calculated by Eq. 1 (Pal et al., 2019).
MD simulations were performed using the Standard Dynamics Cascade module of Discovery Studio software for protein and ligand complexes with the highest fractions after molecular docking (El et al., 2020), to explore the stability of ligand molecules in proteins. The system was modeled using an extended simple point charge (SPC/E) water model in which the entire system was placed in a solvent chamber with a periodic boundary filled with water molecules and further stabilizes the charge using Cl− and Na+ to keep the entire simulation system electrically neutral. Initially, the steepest descent method was used to minimize the energy of the entire system (Barcellos et al., 2019). The system was then balanced by the NVT ensemble (constant number, volume, and temperature of particles) and the NPT set (constant number, pressure, and temperature of particles). Finally, the final protein–ligand complex model of MD simulation was obtained by generating trajectories (Lin et al., 2019).
The 18 intersection targets were inputted into the DAVID database for GO and KEGG bioenrichment analysis. As shown in Figure 3, GO analysis results showed that the involved biological processes (BP) mainly include the processes of positive regulation of transcription from RNA polymerase II promoter, negative regulation of the apoptotic process, signal transduction, MAPK cascade, positive regulation of gene expression, and protein phosphorylation. The cell components (CC) involved mainly include the plasma membrane, nucleus, cytosol, cytoplasm, nucleoplasm, perinuclear region of the cytoplasm, and other components. The molecular functions (MF) involved mainly included the functions of protein binding, ATP binding, protein kinase activity, protein serine/threonine kinase activity, identical protein binding, and protein heterodimerization activity.
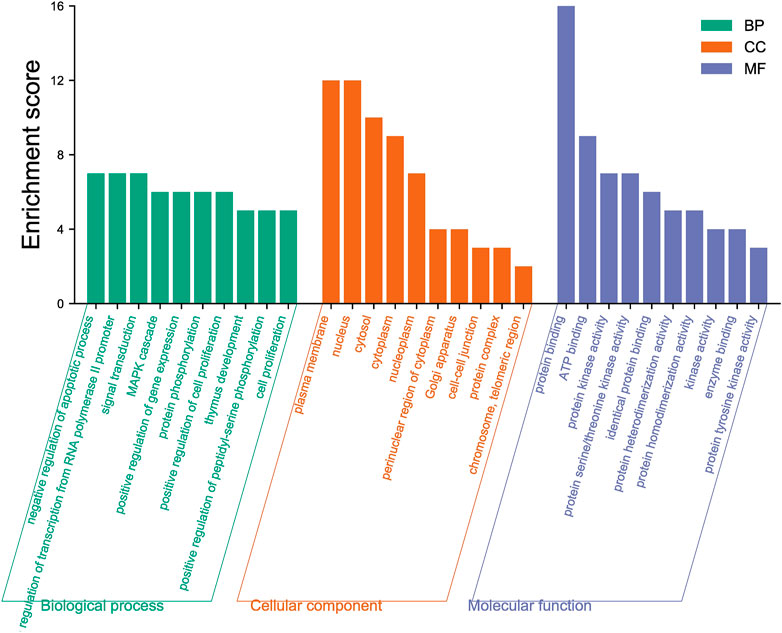
FIGURE 3. Top ten results of GO functional enrichment of biological processes (BP), cell components (CC), and molecular functions (MF).
By analyzing the metabolic pathway of KEGG, 72 signaling pathways were enriched, of which 70 pathways were qualified (p < 0.05). Figure 4 shows the ten major pathways of LCF anti-melanoma. The main channels involved were pathways in cancer, proteoglycans in cancer, PI3K-Akt signaling pathway, Rap1 signaling pathway, melanoma, glioma, Ras signaling pathway, central carbon metabolism in cancer, Fox O signaling pathway, melanogenesis, and so on. These key pathways can regulate the proliferation and apoptosis of melanoma cells and participate in the development of melanoma. At the same time, we found that Tyr, Map2k1, Kit, Ctnb1, Raf1, Hras, and other key targets regulate several key pathways together to play a therapeutic role.
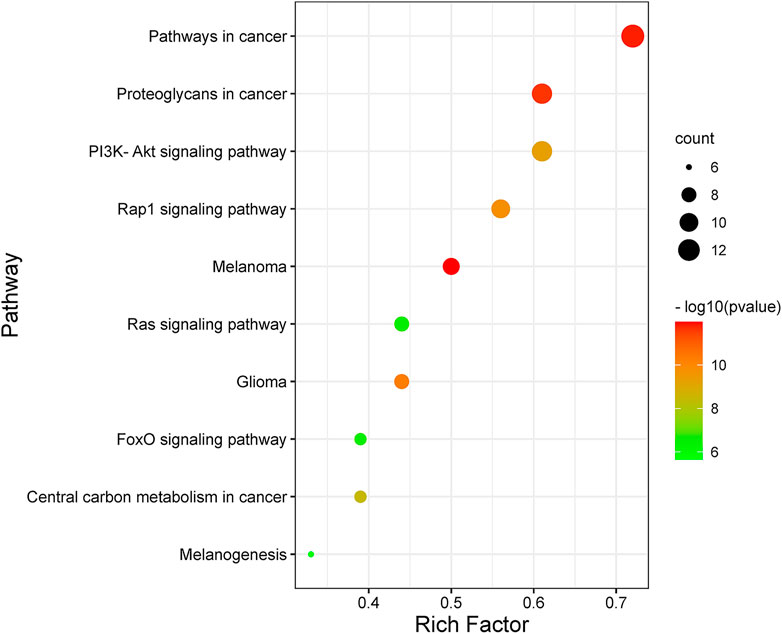
FIGURE 4. Bubble diagram of KEGG pathway enrichment.
To better understand the mechanism of LCF in the treatment of melanoma, we used Cytoscape 3.8.2 to build a “C-T-P” network diagram (Figure 5) and analyzed the degree values of various parts through a histogram (Figure 6; Tables 1, 2). In the network, the triangle represents the signaling pathway, the circle represents the target protein, and the diamond represents the active component. In the histogram, licochalcone B, naringenin, DL-liquiritigenin, liquiritigenin, liquiritin, mosloflavone, 4′-methoxyflavone, licochalcone A, 6-gingerol, 7-hydroxyflavone, retrochalcone, sakuranetin, and berberine showed higher degree values, indicating that these active ingredients play a major role in the process of anti-melanoma (Figure 6A). The potential targets of LCF in the treatment of melanoma show higher values of Tyr, Raf1, and Met (Figure 6B), indicating that these targets were the key targets of melanoma resistance. Therefore, this study suggests that the anti-melanoma mechanism of LCF was the result of multi-compound and multi-target interactions.
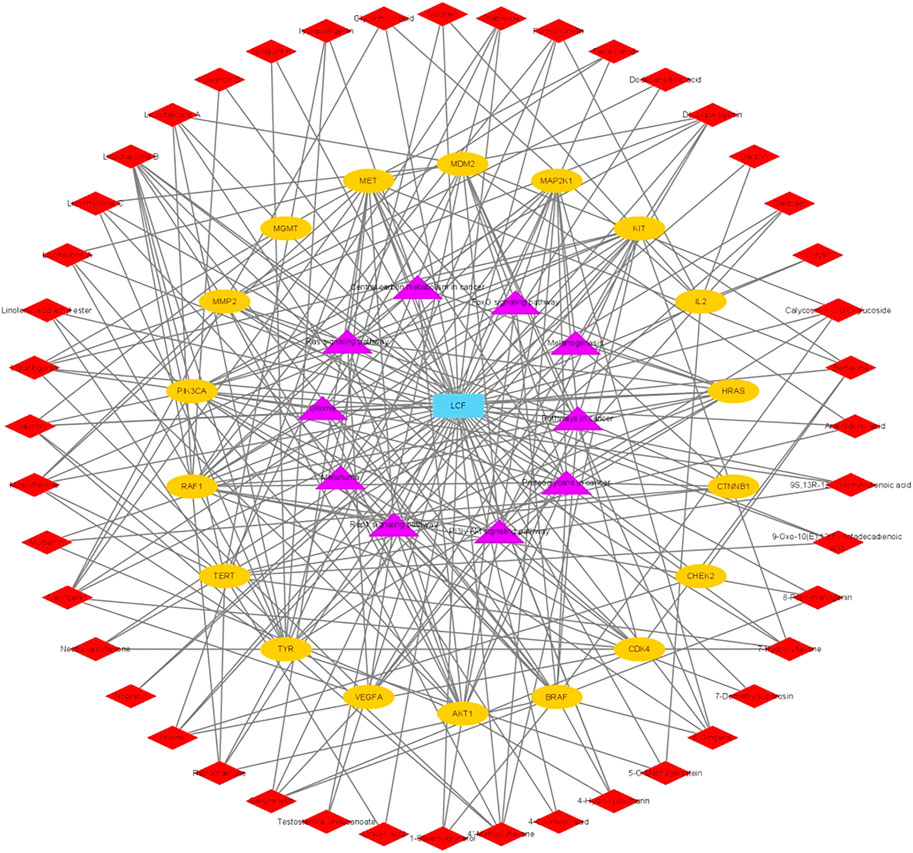
FIGURE 5. “C-T-P” network.
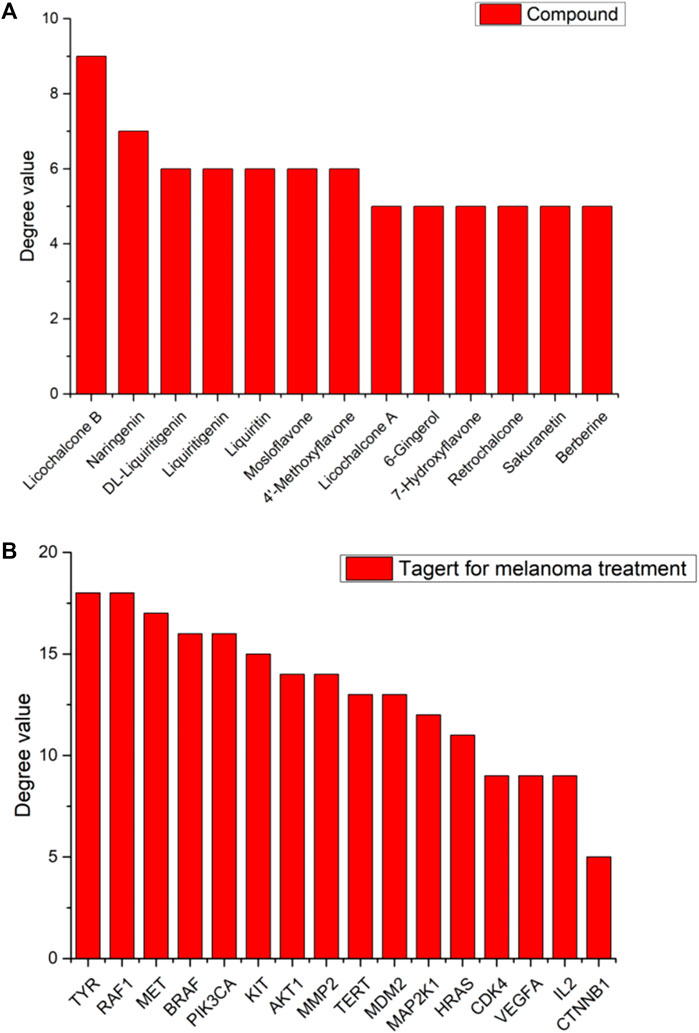
FIGURE 6. Distribution of degree values of partial compounds (A) and target (B) in Network Diagram.
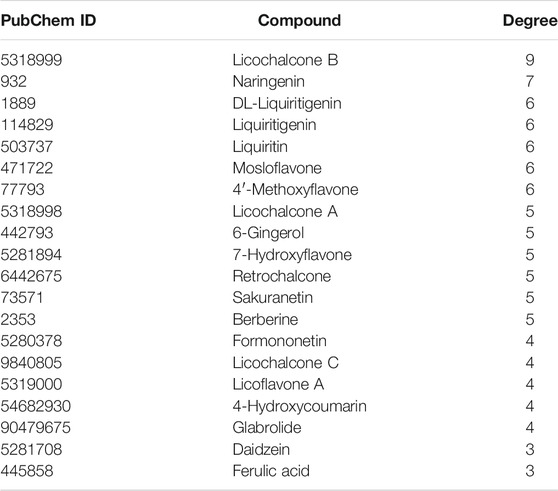
TABLE 1. Top 20 potentially effective compounds in the prescription.
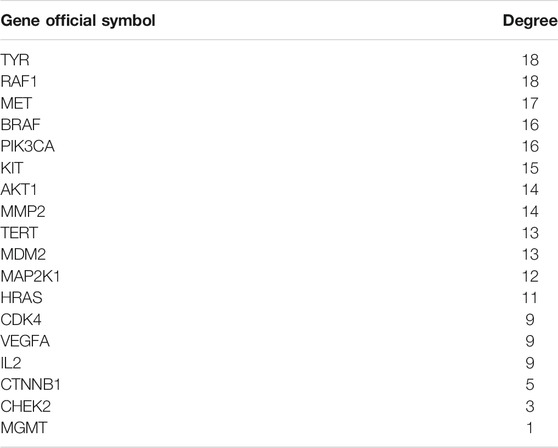
TABLE 2. Potential therapeutic targets.
Through the network pharmacological screening, we found that the degree value of the Tyr target was the first, which indicates that it may be the main target of LCF anti-melanoma, and a large number of reports also confirmed this view (Solano et al., 2006; Jawaid et al., 2009; Gao, 2018; Pu et al., 2020). Therefore, this part uses this target corresponding tyrosinase as the activity research.
The 2D-QSAR constructed by the MLR/PLS method can predict the activity of unknown compounds very well. Supplementary Figures S3, S4 show the linear regression equation of the 2D-QSAR model established by multiple linear regression (MLR) and partial least squares (PLS). The correlation coefficients (r2) of the training set compounds constructed by the MLR/PLS method were 0.984 and 0.894, respectively, which showed that the model constructed by the MLR method had better predictive ability than that constructed by the PLS method. Based on the established 2D-QSAR pharmacophore model, the test sets were used for validation, and the experimental and predictive activities (semi-inhibitory concentrations) of these test sets are listed in Table 3. The logIC50 of the test set can be divided into three groups: logIC50 < 0, high activity; 0 ≤ logIC50 ≤ 2.176, medium activity; and logIC50 > 2.176, low activity or inactivity (Gao, 2018). It can be seen from Table 3 that the model compounds based on MLR have large quality errors, most compounds have low accuracy, and only a few of them can be accurately predicted. Except for a few compounds, the 2D-QSAR pharmacophore model established by PLS can correctly predict the activities of other compounds. Therefore, compared with the model established by MLR, the model established by PLS shows good accuracy.
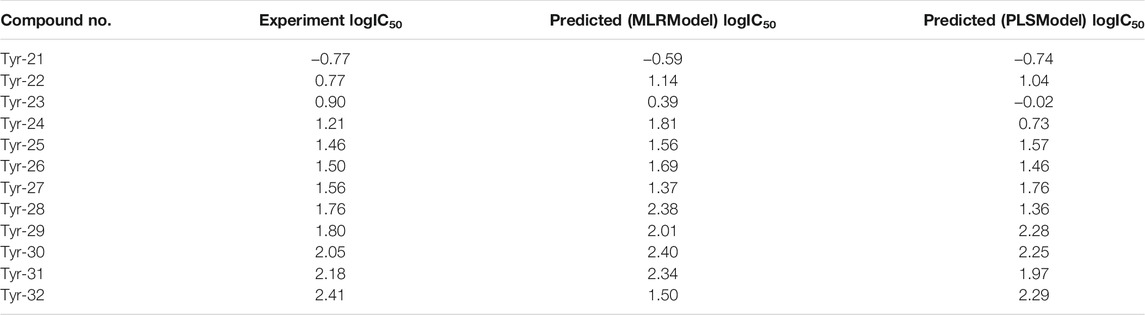
TABLE 3. Based on the 2D-QSAR test set compound experimental and predicted activity logIC50.
In order to explore the structural characteristics of LCF anti-melanoma, this part used the 2D-QSAR pharmacophore model constructed by the MLR/PLS method to predict the anti-melanoma activity of LCF compounds. Table 4 shows the predicted activity of the top 20 LCF compounds screened by network pharmacology (logIC50). As shown in Table 4, licochalcone A, 6-gingerol, retrochalcone, formononetin, licoflavone A, and daidzein showed higher activity in the model established by MLR, with logIC50 values of −0.37, −0.42, −0.38, −0.38, −0.38, and −0.38, respectively. Similarly, the IC50 values of licochalcone B, licochalcone A, 6-gingerol, retrochalcone, formononetin, licoflavone A, and daidzein in the PLS model were −0.056, −0.14, −0.34, −0.11, −0.11 −0.11, and −0.11 and showed higher activity, respectively. In the prediction of the two models, except for licochalcone B, the predicted activity values of other compounds were basically the same. Therefore, although the 2D-QSAR pharmacophore model established by MLR in the validation of the test set shows the poor predictive effect, it still has a good predictive ability. In addition, since the model established by PLS has better accuracy, we selected the predicted values of the 2D-QSAR pharmacophore model constructed by the PLS method as the follow-up study.
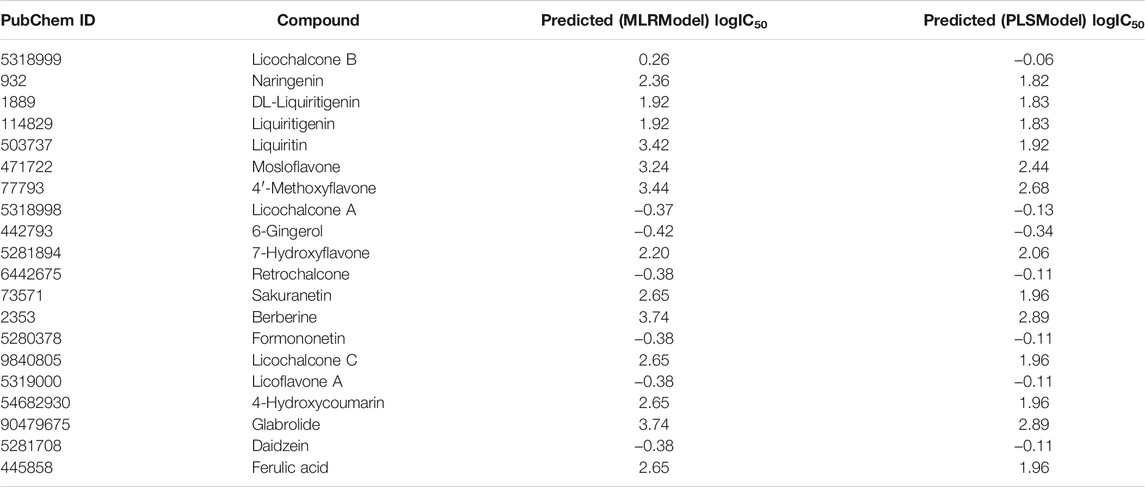
TABLE 4. Based on the 2D-QSAR model to predict the activity logIC50 of LCF.
In conclusion, seven compounds with high activity were screened from the 2D-QSAR pharmacophore model constructed by the MLR/PLS method in this study (Supplementary Figure S5). Meanwhile, this study showed that LCF has good anti-melanoma activity and provides theoretical guidance for clinical research of LCF anti-melanoma.
Although the 2D-QSAR pharmacophore model has successfully predicted the high activity characteristics of seven compounds, the structure–activity relationship between the common structures of these seven compounds and diseases was not known. Therefore, this part will use the 3D-QSAR pharmacophore model to explore the structure–activity relationship of LCF anti-melanoma.
In order to elucidate the structure–activity relationship of LCF anti-melanoma and search for the best pharmacophore model of LCF against melanoma, a total of 10 3D-QSAR pharmacophore models were generated using the HipHop method in this part. Table 5 shows the matching degree of 10 pharmacophore models with seven compounds with high activity in LCF. Each row in the table represents a pharmacophore. As shown in the table, the first pharmacophore has the higher score, so “pharmacophore 01” can be selected as the optimal pharmacophore for the follow-up study. Among them, the features in “pharmacophore 01” are HDDA, indicating that this pharmacophore contains one hydrophobic feature, two hydrogen bond donor features, and one hydrogen bond acceptor feature. The spatial arrangement of the pharmacophore is shown in Supplementary Figure S6. The rank indicated a score of 64.452 for this pharmacophore; Direct Hit indicated that the pharmacophore characteristics matched with seven small molecules. Partial Hit indicates that the number of partial matching pharmacophores with seven small molecules is 0. Max Fit indicated that each of the four pharmacophores could be matched with seven small molecules. Therefore, this study showed that “pharmacophore 01” is the best model of the anti-melanoma pharmacophore of LCF.
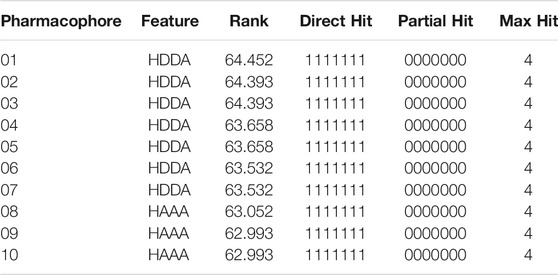
TABLE 5. Parameters of 10 common features of the pharmacophore.
In order to further elucidate the structure–activity relationship of LCF anti-melanoma, non-covalent interaction between LCF and anti-melanoma targets was explored. The 3D-QSAR model, which uses energy grid points as a descriptor, is a regression model based on small molecule steric and electrostatic fields and can be used to predict the activity of unknown small ligand molecules and to observe receptor–ligand interactions, both favorable and unfavorable (Potemkin et al., 2017). Figure 7A shows the contour map of the electrostatic field coefficients of the training set molecules matched to the 3D-QSAR model. Among them, the red area indicates that the stronger the negative charge of the substituents in this area, the better the activity of the compound; the blue area indicates that the stronger the positive charge of the substituents in this area, the better the activity of the compound. Figure 7B shows the contour map of the stereo field coefficients of the training set molecules matched to the 3D-QSAR model. Among them, the yellow area indicates that the increase in the volume of the substituents in this area was not conducive to improving the activity of the compound; the blue area indicates that the increase in the volume of the substituents in this area was conducive to improving the activity of the compound. This study showed that both the shape of the compound molecule and its electrostatic distribution have an effect on the activity of the compound. Therefore, we can screen the active compounds in LCF based on this information to find better drug molecules. Meanwhile, this study also showed that LCF has better anti-melanoma activity by producing non-covalent bond interaction with melanoma-related targets.
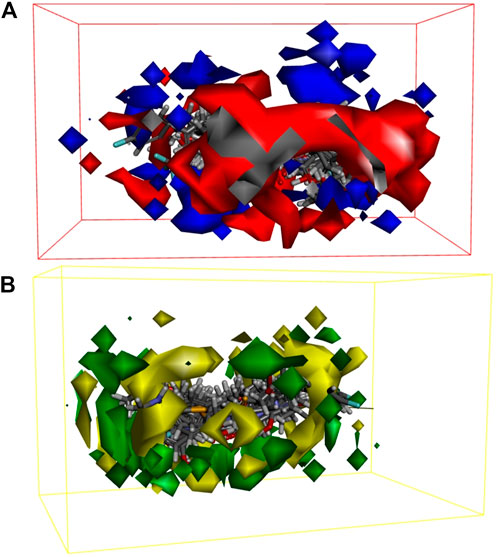
FIGURE 7. Electrostatic field coefficient contour map (A) and the stereo field coefficient contour map (B) of the training set molecules matched to the 3D-QSAR model.
In order to verify the validity of the 3D-QSAR potency model constructed by HipHop, we need to verify whether the pharmacophore has a good ability to distinguish between active and inactive molecules through a known training set of compounds with activity. Figure 8 shows the thermal maps of ten 3D-QSAR pharmacophore models for predicting training set compounds. Table 6 shows the corresponding matching degree. The closer the fit value is to 4, the better the compound fit with the model; the closer the fit value is to 0, the less the compound fit with the model. As shown in Figure 8, the FitValue values of the compounds with higher activity in “pharmacophore 01” were higher than those of the compounds with lower activity in “pharmacophore 01”. This result indicates that “pharmacophore 01” was the best 3D-QSAR pharmacophore model for predicting the activity of LCF compounds. It was also suggested that the pharmacophore model may be the decisive therapeutic pharmacophore of LCF anti-melanoma.
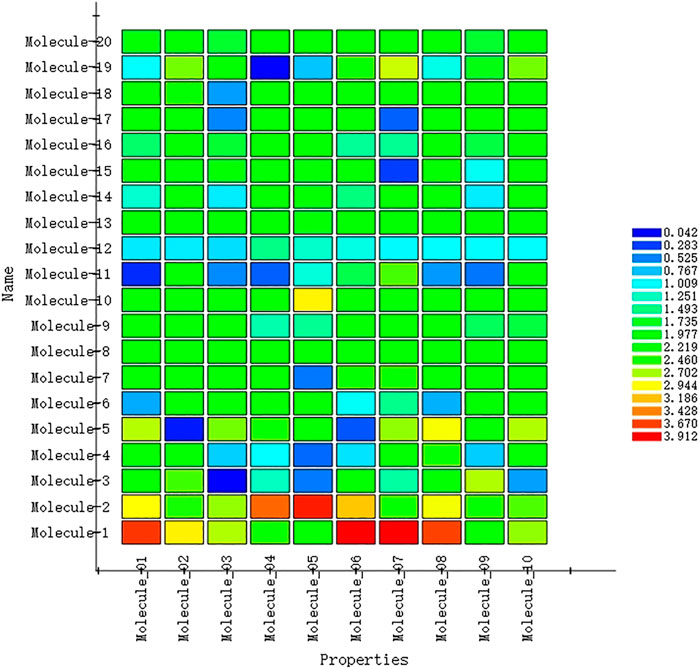
FIGURE 8. Heat map of the predicted compounds by the 10 pharmacophore models for the test set compounds.
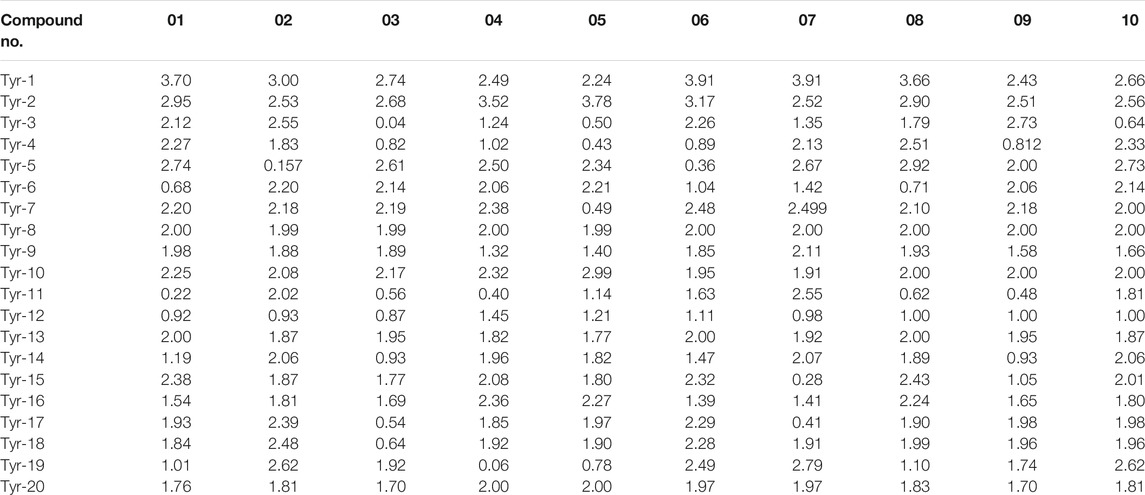
TABLE 6. Matching degree of the test set compounds predicted by the 10 pharmacophore models.
In conclusion, logIC50 values of the top 20 compounds selected by network pharmacology were predicted by the 2D-QSAR pharmacophore model, and seven highly active compounds were screened successfully. Then, an optimal 3D-QSAR pharmacophore model for predicting the activity of LCF compounds was constructed by the HipHop method. Finally, the effectiveness of the 3D-QSAR pharmacophore was verified by a training set of compounds with known activity, and the possible decisive therapeutic effect of the “pharmacophore 01” was speculated. Therefore, we will carry on with the molecular docking and the MD simulation to carry on with the verification of it, further discussing the LCF anti-melanoma molecular mechanism.
In order to verify the rationality of the pharmacophore model constructed by seven highly active compounds of LCF, molecular docking was used to verify the model. Table 7 shows the docking scores and docking energies of licochalcone B, licochalcone A, 6-gingerol, retrochalcone, formononetin, licoflavone A, daidzein, and tyrosinase. The results of docking showed that the seven highly active compounds had a good binding activity with tyrosinase. Among them, licochalcone B, licochalcone A, 6-gingerol, retrochalcone, formononetin, and licoflavone A all scored more than 100 docking points, indicating that these six compounds play an important role in the anti-melanoma process of LCF. Figure 9 shows the molecular docking of licochalcone B with tyrosinase. The combination of tyrosinase and licochalcone B occurs in the form of hydrogen bonds and π bonds. The interaction groups were consistent with the “pharmacophore 01”. Specifically, the hydrophobic region of the benzene ring of licochalcone B interacts with the amino acid residue PHE on tyrosinase to form a π bond with a spacing of 2.61Å. The two hydroxyl hydrogen bond donors on licochalcone B interacted with the GLY of the amino acid residues on tyrosinase to form the hydrogen bond spacing of 2.91Å and 2.44Å. The carbonyl hydrogen bond receptors on the licochalcone B compound interact with the amino acid residue PHE on the tyrosinase to form a hydrogen bond spacing of 2.98Å (Figures 9B,C). Similarly, Supplementary Figure S7 shows the results of licochalcone A, 6-gingerol, retrochalcone, formononetin, licoflavone A, daidzein, and tyrosinase in much the same way as licochalcone B. Therefore, molecular docking studies have shown that the optimal “pharmacophore 01” constructed by the 3D-QSAR pharmacophore model is the dominant pharmacophore in the anti-melanoma activity of LCF.
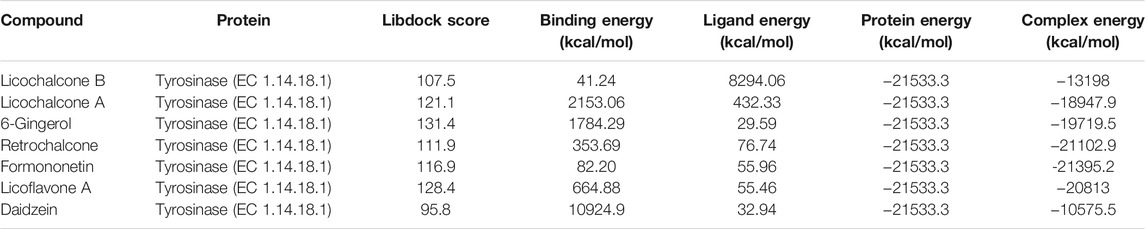
TABLE 7. Molecular docking.
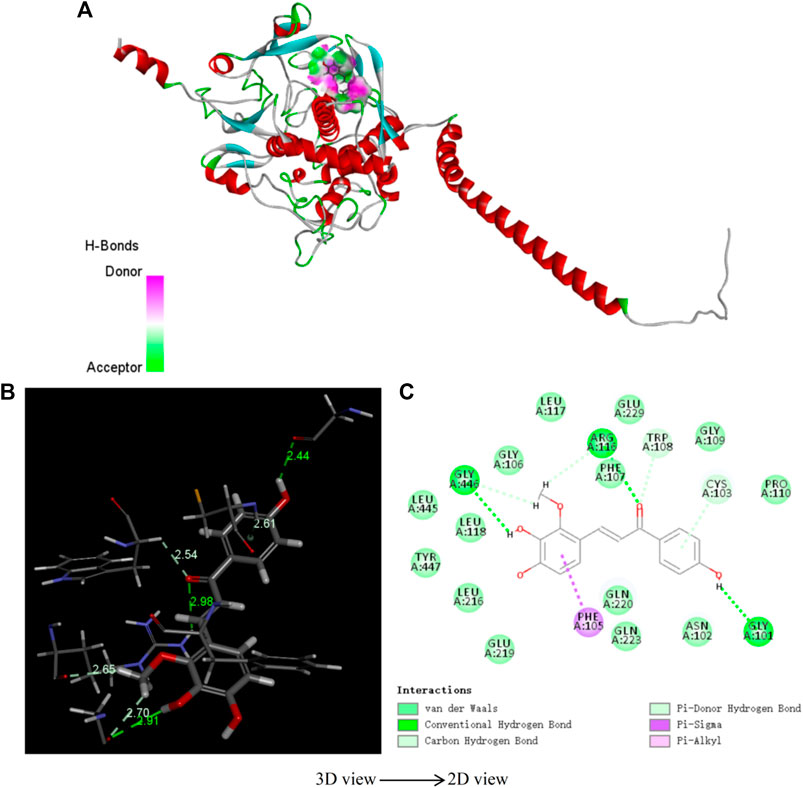
FIGURE 9. 3D structure (A), spatial structure (B), 2D structure (C) of tyrosinase and licochalcone B molecule docking.
Molecular dynamics simulation is a key theoretical method, which can be used to obtain the stability of the protein–ligand complex. In order to determine the binding mass of small molecular ligands with tyrosinase after docking, the complex was further analyzed by molecular dynamics simulation. The RMSD curves, potential energies, and hydrogen bond heat map of licochalcone B, licochalcone A, 6-gingerol, and tyrosinase complexes are shown in Figures 10–12. It can be seen from Figure 10 that after 20 ps, the trajectories of all the complexes tend to balance, and the potential energy tends to stabilize over time. Figure 11 showed that the RMSD curve also exhibits good stability after 80 ps The hydrogen bond heat map also showed that the interaction between ligand compounds and proteins was relatively stable (Figure 12). The MD simulation results showed that hydrogen and π bonds formed between licochalcone B, licochalcone A, 6-gingerol, and tyrosinase help to maintain their stability. The results also prove the rationality of the optimal “pharmacophore 01” constructed by the 3D-QSAR pharmacophore model. Thus, during the treatment phase, licochalcone B, licochalcone A, and 6-gingerol inhibit melanoma formation by interacting with tyrosinase to treat the disease.
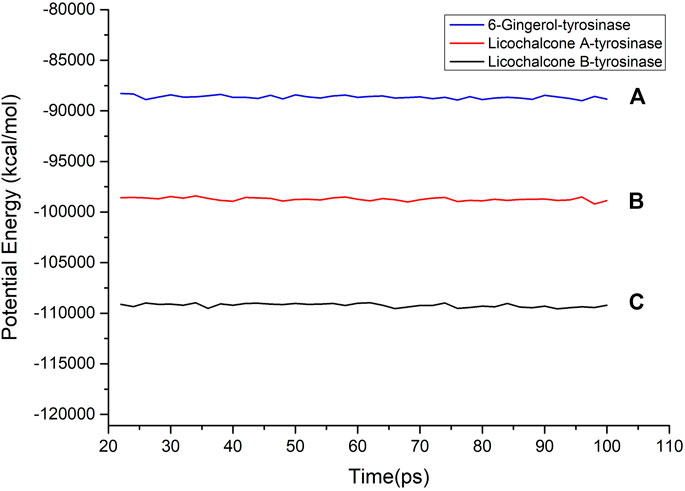
FIGURE 10. Potential energy of licochalcone B–tyrosinase (A), licochalcone A–tyrosinase (B), and 6-gingerol–tyrosinase (C).
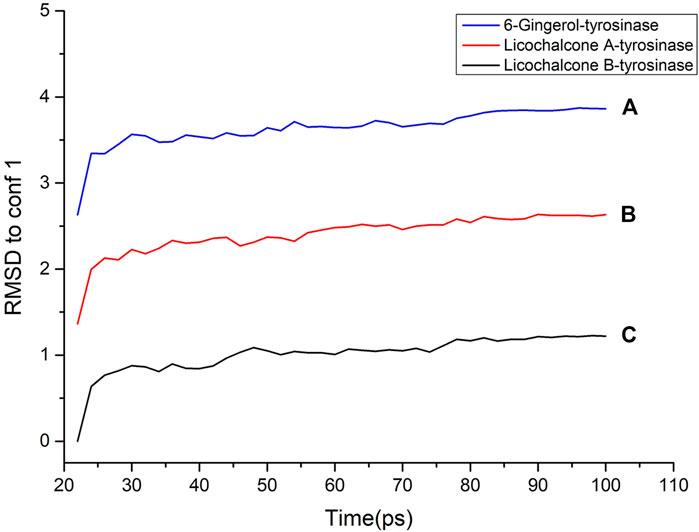
FIGURE 11. RMSD to conf 1 of licochalcone B–tyrosinase (A), licochalcone A–tyrosinase (B), and 6-gingerol–tyrosinase (C).
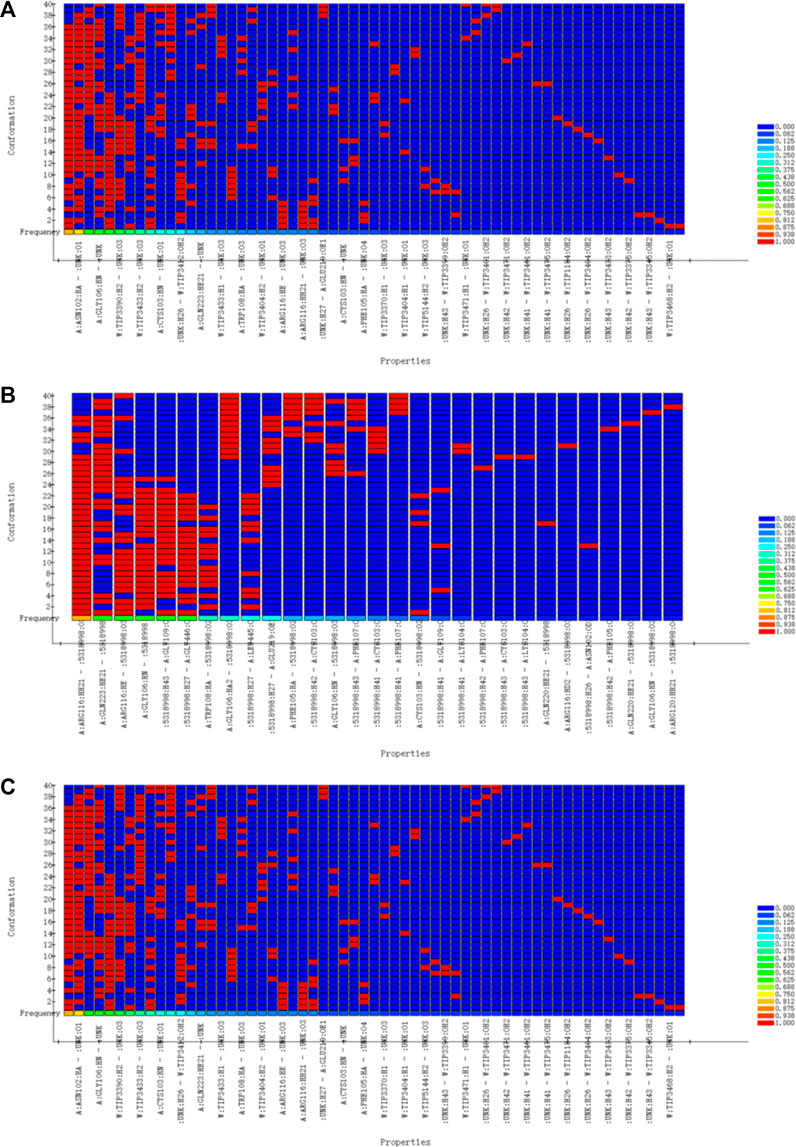
FIGURE 12. Hydrogen bond heat map of licochalcone B-tyrosinase (A), licochalcone A-tyrosinase (B), 6-gingerol-tyrosinase (C).
In this study, the molecular mechanism of LCF anti-melanoma was studied by means of network pharmacology, 3D/2D-QSAR, molecular docking, and molecular dynamics (MD) simulation. Network pharmacology studies have shown that licochalcone B, naringenin, and DL-liquiritigenin were key anti-melanoma active components in LCF, and Tyr was the key target of anti-melanoma. 2D-QSAR pharmacophore model studies have shown that licochalcone B, licochalcone A, 6-gingerol, retrochalcone, formononetin, licoflavone A, and daidzein were highly active compounds in the anti-melanoma activity of LCF. The results of the 3D-QSAR model showed that the optimal pharmacophore of LCF was composed of one hydrophobic group, two hydrogen-bonded donor groups, and one hydrogen-bonded acceptor group. Molecular docking studies have shown that the optimal pharmacophore model constructed by 3D-QSAR was the dominant pharmacophore in the anti-melanoma activity of LCF. MD simulations showed that the hydrogen and π bond interactions between licochalcone B, licochalcone A, 6-gingerol, and tyrosinase were helpful to maintain their stability, which proves the rationality of the 3D-QSAR pharmacophore model. In conclusion, this study found the structure–activity relationship between the structural properties and biological activities of LCF, and a reliable statistical model was established to confirm the anti-melanoma activity of LCF.
The original contributions presented in the study are included in the article/Supplementary Material, further inquiries can be directed to the corresponding authors.
Credit author statement: YH: conceptualization, data curation, formal analysis, investigation, and writing (original draft). YfW: data curation, formal analysis, and writing (review and editing). CJ: methodology and investigation. ZW: methodology and investigation. CS: methodology and investigation. ZZ: methodology and investigation. HL: methodology and investigation. QZ: methodology and investigation. YX: methodology and investigation. HL: methodology and investigation. YaW: methodology and investigation. LL: methodology and investigation. YY: methodology and investigation. HZ: conceptualization, formal analysis, supervision, and writing (review and editing). QL: conceptualization, formal analysis, supervision, and writing (review and editing).
This work was financially supported by the National Natural Science Foundation of China (grant numbers 82074023, 81874346).
The authors declare that the research was conducted in the absence of any commercial or financial relationships that could be construed as a potential conflict of interest.
All claims expressed in this article are solely those of the authors and do not necessarily represent those of their affiliated organizations, or those of the publisher, the editors, and the reviewers. Any product that may be evaluated in this article, or claim that may be made by its manufacturer, is not guaranteed or endorsed by the publisher.
The Supplementary Material for this article can be found online at: https://www.frontiersin.org/articles/10.3389/fchem.2022.843970/full#supplementary-material
Ahmed, N., Anwar, S., and Thet Htar, T. (2017). Docking Based 3D-QSAR Study of Tricyclic Guanidine Analogues of Batzelladine K as Anti-malarial Agents. Front. Chem. 5, 36. doi:10.3389/fchem.2017.00036
Alves, V. M., Capuzzi, S. J., Muratov, E. N., Braga, R. C., Thornton, T. E., Fourches, D., et al. (2016). QSAR Models of Human Data Can Enrich or Replace LLNA Testing for Human Skin Sensitization. Green. Chem. 18 (24), 6501–6515. doi:10.1039/C6GC01836J
Avdović, E. H., Milanović, Ž. B., Molčanov, K., Roca, S., Vikić-Topić, D., Mrkalić, E. M., et al. (2022). Synthesis, Characterization and Investigating the Binding Mechanism of Novel Coumarin Derivatives with Human Serum Albumin: Spectroscopic and Computational Approach. J. Mol. Struct. 1254, 132366. doi:10.1016/j.molstruc.2022.132366
Avdovic, E. H., Petrovic, I. P., Stevanovic, M. J., Saso, L., Dimitric, M. J., Filipovic, N. D., et al. (2021). Synthesis and Biological Screening of New 4-Hydroxycoumarin Derivatives and Their Palladium(II) Complexes. Oxid. Med. Cel. Longev 2021, 8849568. doi:10.1155/2021/8849568
Barcellos, M. P., Santos, C. B. R., Federico, L. B., Almeida, P. F. d., da Silva, C. H. T. d. P., and Taft, C. A. (2019). Pharmacophore and Structure-Based Drug Design, Molecular Dynamics and Admet/tox Studies to Design Novel Potential Pad4 Inhibitors. J. Biomol. Struct. Dyn. 37 (4), 966–981. doi:10.1080/07391102.2018.1444511
Chen, P., Wang, C., Zhang, Y., Yuan, C., Yu, B., Ke, X., et al. (2021). Predicting the Molecular Mechanism of “Angong Niuhuang Pills” in the Treatment of COVID-19 Based on Network Pharmacology. Nat. Prod. Commun. 16 (6), 1934578X211024032. doi:10.1177/1934578X211024032
Chen, W., Lin, T., He, Q., Yang, P., Zhang, G., Huang, F., et al. (2021). Study on the Potential Active Components and Molecular Mechanism of Xiao Huoluo Pills in the Treatment of Cartilage Degeneration of Knee Osteoarthritis Based on Bioinformatics Analysis and Molecular Docking Technology. J. Orthop. Surg. Res. 16 (1), 460. doi:10.1186/s13018-021-02552-w
Chen, X. Y., Ren, H. H., Wang, D., Chen, Y., Qu, C. J., Pan, Z. H., et al. (2019). Isoliquiritigenin Induces Mitochondrial Dysfunction and Apoptosis by Inhibiting mitoNEET in a Reactive Oxygen Species-dependent Manner in A375 Human Melanoma Cells. Oxid. Med. Cel. Longev 2019, 9817576. doi:10.1155/2019/9817576
Cho, J. H., Lee, R. H., Jeon, Y.-J., Shin, J.-C., Park, S.-M., Choi, N.-J., et al. (2015). Role of Transcription Factor Sp1 in the 4-O-Methylhonokiol-Mediated Apoptotic Effect on Oral Squamous Cancer Cells and Xenograft. Int. J. Biochem. Cel Biol. 64, 287–297. doi:10.1016/j.biocel.2015.05.007
El Hassab, M. A., Shoun, A. A., Al-Rashood, S. T., Al-Warhi, T., and Eldehna, W. M. (2020). Identification of a New Potential SARS-COV-2 RNA-dependent RNA Polymerase Inhibitor via Combining Fragment-Based Drug Design, Docking, Molecular Dynamics, and MM-PBSA Calculations. Front. Chem. 8, 584894. doi:10.3389/fchem.2020.584894
Fan, H. T., Guo, J. F., Zhang, Y. X., Gu, Y. X., Ning, Z. Q., Qiao, Y. J., et al. (2018). The Rational Search for PDE10A Inhibitors from Sophora flavescens Roots Using Pharmacophore- and D-ocking-based V-irtual S-creening. Mol. Med. Rep. 17 (1), 388–393. doi:10.3892/mmr.2017.7871
Gao, H. (2018). Predicting Tyrosinase Inhibition by 3D QSAR Pharmacophore Models and Designing Potential Tyrosinase Inhibitors from Traditional Chinese Medicine Database. Phytomedicine 38, 145–157. doi:10.1016/j.phymed.2017.11.012
Hajalsiddig, T. T. H., Osman, A. B. M., and Saeed, A. E. M. (2020). 2D-QSAR Modeling and Molecular Docking Studies on 1H-Pyrazole-1-Carbothioamide Derivatives as EGFR Kinase Inhibitors. ACS Omega 5 (30), 18662–18674. doi:10.1021/acsomega.0c01323
Hildebrand, P. W., Rose, A. S., and Tiemann, J. K. S. (2019). Bringing Molecular Dynamics Simulation Data into View. Trends Biochem. Sci. 44 (11), 902–913. doi:10.1016/j.tibs.2019.06.004
Imran, S., Taha, M., Ismail, N. H., Kashif, S. M., Rahim, F., Jamil, W., et al. (2015). Synthesis of Novel Flavone Hydrazones: In-Vitro Evaluation of α-glucosidase Inhibition, QSAR Analysis and Docking Studies. Eur. J. Med. Chem. 105, 156–170. doi:10.1016/j.ejmech.2015.10.017
Jawaid, S., Khan, T. H., Osborn, H. M. I., and Williams, N. A. O. (2009). Tyrosinase Activated Melanoma Prodrugs. Acamc 9 (7), 717–727. doi:10.2174/187152009789056886
Jiang, L., He, Y., Luo, G., Yang, Y., Li, G., and Zhang, Y. (2016). Discovery of Potential Novel Microsomal Triglyceride Transfer Protein Inhibitors via Virtual Screening of Pharmacophore Modelling and Molecular Docking. Mol. Simulation 42 (15), 1223–1232. doi:10.1080/08927022.2016.1149701
Jiao, X., Jin, X., Ma, Y., Yang, Y., Li, J., Liang, L., et al. (2021). A Comprehensive Application: Molecular Docking and Network Pharmacology for the Prediction of Bioactive Constituents and Elucidation of Mechanisms of Action in Component-Based Chinese Medicine. Comput. Biol. Chem. 90, 107402. doi:10.1016/j.compbiolchem.2020.107402
Kang, T.-H., Yoon, G., Kang, I.-A., Oh, H.-N., Chae, J.-I., and Shim, J.-H. (2017). Natural Compound Licochalcone B Induced Extrinsic and Intrinsic Apoptosis in Human Skin Melanoma (A375) and Squamous Cell Carcinoma (A431) Cells. Phytother. Res. 31 (12), 1858–1867. doi:10.1002/ptr.5928
Kim, M., Kim, G., Kang, M., Ko, D., Nam, Y., Moon, C. S., et al. (2021). Discovery of N-Amido-Phenylsulfonamide Derivatives as Novel Microsomal Prostaglandin E2 Synthase-1 (mPGES-1) Inhibitors. Bioorg. Med. Chem. Lett. 41, 127992. doi:10.1016/j.bmcl.2021.127992
Lagunin, A. A., Romanova, M. A., Zadorozhny, A. D., Kurilenko, N. S., Shilov, B. V., Pogodin, P. V., et al. (2018). Comparison of Quantitative and Qualitative (Q)SAR Models Created for the Prediction of Ki and IC50 Values of Antitarget Inhibitors. Front. Pharmacol. 9, 1136. doi:10.3389/fphar.2018.01136
Lang, X., Green, M. D., Wang, W., Yu, J., Choi, J. E., Jiang, L., et al. (2019). Radiotherapy and Immunotherapy Promote Tumoral Lipid Oxidation and Ferroptosis via Synergistic Repression of SLC7A11. Cancer Discov. 9 (12), 1673–1685. doi:10.1158/2159-8290.CD-19-0338
Lin, W., Zheng, X., Fang, D., Zhou, S., Wu, W., and Zheng, K. (2019). Identifying hQC Inhibitors of Alzheimer's Disease by Effective Customized Pharmacophore-Based Virtual Screening, Molecular Dynamic Simulation, and Binding Free Energy Analysis. Appl. Biochem. Biotechnol. 187 (4), 1173–1192. doi:10.1007/s12010-018-2780-9
Liu, H., He, Z., and Simon, H.-U. (2013). Targeting Autophagy as a Potential Therapeutic Approach for Melanoma Therapy. Semin. Cancer Biol. 23 (5), 352–360. doi:10.1016/j.semcancer.2013.06.008
Lv, X., Xu, Z., Xu, G., Li, H., Wang, C., Chen, J., et al. (2020). Investigation of the Active Components and Mechanisms of Schisandra Chinensis in the Treatment of Asthma Based on a Network Pharmacology Approach and Experimental Validation. Food Funct. 11 (4), 3032–3042. doi:10.1039/D0FO00087F
Muratov, E. N., Bajorath, J., Sheridan, R. P., Tetko, I. V., Filimonov, D., Poroikov, V., et al. (2020). QSAR without Borders. Chem. Soc. Rev. 49 (11), 3525–3564. doi:10.1039/D0CS00098A
Naidoo, C., Kruger, C. A., and Abrahamse, H. (2018). Photodynamic Therapy for Metastatic Melanoma Treatment: A Review. Technol. Cancer Res. Treat. 17, 1533033818791795. doi:10.1177/1533033818791795
Oh, H., Yoon, G., Shin, J.-C., Park, S.-M., Cho, S.-S., Cho, J. H., et al. (2016). Licochalcone B Induces Apoptosis of Human Oral Squamous Cell Carcinoma through the Extrinsic- and Intrinsic-Signaling Pathways. Int. J. Oncol. 48 (4), 1749–1757. doi:10.3892/ijo.2016.3365
Pal, S., Kumar, V., Kundu, B., Bhattacharya, D., Preethy, N., Reddy, M. P., et al. (2019). Ligand-based Pharmacophore Modeling, Virtual Screening and Molecular Docking Studies for Discovery of Potential Topoisomerase I Inhibitors. Comput. Struct. Biotechnol. J. 17, 291–310. doi:10.1016/j.csbj.2019.02.006
Potemkin, A. V., Grishina, M. A., and Potemkin, V. A. (2017). Grid-based Continual Analysis of Molecular Interior for Drug Discovery, QSAR and QSPR. Curr. Drug Discov. Technol. 14 (3), 181–205. doi:10.2174/1570163814666170207144018
Pu, Y., Zhou, B., Xiang, H., Wu, W., Yin, H., Yue, W., et al. (2020). Tyrosinase-activated Prodrug Nanomedicine as Oxidative Stress Amplifier for Melanoma-specific Treatment. Biomaterials 259, 120329. doi:10.1016/j.biomaterials.2020.120329
Rastrelli, M., Tropea, S., Rossi, C. R., and Alaibac, M. (2014). Melanoma: Epidemiology, Risk Factors, Pathogenesis, Diagnosis and Classification. In Vivo 28 (6), 1005–1011.
Ren, G., Sun, H., Guo, J., Fan, J., Li, G., and Xu, S. (2019). Molecular Mechanism of the Interaction between Resveratrol and Trypsin via Spectroscopy and Molecular Docking. Food Funct. 10 (6), 3291–3302. doi:10.1039/c9fo00183b
Saxena, S., Abdullah, M., Sriram, D., and Guruprasad, L. (2018). Discovery of Novel Inhibitors of Mycobacterium tuberculosis MurG: Homology Modelling, Structure Based Pharmacophore, Molecular Docking, and Molecular Dynamics Simulations. J. Biomol. Struct. Dyn. 36 (12), 3184–3198. doi:10.1080/07391102.2017.1384398
Solano, F., Briganti, S., Picardo, M., and Ghanem, G. (2006). Hypopigmenting Agents: an Updated Review on Biological, Chemical and Clinical Aspects. Pigment Cel Res. 19 (6), 550–571. doi:10.1111/j.1600-0749.2006.00334.x
Song, W., Zhao, Y.-Y., Ren, Y.-J., Liu, L.-L., Wei, S.-D., and Yang, H.-B. (2021). Proanthocyanidins Isolated from the Leaves of Photinia × Fraseri Block the Cell Cycle and Induce Apoptosis by Inhibiting Tyrosinase Activity in Melanoma Cells. Food Funct. 12 (9), 3978–3991. doi:10.1039/D1FO00134E
Taxak, N., and Bharatam, P. V. (2013). 2D Qsar Study for Gemfibrozil Glucuronide as the Mechanism-Based Inhibitor of Cyp2c8. Indian J. Pharm. Sci. 75 (6), 680–687.
Uto, T., Ohta, T., Yamashita, A., Fujii, S., and Shoyama, Y. (2019). Liquiritin and Liquiritigenin Induce Melanogenesis via Enhancement of P38 and PKA Signaling Pathways. Medicines. Basel 6(2). doi:10.3390/medicines6020068
Wang, H.-Y., Cao, Z.-X., Li, L.-L., Jiang, P.-D., Zhao, Y.-L., Luo, S.-D., et al. (2008). Pharmacophore Modeling and Virtual Screening for Designing Potential PLK1 Inhibitors. Bioorg. Med. Chem. Lett. 18 (18), 4972–4977. doi:10.1016/j.bmcl.2008.08.033
Wang, T., Wu, M.-B., Lin, J.-P., and Yang, L.-R. (2015). Quantitative Structure-Activity Relationship: Promising Advances in Drug Discovery Platforms. Expert Opin. Drug Discov. 10 (12), 1283–1300. doi:10.1517/17460441.2015.1083006
Wang, Y., Ma, J., Yan, X., Chen, X., Si, L., Liu, Y., et al. (2016). Isoliquiritigenin Inhibits Proliferation and Induces Apoptosis via Alleviating Hypoxia and Reducing Glycolysis in Mouse Melanoma B16F10 Cells. Pra 11 (2), 215–227. doi:10.2174/1573406412666160307151904
Wang, Y., Yang, S. H., Zhong, K., Jiang, T., Zhang, M., Kwan, H. Y., et al. (2020). Network Pharmacology-Based Strategy for the Investigation of the Anti-obesity Effects of an Ethanolic Extract of Zanthoxylum Bungeanum Maxim. Front. Pharmacol. 11, 572387. doi:10.3389/fphar.2020.572387
Wang, Y., Zhang, Y., Wang, Y., Shu, X., Lu, C., Shao, S., et al. (2021). Using Network Pharmacology and Molecular Docking to Explore the Mechanism of Shan Ci Gu (Cremastra Appendiculata) against Non-small Cell Lung Cancer. Front. Chem. 9, 682862. doi:10.3389/fchem.2021.682862
Xia, Z., and Tang, Z. (2021). Network Pharmacology Analysis and Experimental Pharmacology Study Explore the Mechanism of Gambogic Acid against Endometrial Cancer. ACS Omega 6 (16), 10944–10952. doi:10.1021/acsomega.1c00696
Yadav, D., Mishra, B. N., and Khan, F. (2020). Quantitative Structure-Activity Relationship and Molecular Docking Studies on Human Proteasome Inhibitors for Anticancer Activity Targeting NF-Κb Signaling Pathway. J. Biomol. Struct. Dyn. 38 (12), 3621–3632. doi:10.1080/07391102.2019.1666743
Yan, W., Lin, G., Zhang, R., Liang, Z., and Wu, W. (2020). Studies on the Bioactivities and Molecular Mechanism of Antioxidant Peptides by 3D-QSAR, In Vitro Evaluation and Molecular Dynamic Simulations. Food Funct. 11 (4), 3043–3052. doi:10.1039/C9FO03018B
Yuan, X., Li, T., Xiao, E., Zhao, H., Li, Y., Fu, S., et al. (2014). Licochalcone B Inhibits Growth of Bladder Cancer Cells by Arresting Cell Cycle Progression and Inducing Apoptosis. Food Chem. Toxicol. 65, 242–251. doi:10.1016/j.fct.2013.12.030
Zhang, J., Wang, C., Wang, C., Sun, B., and Qi, C. (2018). Understanding the Role of Extracts from Sea Buckthorn Seed Residues in Anti-melanogenesis Properties on B16F10 Melanoma Cells. Food Funct. 9 (10), 5402–5416. doi:10.1039/C8FO01427B
Keywords: licorice flavonoids, melanoma, 3D-QSAR, molecular docking, MD simulation
Citation: Hu Y, Wu Y, Jiang C, Wang Z, Shen C, Zhu Z, Li H, Zeng Q, Xue Y, Wang Y, Liu L, Yi Y, Zhu H and Liu Q (2022) Investigative on the Molecular Mechanism of Licorice Flavonoids Anti-Melanoma by Network Pharmacology, 3D/2D-QSAR, Molecular Docking, and Molecular Dynamics Simulation. Front. Chem. 10:843970. doi: 10.3389/fchem.2022.843970
Received: 05 January 2022; Accepted: 04 February 2022;
Published: 02 March 2022.
Edited by:
Nino Russo, University of Calabria, ItalyReviewed by:
Quan Vo, University of Science and Technology-The University of Danang, VietnamCopyright © 2022 Hu, Wu, Jiang, Wang, Shen, Zhu, Li, Zeng, Xue, Wang, Liu, Yi, Zhu and Liu. This is an open-access article distributed under the terms of the Creative Commons Attribution License (CC BY). The use, distribution or reproduction in other forums is permitted, provided the original author(s) and the copyright owner(s) are credited and that the original publication in this journal is cited, in accordance with accepted academic practice. No use, distribution or reproduction is permitted which does not comply with these terms.
*Correspondence: Hongxia Zhu, Z3p6aHgyMDEyQDE2My5jb20=; Qiang Liu, bGl1cWlhbmdAc211LmVkdS5jbg==
†These authors have contributed equally to this work
Disclaimer: All claims expressed in this article are solely those of the authors and do not necessarily represent those of their affiliated organizations, or those of the publisher, the editors and the reviewers. Any product that may be evaluated in this article or claim that may be made by its manufacturer is not guaranteed or endorsed by the publisher.
Research integrity at Frontiers
Learn more about the work of our research integrity team to safeguard the quality of each article we publish.