 Feng-Bo Zhou
 Chang-Geng Li2*
- 1School of Information Engineering, Shaoyang University, Shaoyang, China
- 2School of Physics and Electronics, Central South University, Changsha, China
- 3School of Automation, Central South University, Changsha, China
Abstract Aiming at the problems of low accuracy and large prediction errors caused by the serious overlap of multi-metal spectral signals in zinc smelting industrial wastewater, a characteristic interval modeling method is proposed. First, according to the absorption spectra of mixed solution, the characteristic intervals of copper and nickel are preliminarily screened by using different partition lengths. Second, take the smallest root mean squares error of cross validation and the largest correlation coefficient as the evaluation indicators, compare the full-spectral model and each local model, and select the optimal feature sub-intervals of copper and nickel. Last, the partial least squares method is used to model the combined wavelengths of the optimal sub-intervals to realize the simultaneous detection of copper and nickel. The linear determination ranges are 0.3–3.0 mg/L for copper and nickel. the correlation coefficients of copper and nickel are 0.9974 and 0.9966, respectively. The results show that the method reduces the complexity of the wavelength variable screening process, improves the accuracy of the model, and lays the foundation for the accurate analysis of polymetallic ions in zinc smelting industrial wastewater.
Introduction
The zinc hydrometallurgy is mainly composed of a series of processes such as roasting, acid leaching, electrowinning and casting (Yadav and Banerjee, 2018). When the production process is completed, a large number of industrial wastewater will be discharged, and a variety of metal ions will remain in the industrial wastewater (Zhou et al., 2019). The copper (Cu) and nickel (Ni) are two main ions in industrial wastewater (Zhang et al., 2018; Li et al., 2018). The random discharge of these ions will seriously pollute the environment (Luo et al., 2019). In zinc smelting wastewater treatment process, the content of each metal ion needs to be obtained first, and then removed by chemical means according to its content (Zahmatkesh, et al., 2017; Molognoni et al., 2018). At present, zinc production company mainly rely on manual detection of metal ion concentration in the laboratory (Kočanová et al., 2017), which makes the information lag in the production process and lack of basis for optimization and adjustment (Chen et al., 2017; Chen et al., 2018). Therefore, modern analysis methods are urgently needed for the rapid determination of polymetallic ions in wastewater (Dong et al., 2018).
The effective metal ion detection methods include ultraviolet visible (UV-Vis) spectrophotometry, inductively coupled plasma mass spectrometry, liquid chromatography and polarography (He et al., 2016; Li et al., 2017). Considering the characteristics that the ion concentration of zinc industrial wastewater reaches the trace level and the industrial production parameters need to be corrected in time through rapid determination (Walash et al., 2009), this paper chooses ultraviolet-visible spectrophotometry as the metal ion detection method, mainly because the ultraviolet-visible spectrophotometry has the following advantages: 1) this method has high sensitivity (10−4–10−6/L), which is in line with the concentration of ions in zinc hydrometallurgy industrial wastewater (Zhou et al., 2009; Ji et al., 2012). 2) Because this method calculates the substance concentration by substance absorbance, it meets the requirements of nondestructive determination of metal ion solution (Liu et al., 2017). 3) The instrument has the advantages of simple structure, low maintenance cost and low repetition rate, and is suitable for on-line analysis (Attimarad 2012; Merás et al., 2002). However, due to the coexistence of multiple heavy metal ions in the same period in zinc smelting industrial wastewater, their chemical characteristics are similar, their mutual influence is serious (Rastogi et al., 2015), their absorption spectra overlap seriously (Lambert et al., 2017), and the full spectra information contains a lot of redundant non characteristic information (Fedenko et al., 2017), resulting in low accuracy and large prediction error of ultraviolet visible spectral analysis model (Lepane et al., 2015; Lee et al., 2017). Therefore, the traditional multivariate linear analysis method based on full band information modeling is difficult to accurately detect the concentration of polymetallic ions in zinc smelting wastewater (Rote and Bari, 2009; Khan et al., 2020).
At present, the commonly used wavelength variable selection methods mainly include: interval partial least squares method, Monte Carlo uninformative variable elimination method and competitive adaptive weighting method. However, in the case of serious spectral overlap, the first method rely on experience to define the size of the wavelength division and the number of combination intervals, and the screening process often results in multiple selections or omissions of the characteristic wavelength variables. The latter two methods separately sample and screen each wavelength, the screening process is complex, and the sampling process is random, which will lead to inaccurate calculation of variable stability index, thus affecting the screening results of characteristic wavelength variables. Therefore, this paper proposes an efficient and high-precision characteristic interval modeling method. This method aims to select the optimal characteristic points of each ion to be measured, reduce the blank information, solve the problems of serious spectral masking and the difference of inhibition degree, and improve the model detection accuracy.
Theory
The characteristic interval modeling method is a method for screening the characteristic wavelength variables with high contribution to the model to improve the accuracy of the model. This method performs overall and regional screening of the characteristic wavebands of each metal ion to be measured, avoids the instability of the random sampling process of a single wavelength, and reduces the complexity of the wavelength variable screening process. At the same time, through the evaluation index of local interval, the bands with serious spectral overlap of metal ions are effectively avoided, and the characteristic bands of metal ions are selected. The measurement indicators of characteristic interval variables are root mean squares error of cross validation (RMSECV) and correlation coefficient (R2), and the two calculation formulas are as follows:
In Eqs 1, 2,
(1) The global PLS model of Cu and Ni are established in the full spectral range, and the RMSECV and R2 values of Cu and Ni are calculated according to Eqs 1, 2 as the threshold of characteristic interval screening.
(2) Set P (5 < P < 15) cycles, divide the full spectra into P equal width sub intervals, establish the local PLS model of copper and nickel on each sub-interval, and calculate the RMSECV and R2 values of copper and nickel in P sub-interval.
(3) Compare the RMSECV and R2 values of the full spectral model and each local model, remove the wavelength interval in which RMSECV is greater than the global RMSECV and R2 is less than the global R2, and take out the remaining Q sub-interval with smaller RMSECV and larger R2 value.
(4) Combine t (1 ≤ t ≤ Q) intervals in the remaining Q sub-intervals for PLS modeling, and calculate the RMSECV and R2 values of all possible combination intervals.
(5) Similarly, taking the values of RMSECV and R2 as the evaluation criteria of each combination interval, the interval combination corresponding to the minimum RMSECV and the maximum R2 are selected as the optimal interval combination. The algorithm flow chart is shown in Figure 1.
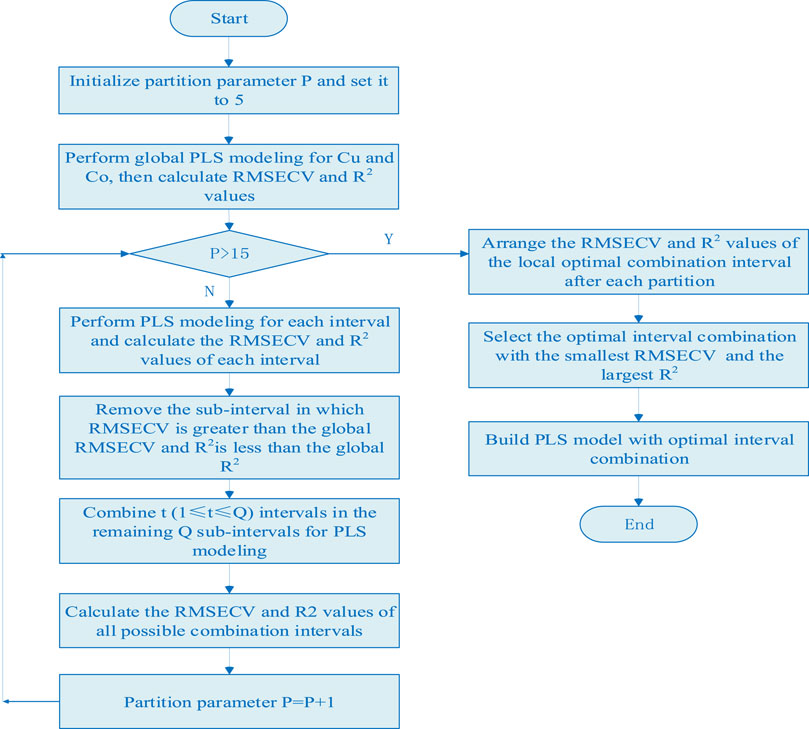
FIGURE 1. The flow chart of characteristic interval modeling method.
Experimental
Apparatus and Reagents
The absorbance spectra were measured by a Purkinje T9 dual beam spectrophotometer (Beijing Purkinje General Instrument Ltd., China). The T9 spectrophotometer is a high-sensitivity scientific grade UV-Vis spectrophotometer, equipped with a high-performance PMT receiver and a special grating, mixed C-T dual monochromator and dual beam, so it has a high dynamic range and good SNR. The hexadecyl trimethyl ammonium bromide was used as stabilizer solution, nitroso R salt solution (0.4%) was chosen as chromogenic reagent, acetic acid-sodium acetate buffer (pH = 5.5) was prepared as buffer solution, and standard stock solutions of copper (12.5 mg/L) and nickel (12.5 mg/L) were prepared.
Procedures
First, transfer the appropriate amount of copper and nickel standard solutions to a 25 ml volumetric flask. Then, add 2 ml nitroso R salt, 3 ml hexadecyl trimethyl ammonium bromide and 5 ml acetic acid-sodium acetate buffer. Finally, dilute and mix the solution with distilled water to ensure uniformity. The ultraviolet visible absorption spectra of the solution is measured with a reagent blank in the wavelength range of 350–600 nm. The prepared copper and nickel concentration ranges are both 0.3–3 mg/L 60 groups of copper and nickel mixed solutions in different proportions were prepared for spectral modeling analysis.
Results and Discussion
Spectral Characteristics
The spectral signal of copper and nickel single ion solution and the mixed solution are shown in Figure 2, where the copper concentration is 1.2 mg/L, the nickel concentration is 1.2 mg/L, and the wavelength detection range is 350–600 nm.
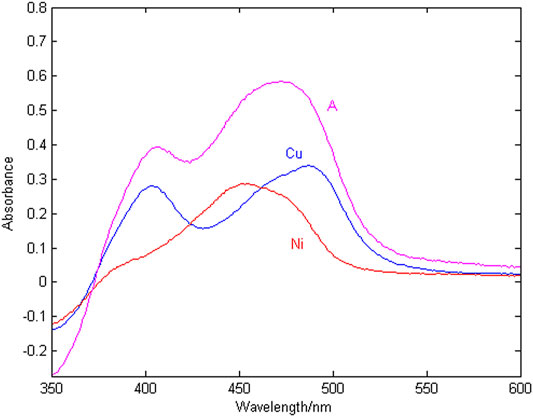
FIGURE 2. Absorption spectra of Cu, Ni and their mixture (A).
According to Figure 2, at the same concentration of 1.2 mg/L, the sensitivity of copper is higher than that of nickel. The peak of copper is at 405 and 488 nm, the peak of nickel is at 452 nm, copper and nickel overlap severely in the entire wavelength range. The reason is that copper and nickel ions are close neighbors in the periodic table, and their electrochemical characteristics are very similar, which makes the detection spectral signals overlap seriously, resulting in low spectral signal resolution and few characteristic wavelength variables. It is difficult to simultaneously detect the concentration of copper and nickel in zinc wastewater solution. Therefore, it is very important to select the characteristic wavelength to improve the resolution of copper and nickel absorption spectra.
Univariate Calibration
Figure 3 shows a group of absorption spectra of Cu in zinc wastewater solution, in which the concentration range of Cu is 0.3–3 mg/L. Figure 4 shows a group of absorption spectra of Ni in zinc wastewater solution, in which the concentration range of Ni is 0.3–3 mg/L.
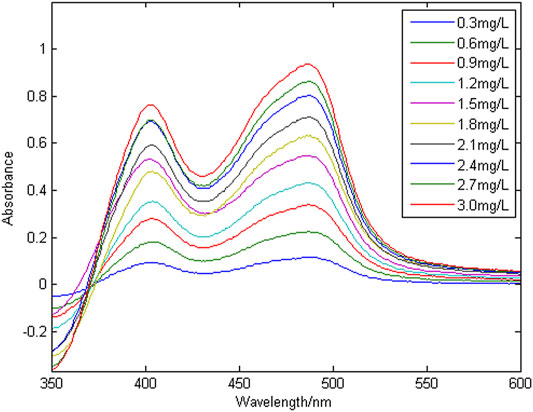
FIGURE 3. A group of absorption spectral signals of copper.
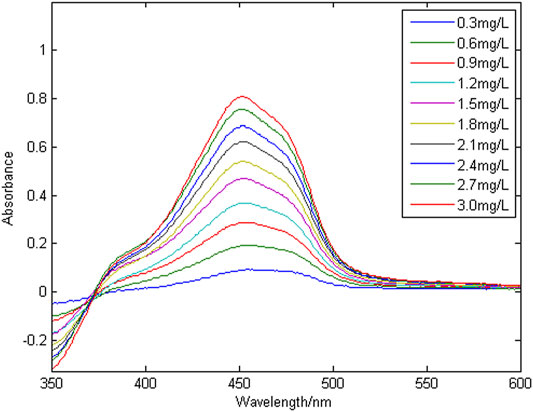
FIGURE 4. A group of absorption spectral signals of nickel.
To evaluate the linearity of copper and nickel in the zinc wastewater solution, multiple wavelengths were randomly selected to perform linear fitting of absorbance and concentration. The linear regression equation and correlation coefficient (R2) are shown in Table 1.
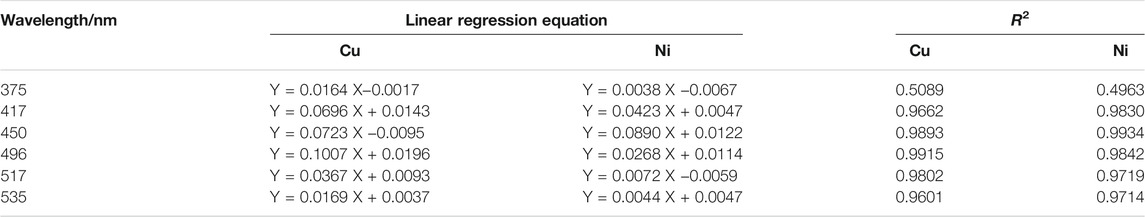
TABLE 1. The linearity evaluation index of copper and nickel.
The correlation coefficient (R2) is used to characterize the linear correlation of ions. The larger the value of R2, the better the linearity. It can be seen from Table 1 that copper ion have no linearity at wavelengths of 375 nm. They are generally linear at 417 and 535 nm, and have good linearity at 450, 496 and 517 nm. The nickel ion has a small correlation coefficient (R2) at wavelengths of 375 nm, so the linearity is very poor; it has good linearity at 417, 450 and 496 nm. Because the effective information of copper and nickel at different wavelength points is different, when modeling and detecting the concentration of copper and nickel by the partial least squares method, it is necessary to select the characteristic wavelength variables, and select the wavelength variables with high spectral signal sensitivity, large amount of information and strong linear correlation, so as to improve the accuracy of simultaneous detection of copper and nickel.
Characteristic Interval Wavelength Selection
According to the steps of characteristic interval wavelength selection method described in section 2, the 30 sets of correction sets are modeled for the full-band wavelength variables of 350–600 nm, and the global RMSECV and R2 values of copper are 0.9851 and 0.0674, and the global RMSECV and R2 values of nickel are 0.9836 and 0.0712, which are used as the threshold for the subsequent screening of the characteristic interval. The whole band is divided into P sub intervals, PLS modeling is carried out respectively, and the RMSECV and R2 values of P sub intervals are obtained. All sub intervals greater than RMSECV threshold and less than R2 threshold are eliminated, and t (1 < t < Q) characteristic intervals are combined in turn in the remaining Q sub intervals to establish a joint interval PLS model. The combined modeling of the optimal characteristic intervals of copper and nickel after each interval division is shown in Table 2.
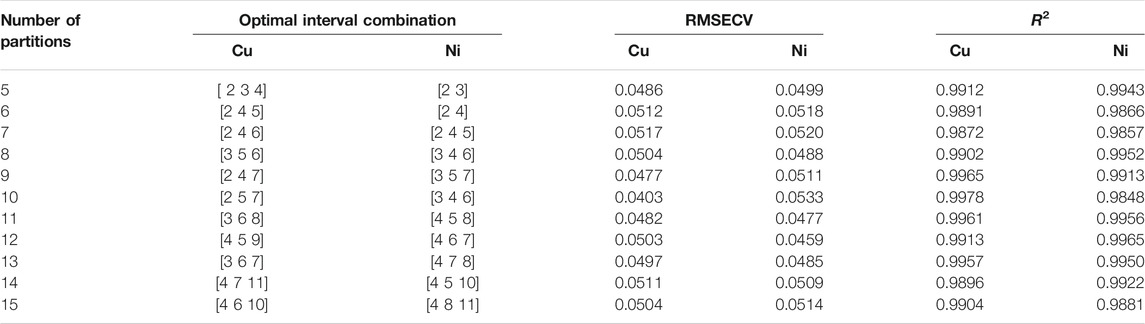
TABLE 2. The optimal interval combination of copper and nickel after each interval division.
It can be seen from Table 2 that the optimal characteristic interval combination of copper is to divide the whole band into 10 intervals, and when the second, fifth and seventh intervals are combined in sequence, the minimum value of RMSECV is 0.0403 and the maximum value of R2 is 0.9978. The optimal feature interval combination of nickel is to divide the whole band into 12 intervals, and when the fourth, sixth and seventh intervals are combined in sequence, the minimum value of RMSECV is 0.0459 and the maximum value of R2 is 0.9965. The results of the combined wavelength screening of characteristic intervals are shown in Figures 5, 6. The wavelength ranges corresponding to the optimal characteristic intervals of copper are 375–400 nm, 450–475 nm, and 500–525 nm. The wavelength range corresponding to the optimal characteristic intervals of nickel is 410–430 nm, 450–470 nm, and 470–490 nm.
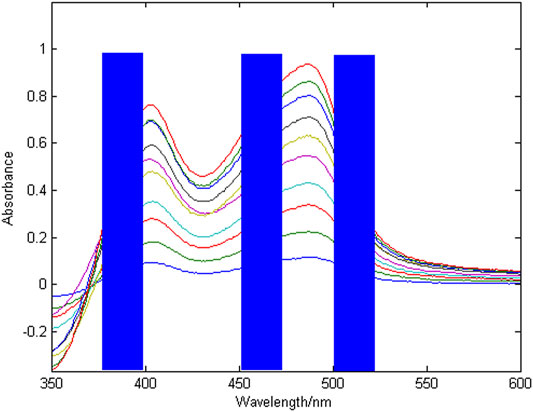
FIGURE 5. Combined wavelength screening results for copper characteristic intervals.
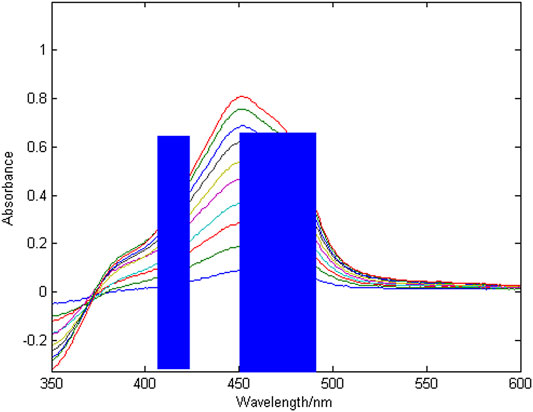
FIGURE 6. Combined wavelength screening results for nickel characteristic intervals.
Performance Comparison of Different Algorithms
The proposed characteristic interval modeling method (CIM) is used to detect the concentration of copper and nickel mixed solutions in 30 groups of prediction sets, and the performance is compared with full band partial least squares method (FBPLS), competitive adaptive weighting method (CARS) and Monte Carlo uninformative variable elimination method (MC_UVE). Table 3 shows the modeling comparison of four feature extraction methods. Using the calibration model by CIM, the predicted and actual values of Cu and Ni in mixture solution are shown in Figure 7.
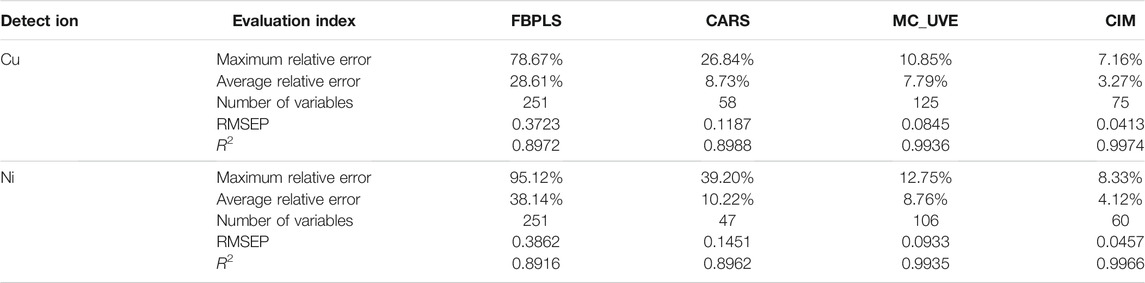
TABLE 3. The modeling comparison of four feature extraction methods.
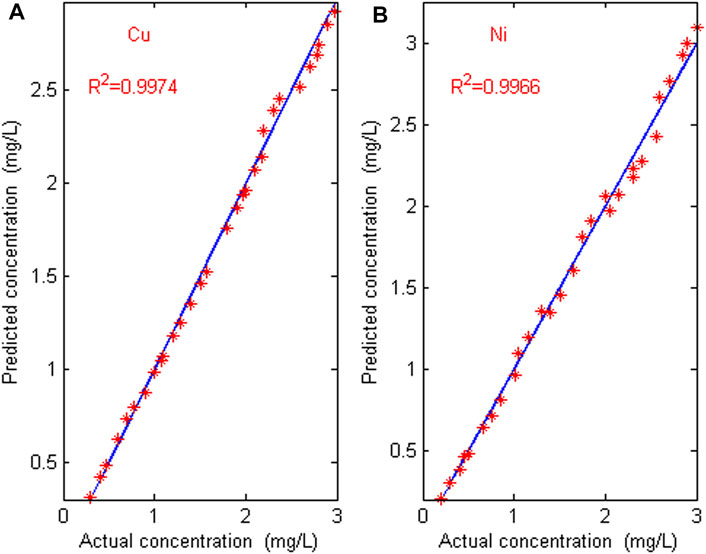
FIGURE 7. Error graph between predicted value and actual value. (A) The error graph of Cu; (B) the error graph of Ni.
It can be seen from Table 3 that there are a large number of blank, overlapping and suppressed wavelengths in the full band wavelength, which interfere with the accurate and efficient modeling of ions, so the accuracy is very low and the real-time performance is poor. The CARS method selects fewer wavelengths, which is not ideal for measuring copper and nickel in zinc wastewater solution. The MC_UVE method still retains many redundant wavelength points when selecting variables, which makes the accuracy of the model worse. The proposed characteristic interval modeling method selects the region with higher sensitivity and reduces the masking and suppression differences of other ions to be measured. The predicted root mean square error (RMSEP) is lower, and the correlation coefficients (R2) is higher. The average relative errors of Cu and Ni in the 30 validation sets are 3.27% and 4.12%. The maximum error of Cu is 7.16%, and the maximum error of Ni is 8.33%. The relative error is within 5%, which meets the requirements of industrial detection. As can be seen from Figure 7 that the predicted value is almost consistent with the actual value. The predicted root mean square errors (RMSEP) for Cu and Ni are 0.0413 and 0.0457, and the correlation coefficients (R2) of Cu and Ni are 0.9974 and 0.9966, respectively. The results indicate that the proposed characteristic interval modeling method can effectively realize the simultaneous detection of copper and nickel in zinc industrial wastewater.
Conclusion
A variety of heavy metal ions coexist in zinc industrial wastewater. Their chemical properties are similar, their mutual influence is serious, and their absorption spectra overlap severely. The full spectra information contains a lot of redundant non-characteristic information, which leads to low accuracy of analysis models and large prediction errors. Therefore, the traditional multi-variable linear analysis method of modeling the full-band information is difficult to achieve accurate detection of polymetallic ions in zinc smelting wastewater. Aiming at the problems of low accuracy and large prediction errors caused by the serious overlap of multi-metal spectral signals in zinc smelting industrial wastewater, a characteristic interval modeling method is proposed. This method screens wavelength variables in a coordinated and partitioned manner, avoids overlapping serious bands, ensures the stability of the screening process, reduces the complexity of wavelength screening, and improves the accuracy of the model. The proposed method is successfully used to analyze the severely overlapping spectra of Cu and Ni. The results show that the characteristic interval modeling method has obvious advantages in the separation of overlapping spectra compared with other methods. The proposed method lays a solid foundation for the accurate analysis of polymetallic ions in zinc smelting industrial wastewater.
Data Availability Statement
The raw data supporting the conclusion of this article will be made available by the authors, without undue reservation.
Author Contributions
F-BZ conducted experiments and drafted the original manuscript. Research conception was initiated by H-QZ along with gaining funding, writing, reviewing, and editing. C-GL and H-QZ contributed to writing and reviewing. All authors contributed to the article and approved the submitted version.
Funding
This work was supported in part by the key Project for International Cooperation and Exchange of the National Natural Science Foundation of China under Grant 61860206014, in part by Research Foundation of Hunan Provincial Education Department under Grant 19B518, and in part by Project of Shaoyang Science and Technology Bureau (No. 2019ZD24).
Conflict of Interest
The authors declare that the research was conducted in the absence of any commercial or financial relationships that could be construed as a potential conflict of interest.
Publisher’s Note
All claims expressed in this article are solely those of the authors and do not necessarily represent those of their affiliated organizations, or those of the publisher, the editors and the reviewers. Any product that may be evaluated in this article, or claim that may be made by its manufacturer, is not guaranteed or endorsed by the publisher.
References
Attimarad, M. (2012). Simultaneous Determination of Ofloxacin and Flavoxate Hydrochloride by First-And Ratio First-Derivative UV Spectrophotometry. J. Iran Chem. Soc. 9, 551–557. doi:10.1007/s13738-012-0068-5
Chen, Y.-F., Li, Z.-X., Zhou, Z.-W., Xia, Q.-L., Nie, Y.-Z., and Guo, G.-H. (2018). Nonlinear Gyrotropic Motion of Skyrmion in a Magnetic Nanodisk. J. Magnetism Magn. Mater. 458, 123–128. doi:10.1016/j.jmmm.2018.03.016
Chen, Z., Li, H., He, Z., Xu, H., Zheng, M., and Zhao, M. (2017). Multiple Plasmon-Induced Transparency Effects in a Multimode-Cavity-Coupled Metal-Dielectric-Metal Waveguide. Appl. Phys. Express 10, 092201. doi:10.7567/apex.10.092201
Dong, L., Xu, X., Li, C., Guo, Y., Sun, K., and Ding, Y. (2018). Plasmon-induced Transparency in Sensing Application with Semicircle Cavity Waveguide. Opt. Commun. 410, 751–755. doi:10.1016/j.optcom.2017.11.048
Fedenko, V. S., Shemet, S. A., and Landi, M. (2017). UV-vis Spectroscopy and Colorimetric Models for Detecting Anthocyanin-Metal Complexes in Plants: An Overview of In Vitro and In Vivo Techniques. J. Plant Physiol. 212, 13–28. doi:10.1016/j.jplph.2017.02.001
He, Z., Li, H., Li, B., Chen, Z., Xu, H., and Zheng, M. (2016). Theoretical Analysis of Ultrahigh Figure of merit Sensing in Plasmonic Waveguides with a Multimode Stub. Opt. Lett. 41, 5206–5209. doi:10.1364/OL.41.005206
Ji, H., Xu, Y., Li, S., Xin, H., and Cao, H. (2012). Simultaneous Determination of Iron and Manganese in Water Using Artificial Neural Network Catalytic Spectrophotometric Method. J. Ocean Univ. China 11, 323–330. doi:10.1007/s11802-012-1826-9
Khan, S. A., Ialyshev, V., Kim, V. V., Iqbal, M., Al Harmi, H., Boltaev, G. S., et al. (2020). Expedited Transition in the Wettability Response of Metal Meshes Structured by Femtosecond Laser Pulses for Oil-Water Separation. Front. Chem. 8, 768. doi:10.3389/fchem.2020.00768
Kočanová, V., Cuhorka, J., Dušek, L., and Mikulášek, P. (2017). 'Application of Nanofiltration for Removal of Zinc from Industrial Wastewater. Desalination Water Treat. 75, 342–347. doi:10.1016/j.saa.2019.117370
Lambert, A., Asokan, M., Issac, G., Love, C., and Chyan, O. (2017). Thin-film UV-Vis Spectroscopy as a Chemically-Sensitive Monitoring Tool for Copper Etching bath. J. Ind. Eng. Chem. 51, 44–48. doi:10.1016/j.jiec.2017.03.004
Lee, J.-Y., Oh, J. Y., Putri, K. Y., Baik, M. H., and Yun, J.-I. (2017). Redox Behaviors of Fe(II/III) and U(IV/VI) Studied in Synthetic Water and KURT Groundwater by Potentiometry and Spectroscopy. J. Radioanal. Nucl. Chem. 312, 221–231. doi:10.1007/s10967-017-523310.1007/s10967-017-5233-y
Lepane, V., Depret, L., Väli, A.-L., and Suursööt, K. (2015). Impact of Seasonal Climate Change on Optical and Molecular Properties of River Water Dissolved Organic Matter by HPLC-SEC and UV-Vis Spectroscopy. Chem. Biol. Technol. Agric. 2. doi:10.1186/s40538-015-0040-6
Li, B., Wang, X., Wei, Y., Wang, H., and Barati, M. (2018). Extraction of Copper from Copper and Cadmium Residues of Zinc Hydrometallurgy by Oxidation Acid Leaching and Cyclone Electrowinning. Minerals Eng. 128, 247–253. doi:10.1016/j.mineng.2018.09.007
Li, Z.-x., Chen, Y.-f., Zhou, Z.-w., Nie, Y.-z., Xia, Q.-l., Wang, D.-w., et al. (2017). Creation of Skyrmion through Resonance Excitation. J. Magnetism Magn. Mater. 433, 216–221. doi:10.1016/j.jmmm.2017.03.019
Liu, P., NieNie, Y.-z., Xia, Q.-l., and Guo, G.-h. (2017). Structural and Electronic Properties of Arsenic Nitrogen Monolayer. Phys. Lett. A 381, 1102–1106. doi:10.1016/j.optcom.2017.09.04610.1016/j.physleta.2017.01.026
Luo, J., Duan, N., Xu, F., Jiang, L., Zhang, C., and Ye, W. (2019). System-level Analysis of the Generation and Distribution for Pb, Cu, and Ag in the Process Network of Zinc Hydrometallurgy: Implications for Sustainability. J. Clean. Prod. 234, 755–766. doi:10.1016/j.jclepro.2019.06.250
Merás, I. D., Espinosa Mansilla, A., Salinas López, F., and Rodríguez Gómez, M. (2002). Comparison of UV Derivative-Spectrophotometry and Partial Least-Squares (PLS-1) Calibration for Determination of Methotrexate and Leucovorin in Biological Fluids. Anal. Bioanal. Chem. 373, 251–258. doi:10.1007/s00216-002-1348-1
Molognoni, D., Chiarolla, S., Cecconet, D., Callegari, A., and Capodaglio, A. G. (2018). Industrial Wastewater Treatment with a Bioelectrochemical Process: Assessment of Depuration Efficiency and Energy Production. Water Sci. Technol. A J. Int. Assoc. Water Pollut. Res. 77, 134–144. doi:10.1007/s10812-009-9224-910.2166/wst.2017.532
Rastogi, S. D., Dixit, S., Tripathi, A., and Das, M. (2015). Simultaneous Determination of Acetaminophen and Synthetic Color(s) by Derivative Spectroscopy in Syrup Formulations and Validation by HPLC: Exposure Risk of Colors to Children. AAPS PharmSciTech 16, 505–517. doi:10.1208/s12249-014-0228-2
Rote, A. R., and Bari, P. D. (2009). Ratio Spectra Derivative and Zero-Crossing Difference Spectrophotometric Determination of Olmesartan Medoxomil and Hydrochlorothiazide in Combined Pharmaceutical Dosage Form. AAPS PharmSciTech 10, 1200–1205. doi:10.1208/s12249-009-9318-y
Walash, M. I., El-Brashy, A., El-Enany, N., and Kamel, M. E. (2009). Second-Derivative Synchronous Fluorescence Spectroscopy for the Simultaneous Determination of Fluphenazine Hydrochloride and Nortriptyline Hydrochloride in Pharmaceutical Preparations. J. Fluoresc 19, 891–904. doi:10.1007/s10895-009-0488-5
Yadav, D., and Banerjee, R. (2018). A Comparative Life Cycle Energy and Carbon Emission Analysis of the Solar Carbothermal and Hydrometallurgy Routes for Zinc Production. Appl. Energ. 229, 577–602. doi:10.1007/s00216-006-086110.1016/j.apenergy.2018.08.001
Zahmatkesh, M., Spanjers, H., and van Lier, J. B. (2017). Fungal Treatment of Humic-Rich Industrial Wastewater: Application of white Rot Fungi in Remediation of Food-Processing Wastewater. Environ. Technol. 38, 2752–2762. doi:10.1016/j.ijms.2017.01.00610.1080/09593330.2016.1276969
Zhang, F., Yang, C., Zhou, X., and Zhu, H. (2018). Fractional Order Fuzzy PID Optimal Control in Copper Removal Process of Zinc Hydrometallurgy. Hydrometallurgy 178, 60–76. doi:10.1016/j.hydromet.2018.03.021
Zhou, F., Li, C., Zhu, H., and Li, Y. (2019). Determination of Trace Ions of Cobalt and Copper by UV-Vis Spectrometry in Purification Process of Zinc Hydrometallurgy. Optik 184, 227–233. doi:10.1016/j.ijleo.2019.03.056
Keywords: zinc smelting wastewater, partial least squares, ultraviolet visible spectrophotometry, characteristic interval modeling, multiple metal ions
Citation: Zhou F-, Li C- and Zhu H- (2022) A Characteristic Interval Modeling Method for Simultaneous Detection of Multiple Metal Ions. Front. Chem. 10:839633. doi: 10.3389/fchem.2022.839633
Received: 20 December 2021; Accepted: 19 January 2022;
Published: 10 February 2022.
Edited by:
Przemyslaw B. Kowalczuk, Norwegian University of Science and Technology, NorwayReviewed by:
Qifeng Li, Tianjin University, ChinaGuocai Tian, Kunming University of Science and Technology, China
Copyright © 2022 Zhou, Li and Zhu. This is an open-access article distributed under the terms of the Creative Commons Attribution License (CC BY). The use, distribution or reproduction in other forums is permitted, provided the original author(s) and the copyright owner(s) are credited and that the original publication in this journal is cited, in accordance with accepted academic practice. No use, distribution or reproduction is permitted which does not comply with these terms.
*Correspondence: Feng-Bo Zhou, ZmJ6aG91NTAxOEAxMjYuY29t; Chang-Geng Li, bGNnZW5nQGNzdS5lZHUuY24=