 Jiaqi Lang1
 Wenting Wang
 Rujie Shi
 Nong Zhou
- 1The Chongqing Engineering Laboratory for Green Cultivation and Deep Processing of Three Gorges Reservoir Area’s Medicinal Herbs, College of Food and Biology Engineering, Chongqing Three Gorges University, Chongqing, China
- 2Wanzhou Institute for Food and Drug Control, Chongqing, China
The electrochemical behavior and direct quantitative determination of paclitaxel, a poorly soluble drug made into microemulsion, were researched by cyclic voltammetry in acetate buffer solutions (pH = 4.0) at a glassy carbon electrode. The results show that the oxidation process is irreversible and controlled by diffusion. Moreover, the effects of anodic peak current (Ipa), anodic peak potential, scan rate, pH, and the electrochemical redox mechanism have been studied. The anodic peak current varied linearly with paclitaxel concentration in the range of 5 × 10⁻⁵ mol/L to 5 × 10⁻⁴ mol/L, and the detection limit was 9.15 × 10⁻⁸ mol/L. The results of RSD (0.90%) and recovery (99.22%–101.69%) were obtained. Additionally, it has been proved that one electron and one proton are involved in the electrochemical redox process. The present research has been successfully used to determine paclitaxel in pure and real samples, which further supported the electrochemical behavior investigation of paclitaxel and direct determination of micro-emulsion.
1 Introduction
Paclitaxel (PAC; Taxus brevifolia, family Taxaceae, molecular structure given in Figure 1) is found and isolated from the bark of Pacific yew by Dr. Wall, Wani et al. for the first time. Paclitaxel (Wani et al., 1971; Ebrahim et al., 2014), a class of tricyclic diterpenoids, is an effective anticancer agent. In the process of cell mitosis, it can prevent the depolymerization of microtubules, thereby inhibiting cell division and proliferation and achieving the effect of killing tumor cells (Zhang et al., 2012). PAC has significant effects on the treatment of metastatic breast cancer, non-small cell lung cancer, ovarian cancer, and head and neck cancer, among others (Spencer and Faulds, 1994; Singla et al., 2002; Yardley, 2013). Nonetheless, PAC is almost insoluble in water or other clinical solvents, limiting its application and development. Correspondingly, in order to increase its solubility, various formulation strategies have been researched and developed, including microemulsion (Fan et al., 2004), nanoparticles (Hawkins et al., 2008), polymer micelles (Ebrahim et al., 2014), cyclodextrin inclusions and compounds (Sharma et al., 1995), and liposomes (Wu et al., 2006).
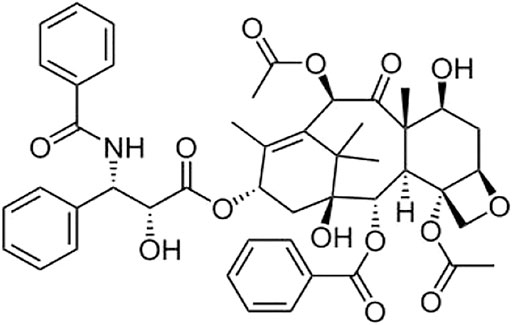
FIGURE 1. Molecular structure of PAC.
Furthermore, the microemulsion is a transparent, low-viscosity, isotropic, and thermodynamically stable oil-water mixture formed spontaneously by the water phase, oil phase, and surfactant. Due to the nano-level aggregation of the microemulsion, it has the advantages of good stability, good biocompatibility, and high solubility (Shinoda and Lindman, 1987; Sjöblom et al., 1996; Lawrence and Rees, 2000; Ganguli et al., 2010), it has become increasingly important in application areas such as pharmaceutical research and development, biotechnology, daily chemical industry, and chemical reactions, especially for containing functional additives such as drugs, polymers, and nanoparticles (Magdassi, 1997; Lawrence and Rees, 2001; Acharya and Hartley, 2012).
The commonly used clinical paclitaxel injection (trade name: Taxol) is a kind of microemulsion, which is mainly solubilized with polyoxyethylene castor oil (Cremophor EL) anhydrous ethanol (V:V = 50:50).
At present, there are a large number of methods to quantify PAC, including HPLC, HPLC-MS, and UPLC-MS (Bonde et al., 2019; Christner et al., 2019; Attia et al., 2020), which take a long time and cost a lot. On the contrary, there are very few reports on the quantization of paclitaxel by electrochemical methods (Gowda and Nandibewoor, 2014). Therefore, it is urgent to improve and develop a more rapid and efficient electrochemical analysis method for the quantitative study of paclitaxel.
In general, this study aims to establish a simple, efficient, fast, and low-concentration method for detecting paclitaxel by cyclic voltammetry at the surface of glassy carbon electrode (GCE) and further investigate the electrochemical behavior and redox mechanism of paclitaxel micro-emulsion. Specifically, the experimental parameters such as supporting electrolyte and its concentration, the effects of anodic peak current (Ipa), anodic peak potential, scan rate, and pH were optimized. Meanwhile, the electrochemical mechanism, including the amount of electron transfer reaction, is studied. The obtained results can provide certain theoretical and practical application value for the electrochemical behavior research and rapid content determination of insoluble drugs.
2 Materials and Methods
2.1 Materials and Reagents
Paclitaxel was purchased from Taihao Pharmaceutical Co., Ltd (Chongqing, China). Paclitaxel injection (Taxol), a clear and colorless solution, was purchased from Bristol-Myers Squibb, United States (30 mg in 5 ml). Other reagents and materials were provided by Chengdu Kelon Chemical Reagent Co., Ltd. (Sichuan, China) and were of analytical reagent (AR) grade. All solutions are prepared in ultrapure water.
2.2 Apparatus
CHI610E electrochemical workstation (Shanghai, China) is used for electrochemical measurement. The electrode system consists of three parts, the working electrode is a glassy carbon electrode (3 mm in diameter), the counter electrode is a platinum electrode, and the reference electrode is a saturated calomel electrode. In order to improve the reproducibility and sensitivity of the peak current, the electrode was cleaned five times in ethanol using cyclic voltammetry before each measurement.
2.3 Procedure
2.3.1 Sample Preparation
A standard stock solution (1.0 mmol/L) of PAC was prepared in methanol. Accurately measure 1.4 ml of Taxol and dilute to 100 ml with methanol as a sample stock solution (1.0 mmol/L) and store in a cool place. The test solution used for the electrochemical experiment consisted of 2 ml supporting electrolyte and 2 ml stock solution. In addition, the test solution was deoxygenated by purging with nitrogen for 5 min before the measurement.
2.3.2 Voltammetry Parameters
All electrochemical experiments were performed at 25 ± 0.1°C. The parameters of cyclic voltammetry are the initial potential E, which is −1.5 V; the low initial potential E is 0.5 V; the sensitivity is 0.01 mA/V; the standing time is 2 s; and the scan rate is 50 mV/s.
2.4 Area of Electrode
The area of the glassy carbon electrode was obtained by cyclic voltammetry using 1 mM K3Fe(CN)6 as a probe at different scan rates. For a reversible process, the following Randles–Sevcik formula can be used (Goyal and Bishnoi, 2011):
where F = 96,485 C/moL, R = 8.314 J/mol K, T is the absolute temperature (298 K), A is the surface area of the electrode (cm2), Ipa refers to the anodic peak current (Ampere), and n is the number of electrons transferred. For 1 mM K3Fe(CN)6 in 0.1 M KCl electrolyte, DR = 7.6 × 10⁻⁶ cm2 s−1, n = 1, C0 is the concentration of K3Fe(CN)6 (mol/L) and v is scan rate (V/s), respectively. The surface area was calculated from the slopes of the plot of the Ipa vs. v1/2, and the area of the glassy carbon electrode was calculated to be 0.0548 cm2.
3 Results
3.1 Selection of Supporting Electrolyte
The electrochemical detection sample peak is obviously affected by the electrolyte. Therefore, the electrolyte was screened for test conditions using 5.0 mol/L acetate buffer (pH 4.0), B-R buffer solution (pH 4.0), 0.1 mol/L NaOH, citric acid-sodium citrate (pH 4.0), 0.5 mol/L KCl, 0.1 mol/L HCl, 0.5 mol/L phosphate buffer solution, and 0.1 mol/L H2SO4. The test solution used for the electrochemical experiment consisted of 2 ml supporting electrolyte and 2 ml stock solution. It was found that the voltammetry peak obtained with pH 4.0 5 M acetate buffer was the best. This composition of the solution is necessary because acetic acid has a relatively low dielectric constant (ε = 6.15 at 25°C), which causes a slight dissociation of the electrolyte and further reduces the ohmic potential significantly (Michalkiewicz, 2011).
3.2 Cyclic Voltammetric Studies of Paclitaxel
In the absence and presence of paclitaxel, the cyclic voltammogram of the electrochemical behavior recorded on the GCE, in which the electrolyte is 5.0 mol/L acetate buffer (pH 4.0) and the scanning speed is 50 mv/s, is shown in Figure 2. The experimental results show that, in the absence of paclitaxel, the electrode reaction cannot occur within the potential range of 0.5 V to −1.5 V. After adding paclitaxel stock solution to the solution, only one obvious irreversible anode peak appeared in the potential range from −0.6 to −0.8 V, indicating that an oxidation reaction occurred and the oxidation product no longer had electrical activity. However, the oxidation process is irreversible because no peaks are observed during the reverse scan.
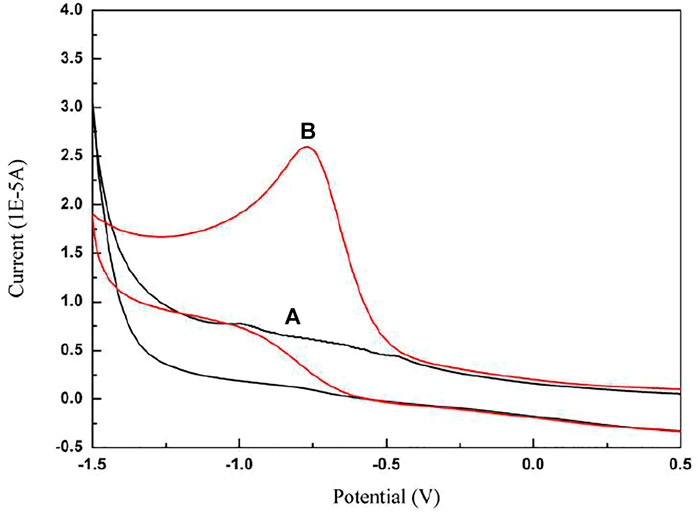
FIGURE 2. Cyclic voltammograms of (A) 5.0 mol/L acetate buffer (pH 4.0) in the absence of paclitaxel, (B) 5.0 mol/L acetate buffer (pH 4.0) in the presence of paclitaxel (5 × 10⁻⁴ mol/L) at GCE; scan rate is 50 mV/s.
3.3 Effect of pH
While the pH value of the supporting electrolyte is greater than 4.0, the mixed solution of paclitaxel microemulsion and supporting electrolyte is turbid, possibly because the increasing pH destroys the formation of the microemulsion and demulsification occurs. The effect of pH on the cyclic voltammogram of paclitaxel is shown in Figure 3.
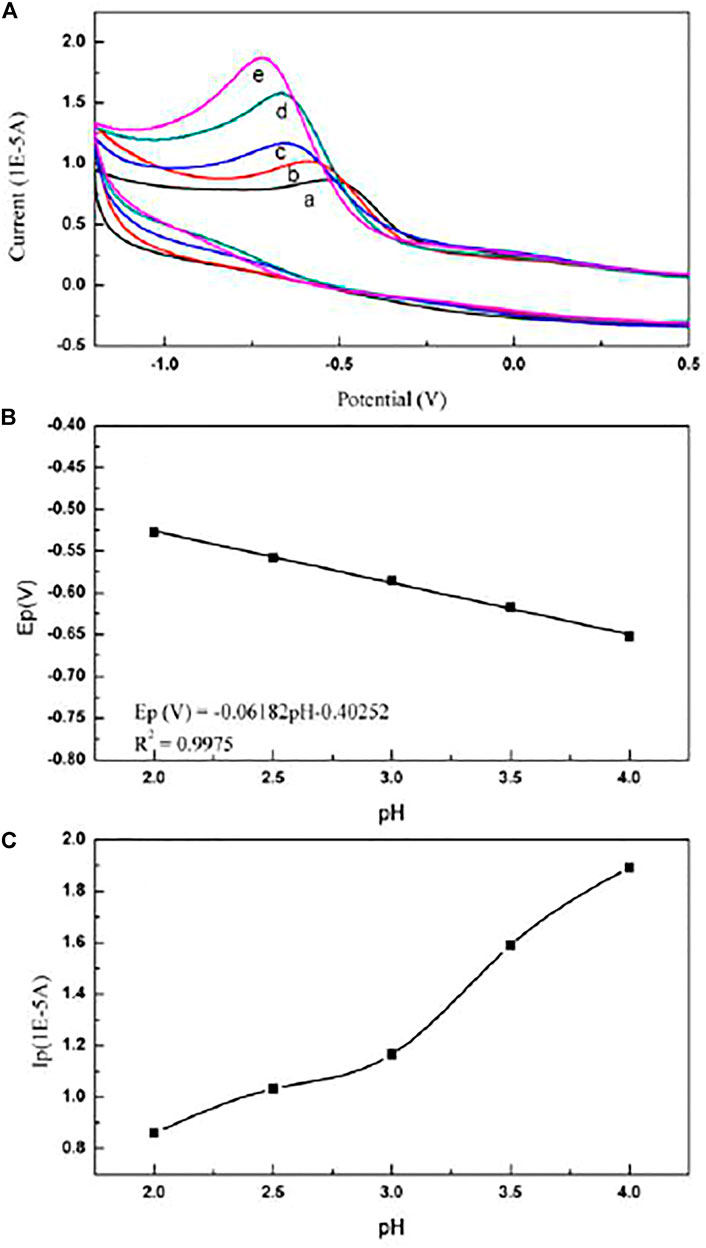
FIGURE 3. (A) Cyclic voltammogram of paclitaxel in electrolytes with different pH: (a) pH = 2.0; (b) pH = 2.5; (c) pH = 3.0; (d) pH = 3.5; (e) pH = 4.0. (B) Dependence of pH on the potential Ep (V) of paclitaxel. Scan rate is 50 mV/s. The concentration of paclitaxel is 1 × 10⁻⁵ mol/L. (C) Dependence of pH on the current Ip (V) of paclitaxel. Scan rate is 50 mV/s. The concentration of paclitaxel is 1 × 10⁻⁵ mol/L.
Figure 3A and Zhang et al. (2012) showed that, in the pH range from 2.0 to 4.0, as the pH value of the supporting electrolyte increases, the peak potential of the oxidation peak shifts to a negative potential. At the same time, the linear relationship between the peak potential of paclitaxel and the pH of the supporting electrolyte is as follows:
The slope of this equation is 61.82 mV/pH, which is close to the expected theoretical value of 59 mV/pH (Cisternas et al., 2015), further indicating that the number of protons and electrons involved in the reaction is equal.
On the contrary, it can be seen from Figure 3C that when the pH range is from 2.0 to 4.0, the peak current value of the cyclic voltammogram increases with the increase in pH. Therefore, an electrolyte of pH 4.0 was selected for further testing.
3.4 Effect of Scan Rate
The electrochemical oxidation-reduction reaction mechanism can be obtained from the relationship between the scan rate and the cyclic voltammogram. In the range of the scanning speed of 0.025 V/s to 0.35 V/s, the relationship between the electrochemical peak and the scanning speed is shown in Figure 4. Figure 4B shows that the scan rate and peak current form a good linear relationship, described as follows:
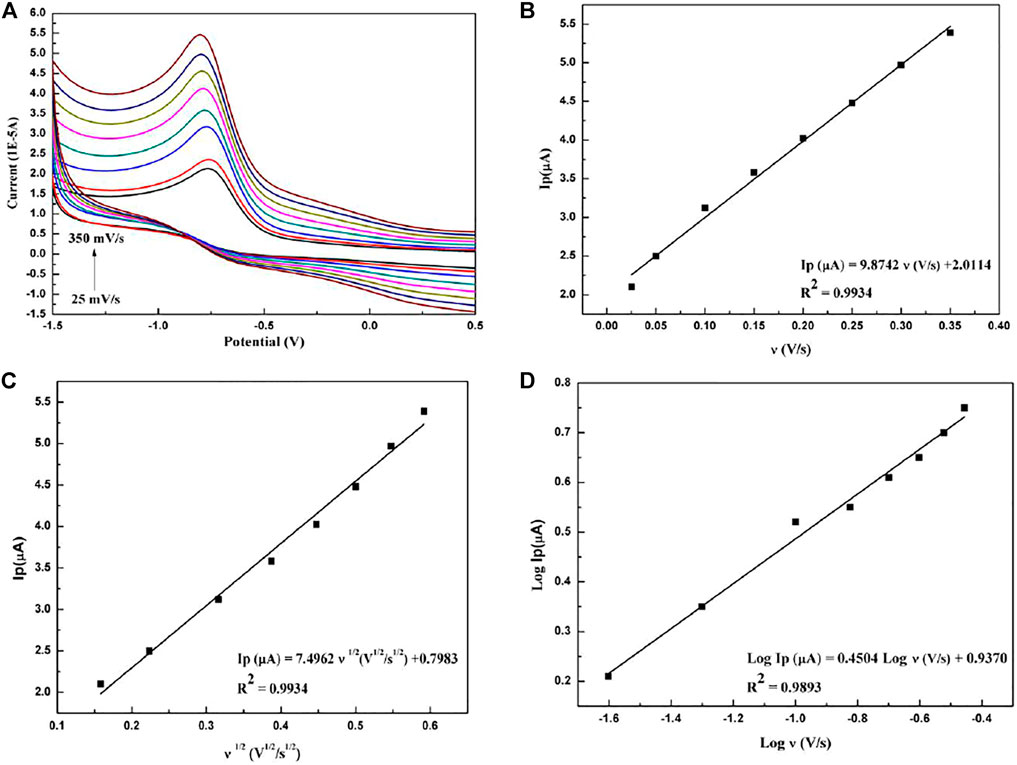
FIGURE 4. (A) Cyclic voltammograms of paclitaxel (1 × 10⁻⁵ mol/L) with different scan rates: 0.025, 0.05, 0.10, 0.15, 0.20, 0.25, 0.30, and 0.35 V/s. (B) Dependence of peak current on scan rate. (C) Dependence of peak current on the square root of scan rate. (D) The linear relationship between the logarithm of peak current and logarithm of scan rate.
It shows that the oxidation reaction of paclitaxel is controlled by adsorption (Wu et al., 2016). Meanwhile, the relationship between the square root of the scanning speed and the peak current, which is shown in Figure 4C, is as follows:
The square root of the scanning speed and the peak current form a good linear relationship, indicating that the reaction is also a typical diffusion control process (Prashanth et al., 2011). In addition, Figure 4D shows that the logarithm of the peak current has a good linear relationship with the logarithm of the scan rate and satisfies the following equation:
The correlation slope is 0.45, close to the theoretical value of 0.5, further indicating that the oxidation reaction has a diffusion process (Chrzescijanska et al., 2014).
Figure 5 shows the relationship between the peak potential of paclitaxel and the logarithm of the scan rate. The linear relationship is as follows:
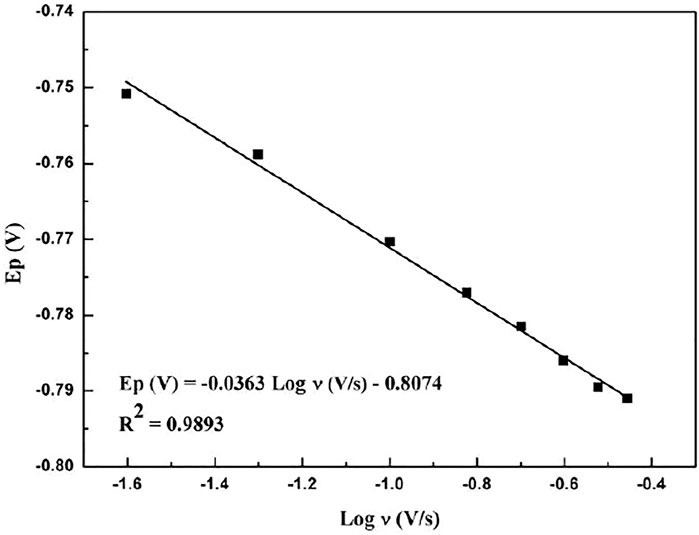
FIGURE 5. Linear relationship with redox peak potential and logarithm of scan rate.
It can be seen that, as the scanning speed increases, the peak potential becomes more negative, indicating that the electrochemical reaction is a standard irreversible process (Chrzescijanska et al., 2014; Wu et al., 2016).
For irreversible electrochemical reactions, Ep can be obtained by the following formula (Chrzescijanska et al., 2014):
where n is the total number of electrons transferred, α is the electron transfer coefficient, R = 8.314 J/K mol, F = 96,480 C/mol, and T = 298 K. From the slope of Ep and log ν (−0.0363), the value of αn can be calculated as 1.627 and α can be obtained by the following formula (Bard and Faulkner, 2004):
where Ep/2 (mV) is the potential where the current is at half the peak value. α was calculated to be 0.892, so n was approximately calculated to be 2, indicating that one electron was involved in the electrochemical process of paclitaxel. The apparent heterogeneous electron transfer rate constant κs can be obtained according to the following equation (Laviron, 1979):
where νc is the selected speed rate, which is 0.05 V/s, and κs is final calculated to be 3.17 s−1.
3.5 Mechanism
Previous studies have proved that the electrochemical reaction of paclitaxel involves the transfer of two electrons and two protons, which may be due to the oxidation of the C-7 hydroxyl group of paclitaxel to a carbonyl group. The mechanism is shown in Figure 6. The experimental conclusions are consistent with the existing literature (Prezioso et al., 1995; Jayant and Nandibewoor, 2014).
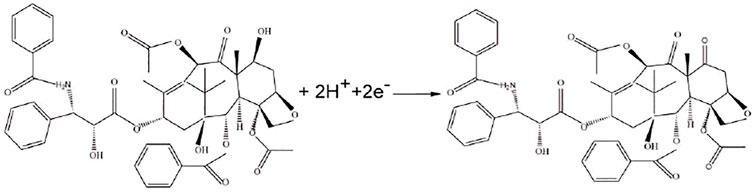
FIGURE 6. Electrochemical mechanism of paclitaxel.
3.6 Determination of Paclitaxel
The content of paclitaxel microemulsion was determined by cyclic voltammetry. Within the concentration range from 5 × 10⁻⁵ mol/L to 5 × 10⁻⁴ mol/L, the change of peak current with paclitaxel concentration is shown in Figure 7. As a result, the linear relationship is good, and the linear equation is Ip (1E-5A) = 0.0319 C (1E-5 mol/L) + 0.9973 (R2 = 0.9919).
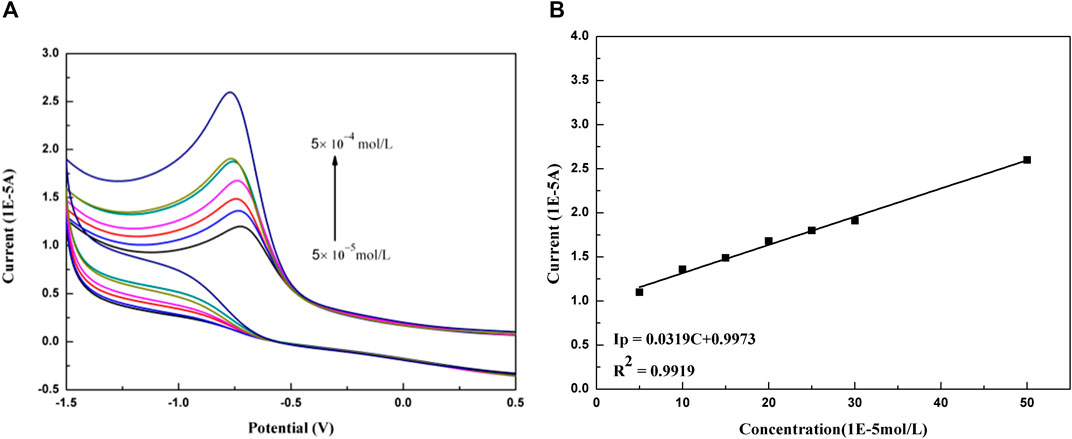
FIGURE 7. (A) Peak current changes with increasing concentration of paclitaxel at GCE (× 10−5 mol/L): 5, 10, 15, 20, 25, 30, and 50. (B) Linear relation between current and the concentration of paclitaxel.
The accuracy of the method is evaluated by repeatability and reproducibility. The repeatability is obtained by repeating the experiment five times under the same conditions on the same day; and the reproducibility is obtained by repeating five experiments within 5 days for different people. The experimental results are shown in Table 1. The limit of detection (LOD) and limit of quantifications (LOQ) were calculated by LOD = 3 s/m and LOQ = 10 s/m (Blanc et al., 2000), which were to be 9.15 × 10⁻⁸ mol/L and 3.05 × 10⁻⁷ mol/L, respectively.

TABLE 1. Characteristics of determination of paclitaxel by CV.
3.7 Recovery Test
Perform recovery experiments on the established method. The experiment used Taxol (30 mg in 5 ml), and the recovery results calculated by adding a known amount are shown in Table 2. It can be seen that the method has a good recovery (99.22%–101.69%) and acceptable precision (RSD = 0.90%), indicating that the method is feasible.
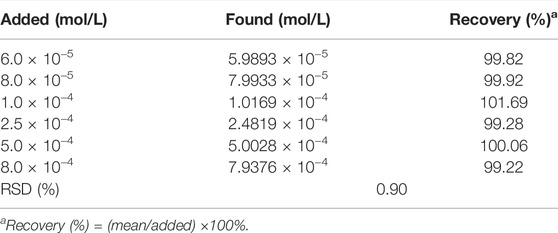
TABLE 2. Recovery of paclitaxel.
3.8 Effect of Excipients
This method is necessary to study whether excipients interfere with the test results. On the one hand, 5% glucose and 0.9% NaCl are commonly used as excipients, with little interference on the peak current and peak potential of the cyclic voltammogram. On the other hand, the polyoxyethylene castor oil and ethanol used in Taxol’s prescription also have less interference. Therefore, it shows that when the excipients are water, 5% glucose, and 0.9% NaCl, this method can be used in this prescription system. The effect of excipients on potential is shown in Table 3.
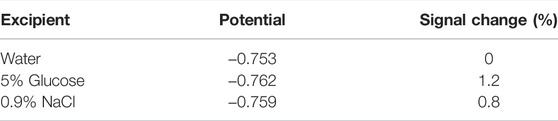
TABLE 3. Effect of excipients on potential in 1.0 × 10⁻⁴ M PAC.
3.9 Application
Three batches of Taxol samples were reconstituted with water, and 2 ml of sample solution and 2 ml 5.0 mol/L acetate buffer (pH 4.0) were taken to determine the content by this method. As shown in Table 4, the results indicated that this method could be used to determine paclitaxel in real samples.
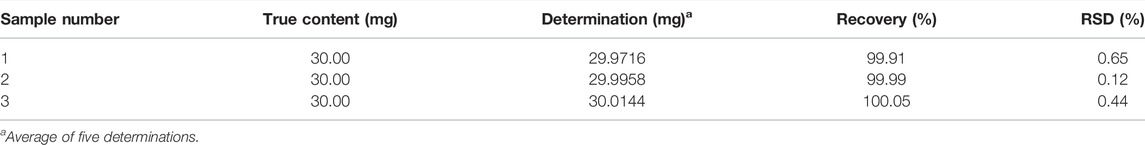
TABLE 4. Application of CV method in determination of Taxol.
4 Discussion
In this study, an electrochemical method was established to determine the content of paclitaxel, and the electrochemical behavior of paclitaxel on the carbon electrode in 5.0 mol/L acetate buffer (pH 4.0) was studied by cyclic voltammetry. It indicated that the reaction is an irreversible process and is controlled by diffusion and adsorption at the same time. In addition, the electrochemical reaction process of paclitaxel involves the transfer of two electrons and two protons and is oxidized. At the same time, the established method was validated with good linearity, recovery, accuracy, and RSD. This method is convenient, fast, and sensitive. The experimental results of this study provide a constructive method for determining the content of the hydrophobic drug paclitaxel and provide a basis for the electrochemical method to study hydrophobic drugs.
Data Availability Statement
The original contributions presented in the study are included in the article/Supplementary Material, further inquiries can be directed to the corresponding authors.
Author Contributions
This research was completed under the guidance of RS and NZ. The experimental part was completed by JL, WW, and YZ according to the workload, and the writing and revision of the manuscript were completed by JL and WW. All authors contributed to the article and approved the submitted version.
Funding
This study was supported by laboratory 214 of Southwest University.
Conflict of Interest
The authors declare that the research was conducted in the absence of any commercial or financial relationships that could be construed as a potential conflict of interest.
Publisher’s Note
All claims expressed in this article are solely those of the authors and do not necessarily represent those of their affiliated organizations or those of the publisher, the editors, and the reviewers. Any product that may be evaluated in this article, or claim that may be made by its manufacturer, is not guaranteed or endorsed by the publisher.
References
Acharya, D. P., and Hartley, P. G. (2012). Progress in Microemulsion Characterization. Curr. Opin. Colloid Interf. Sci. 17 (5), 274–280. doi:10.1016/j.cocis.2012.07.002
Attia, Y. M., El-Kersh, D. M., Ammar, R. A., Adel, A., Khalil, A., Walid, H., et al. (2020). Inhibition of Aldehyde Dehydrogenase-1 and P-Glycoprotein-Mediated Multidrug Resistance by Curcumin and Vitamin D3 Increases Sensitivity to Paclitaxel in Breast Cancer. Chem. Biol. Interact 315, 108865. doi:10.1016/j.cbi.2019.108865
Bard, A. J., and Faulkner, L. R. (2004). Electrochemical Methodsfundamentals and Applications. Hoboken, NJ, USA: Wiley, 236.
Blanc, R., González-Casado, A., Navalón, A., and Vı́lchez, J. L. (2000). On the Estimate of Blanks in Differential Pulse Voltammetric Techniques: Application to Detection Limits Evaluation as Recommended by IUPAC. Analytica Chim. Acta 403, 117–123. doi:10.1016/s0003-2670(99)00569-3
Bonde, S., Bonde, C. G., and Prabhakar, B. (2019). Quality by Design Based Development and Validation of HPLC Method for Simultaneous Estimation of Paclitaxel and Vinorelbine Tartrate in Dual Drug Loaded Liposomes[J]. Microchemical J. 149, 103982. doi:10.1016/j.microc.2019.103982
Christner, S. M., Parise, R. A., Ivy, P. S., Tawbi, H., Chu, E., and Beumer, J. H. (2019). Quantitation of Paclitaxel, and its 6-alpha-OH and 3-para-OH Metabolites in Human Plasma by LC-MS/MS. J. Pharm. Biomed. Anal. 172, 26–32. doi:10.1016/j.jpba.2019.04.027
Chrzescijanska, E., Wudarska, E., Kusmierek, E., and Rynkowski, J. (2014). Study of Acetylsalicylic Acid Electroreduction Behavior at Platinum Electrode. J. Electroanalytical Chem. 713, 17–21. doi:10.1016/j.jelechem.2013.11.015
Cisternas, R., Kahlert, H., Wulff, H., and Scholz, F. (2015). The Electrode Responses of a Tungsten Bronze Electrode Differ in Potentiometry and Voltammetry and Give Access to the Individual Contributions of Electron and Proton Transfer. Electrochemistry Commun. 56, 34–37. doi:10.1016/j.elecom.2015.04.005
Ebrahim, S., Mohsen, A., Mohammad, R. K., Rassoul, D., and Farid, A. D. (2014). Synthesis and Optimization of a Novel Polymeric Micelle Based on Hyaluronic Acid and Phospholipids for Delivery of Paclitaxel, In Vitro and Iin-Vvivo Evalution[J]. Int. J. Pharm. 475 (1-2), 163–173.
Fan, T., Takayama, K., Hattori, Y., and Maitani, Y. (2004). Formulation Optimization of Paclitaxel Carried by PEGylated Emulsions Based on Artificial Neural Network. Pharm. Res. 21 (9), 1692–1697. doi:10.1023/b:pham.0000041467.28884.16
Ganguli, A. K., Ganguly, A., and Vaidya, S. (2010). Microemulsion-based Synthesis of Nanocrystalline Materials. Chem. Soc. Rev. 39 (2), 474–485. doi:10.1039/b814613f
Gowda, J. I., and Nandibewoor, S. T. (2014). Electrochemical Characterization and Determination of Paclitaxel Drug Using Graphite Pencil Electrode[J]. Electrochimica Acta 116, 326. doi:10.1016/j.electacta.2013.11.014
Goyal, R. N., and Bishnoi, S. (2011). A Novel Multi-Walled Carbon Nanotube Modified Sensor for the Selective Determination of Epinephrine in Smokers. Electrochimica Acta 56, 2717–2724. doi:10.1016/j.electacta.2010.12.047
Hawkins, M. J., Soon-Shiong, P., and Desai, N. (2008). Protein Nanoparticles as Drug Carriers in Clinical Medicine. Adv. Drug Deliv. Rev. 60 (8), 876–885. doi:10.1016/j.addr.2007.08.044
Jayant, I. G., and Nandibewoor, T. S. (2014). Electrochemical Behavior of Paclitaxel and its Determination at Glassy Carbon Electrode[J]. Asian J. Pharm. Sci. 9 (1), 42. doi:10.1016/j.ajps.2013.11.007
Laviron, E. (1979). General Expression of the Linear Potential Sweep Voltammogram in the Case of Diffusionless Electrochemical Systems. J. Electroanalytical Chem. Interfacial Electrochemistry 101, 19–28. doi:10.1016/s0022-0728(79)80075-3
Lawrence, M. J., and Rees, G. D. (2001). Microemulsion-based media as Novel Drug Delivery Systems. Adv. Drug Deliv. Rev. 45 (1), 89–121. doi:10.1016/s0169-409x(00)00103-4
Lawrence, M. J., and Rees, G. D. (2000). Microemulsion-based media as Novel Drug Delivery Systems. Adv. Drug Deliv. Rev. 45 (1), 89–121. doi:10.1016/s0169-409x(00)00103-4
Magdassi, S. (1997). Delivery Systems in Cosmetics. Colloids Surf. A: Physicochemical Eng. Aspects 123-124, 671–679. doi:10.1016/s0927-7757(97)03792-8
Michalkiewicz, S. (2011). Anodic Oxidation of Oxidized Forms of Coenzymes Q10 and Q0 on Carbon Electrodes in Acetic Acid Solutions. Bioelectrochemistry 82, 103–111. doi:10.1016/j.bioelechem.2011.06.003
Prashanth, S. N., Ramesh, K. C., and Seetharamappa, J. (2011). Electrochemical Oxidation of an Immunosuppressant, Mycophenolate Mofetil, and its Assay in Pharmaceutical Formulations. Int. J. Electrochemistry 2011, 1–7. doi:10.4061/2011/193041
Prezioso, J. A., Hughey, R. P., Wang, N., Damodaran, K. M., and Bloomer, W. D. (1995). Gamma-glutamyltranspeptidase Expression Regulates the Growth-Inhibitory Activity of the Anti-tumor Prodrug Gamma-L-Glutaminyl-4-Hydroxy-3-Iodobenzene. Int. J. Cancer 56, 874–879. doi:10.1002/ijc.2910560620
Sharma, U. S., Balasubramanian, S. V., and Straubinger, R. M. (1995). Pharmaceutical and Physical Properties of Paclitaxel (Taxol †) Complexes with Cyclodextrins ‡. J. Pharm. Sci. 84 (10), 1223–1230. doi:10.1002/jps.2600841015
Shinoda, K., and Lindman, B. (1987). Organized Surfactant Systems: Microemulsions. Langmuir 3 (2), 135–149. doi:10.1021/la00074a001
Singla, A. K., Garg, A., and Aggarwal, D. (2002). Paclitaxel and its Formulations. Int. J. Pharm. 235, 179–192. doi:10.1016/s0378-5173(01)00986-3
Sjöblom, J., Lindberg, R., and Friberg, S. E. (1996). Microemulsions - Phase Equilibria Characterization, Structures, Applications and Chemical Reactions. Adv. Colloid Interf. Sci. 65, 125–287. doi:10.1016/0001-8686(96)00293-x
Spencer, C. M., and Faulds, D. (1994). Paclitaxel. A Review of its Pharmacodynamic and Pharmacokinetic Properties and Therapeutic Potential in the Treatment of Cancer. Drugs 48 (4), 794–847. doi:10.2165/00003495-199448050-00009
Wani, M. C., Taylor, H. L., Wall, M. E., Coggon, P., and McPhail, A. T. (1971). Plant Antitumor Agents. VI. Isolation and Structure of Taxol, a Novel Antileukemic and Antitumor Agent from Taxus Brevifolia. J. Am. Chem. Soc. 93 (9), 2325–2327. doi:10.1021/ja00738a045
Wu, J., Liu, Q., and Lee, R. J. (2006). A Folate Receptor-Targeted Liposomal Formulation for Paclitaxel. Int. J. Pharm. 316 (1-2), 148–153. doi:10.1016/j.ijpharm.2006.02.027
Wu, J.-j., Wang, W. T., and Wang, M. (2016). Electrochemical Behavior and Direct Quantitative Determination of Tanshinone IIA in Micro-emulsion. Int. J. Electrochem. Sci. 11, 5165–5179. doi:10.20964/2016.06.55
Yardley, D. A. (2013). Nab-Paclitaxel Mechanisms of Action and Delivery. J. Controlled Release 170 (3), 365–372. doi:10.1016/j.jconrel.2013.05.041
Keywords: paclitaxel, quantitative determination, electrochemical behavior, voltammetry, microemulsion
Citation: Lang J, Wang W, Zhou Y, Guo D, Shi R and Zhou N (2022) Electrochemical Behavior and Direct Quantitative Determination of Paclitaxel. Front. Chem. 10:834154. doi: 10.3389/fchem.2022.834154
Received: 15 February 2022; Accepted: 25 March 2022;
Published: 26 April 2022.
Edited by:
Xifei Li, Xi’an University of Technology, ChinaCopyright © 2022 Lang, Wang, Zhou, Guo, Shi and Zhou. This is an open-access article distributed under the terms of the Creative Commons Attribution License (CC BY). The use, distribution or reproduction in other forums is permitted, provided the original author(s) and the copyright owner(s) are credited and that the original publication in this journal is cited, in accordance with accepted academic practice. No use, distribution or reproduction is permitted which does not comply with these terms.
*Correspondence: Rujie Shi, eXVzcmpAMTYzLmNvbQ==; Nong Zhou, ZXJoYWl6bkAxMjYuY29t