 Xien Yang
 Zhongyu Wu
 Quanhong Ou
 Kai Qian2
 Liqin Jiang
 Gang Liu
95% of researchers rate our articles as excellent or good
Learn more about the work of our research integrity team to safeguard the quality of each article we publish.
Find out more
ORIGINAL RESEARCH article
Front. Chem. , 26 January 2022
Sec. Analytical Chemistry
Volume 10 - 2022 | https://doi.org/10.3389/fchem.2022.810837
Lung cancer is a fatal tumor threatening human health. It is of great significance to explore a diagnostic method with wide application range, high specificity, and high sensitivity for the detection of lung cancer. In this study, data fusion and wavelet transform were used in combination with Fourier transform infrared (FTIR) spectroscopy and Raman spectroscopy to study the serum samples of patients with lung cancer and healthy people. The Raman spectra of serum samples can provide more biological information than the FTIR spectra of serum samples. After selecting the optimal wavelet parameters for wavelet threshold denoising (WTD) of spectral data, the partial least squares–discriminant analysis (PLS-DA) model showed 93.41% accuracy, 96.08% specificity, and 90% sensitivity for the fusion data processed by WTD in the prediction set. The results showed that the combination of FTIR spectroscopy and Raman spectroscopy based on data fusion and wavelet transform can effectively diagnose patients with lung cancer, and it is expected to be applied to clinical screening and diagnosis in the future.
Lung cancer is a malignant tumor with a high incidence rate and a high mortality rate threatening human health (Sung et al., 2021). Due to the lack of biomarkers in lung cancer, most patients are in the middle and advanced stage at the time of treatment (Stapelfeld et al., 2020). At present, the screening methods of lung cancer mainly include X-ray examination, low-dose computed tomography, and magnetic resonance imaging (MRI), but these technologies have some disadvantages, such as unable to apply to specific populations, high false positive rate, and low sensitivity (Thakur et al., 2020; Xu et al., 2021). Therefore, there is a need to find an early diagnostic method with wide application range, high specificity, and high sensitivity.
Vibrational spectroscopy is an important tool in the field of analytical chemistry and bioanalysis, of which Fourier transform infrared (FTIR) spectroscopy and Raman spectroscopy have been widely used in cancer diagnosis in recent years (Auner et al., 2018; Christensen et al., 2019; Baiz et al., 2020). In our previous work, we studied the serum samples of patients with lung cancer and healthy people using FTIR spectroscopy and found that the concentrations of protein, lipid, and nucleic acid molecules in the serum of patients with lung cancer were higher than those of healthy people (Yang et al., 2021a). Song et al. classified the tissues of healthy people and patients with lung squamous cell carcinoma using Raman spectroscopy combined with principal component analysis–linear discriminant analysis (PCA-LDA) (Song et al., 2020). These reports demonstrate the potential of FTIR spectroscopy and Raman spectroscopy in the diagnosis of lung cancer.
Data fusion has been widely used in the analysis and determination of biological and pharmaceutical components in recent years because of its integration of multiple methods to obtain more effective and comprehensive data (Haware et al., 2011; Comino et al., 2018; Feng et al., 2020; Zhang et al., 2020; Zhao et al., 2020; Azcarate et al., 2021). There are reports that data fusion was used in FTIR spectroscopy and Raman spectroscopy for the diagnosis of thyroid dysfunction and cervical cancer. Chen et al. studied the blood of patients with thyroid dysfunction and healthy people using FTIR spectroscopy and Raman spectroscopy combined with data fusion and achieved an accuracy of 83.48% (Chen et al., 2020). Zhang et al. studied the tissue samples from patients with cervical cancer using Raman spectroscopy and obtained an accuracy of 93.51% using characteristic data after fusion of first and second derivatives (Zhang et al., 2021). Therefore, data fusion combined with FTIR spectroscopy and Raman spectroscopy has the potential to diagnose various diseases, so it is expected to be applied in the diagnosis of lung cancer.
As a powerful signal processing technology, wavelet transform has been widely used in imaging, chromatography, vibration spectroscopy, and so on (Sudarshan et al., 2016; Jiang and Ma, 2020; Wahab and O’Haver, 2020; Sun et al., 2017; Godinho et al., 2014; Martyna et al., 2015; Dinç and Yazan, 2018). There are reports that wavelet transform and data fusion were used in combination with some other techniques to detect prostate cancer and neurocysticercosis. Tiwari et al. fused the data of magnetic resonance (MR), imaging (MRI), and spectroscopy (MRS) using multimodal wavelets (MaWERiC) and found that the MaWERiC had better detection results for prostate cancer than any single data (Tiwari et al., 2012). Chavan et al. proposed a non-subsampled rotated complex wavelet transform (NSRCxWT) extraction image fusion algorithm based on computed tomography (CT) and MRI features and found that the image quality processed under this algorithm was much better than the original image quality, which was more conducive to the diagnosis of neurocysticercosis (Chavan et al., 2017). However, the method of combining wavelet transform and data fusion using FTIR spectroscopy and Raman spectroscopy has not been studied in the diagnosis of lung cancer.
In this study, data fusion and wavelet transform were used in combination with FTIR spectroscopy and Raman spectroscopy to make full use of the FTIR and Raman spectral information of serum samples, and then distinguish the serum of patients with lung cancer from that of healthy people. The purpose is to explore a wide applicable and high-accuracy diagnostic method for lung cancer and to lay the foundation for the clinical application of FTIR spectroscopy and Raman spectroscopy in the diagnosis of lung cancer in the future.
Serum samples from 92 patients with lung cancer and 155 samples from healthy people were obtained from The First People’s Hospital of Yunnan Province, and all research content was conducted according to the Declaration of Helsinki.
FTIR spectra of serum were measured in the range of 4000–600 cm−1 by a Frontier spectrometer (Perkin Elmer) with the same test method as in our previous work (Yang et al., 2021a). Each IR spectrum was an accumulation of 32 scans at a resolution of 4 cm−1. Serum samples (30 μl) were dropped on clean glass slides to measure Raman spectra using a confocal micro Raman spectrometer (ANDOR SR-500-type) in the range of 800–1800 cm−1 through a ×50 objective lens with an excitation wavelength of 532 nm for the laser. The laser power at the serum sample was 12 mW. Each Raman spectrum was scanned for 10 s and accumulated three times.
Wavelet transform is the projection of signal on a wavelet base (Rameshnath and Bora, 2019). It gradually refines the signal in multiple-scale through expansion and translation operations and, finally, realizes the time subdivision of high frequency and the frequency subdivision of low frequency so as to focus any details of the signal. In the wavelet domain, the wavelet coefficient of the signal is larger than that of the noise. The basic principle of wavelet threshold denoising is to set an appropriate threshold. The wavelet coefficients larger than the threshold are considered to be generated by the signal and should be preserved. Those smaller than the threshold are considered to be generated by noise and set to zero, thus achieving the purpose of denoising (Donoho and Johnstone, 1995). Wavelet denoising removes noise and maintains the details of the signal using multi-scale and multi-resolution characteristics of wavelet transform. Compared with the low-pass filter based on Fourier transform, wavelet denoising has a better effect (Peng et al., 2021).
The effect of the WTD algorithm on FTIR and Raman spectral data mainly depends on the optimal wavelet function, wavelet decomposition level (DL), and wavelet threshold. Choosing an appropriate wavelet function is helpful to maximize the coefficient value in the wavelet domain. Generally, the appropriate wavelet function is determined by the specific practical requirements (Liu et al., 2021). In wavelet decomposition, the choice of DL is also a very important step. The larger the DL is, the more obvious the characteristics of noise and signal are, which is more conducive to the separation of them. Unfortunately, the larger the number of DL is, the greater the distortion of the reconstructed signal is. The selection of threshold is divided into two parts: the selection of threshold function and the selection of threshold. The commonly used threshold functions are mainly soft threshold function and hardness threshold function. The result of the soft threshold function is smoother than the hard threshold, so the soft threshold function was selected (Sanam and Shahnaz, 2013).
In the process of spectral measurement, there are some inevitable interference factors, such as background disturbance, light scattering, and particle size, which influence the quality of raw spectra and decrease the accuracy of classification models (Chen et al., 2004). Therefore, several different preprocessing methods were used in order to reduce the unnecessary signal variations, such as normalization, Savitzky–Golay (SG) filter, first derivative (FD), second derivative (SD), and standard normal variate (SNV) (Roy, 2015; Everard et al., 2016).
Date fusion is the process of integrating data from different sources. The main purpose of data fusion is to find more valuable data set, which might improve the accuracy of prediction and present a better interpretation of the results (Li et al., 2021). In this study, matrices of FTIR and Raman spectral data were integrated into a single matrix. The FTIR matrix and Raman matrix were concatenated on the column forming a two-dimensional merged data matrix that has the same rows with the analyzed samples.
PLS-DA is a linear pattern classification method, which is widely used to deal with complicated data by reducing dimension. In this study, all samples were divided into a calibration set (60%) and a prediction set (40%) by the Kennard–Stone algorithm. Samples of patients with lung cancer were coded 1, while those of healthy people were coded 2, and the discriminant threshold of the model was set to 1.5. The performance of the PLS-DA model was evaluated in terms of accuracy, specificity, and sensitivity of calibration (Acccv, Specv, and Sencv) and prediction (Accp, Spep, and Senp) (Yang et al., 2021b). The PLS-DA model, spectral data preprocessing, and WTD algorithm were performed using the MATLAB software (version R2019a, MathWorks).
Figure 1 shows the FTIR spectra and Raman spectra of serum samples. The main peaks and their assignments are listed in Table 1. It can be found from Table 1 that the Raman spectra of serum samples can provide more biological information than the FTIR spectra of serum samples, such as porphyrin, phospholipids, and glucose. It can be seen from Figure 1A and Figure 1B that the IR spectra of serum from patients with lung cancer are extremely similar to that of healthy people. Figure 1C and Figure 1D show the Raman spectra of serum from patients with lung cancer and that of healthy people, respectively. Although some differences between the patients with lung cancer and healthy people can be seen from the original Raman spectra of serum samples, it is also necessary to optimize and process the original FTIR and Raman spectral data to distinguish them.
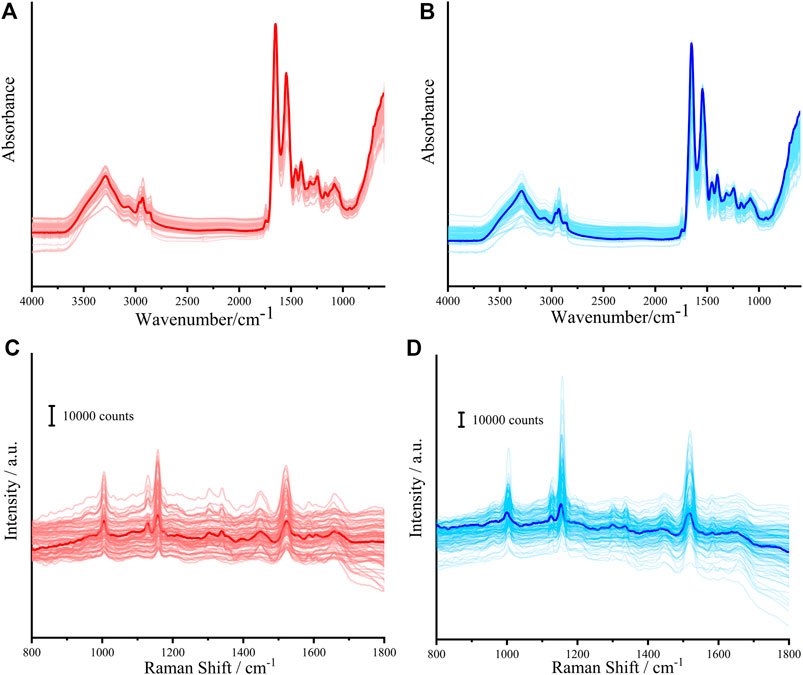
FIGURE 1. FTIR spectra of serum from patients with lung cancer (A) and healthy people (B). Raman spectra of serum from patients with lung cancer (C) and healthy people (D). (The corresponding average spectra are shown in bold).
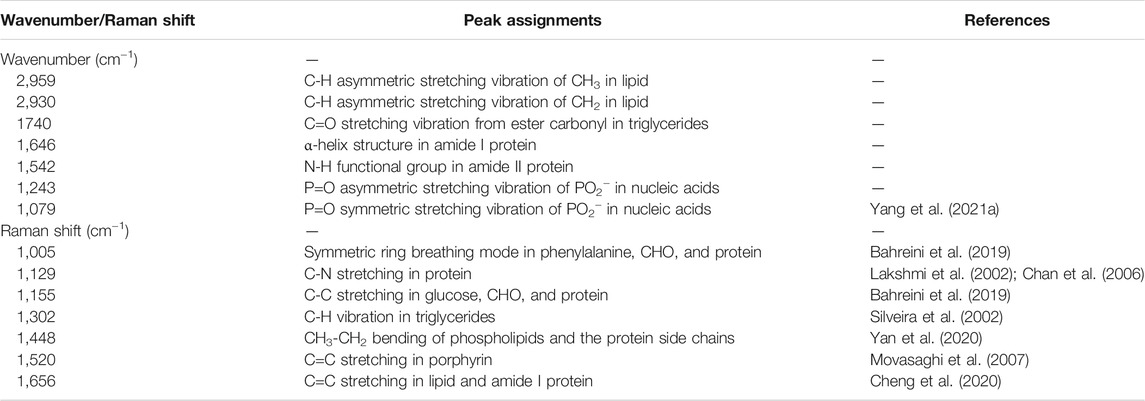
TABLE 1. Peaks of FTIR and Raman spectra and their assignments.
In order to optimize the FTIR and Raman spectral data to improve the classification effect of the PLS-DA model, ten commonly used wavelet functions, bior2.2, coif1, coif3, db02, db08, fk4, fk8, haar, sym5, and sym8, were tested. Each wavelet function was performed under 1–8 wavelet DLs to study the effect of DL on the denoising effect (Liu et al., 2021). At the same time, four threshold acquisition methods, heursure, minimaxi, rigrsure, and sqtwolog, were performed to further improve the denoising performance. The optimal values of wavelet function, DL, and wavelet threshold were determined by calculating the accuracy (Acccv), specificity (Specv), and sensitivity (Sencv) at 7-fold cross-validation by the PLS-DA model.
Figure 2 shows the Acccv (mean value + error bar) of the PLS-DA model using FTIR spectral data processed by WTD in four thresholds. It is shown that the combination of different thresholds and wavelet functions has different effects when processing the same FTIR spectral data. Where the combination of heursure and db08 (heursure-db08) has the same and highest Acccv as the combination of sqtwolog and fk8 (sqtwolog-fk8), but heursure-db08 has higher Sencv than sqtwolog-fk8 (Table 2). Figure 4 shows the choice of the best DL, where DL = 6 has the best performance for WTD (heursure-db08) of FITR spectral data. Therefore, heursure-db08 and DL = 6 were selected as the optimal wavelet parameters for WTD of FITR spectral data.
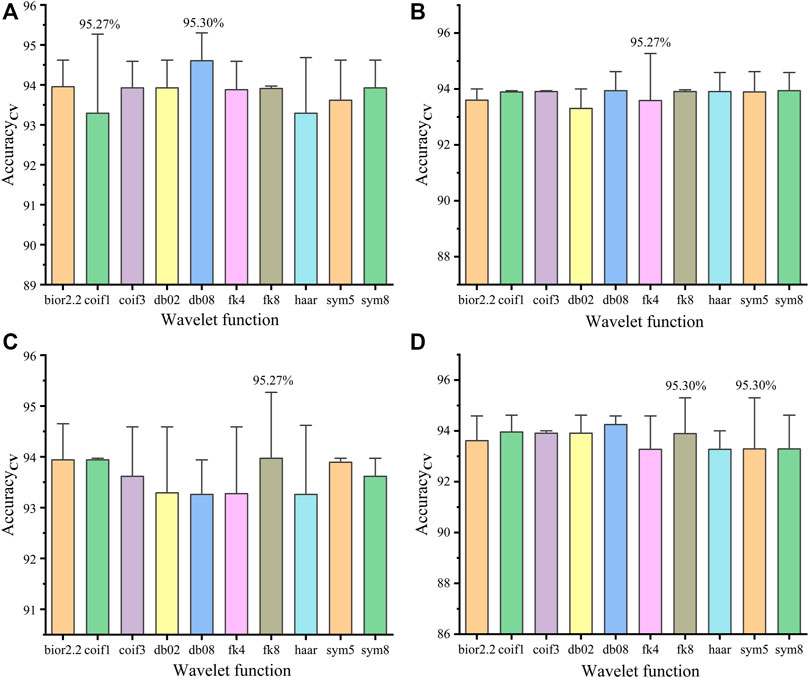
FIGURE 2. Acccv of the PLS-DA model using FTIR spectral data processed by WTD in four thresholds: heursure (A), minimaxi (B), rigrsure (C), and sqtwolog (D).
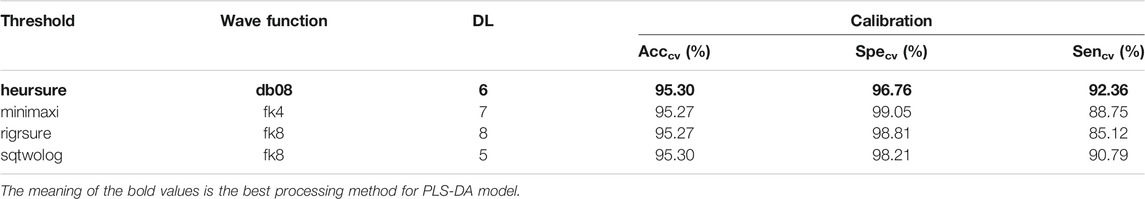
TABLE 2. Calibration results for FTIR spectral data processed by different WTD algorithms. (The best threshold, wave function, and DL for the PLS-DA model are presented in bold).
Figure 3 shows the Acccv (mean value + error bar) of the PLS-DA model using Raman spectral data processed by WTD in four thresholds. It is shown that the combination of minimaxi and bior2.2 (minimaxi-bior2.2) has higher Acccv than the combination of other thresholds and wavelet functions (Figure 3D). Figure 4 shows that DL = 6 is the best DL for WTD (minimaxi-bior2.2) of Raman spectral data. Therefore, minimaxi-bior2.2 and DL = 6 were selected as the optimal wavelet parameters for WTD of Raman spectral data.
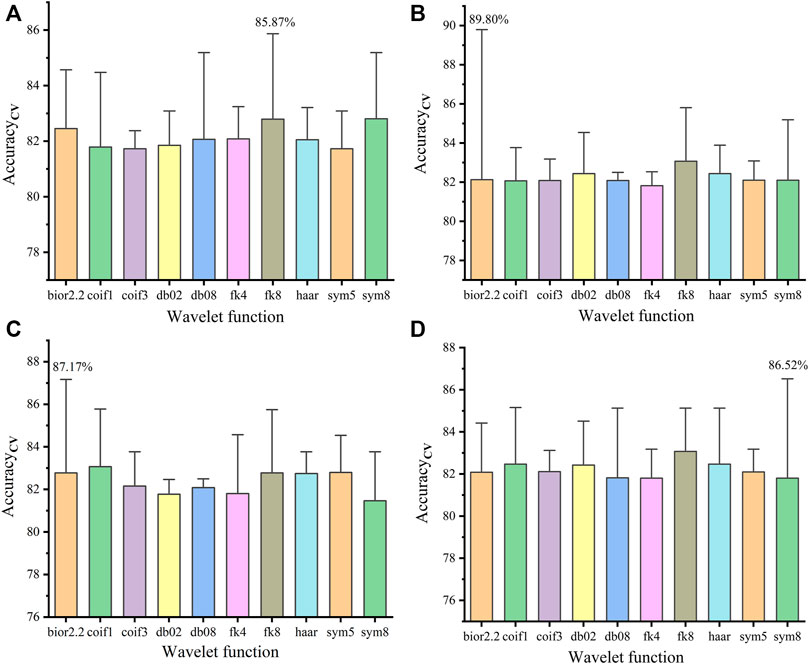
FIGURE 3. Acccv of the PLS-DA model using Raman spectral data processed by WTD in four thresholds: heursure (A), minimaxi (B), rigrsure (C), and sqtwolog (D).
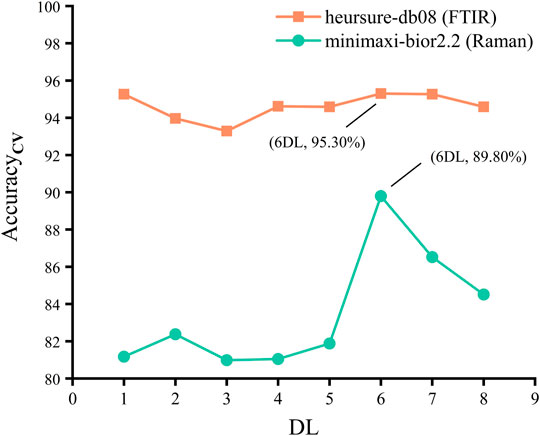
FIGURE 4. Acccv of the PLS-DA model using FTIR and Raman spectral data processed by WTD in different DLs.
After obtaining the optimal wavelet parameters, the spectral data processed by WTD and other preprocessing methods were analyzed with the PLS-DA model. Table 3 and Table 4 show the accuracy, specificity, and sensitivity of FTIR and Raman spectral data in the PLS-DA model, respectively. Compared with the original spectral data and the data processed by other preprocessing methods, the spectral data processed by WTD, especially the Raman spectral data, obtained a good performance in the PLS-DA model.
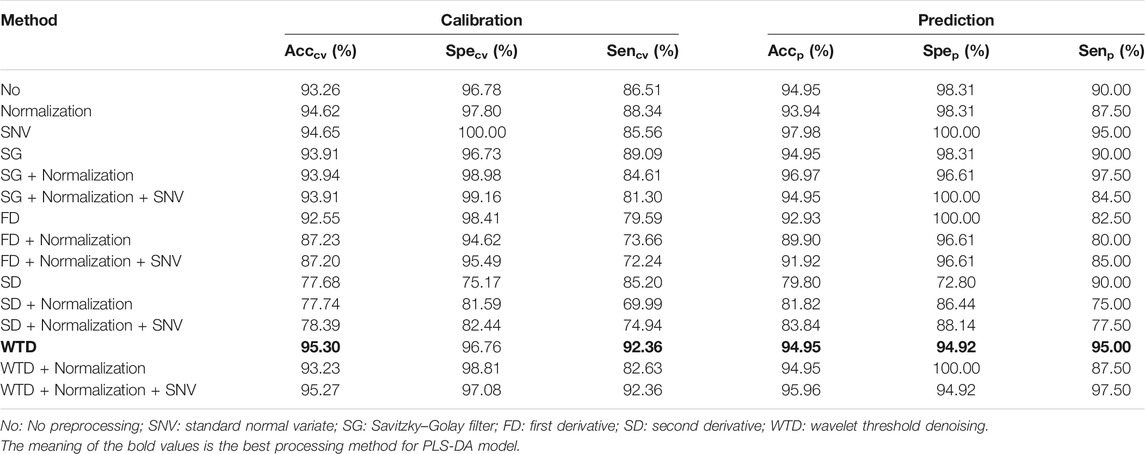
TABLE 3. Model performances of the PLS-DA model using FTIR spectral data with different preprocessing methods. (The best processing method for the PLS-DA model are presented in bold).

TABLE 4. Model performances of the PLS-DA model using Raman spectral data with different preprocessing methods. (The best processing method for the PLS-DA model are presented in bold).
In order to further improve the performances of the model, data fusion was used to FTIR spectral data combined with Raman spectral data to obtain more data information. Table 5 shows the performances of the PLS-DA model using data fusion combined with different preprocessing methods. It can be seen that the data fusion has an improvement effect on each preprocessed data set. Moreover, the fusion data processed by WTD has the highest accuracy, sensitivity, and specificity in the PLS-DA model. Figure 5 shows the score plot of the PLS-DA model using data fusion combined with WTD. It can be seen that the samples from patients with lung cancer coded 1 are separated from those of healthy people coded 2 at threshold = 1.5. The PLS-DA model shows good results with 93.41% Accp, 96.08% Spep, and 90% Senp for the fusion data processed by WTD. The results show that FTIR spectroscopy combined with Raman spectroscopy based on data fusion and wavelet transform can effectively distinguish the serum samples of patients with lung cancer from those of healthy people.
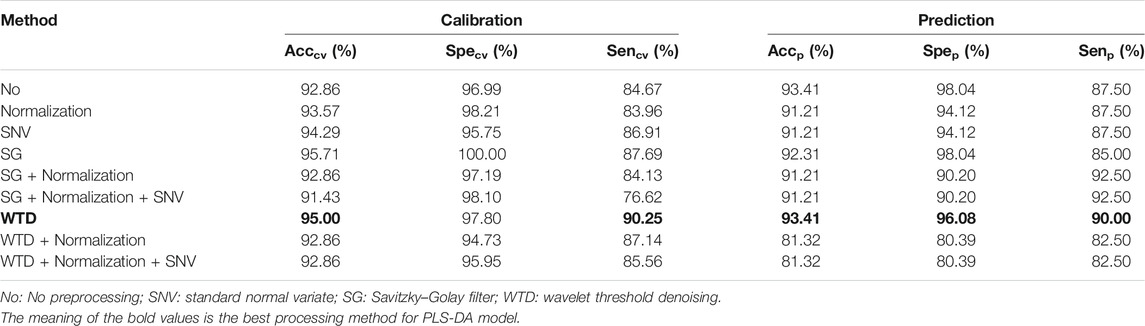
TABLE 5. Performances of the PLS-DA model using data fusion combined with different preprocessing methods. (The best results for the PLS-DA model are presented in bold).
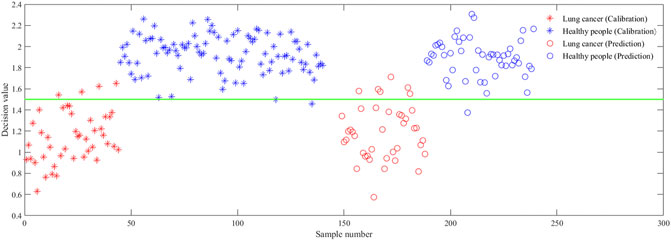
FIGURE 5. Score plot of the PLS-DA model using data fusion combined with WTD.
Data fusion and wavelet transform were used in combination with FTIR spectroscopy and Raman spectroscopy to study the serum samples of patients with lung cancer and healthy people. The results showed that the Raman spectra of serum samples can provide more biological information than FTIR spectra of serum samples. WTD filtered the invalid information from the original spectral data, thus improving the performances of the PLS-DA model. The performance of FTIR spectral data processed by WTD in the model had higher accuracy than others. Although the addition of Raman spectral data may increase the information that is not conducive to the diagnosis of the PLS-DA model and then reduce the performance of the fusion data processed by WTD in the model, its combination with FTIR spectral data can provide better biological information. Finally, the PLS-DA model using the fusion data processed by WTD showed good results with 93.41% accuracy, 96.08% specificity, and 90% sensitivity in the prediction set, indicating that FTIR spectroscopy combined with Raman spectroscopy based on data fusion and wavelet transform could effectively distinguish the serum of patients with lung cancer from that of healthy people. In our future work, we will use richer wavelet denoising methods to improve the performance of Raman spectral data in the model, develop new methods that are more conducive to data fusion by assigning different weights to different spectral datasets, and then provide new methods for clinical screening and diagnosis of lung cancer and other diseases.
The original contributions presented in the study are included in the article/Supplementary Material, further inquiries can be directed to the corresponding author.
The studies involving human participants were reviewed and approved by the Ethics Committee of Yunnan Normal University (Number: ynnuethic2021-13). The patients/participants provided their written informed consent to participate in this study.
XY designed the project and completed all the research. ZW performed the calculation and analysis of the model. XY and ZW share first authorship. KQ and WY provided medical instruction. LJ and YS made the charts. XY, ZW, QO, and GL wrote the manuscript. All authors contributed to the article and approved the submitted version.
This work was supported by the National Natural Science Foundation of China (Grant No. 31760341) and Zunyi Science and Technology Bureau (ZSKHHZZ-2019-5). The authors are grateful for these financial supports.
The authors declare that the research was conducted in the absence of any commercial or financial relationships that could be construed as a potential conflict of interest.
All claims expressed in this article are solely those of the authors and do not necessarily represent those of their affiliated organizations, or those of the publisher, the editors, and the reviewers. Any product that may be evaluated in this article, or claim that may be made by its manufacturer, is not guaranteed or endorsed by the publisher.
The authors are grateful for these financial supports.
Auner, G. W., Koya, S. K., Huang, C., Broadbent, B., Trexler, M., Auner, Z., et al. (2018). Applications of Raman Spectroscopy in Cancer Diagnosis. Cancer Metastasis Rev. 37 (4), 691–717. doi:10.1007/s10555-018-9770-9
Azcarate, S. M., Ríos-Reina, R., Amigo, J. M., and Goicoechea, H. C. (2021). Data Handling in Data Fusion: Methodologies and Applications. Trac Trends Anal. Chem. 143, 116355. doi:10.1016/j.trac.2021.116355
Bahreini, M., Hosseinzadegan, A., Rashidi, A., Miri, S. R., Mirzaei, H. R., and Hajian, P. (2019). A Raman-Based Serum Constituents' Analysis for Gastric Cancer Diagnosis: In Vitro Study. Talanta 204, 826–832. doi:10.1016/j.talanta.2019.06.068
Baiz, C. R., Błasiak, B., Bredenbeck, J., Cho, M., Choi, J.-H., Corcelli, S. A., et al. (2020). Vibrational Spectroscopic Map, Vibrational Spectroscopy, and Intermolecular Interaction. Chem. Rev. 120 (15), 7152–7218. doi:10.1021/acs.chemrev.9b00813
Chan, J. W., Taylor, D. S., Zwerdling, T., Lane, S. M., Ihara, K., and Huser, T. (2006). Micro-Raman Spectroscopy Detects Individual Neoplastic and normal Hematopoietic Cells. Biophysical J. 90 (2), 648–656. doi:10.1529/biophysj.105.066761
Chavan, S. S., Mahajan, A., Talbar, S. N., Desai, S., Thakur, M., and D'Cruz, A. (2017). Nonsubsampled Rotated Complex Wavelet Transform (NSRCxWT) for Medical Image Fusion Related to Clinical Aspects in Neurocysticercosis. Comput. Biol. Med. 81, 64–78. doi:10.1016/j.compbiomed.2016.12.006
Chen, C., Du, G., Tong, D., Lv, G., Lv, X., Si, R., et al. (2020). Exploration Research on the Fusion of Multimodal Spectrum Technology to Improve Performance of Rapid Diagnosis Scheme for Thyroid Dysfunction. J. Biophotonics 13 (2), e201900099. doi:10.1002/jbio.201900099
Chen, D., Shao, X., Hu, B., and Su, Q. (2004). A Background and Noise Elimination Method for Quantitative Calibration of Near Infrared Spectra. Analytica Chim. Acta 511 (1), 37–45. doi:10.1016/j.aca.2004.01.042
Cheng, H., Xu, C., Zhang, D., Zhang, Z., Liu, J., and Lv, X. (2020). Multiclass Identification of Hepatitis C Based on Serum Raman Spectroscopy. Photodiagnosis Photodynamic Ther. 30, 101735. doi:10.1016/j.pdpdt.2020.101735
Christensen, D., Rüther, A., Kochan, K., Pérez-Guaita, D., and Wood, B. (2019). Whole-Organism Analysis by Vibrational Spectroscopy. Annu. Rev. Anal. Chem. 12 (1), 89–108. doi:10.1146/annurev-anchem-061318-115117
Comino, F., Ayora-Cañada, M. J., Aranda, V., Díaz, A., and Domínguez-Vidal, A. (2018). Near-infrared Spectroscopy and X-ray Fluorescence Data Fusion for Olive Leaf Analysis and Crop Nutritional Status Determination. Talanta 188, 676–684. doi:10.1016/j.talanta.2018.06.058
Dinç, E., and Yazan, Z. (2018). Wavelet Transform-Based UV Spectroscopy for Pharmaceutical Analysis. Front. Chem. 6, 503. doi:10.3389/fchem.2018.00503
Donoho, D. L., and Johnstone, I. M. (1995). Adapting to Unknown Smoothness via Wavelet Shrinkage. J. Am. Stat. Assoc. 90 (432), 1200–1224. doi:10.1080/01621459.1995.10476626
Everard, C., Kim, M., and O’Donnell, C. (2016). Distinguishing Bovine Fecal Matter on Spinach Leaves Using Field Spectroscopy. Appl. Sci. 6 (9), 246. doi:10.3390/app6090246
Feng, B., Shi, H., Xu, F., Hu, F., He, J., Yang, H., et al. (2020). FTIR-assisted MALDI-TOF MS for the Identification and Typing of Bacteria. Analytica Chim. Acta 1111, 75–82. doi:10.1016/j.aca.2020.03.037
Godinho, M. S., Blanco, M. R., Gambarra Neto, F. F., Lião, L. M., Sena, M. M., Tauler, R., et al. (2014). Evaluation of Transformer Insulating Oil Quality Using NIR, Fluorescence, and NMR Spectroscopic Data Fusion. Talanta 129, 143–149. doi:10.1016/j.talanta.2014.05.021
Haware, R. V., Wright, P. R., Morris, K. R., and Hamad, M. L. (2011). Data Fusion of Fourier Transform Infrared Spectra and Powder X-ray Diffraction Patterns for Pharmaceutical Mixtures. J. Pharm. Biomed. Anal. 56 (5), 944–949. doi:10.1016/j.jpba.2011.08.018
Jiang, Y., and Ma, Y. (2020). Application of Hybrid Particle Swarm and Ant colony Optimization Algorithms to Obtain the Optimum Homomorphic Wavelet Image Fusion. Ann. Transl Med. 8 (22), 1482. doi:10.21037/atm-20-5997
Lakshmi, R. J., Kartha, V. B., Murali Krishna, C., R. Solomon, J. G., Uma Devi, P., and Uma Devi, P. (2002). Tissue Raman Spectroscopy for the Study of Radiation Damage: Brain Irradiation of Mice. Radiat. Res. 157 (2), 175–182. doi:10.1667/0033-7587(2002)157[0175:trsfts]2.0.co;2
Li, Q., Huang, Y., Zhang, J., and Min, S. (2021). A Fast Determination of Insecticide Deltamethrin by Spectral Data Fusion of UV-Vis and NIR Based on Extreme Learning Machine. Spectrochimica Acta A: Mol. Biomol. Spectrosc. 247, 119119. doi:10.1016/j.saa.2020.119119
Liu, L., Huan, H., Li, W., Mandelis, A., Wang, Y., Zhang, L., et al. (2021). Highly Sensitive Broadband Differential Infrared Photoacoustic Spectroscopy with Wavelet Denoising Algorithm for Trace Gas Detection. Photoacoustics 21, 100228. doi:10.1016/j.pacs.2020.100228
Martyna, A., Michalska, A., and Zadora, G. (2015). Interpretation of FTIR Spectra of Polymers and Raman Spectra of Car Paints by Means of Likelihood Ratio Approach Supported by Wavelet Transform for Reducing Data Dimensionality. Anal. Bioanal. Chem. 407 (12), 3357–3376. doi:10.1007/s00216-015-8558-9
Movasaghi, Z., Rehman, S., and Rehman, I. U. (2007). Raman Spectroscopy of Biological Tissues. Appl. Spectrosc. Rev. 42 (5), 493–541. doi:10.1080/05704920701551530
Peng, S., Chen, R., Yu, B., Xiang, M., Lin, X., and Liu, E. (2021). Daily Natural Gas Load Forecasting Based on the Combination of Long Short Term Memory, Local Mean Decomposition, and Wavelet Threshold Denoising Algorithm. J. Nat. Gas Sci. Eng. 95, 104175. doi:10.1016/j.jngse.2021.104175
Rameshnath, S., and Bora, P. K. (2019). Perceptual Video Hashing Based on Temporal Wavelet Transform and Random Projections with Application to Indexing and Retrieval of Near-Identical Videos. Multimed Tools Appl. 78 (13), 18055–18075. doi:10.1007/s11042-019-7189-0
Roy, I. G. (2015). On Computing First and Second Order Derivative Spectra. J. Comput. Phys. 295, 307–321. doi:10.1016/j.jcp.2015.04.015
Sanam, T. F., and Shahnaz, C. (2013). Noisy Speech Enhancement Based on an Adaptive Threshold and a Modified Hard Thresholding Function in Wavelet Packet Domain. Digital Signal. Process. 23 (3), 941–951. doi:10.1016/j.dsp.2012.12.001
Silveira, L., Sathaiah, S., Zângaro, R. A., Pacheco, M. T. T., Chavantes, M. C., and Pasqualucci, C. A. G. (2002). Correlation between Near-Infrared Raman Spectroscopy and the Histopathological Analysis of Atherosclerosis in Human Coronary Arteries. Lasers Surg. Med. 30 (4), 290–297. doi:10.1002/lsm.10053
Song, D., Yu, F., Chen, S., Chen, Y., He, Q., Zhang, Z., et al. (2020). Raman Spectroscopy Combined with Multivariate Analysis to Study the Biochemical Mechanism of Lung Cancer Microwave Ablation. Biomed. Opt. Express 11 (2), 1061–1072. doi:10.1364/BOE.383869
Stapelfeld, C., Dammann, C., and Maser, E. (2020). Sex‐specificity in Lung Cancer Risk. Int. J. Cancer 146 (9), 2376–2382. doi:10.1002/ijc.32716
Sudarshan, V. K., Mookiah, M. R. K., Acharya, U. R., Chandran, V., Molinari, F., Fujita, H., et al. (2016). Application of Wavelet Techniques for Cancer Diagnosis Using Ultrasound Images: A Review. Comput. Biol. Med. 69, 97–111. doi:10.1016/j.compbiomed.2015.12.006
Sun, W., Zhang, X., Zhang, Z., and Zhu, R. (2017). Data Fusion of Near-Infrared and Mid-infrared Spectra for Identification of Rhubarb. Spectrochimica Acta Part A: Mol. Biomol. Spectrosc. 171, 72–79. doi:10.1016/j.saa.2016.07.039
Sung, H., Ferlay, J., Siegel, R. L., Laversanne, M., Soerjomataram, I., Jemal, A., et al. (2021). Global Cancer Statistics 2020: GLOBOCAN Estimates of Incidence and Mortality Worldwide for 36 Cancers in 185 Countries. CA A. Cancer J. Clin. 71, 209–249. doi:10.3322/caac.21660
Thakur, S. K., Singh, D. P., and Choudhary, J. (2020). Lung Cancer Identification: a Review on Detection and Classification. Cancer Metastasis Rev. 39 (3), 989–998. doi:10.1007/s10555-020-09901-x
Tiwari, P., Viswanath, S., Kurhanewicz, J., Sridhar, A., and Madabhushi, A. (2012). Multimodal Wavelet Embedding Representation for Data Combination (MaWERiC): Integrating Magnetic Resonance Imaging and Spectroscopy for Prostate Cancer Detection. NMR Biomed. 25 (4), 607–619. doi:10.1002/nbm.1777
Wahab, M. F., and O'Haver, T. C. (2020). Wavelet Transforms in Separation Science for Denoising and Peak Overlap Detection. J. Sep. Sci. 43 (9-10), 1998–2010. doi:10.1002/jssc.202000013
Xu, K., Zhang, C., Du, T., Gabriel, A. N. A., Wang, X., Li, X., et al. (2021). Progress of Exosomes in the Diagnosis and Treatment of Lung Cancer. Biomed. Pharmacother. 134, 111111. doi:10.1016/j.biopha.2020.111111
Yan, Z., Ma, C., Mo, J., Han, W., Lv, X., Chen, C., et al. (2020). Rapid Identification of Benign and Malignant Pancreatic Tumors Using Serum Raman Spectroscopy Combined with Classification Algorithms. Optik 208, 164473. doi:10.1016/j.ijleo.2020.164473
Yang, X., Ou, Q., Qian, K., Yang, J., Bai, Z., Yang, W., et al. (2021). Diagnosis of Lung Cancer by ATR-FTIR Spectroscopy and Chemometrics. Front. Oncol. 11, 11. doi:10.3389/fonc.2021.753791
Yang, X., Ou, Q., Yang, W., Shi, Y., and Liu, G. (2021). Diagnosis of Liver Cancer by FTIR Spectra of Serum. Spectrochimica Acta Part A: Mol. Biomol. Spectrosc. 263, 120181. doi:10.1016/j.saa.2021.120181
Zhang, H., Chen, C., Ma, C., Chen, C., Zhu, Z., Yang, B., et al. (2021). Feature Fusion Combined with Raman Spectroscopy for Early Diagnosis of Cervical Cancer. IEEE Photon. J. 13 (3), 1–11. doi:10.1109/jphot.2021.3075958
Zhang, M., Fu, Z., Li, G., Hou, X., and Lin, L. (2020). Improving the Analysis Accuracy of Components in Blood by SSP-MCSD and Multi-Mode Spectral Data Fusion. Spectrochimica Acta Part A: Mol. Biomol. Spectrosc. 228, 117778. doi:10.1016/j.saa.2019.117778
Zhao, M., Markiewicz-Keszycka, M., Beattie, R. J., Casado-Gavalda, M. P., Cama-Moncunill, X., O'Donnell, C. P., et al. (2020). Quantification of Calcium in Infant Formula Using Laser-Induced Breakdown Spectroscopy (LIBS), Fourier Transform Mid-infrared (FT-IR) and Raman Spectroscopy Combined with Chemometrics Including Data Fusion. Food Chem. 320, 126639. doi:10.1016/j.foodchem.2020.126639
Keywords: lung cancer, FTIR spectroscopy, Raman spectroscopy, data fusion, wavelet transform
Citation: Yang X, Wu Z, Ou Q, Qian K, Jiang L, Yang W, Shi Y and Liu G (2022) Diagnosis of Lung Cancer by FTIR Spectroscopy Combined With Raman Spectroscopy Based on Data Fusion and Wavelet Transform. Front. Chem. 10:810837. doi: 10.3389/fchem.2022.810837
Received: 08 November 2021; Accepted: 03 January 2022;
Published: 26 January 2022.
Edited by:
Hoang Vu Dang, Hanoi University of Pharmacy, VietnamReviewed by:
Jahan B Ghasemi, University of Tehran, IranCopyright © 2022 Yang, Wu, Ou, Qian, Jiang, Yang, Shi and Liu. This is an open-access article distributed under the terms of the Creative Commons Attribution License (CC BY). The use, distribution or reproduction in other forums is permitted, provided the original author(s) and the copyright owner(s) are credited and that the original publication in this journal is cited, in accordance with accepted academic practice. No use, distribution or reproduction is permitted which does not comply with these terms.
*Correspondence: Gang Liu, Z2xpdTY2QDE2My5jb20=
†These authors have contributed equally to this work
Disclaimer: All claims expressed in this article are solely those of the authors and do not necessarily represent those of their affiliated organizations, or those of the publisher, the editors and the reviewers. Any product that may be evaluated in this article or claim that may be made by its manufacturer is not guaranteed or endorsed by the publisher.
Research integrity at Frontiers
Learn more about the work of our research integrity team to safeguard the quality of each article we publish.