- 1Department of Chemistry, Faculty of Science, University of Guilan, Rasht, Iran
- 2Department of Chemistry and Biochemistry, Texas Tech University, Lubbock, TX, United States
Candida albicans is a pathogenic opportunistic yeast found in the human gut flora. It may also live outside of the human body, causing diseases ranging from minor to deadly. Candida albicans begins as a budding yeast that can become hyphae in response to a variety of environmental or biological triggers. The hyphae form is responsible for the development of multidrug resistant biofilms, despite the fact that both forms have been associated to virulence Here, we have proposed a linear and SPA-linear quantitative structure activity relationship (QSAR) modeling and prediction of Candida albicans inhibitors. A data set that consisted of 60 derivatives of benzoxazoles, benzimidazoles, oxazolo (4, 5-b) pyridines have been used. In this study, that after applying the leverage analysis method to detect outliers’ molecules, the total number of these compounds reached 55. SPA-MLR model shows superiority over the multiple linear regressions (MLR) by accounting 90% of the Q2 of anti-fungus derivatives ‘activity. This paper focuses on investigating the role of SPA-MLR in developing model. The accuracy of SPA-MLR model was illustrated using leave-one-out (LOO). The mean effect of descriptors and sensitivity analysis show that RDF090u is the most important parameter affecting the as behavior of the inhibitors of Candida albicans.
Introduction
Despite significant advances in medicinal chemistry, infectious illnesses caused by fungi continue to be a major danger to public health. Patients with serious diseases, such as neoplasia, and those receiving long-term full parenteral nutrition, should be extra careful. Despite the discovery of several successful antifungal medications over the last 3 decades, there are still unknown molecules with the properties needed to treat systemic yeast infections. As a result, finding new and more effective antimicrobial (Gheidari et al., 2020) medicines is critical, and most of the research program’s efforts are focused on developing new compounds. Miconazole and clotrimazole (Brincker, 1976; Smith, 1976; Rippon, 1982) are imidazole compounds that have demonstrated good clinical efficacy in dermatophytoses and nonsystemic candidiasis. Unfortunately, systemic miconazole usage has been linked to reversible thrombocytosis and anemia, whereas clotrimazole use has been linked to severe gastrointestinal problems. 2-(4-thiazolyl) benzimidazole (I) (thiabendazole)is another imidazole derivative with high clinical effectiveness in the treatment of dermatophytic infections in tropical areas. Since thiabendazole was shown to be useful in the treatment of a number of helmintic illnesses, a number of benzimidazole compounds have been tested for anti-infective properties. kThe most thoroughly investigated of these chemicals is 2-(a-hydroxybenzyl) benzimidazole (II) (HBB), which is a specific inhibitor of RNA-containing Enteroviruses.
HBB has no effect on viral adsorption, penetration, or un-coating, according to mechanism of action studies. Although the specific mechanism of this suppression is yet unknown, the major site of action of this antiviral drug appears to be inhibition of viral RNA synthesis. On the other hand, these drugs’ antiviral efficacy in vivo has been accompanied with symptoms of toxicity. One approach for modifying harmful effects and achieving the required selective activity is to apply structural changes to the basic molecule and create new derivatives or analogues. As a result, a novel series of benzoxazole and oxazolo(4,5-b) pyridine derivatives that are analogues of benzimidazole were investigated for antifungal activity against Candida albicans in this work, and their structures were revealed using instrumental analytical methods. One of the most important methods for predicting the biological activity of unknown compounds based on their molecular structures is quantitative structure-activity relationships (QSAR) (Konovalov et al., 2008). In QSAR/QSPR studies three considerations are very important, the first is the descriptors to ensure that they carry enough information of molecular structure for the interpretation of the activity property, the second is the modeling method employed and most importantly, the validation of QSAR models (Tetko et al., 2008). The use of internal and external validation has recently become a source of heated discussion (Roy et al., 2007). Internal validation is supported by one set of QSAR workers, whereas the other believes that internal validation is insufficient for testing model robustness and that external validation is required. Hawkins et al., the most vocal proponents of internal validation, believe that cross-validation may test model fit and examine whether predictions would hold true with new data not utilized in the model fitting process. They claim that when the sample size is small, keeping a portion of it back for testing is inefficient, and that it is far preferable to employ “computationally more burdensome” leave-one-out cross-validation instead. (Hawkins, 2003; Hawkins et al., 2003). For feature selection in this study, we utilized SPA (successive projections algorithm), which is a forward selection method that starts with one variable and adds a new one at each iteration until N variables are achieved (Hawkins, 2003). SPA is a strategy for selecting minimal collinearity subsets of variables and improving the conditioning of multiple linear regression (MLR) models. This technique was first presented for wavelength selection in spectroscopic data sets, particularly in cases when there is a lot of spectrum overlap (Araújo et al., 2001). It has been shown that MLR models obtained using SPA are superior to PLS models (Partial Least Squares) in various applications such as UV-VIS (Araújo et al., 2001; DantasFilho et al., 2005; Di Nezio et al., 2007; Grünhut et al., 2008), ICP-OES (Kawakami HarropGalvão et al., 2001), FT-IR (Honorato et al., 2005), and NIR spectroscopy (Breitkreitz et al., 2003; Filho et al., 2004). SPA has also been used in a number of classification studies (Pontes et al., 2005; Gambarraneto et al., 2009). The objective of this technique is to pick variables with the least amount of duplicate information content in order to overcome collinearity problems. The following are the SPA stages for the provided initial variable k(0) and the number N:
Step 0. xg = gth column of data matrix Xtrain; g = 1, . . . , nc (prior to the initial iteration (n = 1)).
Step 1. S = {g such that 1 = g = nc and
Step 2. The projection of xg on the subspace orthogonal to xk(n-1):
For all
Step 3. k(n) = arg (max
Step 4.
Step 5. n = n +1, and if n < N go back to Step 1.End: The resulting variables are {k(n); n = 0, . . . , N-1}.Figure 1 depicts the aforementioned processes for the initial iteration of SPA. The approach was originally designed to create multivariate calibration models (Araújo et al., 2001), but it was later broadened to address classification difficulties (Pontes et al., 2005).
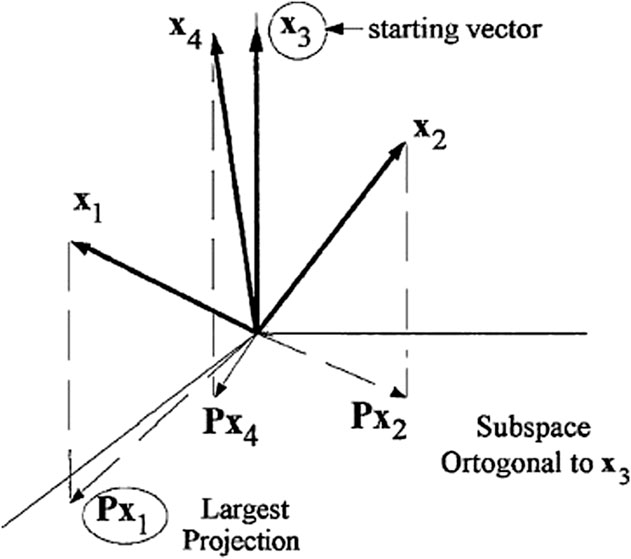
FIGURE 1. Example of SPA with nc = 4 and k (0) = 3. Result of the first iteration: k (Gheidari et al., 2020) = 1.
Materials and Methods
Data Set
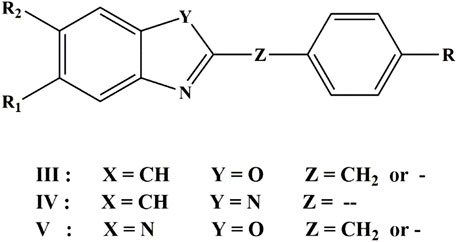
Three classes of compounds investigated in this study are 2,5,6-trisubstituted benzoxazole (III), benzimidazoles(IV) 2-substituted oxazolo (4, 5-b) pyridine (V) derivatives (Yalçin et al., 2000). Figure 2 and Table 1 depicted the chemical structures and logarithmic experimental activity of these compounds. The IC50 activity parameter is a measure of antifungal potency that relates to the molar concentration of each chemical necessary to lower Candida albicans concentration by 50% when compared to the concentration measured in an infected culture. The 3D structures of the investigated compounds were optimized by means of semi-empirical quantum-chemical techniques of AM1 applied in the HyperChem computer software before computing the molecular descriptors (Hyperchem, 1993).
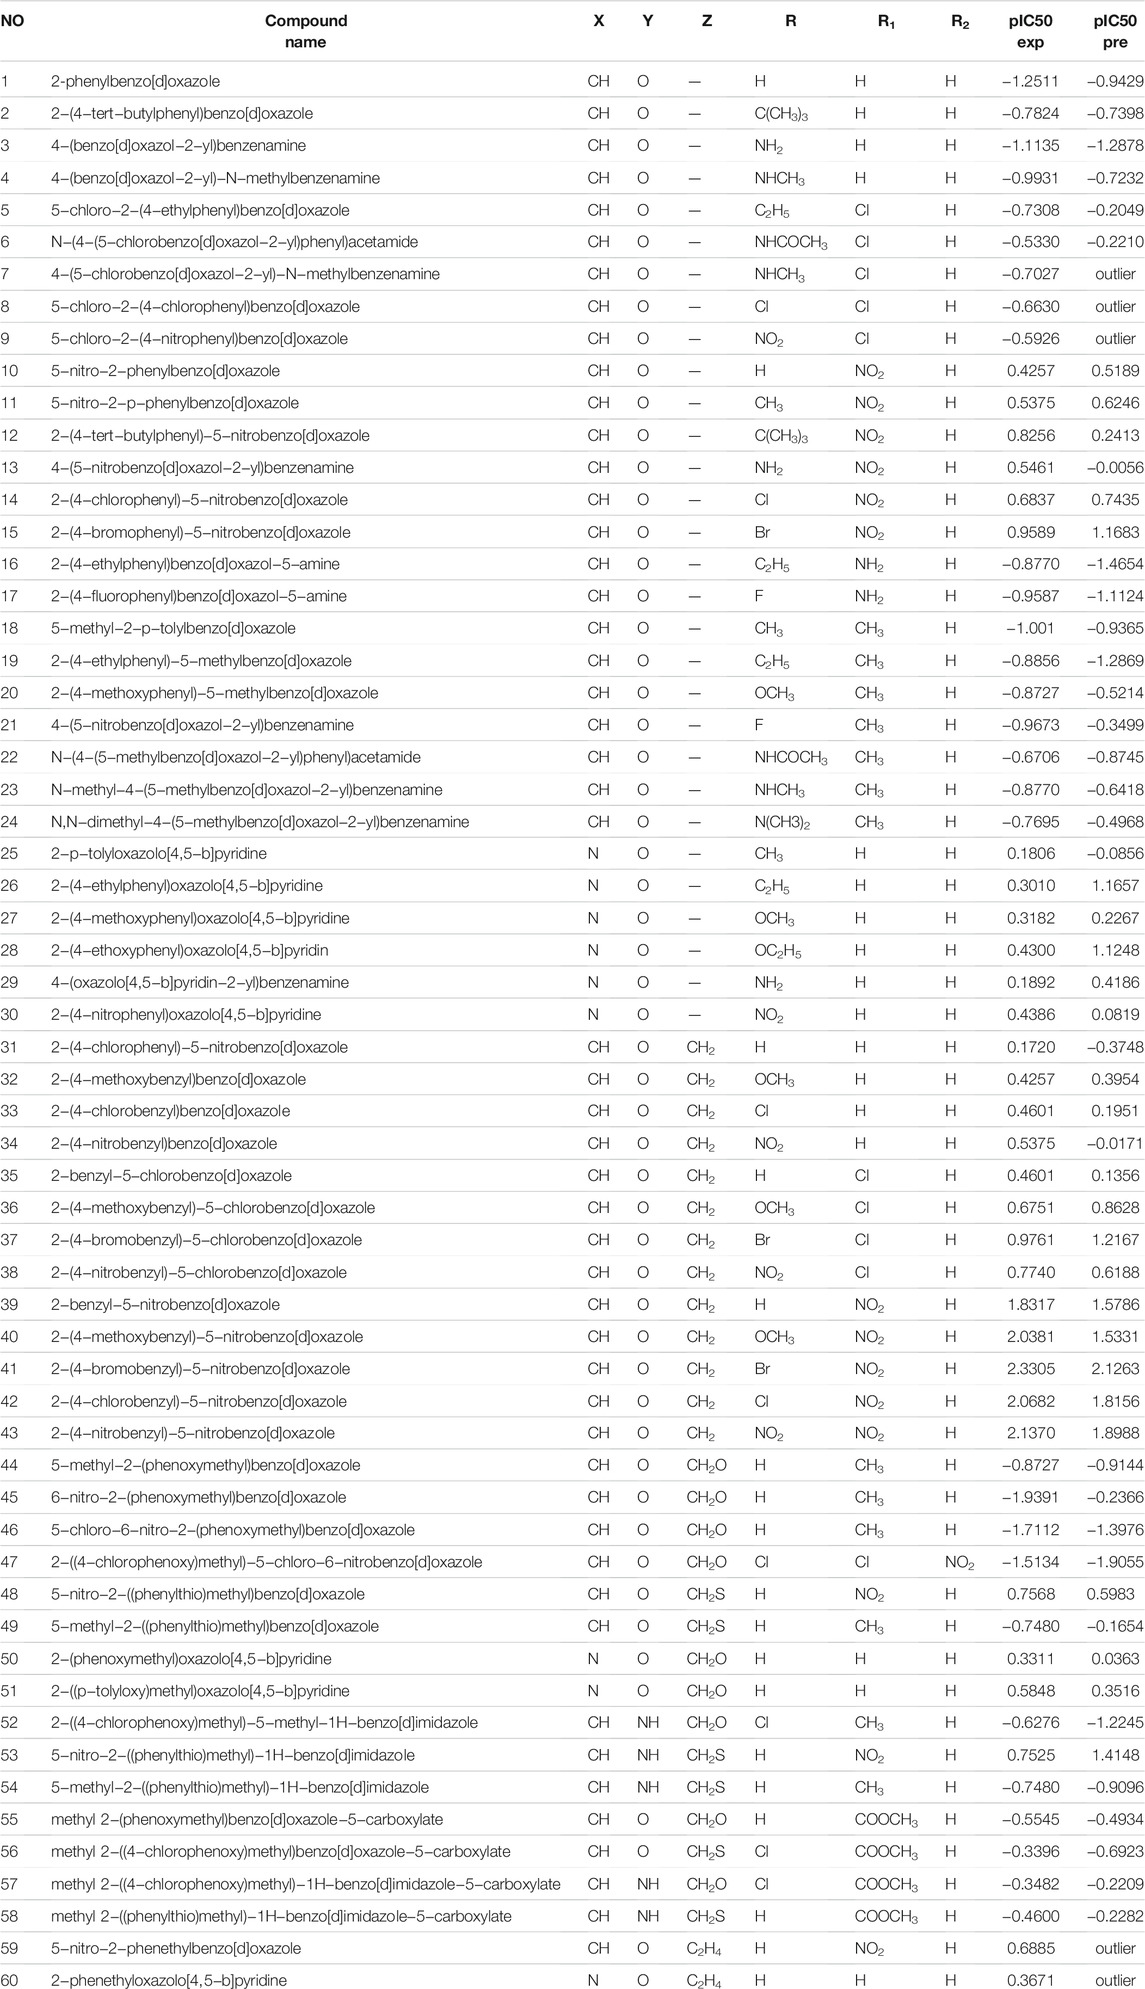
TABLE 1. Chemical structure, experimental activity and predicted activities of the Candida albicans inhibitors.
Molecular Descriptor
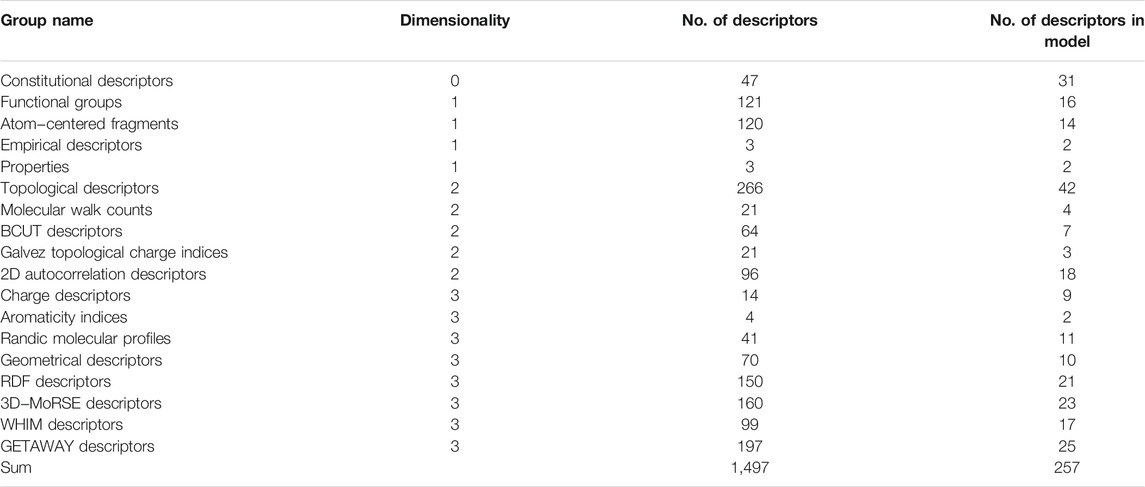
The most essential stage in any QSAR research is the identification and computation of structural descriptors as numerical encoded parameters defining chemical structures. The molecular descriptors in this study were created with Dragon program, version web 3.0 (Todeschini et al., 2003). Several QSAR studies have used the Dragon program to construct chemical descriptors. (Garkani-Nejad et al., 2004; González et al., 2004; González et al., 2005; Khalafi-Nezhad et al., 2005; Liu et al., 2006). Table 2 shows how the computed descriptors were split into 18 categories. It’s worth noting that calculating these descriptors is simple and quick. The average time to compute each structure was about 1 minute. This program has been used to produce a total of 1,497 descriptors for each molecule. For all molecules, descriptors with constant or very constant values were removed. Furthermore, pairs of variables with a correlation coefficient larger than 0.90 were identified as intercorrelated, and only one of them was used in the model development. After eliminating the descriptors with constant and intercorrelated values, a total of 327 descriptors were chosen for further research (Table 3).
Regression Analysis
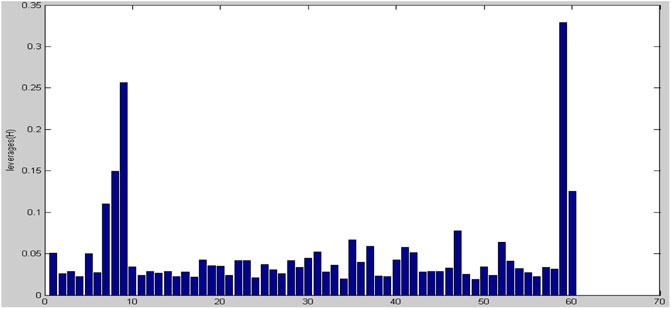
To choose a variable, a Stepwise-MLR technique is utilized. In biological systems, this technique has been utilized for variable selection and model building (Gupta et al., 2005; Leonard and Roy, 2006). The data set has been subdivided in two groups for regression analysis: training and prediction sets, and then a model is produced. In the present study, MLR model has been built by using 60 molecules. the results of statistical parameters: number of descriptors, correlation coefficient (R2), standard error (SE) and F statistic indicated that a series of molecules are very different from model, therefore, in the next stage, we identified outlier molecules. This is, in our view, the first QSAR research to identify outliers using a powerful and scientific method. The leverage analysis approach was utilized to detect outlier data. In order to identify outlier data, Leverage analysis method has been used (Despagne et al.,). In the first step, by making use of PCA, the pCs which had the highest data variance were selected. Since the first two pCs had the above-mentioned condition, they were selected as the main and most important PCs. After this step, Leverage graph was drawn based on the number of samples. As illustrated in Figure 3, samples of 7, 8, 9, 59, and 60 have more Leverage respectively compared to the rest of molecules and they were identified as outlier and omitted.
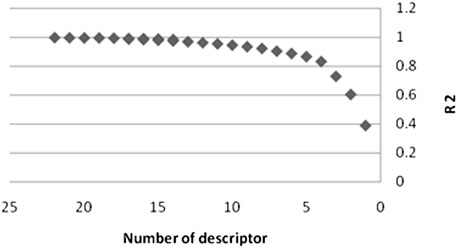
A trustworthy MLR model has strong R2 and F values, a low SE, and the fewest descriptors. Also, a high level of predictability should be present in the model. In addition, the model should have a high level of predictability. As a result, among the many models, the best model was picked, the characteristics of which are listed in Table 3. It is self-evident that as the number of descriptors grows, so does the R2. As illustrates in Figure 4, increasing the number of descriptors has an impact on R2 values.
From this figure one can see that the increase in the number of parameters up to twelve has a strong influence on the improvement of the correlation. As a consequence, we decided that twelve descriptors would be the best number of parameters to use. The descriptors IC2, BEHm8, Qxxe, RDF105m, RDF050v, Mor16u, Mor22u, Mor32u, Mor16m, Mor31m, E2V, and Mor30V exist in this model, and their meanings have been presented in Table 3. These descriptors’ formulas are not presented here for brevity’s sake; however, Dragon software can easily compute them (Todeschini and Consonni, 2000).
The correlation matrix (Table 4) shows that the selected descriptors have a significant degree of correlation, which is a problem for this model. In fact, Low-correlation descriptors should be utilized while creating a model, such that molecular descriptors reflect independent variables.
Results and Discussion
The major purpose of this study was to use SPA to select variables for MLR modeling by developing a QSAR model to estimate the activity parameter (pIC50) of compounds depicted in Figure 1 as Candida albicans inhibitors. It can be seen from this figure and Table 1 that the inhibitors of Candida albicans consisted of three different classes with very diverse substituents. As a result, the creation of a robust and interpretable QSAR model capable of properly predicting the pIC50 is required. As a first step, we created a linear MLR model, the parameters of which are listed in Table 3. This model was created with two objectives in mind. To begin, the appropriate variables were chosen using a Stepwise-MLR technique. Table 3 shows that out of 257 parameters, twelve descriptors of IC2, BEHm8, Qxxe, RDF105m, RDF050v, Mor16u, Mor22u, Mor32u, Mor16m, Mor31m, E2V, and Mor30V were chosen. These descriptors are classed as Information, BCUT, Geometrical, RDF, 3D-MoRSE, and WHIM descriptors. The Detailed descriptions of these descriptors are given in the literature (Todeschini and Consonni, 2000). The model’s second goal was to assess the linear connection between these characteristics and Candida albicans inhibitors’ biological activity. A value of 0.60 for R2Pre of this model reveals that it is able to account 60% of the variances of the pIC50. In reality, the Stepwise-MRL model is ineffective in predicting these compounds’ biological actions. Therefore, these results made us choose a more powerful method for selecting variables. In order to do this, successive projection algorithm was used final selection of descriptors. This study investigates the role of SPA-MLR, which has received little attention from scholars. In this method, at the first the descriptors which have the minimum correlation are selected and then, for final selection of the best model, the MLR method used. In the present study, by making use of this method, a model with thirteen descriptors as the final descriptors was selected whose statistical parameters and the name of its descriptors have been presented in Table 5.
There is no significant association between the selected descriptors, as seen in the correlation matrix (Table 6).
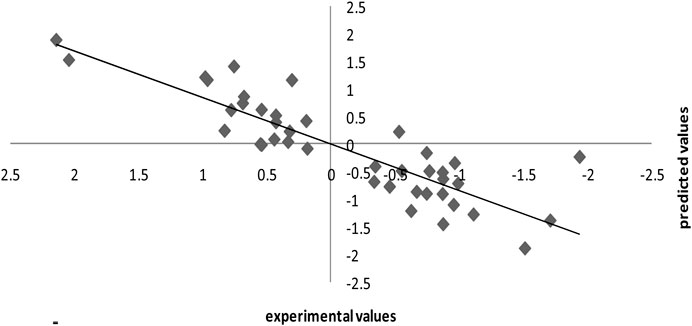
The leave-one-out methodology was also utilized to demonstrate the stability of the model produced using the SPA-MLR method. The dataset (n = 55) was split into a training set of 41 compounds and a test (external assessment) set of 14 compounds using the process randomization approach. From the internal validation technique, the value of Q2 = 0.30 and RMSE = 0.74 was determined. The good results for the SPA-MLR model are not attributable to chance correlation or structural dependency of the training set, according to Q2 and RMSE values. Table 1 shows the observed and SPA-MLR predicted pIC50 values for all inhibitors of Candida albicans investigated in this study. The plot of the SPA-MLR predicted vs experimental pIC50 values for the data set is shown in Figure 5. A correlation coefficient of this plot indicates the reliability of the model.
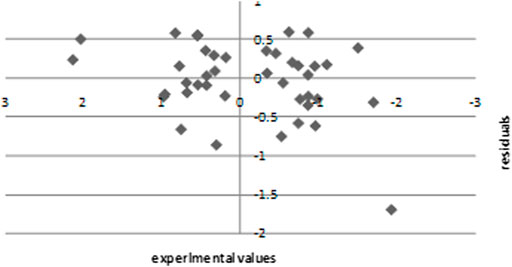
The experimental values are plotted against the residuals of the SPA-MLR calculated values of pIC50 in Figure 6. The propagation of residuals on both sides of the line reveals zero error, indicating that the proposed model has no symmetric error.
In addition, the value of R2pred, REP and SEP was determined using the external validation approach, and these parameters were then utilized to determine the model predictivity. In this study, 25% of the data was chosen for external assessment. Table 7 displays the MLR result for comparing the SPA-MLR model. It can be seen from this Table that the statistical parameters of SEp, REP and Q2LOO have changed considerably. In fact, the SPA-MLR model beats the MLR model, making it ideal for predicting the pIC50 of Candida albicans inhibitors.

TABLE 7. Statistical results of SPA−MLR model compared to Stepwise−MRL model in external validation method.
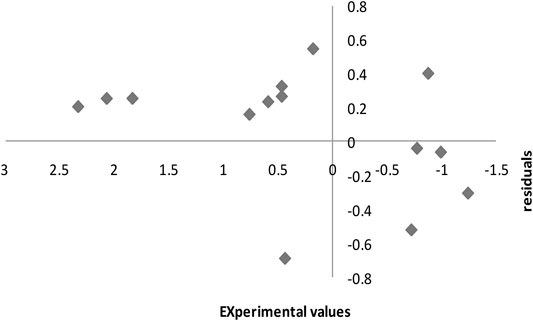
Figure 7 shows the residuals of the SPA-MLR computed pIC50 values in the external assessment technique displayed against the experimental values. The fact that the residuals propagate on both sides of the zero line suggests that the SPA-MLR model was developed without systematic error.
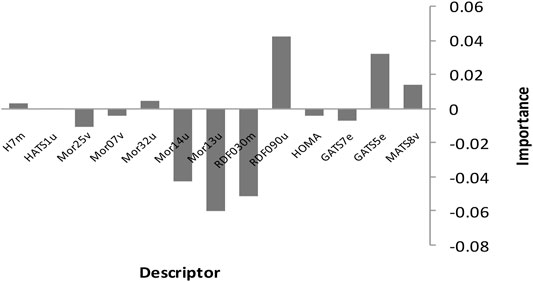
Finally, we employed the suggested linear models to deduce the inhibitors of Candida albicans’ mechanism of action. This implies we should look at the variables that are the most important predictors among the MLR model’s thirteen descriptors. Figure 8 shows the relative mean effect and sensitivity of each variable for the SPA-MLR models. The model show that RDF090u has a significant influence on biological activities of the Candida albicans inhibitors.
Conclusion
The use of QSAR methods has been effective in establishing a mathematical link between inhibitors of Candida albicans and 2D autocorrelations, Geometrical, RDF, 3D-MoRSE, and GETAWAY. The results show that the SPA–MLR model outperforms the Stepwise-MRL models. This is because, unlike regression analysis, SPA–MLR allows for flexible mapping of the chosen characteristics by changing their functional dependency implicitly. This approach enabled us to develop a precise and relatively quick method for determining the IC50 of various antifungal derivative series, as well as to accurately estimate the IC50 of novel antifungal compounds.
Data Availability Statement
The original contributions presented in the study are included in the article/Supplementary Material, further inquiries can be directed to the corresponding authors.
Author Contributions
DG. carried out the literature survey, collected field data; participated in the design of the study, and drafted the manuscript; MM. contributed to the work equally with DG; MG writing—review, and editing.
Conflict of Interest
The authors declare that the research was conducted in the absence of any commercial or financial relationships that could be construed as a potential conflict of interest.
Publisher’s Note
All claims expressed in this article are solely those of the authors and do not necessarily represent those of their affiliated organizations, or those of the publisher, the editors and the reviewers. Any product that may be evaluated in this article, or claim that may be made by its manufacturer, is not guaranteed or endorsed by the publisher.
Acknowledgments
I would like to give special thanks to Ms. Zarafshan Saeidi, Mr. Akbar Gheidari, my Sisters and Brothers for their continuous help, support and encouragement.
References
Araújo, M. C. U., Saldanha, T. C. B., Galvão, R. K. H., Yoneyama, T., Chame, H. C., and Visani, V. (2001). The Successive Projections Algorithm for Variable Selection in Spectroscopic Multicomponent Analysis. Chemometrics Intell. Lab. Syst. 57, 65–73. doi:10.1016/s0169-7439(01)00119-8
Breitkreitz, M. C., Raimundo, Jr, I. M., Rohwedder, J. J. R., Pasquini, C., Dantas Filho, H. A., José, G. E., et al. (2003). Determination of Total Sulfur in Diesel Fuel Employing NIR Spectroscopy and Multivariate Calibration. Analyst 128, 1204–1207. doi:10.1039/b305265f
Brincker, H. (1976). Treatment of Oral Candidiasis in Debilitated Patients with Miconazole-A New Potent Antifungal Drug. Scand. J. Infect. Dis. 8, 117–120. doi:10.3109/inf.1976.8.issue-2.10
Dantas Filho, H. A., Souza, Ê. S. O. N. d., Visani, V., Barros, S. R. R. C. d., Saldanha, T. C. B., Araújo, M. C. U., et al. (2005). Simultaneous Spectrometric Determination of Cu2+, Mn2+ and Zn2+ in Polivitaminic/polimineral Drug Using SPA and GA Algorithms for Variable Selection. J. Braz. Chem. Soc. 16, 58–61. doi:10.1590/s0103-50532005000100009
Despagne, F., Massart, D. L., and Chemo, A. C. (1998). Neural Networks in Multivariate Calibration. Analyst 123, 157r–178r.
Di Nezio, M. S., Pistonesi, M. F., Fragoso, W. D., Pontes, M. J. C., Goicoechea, H. C., Araujo, M. C. U., et al. (2007). Successive Projections Algorithm Improving the Multivariate Simultaneous Direct Spectrophotometric Determination of Five Phenolic Compounds in Sea Water. Microchemical J. 85, 194–200. doi:10.1016/j.microc.2006.04.021
Filho, H. A. D., Galvão, R. K. H., Araújo, M. C. U., da Silva, E. C., Saldanha, T. C. B., José, G. E., et al. (2004). A Strategy for Selecting Calibration Samples for Multivariate Modelling. Chemometrics Intell. Lab. Syst. 72, 83–91. doi:10.1016/j.chemolab.2004.02.008
Gambarraneto, F., Marino, G., Araujo, M., Galvao, R., Pontes, M., Medeiros, E., et al. (2009). Classification of Edible Vegetable Oils Using Square Wave Voltammetry with Multivariate Data Analysis. Talanta 77, 1660–1666. doi:10.1016/j.talanta.2008.10.003
Garkani-Nejad, Z., Karlovits, M., Demuth, W., Stimpfl, T., Vycudilik, W., Jalali-Heravi, M., et al. (2004). Prediction of Gas Chromatographic Retention Indices of a Diverse Set of Toxicologically Relevant Compounds. J. Chromatogr. A. 1028, 287–295. doi:10.1016/j.chroma.2003.12.003
Gheidari, D., Mehrdad, M., Maleki, S., and Hosseini, S. (2020). Synthesis and Potent Antimicrobial Activity of CoFe2O4 Nanoparticles under Visible Light. Heliyon 6, e05058. doi:10.1016/j.heliyon.2020.e05058
González, M. P., Helguera, A. M., and Cabrera, M. A. (2005). Quantitative Structure-Activity Relationship to Predict Toxicological Properties of Benzene Derivative Compounds. Bioorg. Med. Chem. 13, 1775–1781. doi:10.1016/j.bmc.2004.11.059
González, M. P., Helguera, A. M., and Dı́az, H. G. (2004). A TOPS-MODE Approach to Predict Permeability Coefficients. Polymer 45, 2073–2079. doi:10.1016/j.polymer.2003.12.014
Grünhut, M., Centurión, M. E., Fragoso, W. D., Almeida, L. F., de Araújo, M. C. U., and Band, B. S. F. (2008). Flow-batch Technique for the Simultaneous Enzymatic Determination of Levodopa and Carbidopa in Pharmaceuticals Using PLS and Successive Projections Algorithm. Talanta 75, 950–958. doi:10.1016/j.talanta.2007.12.029
Gupta, M. K., Sagar, R., Shaw, A. K., and Prabhakar, Y. S. (2005). CP-MLR Directed QSAR Studies on the Antimycobacterial Activity of Functionalized Alkenols-Topological Descriptors in Modeling the Activity. Bioorg. Med. Chem. 13, 343–351. doi:10.1016/j.bmc.2004.10.025
Hawkins, D. M., Basak, S. C., and Mills, D. (2003). Assessing Model Fit by Cross-Validation. J. Chem. Inf. Comput. Sci. 43, 579–586. doi:10.1021/ci025626i
Hawkins, D. M. (2003). The Problem of Overfitting. J. Chem. Inf. Comput. Sci. 44, 1–12. doi:10.1021/ci0342472
Honorato, F. A., Galvão, R. K. H., Pimentel, M. F., de Barros Neto, B., Araújo, M. C. U., and de Carvalho, F. R. (2005). Robust Modeling for Multivariate Calibration Transfer by the Successive Projections Algorithm. Chemometrics Intell. Lab. Syst. 76, 65–72. doi:10.1016/j.chemolab.2004.09.006
Hyperchem (1993). Molecular Modeling System. Florida: Hyper Cube, Inc. and Auto Desk, Inc. Developed by.
Kawakami Harrop Galvão, R., Fernanda Pimentel, M., Cesar Ugulino Araujo, M., Yoneyama, T., and Visani, V. (2001). Aspects of the Successive Projections Algorithm for Variable Selection in Multivariate Calibration Applied to Plasma Emission Spectrometry. Analytica Chim. Acta 443, 107–115. doi:10.1016/s0003-2670(01)01182-5
Khalafi-Nezhad, A., Soltani Rad, M. N., Mohabatkar, H., Asrari, Z., and Hemmateenejad, B. (2005). Design, Synthesis, Antibacterial and QSAR Studies of Benzimidazole and Imidazole Chloroaryloxyalkyl Derivatives. Bioorg. Med. Chem. 13, 1931–1938. doi:10.1016/j.bmc.2005.01.014
Konovalov, D. A., Llewellyn, L. E., Vander Heyden, Y., and Coomans, D. (2008). Robust Cross-Validation of Linear Regression QSAR Models. J. Chem. Inf. Model. 48, 2081–2094. doi:10.1021/ci800209k
Leonard, J. T., and Roy, K. (2006). QSAR by LFER Model of HIV Protease Inhibitor Mannitol Derivatives Using FA-MLR, PCRA, and PLS Techniques. Bioorg. Med. Chem. 14, 1039–1046. doi:10.1016/j.bmc.2005.09.022
Liu, F., Liang, Y., and Cao, C. (2006). QSPR Modeling of thermal Conductivity Detection Response Factors for Diverse Organic Compound. Chemometrics Intell. Lab. Syst. 81, 120–126. doi:10.1016/j.chemolab.2005.10.004
Pontes, M. J. C., Galvão, R. K. H., Araújo, M. C. U., Moreira, P. N. T., Neto, O. D. P., José, G. E., et al. (2005). The Successive Projections Algorithm for Spectral Variable Selection in Classification Problems. Chemometrics Intell. Lab. Syst. 78, 11–18. doi:10.1016/j.chemolab.2004.12.001
Rippon, J. W. (1982). Medical Mycology; the Pathogenic Fungi and the Pathogenic Actinomycetes. Philadelphia.
Roy, K., Roy, P. P., and Leonard, J. T. (2007). On Some Aspects of Validation of Predictive Quantitative Structure-Activity Relationship Models. Expert Opin. Drug Discov. 2, 1567–1577. doi:10.1517/17460441.2.12.1567
Tetko, I. V., Sushko, I., Pandey, A. K., Zhu, H., Tropsha, A., Papa, E., et al. (2008). Critical Assessment of QSAR Models of Environmental Toxicity against Tetrahymena Pyriformis: Focusing on Applicability Domain and Overfitting by Variable Selection. J. Chem. Inf. Model. 48, 1733–1746. doi:10.1021/ci800151m
Todeschini, R., Consonni, V., Mauri, A., and Pavan, M. (2003). Software Dragon: Calculation of Molecular Descriptors. Milan, Italy: Department of Environmental Sciences, University of Milano-Bicocca, and Talete, srl. Available at: http://disat.unimib.it/chm/Dragon.htm>.
Keywords: Candida albicans, QSAR, biological activity, MLR, benzimidazoles
Citation: Gheidari D, Mehrdad M and Ghahremani M (2021) Azole Compounds as Inhibitors of Candida albicans: QSAR Modelling. Front. Chem. 9:774416. doi: 10.3389/fchem.2021.774416
Received: 11 September 2021; Accepted: 03 November 2021;
Published: 29 November 2021.
Edited by:
Sudip Pan, University of Marburg, GermanyReviewed by:
Mohammed Bouachrine, Moulay Ismail University, MoroccoAlejandro Morales Bayuelo, Universidad del Sinú, Colombia
Copyright © 2021 Gheidari, Mehrdad and Ghahremani. This is an open-access article distributed under the terms of the Creative Commons Attribution License (CC BY). The use, distribution or reproduction in other forums is permitted, provided the original author(s) and the copyright owner(s) are credited and that the original publication in this journal is cited, in accordance with accepted academic practice. No use, distribution or reproduction is permitted which does not comply with these terms.
*Correspondence: Davood Gheidari, ZGF2b29kZ2hlaWRhcmlAcGhkLmd1aWxhbi5hYy5pcmRhdm9vZGdoZWlkYXJpQGdtYWlsLmNvbQ==; Morteza Mehrdad, bS1tZWhyZGFkQGd1aWxhbi5hYy5pcg==, bV9tZWhyZGFkNEB5YWhvby5jb20=
 Davood Gheidari
 Morteza Mehrdad1*