 Vanessa Lautenbach
 Saman Hosseinpour
 Wolfgang Peukert*
95% of researchers rate our articles as excellent or good
Learn more about the work of our research integrity team to safeguard the quality of each article we publish.
Find out more
ORIGINAL RESEARCH article
Front. Chem. , 30 July 2021
Sec. Chemical Physics and Physical Chemistry
Volume 9 - 2021 | https://doi.org/10.3389/fchem.2021.712978
This article is part of the Research Topic Interfacial Water: A Physical Chemistry Perspective, Volume II View all 11 articles
Structural and colloidal stability of proteins at different surfaces and interfaces is of great importance in many fields including medical, pharmaceutical, or material science. Due to their flexibility, proteins tend to respond to their environmental conditions and can undergo structural and conformational changes. For instance, alterations in physiological factors such as temperature, ions concentration, or pH as well as the adsorption to an interface can initiate protein aggregation. Therefore, at different surfaces and interfaces the characterization of the structural and colloidal stability of proteins, which is mainly influenced by their electrostatic and hydrophobic interactions, is of fundamental importance. In this study, we utilized sum frequency generation (SFG) spectroscopy to assess the role of solution pH on the polarity and magnitude of the electric field within the hydration shell of selected model proteins adsorbed to a hydrophobic surface. We used polystyrene (PS) as a model hydrophobic surface and determined the isoelectric point (IEP) of four structurally different model proteins. Comparing the measured IEP of proteins at the PS/solution or air/solution interface with that determined in the bulk solution via zeta potential measurement, we found significant similarities between the IEP of surface adsorbed proteins and those in the bulk aqueous phase. The pH dependence behavior of proteins was correlated to their amino acid composition and degree of hydrophobicity.
Proteins are flexible macromolecules that react sensitively to environmental conditions and external stimulators. For instance, alteration in physiological factors such as temperature, ion concentration, or pH often results in changes in the secondary or tertiary structure of proteins, their solubility, or colloidal stability (Sarkar et al., 2009; Maldonado-Valderrama et al., 2010). Moreover, the adsorption of proteins to different surfaces, e.g., cell membranes and implants in biological systems or pipings during industrial processing, is often accompanied by proteins’ structural and conformational alterations (Yano, 2012; FaulónMarruecos et al., 2018; Mitra, 2020). These changes in protein structure not only affect protein functionality but also may trigger their abnormal folding. For instance, the hydrophobicity of cell membranes can initiate protein aggregation, which is assumed to be the cause of severe neuronal diseases such as Alzheimer’s or Parkinson’s disease (Beyer, 2007; Gonzalez-Garcia et al., 2021; Saghir et al., 2021). Similarly, in downstream processing and adsorption chromatography of proteins irreversible binding of proteins on commercially available hydrophobic adsorbents is accompanied by structural changes in proteins, a process that is influenced by solution pH (Millitzer et al., 2005).
Hence, molecular understanding of the protein behavior at different surfaces and interfaces is of great importance in many fields including biopharmaceutical development, drug targeting, development of implant materials, or biomembrane processing. So far numerous experimental and computational studies have been performed on model proteins such as serum albumin, beta-lactoglobulin, or lysozyme to unravel their specific interactions with different surfaces. Among many parameters that affect protein adsorption, conformation, and stability at different surfaces and interfaces, hydrophobic and electrostatic interactions are considered to be the main factors (van Dulm and Norde, 1983; Norde, 1996; McUmber et al., 2015). Upon interaction with a surface, proteins usually adopt a different conformation than those in the bulk solution, to minimize their free energy. For instance, Roach et al. (2005) showed that increased surface hydrophobicity increases the adsorption affinity of amphiphilic proteins and triggers structural changes. Meanwhile, electrostatic attraction or repulsion not only affect the adsorption of proteins on surfaces but also alters proteins’ structural and conformational stability. The magnitude of electrostatic interactions between proteins and surfaces and between protein molecules can be altered either by the ionic content or the pH value of the surrounding medium. At pH values close to the isoelectric point (IEP), proteins possess a net neutral charge whereas at pH values above and below IEP they exhibit net negative and net positive charge, respectively. The IEP of proteins is strongly influenced by the composition of amino acids, their local distribution in protein structure, as well as the structural conformation of proteins. The latter, as was mentioned earlier, is dependent on the surfaces to which proteins adsorb.
In this work, we address the question of whether the adsorption of proteins at a hydrophobic solid surface leads to a change in electrostatic interactions and consequently to a shift in the isoelectric point of proteins. As previously mentioned, the adsorption as well as the structural and conformational stability of proteins are affected by important factors like electrostatic forces, the structure and dynamics of the hydration layer surrounding proteins, and hydrophobic interactions. However, characterization of protein properties at surfaces and interfaces is experimentally challenging and requires surface sensitive analytical tools to differentiate the overwhelming number of molecules in the bulk phase from those at surfaces and interfaces. Over the last decades, sum frequency generation (SFG) spectroscopy has proven to be a powerful tool for this purpose and SFG has been applied to study proteins at interfaces in numerous cases (Dreesen et al., 2004; Vidal and Tadjeddine, 2005; Zhang et al., 2013; Hosseinpour et al., 2020).
In this work, we present the SFG results of four proteins at the hydrophobic polystyrene (PS)/water interface to assess the polarity and magnitude of the electric field within the hydration shell of the adsorbed proteins on a solid hydrophobic surface. Accordingly, the IEP of each protein was precisely determined at the buried PS/solution interface, by analyzing the SFG spectra of each protein as a function of solution pH. Based on the previous studies on the IEP of proteins in the bulk solutions and at the liquid/air interface, in this study we have selected model proteins with very different hydrophobicity indices and bulk isoelectric points, as these parameters are expected to have the most dominant impacts on protein adsorption and restructuring at hydrophobic surfaces and interfaces.
The comparison between the measured IEP of proteins at the buried PS/solution interface and at the air/solution interface (Guckeisen et al., 2019) as well as with the IEP measured in the bulk solution via zeta potential showed significant similarities between the IEP of proteins in the bulk aqueous phase and those adsorbed at the air/liquid or solid/liquid interface.
For the determination of the IEP at the solid/liquid interface, four proteins were chosen, which differ in terms of their bulk IEP and hydrophobicity (see Table 1). Bovine serum albumin (BSA, A7030), hemoglobin (H7379), and lysozyme (L6876) were purchased from Sigma-Aldrich (St. Louis, Missouri, United States). Antifreeze protein type III (AFP III) was obtained from A/F Protein Inc., Waltham, United States. The proteins were used as received from the manufacturer with no further purification and protein solutions in concentrations of either 0.1 g/L, 1 g/L, or 2 g/L were prepared. The protein concentrations that are used are all below the solubility limit of the corresponding proteins (see Table 1). To keep the ionic strength constant, the desired amount of protein lyophilisate was dissolved in 10 mM NaCl (≥99.8%, Carl Roth GmbH, Karlsruhe, Germany) solution. A QUINTIX64-1S analytical lab balance with the measurement accuracy of 0.1 mg from Sartorius AG (Goettingen, Germany) was used. For each protein, different pH values were set between 1.7 and 11.3 by adding HCl (0.1 M Honeywell™ Fluka™, Thermo Fisher Scientific Inc., Schwerte Germany) and NaOH (0.1 M Merck KGaA, Darmstadt, Germany) to the solution. The pH was determined by a inoLab pH7110 pH meter from WTW (Xylem Analytics Germany Sales GmbH and Co. KG, Weilheim, Germany) equipped with an InLab-Micro-Pro-ISM pH electrode from Mettler Toledo GmbH (Greifensee, Switzerland).
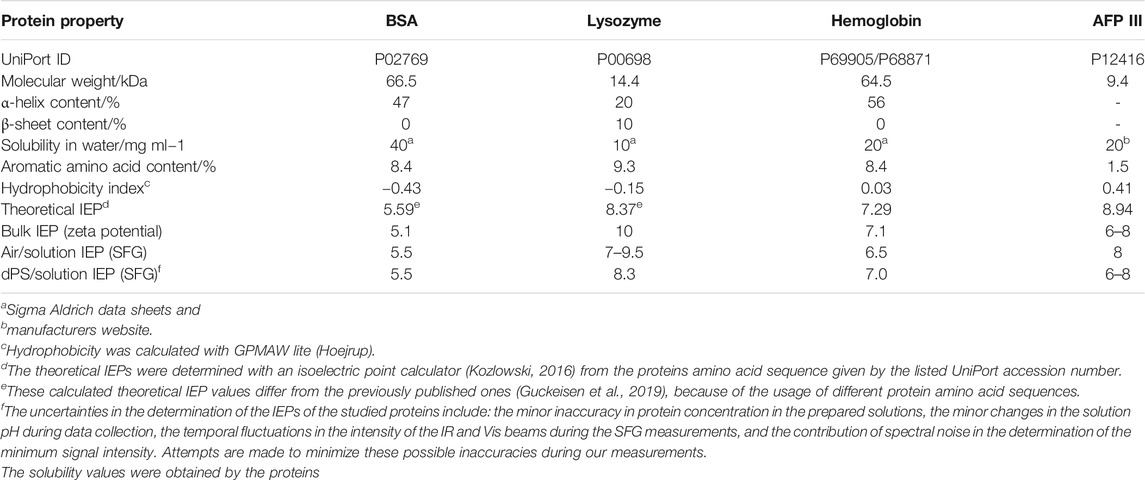
TABLE 1. Different Protein properties and comparison of different IEP.
For the investigation of the proteins on the hydrophobic surface, deuterated polystyrene (dPS, PolymereSource Inc., Dorval, Canada) was spin coated on a CaF2 dove prism (Ma Teck GmbH, Jülich, Germany), following the procedure used by Wang et al. (2003). Before each coating, the prism was ultrasonically cleaned in toluene (≥99.5% VWR, Darmstadt, Germany), ethanol (≥99.8%, VWR, Darmstadt, Germany), and Alconox® (Alconox Inc., NY, United States) solution for 15 min each and finally rinsed with water. After this procedure, the prism was treated for 5 min in an O2 plasma oven (Femto, Diener electronic GmbH + Co. KG, Ebhausen, Germany) in order to remove persistent contaminations from the surface. A stock solution of 2 w% dPS in deuterated toluene (≥99.00%, Sigma-Aldrich, St. Louis, Missouri, United States) was used to coat the prism. After fixing the prism on the spin coater (KLM Spin-Coater SCC, Schaefer Technologie GmbH, Langen, Germany) using a home built holder, 100 µl of dPS solution was added on the large flat side of the cleaned prism. The prism was rotated at 20 rotations per second for 5 s and the coated prism was dried overnight at room temperature. The cleanliness of the dPS layer was controlled by measuring the SFG response at the dPS-air interface in the C-H stretching spectral region.
For the determination of the proteins’ IEP at the interface, SFG spectra were obtained by a broadband SFG spectrometer, which is described in detail elsewhere (Beierlein et al., 2015; Braunschweig et al., 2016). The spatial and temporal overlap of an etalon-narrowed beam in the visible wavelength range [ωvis = 800 nm, full width half maximum (FWHM) ≈ 10 cm−1] and a femtosecond infrared beam (ωIR, FWHM ≈ 200 cm−1) generates an SFG signal (ωSFG = ωvis + ωIR). The IR wavelength was tuned in the frequency range of 2,800–3,800 cm−1 in five steps with 20 s acquisition time per step and accumulations of five for each spectrum. The SFG spectra of proteins on the surface of the dPS coated prism were collected at the total internal reflection (TIR) geometry (See Figure 1), enhancing the signal-to-noise ratio (Zhang et al., 2015). The dPS coated prism was fixed in a home built cell, which allows the change of the height, lateral position, and tilt of the sample surface with high precision. The height of the sample surface was controlled via a laser height sensor (LK-H052, Keyence Corporation, Osaka, Japan). For each protein, a set of different pH solutions were placed successively on top of the dPS coated CaF2 prism. In order to exclude signal deviations due to the possible inhomogeneities in the dPS layer, the series of measurements for one protein were carried out on the same coated prism without changing the spot of the laser irradiation (i.e., without moving the sample). The intensity of the incoming laser beams and the duration of the signal acquisition were adjusted to ensure no laser induced sample damaging occurred during the measurements. All SFG measurements were performed in the SSP (S-polarized SFG signal, S-polarized visible beam, and P-polarized IR beam) polarization combination where S stands for perpendicular and P for parallel to the plane of incidence.
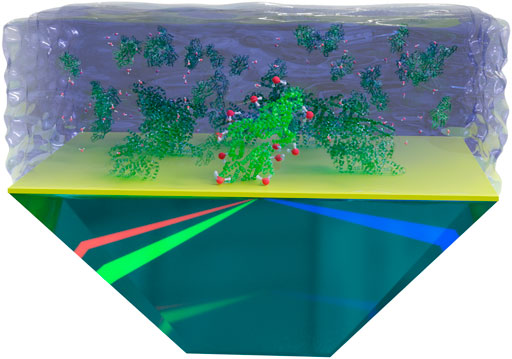
FIGURE 1. A schematic representation of the SFG measurements in the TIR geometry. The dPS layer is depicted in yellow. Proteins and water molecules are depicted out of scale for better visualization. Note that the preferential adsorption sites and the possible rearrangement of proteins upon adsorption to the hydrophobic surface are not considered in this schematic figure.
For the determination of the proteins’ IEP in the bulk phase, the zeta potential for all protein solutions was measured with a Nano ZS Zetasizer instrument (Malvern Instruments, Herrenberg, Germany), in which a folded-capillary cuvette (Malvern Instruments, Malvern, Grovewood, United Kingdom) was used. The temperature was controlled at 25°C and the initial equilibration time was set to 120 s. The zeta potential is correlated with the proteins’ net surface charge (Keppler et al., 2021), hence, the pH value for which the measured zeta potential value reaches 0 mV was determined as the bulk IEP of the corresponding protein. Each sample was measured three times within one measurement cycle and the results were averaged.
In this study, the IEP of four proteins BSA, lysozyme, AFP III, and hemoglobin were investigated in contact with a hydrophobic layer at the dPS-water interface, using SFG spectroscopy. The dPS layer represents an exemplary hydrophobic surface on which the proteins adsorb and react to the different solution pH values. As presented in Table 1, these proteins differ in terms of their IEP in the bulk and their hydrophobicity index, which are the main factors affecting their electrostatic and hydrophobic interactions, respectively. Other important characteristics of the studied proteins such as molecular weights and solubility as well as the content of α-helix and β-sheet in their structures are also provided in Table 1.
Based on the SFG spectroscopy selection rules, to obtain an SFG signal, molecules should reside in a non-centrosymmetric environment, must have a certain degree of order, and should contain vibrations that are simultaneously IR and Raman active. These selection rules provide SFG with an inherent surface sensitivity, which allows detecting surface adsorbed molecules without the inclusion of bulk molecules in the signal.
As demonstrated in Eq. 1 the SFG signal intensity is a function of non-resonant
The non-resonant portion of the SFG signal is frequency independent and the resonant part can be described as a function of the amplitude
The mathematical relation between the oscillator strength
in which the angular brackets refer to an orientational average over all interfacial molecules and
Proteins at pH values above and below their corresponding IEP become negatively or positively charged, respectively. Accordingly, the polar water molecules surrounding proteins adopt a preferential H-up and H-down configuration, with respect to the protein surface. The larger electric field (i.e., proteins with higher net charge) hence aligns a greater number of water molecules with the same orientation resulting in an enhanced SFG signal (see Eq. 2).
Figure 2 shows the recorded SFG spectra of the investigated proteins as a function of the solution pH over a wavenumber range from 2,800 cm−1 to 3,600 cm−1. Multiple vibrational modes can be recognized in this spectral region. Within the interval from 2,800 cm−1 to 3,000 cm−1, the CH vibrations from the proteins side chain amino acids appear, the assignments of which have been provided elsewhere (Chen et al., 2007).
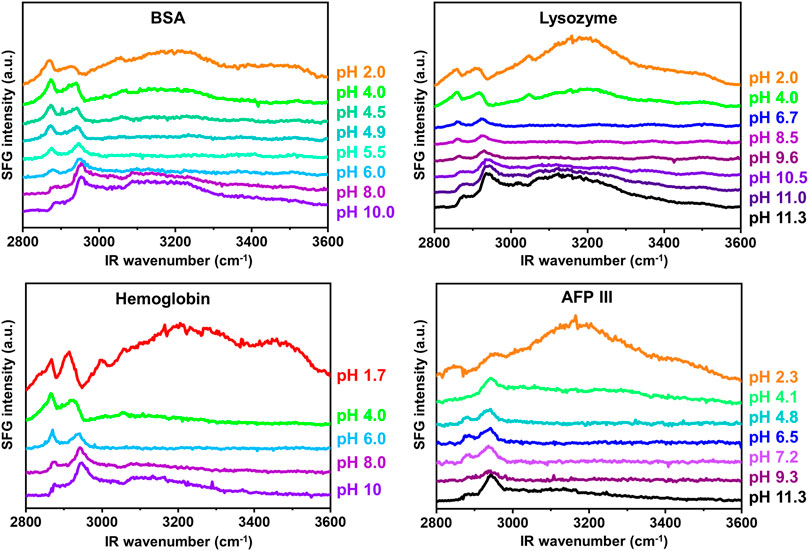
FIGURE 2. pH dependent SFG spectra measured in ssp polarization combination in the wavenumber range of 2,800cm−1 and 3,600 cm−1.
Another peak can be detected at ∼3,060 cm−1, which represents the so-called ring mode and originates from vibrations of the aromatic rings in amino acids such as phenylalanine, tryptophan, and tyrosine. This particular peak is expressed clearly for BSA, lysozyme, and hemoglobin, especially in predominantly acidic or basic pH regimes.
With increasing the solution pH, the ring mode peak undergoes a sign change (from a positive to a negative peak) and its amplitude passes zero during this transition. This observation is consistent with previous publications (Engelhardt et al., 2013; Guckeisen et al., 2019; Wang et al., 2002) and is a consequence of the interference between the proteins’ ring mode vibration and interfacial water, which can be either constructive or destructive depending on the proteins’ net charge (Guckeisen et al., 2019). The transition point of the sign of the ring mode peak is a first approximation for determining the IEP at the interface since the IEP describes the state at which the protein is net uncharged. The measured SFG spectra for AFP III, as demonstrated in Figure 2, do not show significant peak intensity of the ring mode over the whole pH range. Referring to Table 1, it becomes evident that the negligible ring mode SFG signal in the AFP III spectra correlated well with its relatively low content of aromatic amino acids. It should, nevertheless, be noted that the absolute orientation of the ring mode in the structure of proteins would also affect the intensity of the corresponding peaks in their SFG spectra (Naseri et al., 2018).
In the frequency region of 3,100 cm−1 to 3,600 cm−1, broad vibrational modes are observed from the OH stretching vibrations of polar water molecules, which arrange themselves at the buried dPS/solution interface due to the charge state of the protein (Ohshima, 1995; Po and Senozan, 2001; Beierlein et al., 2015). As can be seen in Figure 2, the signal intensity in this frequency region is very sensitive to the change of the solution pH. According to Eqs 1, 2, the SFG signal intensity at this frequency region is mainly influenced by the number density of the ordered interfacial molecules, whose extent of order can be triggered by the pH dependent charge of the proteins. In other words, the higher the absolute charge of proteins, the higher the intensity of the OH SFG signal intensity, because more polar water molecules similarly oriented at the buried dPS/solution interface. At extreme acidic solutions, in which the proteins are predominantly protonated and positively charged, the OH signal intensity reaches a maximum since a large number of water molecules are aligned with oxygen toward the protein at the buried dPS/solution interface. With increasing pH, the OH signal intensity first approaches a minimum and then reaches another maximum at extreme alkaline solutions.
To precisely determine the isoelectric point at the buried dPS/solution interface, the SFG spectra were integrated in the range of 3,100 cm−1 and 3,600 cm−1 and the results are provided in Figure 3. For all proteins, the integrated SFG signal intensity passes through a global minimum, which represents the IEP of the corresponding protein at the buried dPS/solution interface. For comparison, the pH dependent integrated SFG signal intensity of the same proteins at the air/solution interface is also shown in Figure 3 [red curves, right Y-axis, reproduced from Guckeisen et al. (2019)]. As also tabulated in Table 1, a very good agreement exists between the measured IEPs of proteins at the dPS/solution interface and those at the air/solution interface. Interestingly, the measured IEPs of the surface adsorbed proteins (at either dPS/solution or the air/solution interfaces) do not differ from the corresponding theoretically calculated or measured IEPs via Zeta potential measurements (vide infra), which denotes that the electrostatic interactions in the studied proteins are independent of their local environment or the interface to which they adsorb.
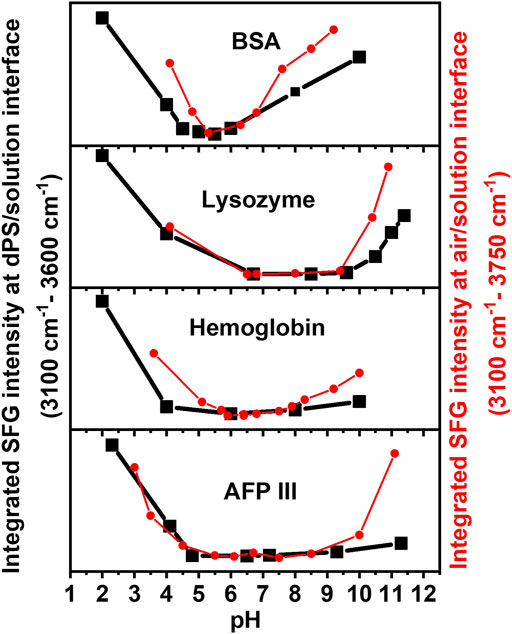
FIGURE 3. Integrated SFG signal intensity in the range between 3,100 cm−1 and 3,600 cm−1 (at the buried dPS/solution interface, black) and between 3,100 cm−1 and 3750 cm−1 (at the air/solution interface, red) for four different proteins. The latter data are reproduced from (Guckeisen et al. (2019)). Adapted with permission from Langmuir 35 (14), 5004–5012. Copyright 2021 American Chemical Society.
Besides the general agreement in the IEPs of the surface adsorbed proteins, there are other similarities and some differences in the observed trends in the integrated SFG signal intensity of the proteins at the dPS/solution and the air/solution interfaces (Figure 3, black and red curves). To some extent, the changes in the integrated SFG signal intensity above and below the IEP of the investigated proteins are asymmetrical, to some extent. Furthermore, the broadness of the region corresponding to the minimum integrated SFG signal (hereafter referred to as “minimum region”) differs for different proteins; it is narrowest for BSA and broadest for AFP III at both the dPS/solution and the air/solution interfaces. The asymmetry of the curves and width of this “minimum region” in Figure 3 correlates with the dissociation constant (pKa) values of the individual ionizable amino acids in the proteins’ primary structure and their structural stability. According to Pace et al., glutamate (Glu), aspartate (Asp), cysteine (Cys), tyrosine (Thr), histidine (His), lysine (Lys), and arginine (Arg) are the predominant ionizable amino acids, which with the exception of cysteine, all have a negative hydrophobicity index and thus belong to the polar amino acids. These amino acids are mainly located in the hydrophilic regions of the protein and are most likely to be in contact with the polar water (Pace et al., 2009; Kozlowski, 2016), as will be discussed in the following. Comparing the results in Table 1 and Figure 3, the role of the amino acid composition of proteins and their hydrophobicity in determining the width of the “minimum region” becomes evident. Narrower “minimum regions” are observed for the proteins in which the pKa of their constituent amino acids are close to each other. Moreover, proteins with a large negative hydrophobicity index (such as BSA) are composed of a higher proportion of polar amino acids and have a more symmetrical and narrower “minimum region.” However, it is noticeable that the black curves (i.e., proteins at the buried dPS/solution interface) in Figure 3 have a slightly flatter “minimum region” compared to the red curves (i.e., proteins at the air/solution interface), a phenomenon which is related to the less hydrophobic nature of air compared to dPS. A possible explanation for this behaviour could be the more pronounced conformational change in the proteins’ structure after the adsorption to the dPS/solution interface. Upon adsorption to a surface, proteins tend to undergo structural changes to minimize their free energy (ΔG). For instance, the adsorption free energy of proteins is reduced by the displacement of the water molecules surrounding the nonpolar amino acid residues that interact with the nonpolar solid surfaces (Rabe et al., 2011; Latour, 2020; Mitra, 2020). As described by Rabe et al. (2011) and Rahimi et al. (2021), depending on the electrostatic interactions between the adsorbing proteins and substrate, as well as the density of the surface, different pathways of adsorption (e.g., cooperative or non-cooperative) can be expected. It is also discussed that proteins adsorb more strongly to hydrophobic surfaces than to hydrophilic surfaces.
The difference between the black and red curves in Figure 3 is more dominant in the basic regime (especially for Lysozyme and AFP III), which is consistent with previous studies showing that proteins at the surface tend to undergo more structural changes in the basic pH regime than in the acidic solutions (Guckeisen et al., 2021).
The similarity between the IEP of the surface adsorbed proteins (either at the dPS/solution or at the air/solution interfaces) and those found in the bulk solution (see Table 1) can also be correlated to the role of hydrophobic side chain amino acids in proteins structure. As provided in this table, for each protein a theoretical hydrophobicity index can be calculated from the hydrophobicity of the individual amino acid constituents. Depending on the type and sequence of amino acids in a protein, they contribute with a negative or positive index to the total hydrophobicity index of the proteins. According to Kyte and Doolittle (1982), amino acids such as isoleucine and valine with a hydrophobicity index value of 4.5 and 4.2 have the highest hydrophobicity and arginine and lysine with the hydrophobicity index value −4.5 and −3.9 have the lowest hydrophobicity, respectively. Comparing the amino acid content in the structure of studied proteins, it became evident that BSA and Lysozyme contain a relatively small amount of hydrophobic amino acids, whereas hemoglobin and AFP III consist mainly out of the hydrophobic valine and are more hydrophobic. BSA and Lysozyme include more amino acids with negative hydrophobicity indices, which are preferably located in the hydrophilic part of the protein and therefore are more probable to come in contact with surrounding water molecules. Di Rienzo et al. developed a computational method to predict the hydrophobicity of amino acid side chains in proteins based on the orientation of surrounding water molecules. They defined four groups of amino acids by applying a principal component analysis and distinguish between negatively charged, positively charged, polar, and nonpolar amino acids. Accordingly, comparing the amino acid content of investigated proteins in this study, it is confirmed that hemoglobin and AFP III consists mainly out of hydrophobic amino acids whereas in BSA and Lysozyme most prevalent amino acids belong to the charged group (Di Rienzo et al., 2021).
In the bulk aqueous phase, hydrophobic amino acids of proteins are preferentially localized in the hydrophobic inner part of the protein, away from the surrounding water molecules (Janin, 1979). Similarly, at both dPS/solution interface and air/solution interface, primary interactions take place between the nonpolar parts of the protein and the hydrophobic interface. Therefore, the hydrophobic side chains of the surface adsorbed proteins protrude toward the hydrophobic phase (i.e., dPS or air, respectively), whereas the hydrophilic side chains face toward polar water molecules. Hence, these hydrophilic amino acids contribute the most to the electrostatic interactions with the surrounding medium or with other protein molecules, whereas the shielded hydrophobic amino acids (in the core of bulk proteins, or those protruding to hydrophobic dPS or air) do not come into the direct contact with water and have minor effects on the overall electrostatic interactions in protein systems. Indeed, reorientation of the proteins and the change in their secondary and tertiary structure are also plausible under these conditions to minimize the overall free energy of the system. Using coarse grain protein simulations, Zhao and Cieplak show that proteins are twisted at both air/solution and oil/solution interface and support the explanation for the equality of the IEPs given in this paper (Cieplak et al., 2014; Zhao and Cieplak, 2017).
In this study, we utilized an inherently surface sensitive nonlinear spectroscopic tool, sum frequency generation (SFG) spectroscopy, to assess the impact of solution pH on selected model proteins adsorbed at a solid hydrophobic surface. Deuterated polystyrene (dPS) was used as a model hydrophobic surface and the changes in the polarity and magnitude of the induced electric field at the dPS/solution interface were utilized as a function of the solution pH to determine the IEP of surface adsorbed proteins.
The measured IEPs for proteins adsorbed to the dPS/solution interface were comparable to those at the air/solution interface and IEPs measured for proteins in the bulk solution. The IEP of proteins and the trends in the change of the electrostatic interactions in proteins as a function of solution pH were described based on the amino acid content and hydrophobicity of the studied proteins. Our results indicate that the IEP of proteins is mainly dependent on the polar amino acids in their structure, which are similarly accessible to surrounding water molecules in the bulk solution and at the PS/solution or air/solution interface, despite the possible reorganization of proteins and changes in their secondary structure upon adsorption to hydrophobic interfaces.
The datasets presented in this study can be found in online repositories. The names of the repository/repositories and accession number(s) can be found below: https://www.uniprot.org/, BSA: P02769 Lsyozyme: P00698 Hemoglobin: P69905/P68871 AFP III: P12416.
VL: Investigation, Formal analysis, Writing Original Draft, Visualization. SH: Conceptualization, Writing Original Draft, Review and Editing, Visualization, Supervision. WP: Funding acquisition, Review and Editing, Supervision, Resources.
The authors declare that the research was conducted in the absence of any commercial or financial relationships that could be construed as a potential conflict of interest.
All claims expressed in this article are solely those of the authors and do not necessarily represent those of their affiliated organizations, or those of the publisher, the editors and the reviewers. Any product that may be evaluated in this article, or claim that may be made by its manufacturer, is not guaranteed or endorsed by the publisher.
The authors gratefully thank the financial support provided by the German Research Foundation (DFG) priority program, SPP 1934 “DiSPBiotech–Dispersity, structural, and phase modifications of proteins and biological agglomerates in biotechnological processes” and the Cluster of Excellence Engineering of Advanced Materials–Hierarchical Structure Formation for Functional Devices (EAM).
Beierlein, F. R., Clark, T., Braunschweig, B., Engelhardt, K., Glas, L., and Peukert, W. (2015). Carboxylate Ion Pairing with Alkali-Metal Ions for β-Lactoglobulin and its Role on Aggregation and Interfacial Adsorption. J. Phys. Chem. B 119 (17), 5505–5517. doi:10.1021/acs.jpcb.5b01944
Beyer, K. (2007). Mechanistic Aspects of Parkinson's Disease: α-synuclein and the Biomembrane. Cell Biochem Biophys 47 (2), 285–299. doi:10.1007/s12013-007-0014-9
Braunschweig, B., Schulze-Zachau, F., Nagel, E., Engelhardt, K., Stoyanov, S., Gochev, G., et al. (2016). Specific Effects of Ca2+ions and Molecular Structure of β-lactoglobulin Interfacial Layers that Drive Macroscopic Foam Stability. Soft matter 12 (27), 5995–6004. doi:10.1039/c6sm00636a
Chen, X., Sagle, L. B., and Cremer, P. S. (2007). Urea Orientation at Protein Surfaces. J. Am. Chem. Soc. 129 (49), 15104–15105. doi:10.1021/ja075034m–15105
Cieplak, M., Allan, D. B., Leheny, R. L., and Reich, D. H. (2014). Proteins at Air-Water Interfaces: a Coarse-Grained Model. Langmuir 30 (43), 12888–12896. doi:10.1021/la502465m
Das, S., Bonn, M., and Backus, E. H. G. (2019). The surface affinity of cations depends on both the cations and the nature of the surface. J. Chem. Phys. 150, 44706. doi:10.1063/1.5065075
Di Rienzo, L., Miotto, M., Bò, L., Ruocco, G., Raimondo, D., and Milanetti, E. (2021). Characterizing Hydropathy of Amino Acid Side Chain in a Protein Environment by Investigating the Structural Changes of Water Molecules Network. Front. Mol. Biosci. 8, 626837. doi:10.3389/fmolb.2021.626837
Dreesen, L., Humbert, C., Sartenaer, Y., Caudano, Y., Volcke, C., Mani, A. A., et al. (2004). Electronic and Molecular Properties of an Adsorbed Protein Monolayer Probed by Two-Color Sum-Frequency Generation Spectroscopy. Langmuir 20 (17), 7201–7207. doi:10.1021/la0488001
Engelhardt, K., Lexis, M., Gochev, G., Konnerth, C., Miller, R., Willenbacher, N., et al. (2013). pH Effects on the Molecular Structure of β-Lactoglobulin Modified Air-Water Interfaces and its Impact on Foam Rheology. Langmuir 29 (37), 11646–11655. doi:10.1021/la402729g
Faulón Marruecos, D., Schwartz, D. K., and Kaar, J. L. (2018). Impact of Surface Interactions on Protein Conformation. Curr. Opin. Colloid Interf. Sci. 38, 45–55. doi:10.1016/j.cocis.2018.08.002
Gonzalez-Garcia, M., Fusco, G., and De Simone, A. (2021). Membrane Interactions and Toxicity by Misfolded Protein Oligomers. Front. Cel Dev. Biol. 9 (2021), 642623. doi:10.3389/fcell.2021.642623
Guckeisen, T., Hosseinpour, S., and Peukert, W. (2021). Effect of pH and Urea on the Proteins Secondary Structure at the Water/air Interface and in Solution. J. Colloid Interf. Sci. 590, 38–49. doi:10.1016/j.jcis.2021.01.015
Guckeisen, T., Hosseinpour, S., and Peukert, W. (2019). Isoelectric Points of Proteins at the Air/Liquid Interface and in Solution. Langmuir 35 (14), 5004–5012. doi:10.1021/acs.langmuir.9b00311
Hoejrup, P. GPMAW Lite. Available at: https://www.alphalyse.com/gpmaw-bioinformatics-tool/start-gpmaw-lite/. (Accessed May 21, 2021).
Hosseinpour, S., Roeters, S. J., Bonn, M., Peukert, W., Woutersen, S., and Weidner, T. (2020). Structure and Dynamics of Interfacial Peptides and Proteins from Vibrational Sum-Frequency Generation Spectroscopy. Chem. Rev. 120 (7), 3420–3465. doi:10.1021/acs.chemrev.9b00410
Janin, J. (1979). Surface and inside Volumes in Globular Proteins. Nature 277 (5696), 491–492. doi:10.1038/277491a0
Keppler, J. K., Heyse, A., Scheidler, E., Uttinger, M. J., Fitzner, L., Jandt, U., et al. (2021). Towards Recombinantly Produced Milk Proteins: Physicochemical and Emulsifying Properties of Engineered Whey Protein Beta-Lactoglobulin Variants. Food Hydrocolloids 110 (4), 106132. doi:10.1016/j.foodhyd.2020.106132
Kozlowski, L. P. (2016). IPC - Isoelectric Point Calculator. Biol. Direct 11 (1), 55. doi:10.1186/s13062-016-0159-9
Kyte, J., and Doolittle, R. F. (1982). A Simple Method for Displaying the Hydropathic Character of a Protein. J. Mol. Biol. 157 (1), 105–132. doi:10.1016/0022-2836(82)90515-0
Latour, R. A. (2020). Fundamental Principles of the Thermodynamics and Kinetics of Protein Adsorption to Material Surfaces. Colloids Surf. B: Biointerfaces 191, 110992. doi:10.1016/j.colsurfb.2020.110992
Maldonado-Valderrama, J., Miller, R., Fainerman, V. B., Wilde, P. J., and Morris, V. J. (2010). Effect of Gastric Conditions on β-Lactoglobulin Interfacial Networks: Influence of the Oil Phase on Protein Structure. Langmuir 26 (No. 20), 15901–15908. doi:10.1021/la102294u
McUmber, A. C., Randolph, T. W., and Schwartz, D. K. (2015). Electrostatic Interactions Influence Protein Adsorption (But Not Desorption) at the Silica-Aqueous Interface. J. Phys. Chem. Lett. 6 (13), 2583–2587. doi:10.1021/acs.jpclett.5b00933
Millitzer, M., Wenzig, E., and Peukert, W. (2005). Adsorption Isotherms and Irreversible Binding of Proteins on Commercially Available Hydrophobic Adsorbents. Chem. Eng. Technol. 28 (7), 756–761. doi:10.1002/ceat.200500072
Mitra, Sankar. P. (2020). Protein Adsorption on Biomaterial Surfaces: Subsequent Conformational and Biological Consequences -A Review. J. Surf. Sci. Technol. 36, 7–38. doi:10.18311/jsst/2020/23282
Naseri, E., Hajisafari, M., Kosari, A., Talari, M., Hosseinpour, S., and Davoodi, A. (2018). Inhibitive Effect of Clopidogrel as a green Corrosion Inhibitor for Mild Steel; Statistical Modeling and Quantum Monte Carlo Simulation Studies. J. Mol. Liquids 269 (4), 193–202. doi:10.1016/j.molliq.2018.08.050
Norde, W. (1996). Driving Forces for Protein Adsorption at Solid Surfaces. Macromolecular Symposia 103 (1), 5–18. doi:10.1002/masy.19961030104
Ohshima, H. (1995). Electrophopretic Mobility of Soft Particles. Electrophoresis 16 (8), 1360–1363. doi:10.1002/elps.11501601224
Pace, C. N., Grimsley, G. R., and Scholtz, J. M. (2009). Protein Ionizable Groups: pK Values and Their Contribution to Protein Stability and Solubility. J. Biol. Chem. 284 (20), 13285–13289. doi:10.1074/jbc.R800080200
Po, H. N., and Senozan, N. M. (2001). The Henderson-Hasselbalch Equation: Its History and Limitations. J. Chem. Educ. 78 (11), 1499. doi:10.1021/ed078p1499
Rabe, M., Verdes, D., and Seeger, S. (2011). Understanding Protein Adsorption Phenomena at Solid Surfaces. Adv. Colloid Interf. Sci. 162 (1-2), 87–106. doi:10.1016/j.cis.2010.12.007
Rahimi, E., Offoiach, R., Hosseinpour, S., Davoodi, A., Baert, K., Lutz, A., et al. (2021). Effect of Hydrogen Peroxide on Bovine Serum Albumin Adsorption on Ti6Al4V alloy: A Scanning Kelvin Probe Force Microscopy Study. Appl. Surf. Sci. 563 (1), 150364. doi:10.1016/j.apsusc.2021.150364
Richmond, G. L. (2002). Molecular Bonding and Interactions at Aqueous Surfaces as Probed by Vibrational Sum Frequency Spectroscopy. Chem. Rev. 102 (8), 2693–2724. doi:10.1021/cr0006876
Roach, P., Farrar, D., and Perry, C. C. (2005). Interpretation of Protein Adsorption: Surface-Induced Conformational Changes. J. Am. Chem. Soc. 127 (22), 8168–8173. doi:10.1021/ja042898o
Saghir, A. E., Farrugia, G., and Vassallo, N. (2021). The Human Islet Amyloid Polypeptide in Protein Misfolding Disorders: Mechanisms of Aggregation and Interaction with Biomembranes. Chem. Phys. Lipids 234 (2021), 105010. doi:10.1016/j.chemphyslip.2020.105010
Sarkar, A., Goh, K. K. T., and Singh, H. (2009). Colloidal Stability and Interactions of Milk-Protein-Stabilized Emulsions in an Artificial Saliva. Food Hydrocolloids 23 (No. 5), 1270–1278. doi:10.1016/j.foodhyd.2008.09.008
Shen, Y. R., and Ostroverkhov, V. (2006). Sum-frequency Vibrational Spectroscopy on Water Interfaces: Polar Orientation of Water Molecules at Interfaces. Chem. Rev. 106 (4), 1140–1154. doi:10.1021/cr040377d
van Dulm, P., and Norde, W. (1983). The Adsorption of Human Plasma Albumin on Solid Surfaces, with Special Attention to the Kinetic Aspects. J. Colloid Interf. Sci. 91 (1), 248–255. doi:10.1016/0021-9797(83)90329-6
Vidal, F., and Tadjeddine, A. (2005). Sum-frequency Generation Spectroscopy of Interfaces. Rep. Prog. Phys. 68 (5), 1095–1127. doi:10.1088/0034-4885/68/5/R03
Wang, J., Buck, S. M., and Chen, Z. (2002). Sum Frequency Generation Vibrational Spectroscopy Studies on Protein Adsorption. J. Phys. Chem. B 106 (44), 11666–11672. doi:10.1021/jp021363j
Wang, J., Even, M. A., Chen, X., Schmaier, A. H., Waite, J. H., and Chen, Z. (2003). Detection of Amide I Signals of Interfacial Proteins In Situ Using SFG. J. Am. Chem. Soc. 125 (33), 9914–9915. doi:10.1021/ja036373s
Yano, Y. F. (2012). Kinetics of Protein Unfolding at Interfaces. J. Phys. Condens. Matter 24 (50), 503101. doi:10.1088/0953-8984/24/50/503101
Zhang, C., Jasensky, J., and Chen, Z. (2015). Multireflection Sum Frequency Generation Vibrational Spectroscopy. Anal. Chem. 87 (16), 8157–8164. doi:10.1021/acs.analchem.5b00641
Zhang, C., Myers, J. N., and Chen, Z. (2013). Elucidation of Molecular Structures at Buried Polymer Interfaces and Biological Interfaces Using Sum Frequency Generation Vibrational Spectroscopy. Soft matter 9, 4738–4761. doi:10.1039/C3SM27710K
Keywords: proteins, isoelectric point, sum frequency generation spectroscopy, surface hydrophobicity, zeta potential
Citation: Lautenbach V, Hosseinpour S and Peukert W (2021) Isoelectric Point of Proteins at Hydrophobic Interfaces. Front. Chem. 9:712978. doi: 10.3389/fchem.2021.712978
Received: 21 May 2021; Accepted: 19 July 2021;
Published: 30 July 2021.
Edited by:
Yoshihisa Harada, University of Tokyo, JapanReviewed by:
Rekha Gaba, DAV University, IndiaCopyright © 2021 Lautenbach, Hosseinpour and Peukert. This is an open-access article distributed under the terms of the Creative Commons Attribution License (CC BY). The use, distribution or reproduction in other forums is permitted, provided the original author(s) and the copyright owner(s) are credited and that the original publication in this journal is cited, in accordance with accepted academic practice. No use, distribution or reproduction is permitted which does not comply with these terms.
*Correspondence: Saman Hosseinpour, c2FtYW4uaG9zc2VpbnBvdXJAZmF1LmRl; Wolfgang Peukert, d29sZmdhbmcucGV1a2VydEBmYXUuZGU=
†These authors have contributed equally to this work and share first authorship
Disclaimer: All claims expressed in this article are solely those of the authors and do not necessarily represent those of their affiliated organizations, or those of the publisher, the editors and the reviewers. Any product that may be evaluated in this article or claim that may be made by its manufacturer is not guaranteed or endorsed by the publisher.
Research integrity at Frontiers
Learn more about the work of our research integrity team to safeguard the quality of each article we publish.