 Rui Zhang
 Wenjing Peng
 Sakshi Gautam2
 Yehia Mechref
 Haixu Tang
- 1Department of Computer Science, Luddy School of Informatics, Computing, and Engineering, Indiana University Bloomington, Bloomington, IN, United States
- 2Department of Chemistry and Biochemistry, Texas Tech University, Lubbock, TX, United States
The retention time provides critical information for glycan annotation and quantification from the Liquid Chromatography Mass Spectrometry (LC-MS) data. However, the variation of the precise retention time of glycans is highly dependent on the experimental conditions such as the specific separating columns, MS instruments and/or the buffer used. This variation hampers the exploitation of retention time for the glycan annotation from LC-MS data, especially when inter-laboratory data are compared. To incorporate the retention time of glycan across experiments, Glucose Unit Index (GUI) can be computed using the dextrin ladder as internal standard. The retention time of glycans are then calibrated with respect to glucose units derived from dextrin ladders. Despite the successful application of the GUI approach, the manual calibration process is quite tedious and often error prone. In this work, we present a standalone software tool GlycanGUI, with a graphic user interface to automatically carry out the GUI-based glycan annotation/quantification and subsequent data analysis. When tested on experimental data, GlycanGUI reported accurate GUI values compared with manual calibration, and thus is ready to be used for automated glycan annotation and quantification using GUI.
1 Introduction
Glycosylation is a post-translational modification that plays critical roles in important biological processes such as immune response, cellular differentiation/adhesion and host-pathogen interactions (Varki et al., 2009). The aberrant alteration of glycan structure is implicit with malfunction of cells and possesses potential significance for the medical diagnosis of complex human diseases such as cancer (Ohtsubo and Marth, 2006; Pinho and Reis, 2015; Stowell et al., 2015). The Liquid Chromatography coupled Mass Spectrometry (LC-MS) is one of the most widely used techniques for glycan analysis due to its high sensitivity and throughput (Pabst and Altmann, 2011). For a chromatography, the elution order of glycans is consistent and reproducible among experiments. Hence, the retention time is often used to assess the separation of glycans and to assist glycan identification (Pabst and Altmann, 2011). However, the precise retention time of a specific glycan may vary widely depending on the experimental conditions such as the separating columns, MS instruments and/or the buffer used. This variation hampers the interpretation of LC-MS/MS data, especially when inter-laboratory data are compared without any calibrations.
To address this issue, the Glucose Unit Index (GUI) can be utilized to normalize the retention time that eliminates the variation (Mellis and Baenziger, 1981). This method employs the dextrin ladder as the internal standard and measures the retention time of glycans with respect to the glucose units derived from the dextrin ladder. The retention time is assigned to a glucose unit (GU) value, which serves as a calibration of different experiments. The GUI approach was proposed for glycomics (Campbell et al., 2008; Stockmann et al., 2013; Abrahams et al., 2018) and has been extensively used for the normalization of retention time of glycans (Ashwood et al., 2020; Gautam et al., 2020; Fabini et al., 2001; Van den Steen et al., 2006; Royle et al., 2008). In our previous study, we examined the use of permethylated dextrin for the annotation of permethylated N-glycans and their isomers derived from standard glycoproteins and human blood serum (Gautam et al., 2020). The calibrated GUI was proved to be reproducible across inter- and intra-laboratory analyses (Gautam et al., 2020).
Despite the successful application of the GUI approach, the calibration process is quite tedious, which requires manual data processing such as peak finding and curve fitting (Ashwood et al., 2019). In this paper, we present a standalone software tool GlycanGUI to automate the whole calibration process. GlycanGUI offers a graphic user interface for users to choose logarithmic or polynomial fitting that will be used in the automatic calibration of the retention time of glycan ions. Furthermore, GlycanGUI implemented the computational procedures improved from those previously developed in GlycoHybridSeq (Zhang et al., 2021) for automated glycan annotation and label-free quantification based on the total peak area of glycan ions with various charges and abducts. Therefore, GlycanGUI is ready to be used for large-scale comparative analyses of glycan abundances across many glycomic samples.
2 Method
2.1 Experimental Data
The data were obtained from the dextrin spiked human blood serum using LC-MS according to the previously published experimental protocols (Gautam et al., 2020). Briefly, 1 μg of dextrin was spiked as an internal standard in initial 10 μl serum before permethylation. For each injection, the released N-glycans from 1 μl of the initialserum sample were resuspended in 6 μl of 20% ACN and 0.1%FA. For C18 columns, solution A was 98% water, 2% ACN, and 0.1% FA and solution B was 100% ACN and 0.1% FA. The gradient started at 20% solution B and increased to 42% in 11 min. After 48 min, it reached 55% and increased to 90% in 1 min. The organic phase remained at 90% for 54 min and decreased to 20% for 6 min. The LC-MS data were acquired by using LTQ Orbitrap Velos (Thermo Scientific) instrument.
2.2 GlycoGUI Software
The software GlycoGUI was implemented in C# using the WPF framework for graphic user interface. After GlycoGUI reads the input LC-MS data (in thermo. raw format) using the MSFileReader library, a user can calibrate the retention time of any annotated glycans into the corresponding GUI value. The abundances (peak areas) of the glycans are computed over retention time and specifically for the detected retention range of major isomers. The source code of GlycanGUI can be found on Github at https://github.com/ruizhang84/GlycanGUIApp.
2.3 Glucose Units Identification
The ions corresponding to Glucose Units are extracted directly from the full MS spectra based on their expected mass-to-charge-ratio (m/z). Due to the instrumental noise and overlapping peaks, multiple putative glucose units (of different m/z) may be extracted at a specific retention time. To correctly label glucose units and avoid mis-identified glucose units, a dynamic programming algorithm is implemented to obtain the most likely sequence of glucose units. Briefly, a score is computed recursively for all glucose units at each retention time where a putative glucose unit (i.e., dextrin) is observed, which is based on the intensity of the peak matching the dextrin:
where i is the index for the observed retention time, u is the index of the glucose units. This equation is derived based on the fact that the higher glucose units (dextrin) always elute at a latter time than the lower units, as well as the assumption that the true peaks of the glucose units are likely more intensive than those false peaks. After identifying peaks corresponding to the glucose units in each experimental MS spectrum, the retention time with highest peak intensity for each glucose unit is used for curve fitting.
2.4 Curve Fitting
To calibrate the retention time of ion species into a glucose unit index (GUI), we adopt a polynomial regression,
where for an ion species ion i,
or simply in the vector form as,
Using the least square estimation, the coefficients are computed as,
where
2.5 Glycan Annotation and Label-free Quantification
We adopted the algorithm used for glycan annotation similar to one implemented in GlycoHybridSeq (Zhang et al., 2021). Briefly, the potential N-glycans are pre-computed with up to a certain maximum number of monosaccharide residues (by default, #HexNAc
where
To assess the abundance of a glycan, the extracted-ion chromatogram (XIC) of glycan ion is generated by GlycanGUI by searching theoretical m/z over all full-MS spectra (as described above) and measuring the corresponding peak area at each retention time. The peak area is computed from the combined intensity of top three isotope peaks, which is adopted from the concept of top three-isotopes quantification (3TIQ) algorithm (Park et al., 2016). It is reported that considering top three isotope peaks as in 3TIQ algorithm offers more sensitive results with better signal-to-noise ratio (Park et al., 2016). To detect individual XIC of glycan isomers (that have the same composition and thus theoretical m/z), the XIC peak detection algorithm reported by Aoshima et al. Aoshima et al. (2014) is adopted with customized modification to suit for glycan detection. Briefly, the point of highest intensity (i.e., apex) is first located by searching the local maximum over XIC peaks. The leftmost and rightmost neighbor of the apex are then tracked starting from the center of apex, which are defined as the peak boundary higher than (or equal to) a given cutoff (by default 50%) of apex intensity. The left and right bounds of XIC are discovered by extending the leftmost and rightmost neighbor using a local minimum algorithm. The peak area of the detected glycan isomers were summed
where
3 Results and Discussion
3.1 GUI Calibration
GlycanGUI provides a graphic user interface that takes mass spectra data containing dextran ladder as the internal standard (as shown in Supplementary Figure S1). It determines Glucose Unit (GU) values by fitting to 3rd order polynomial (by default) or logarithmic function (Supplementary Figure S1), which allows for calibrating the retention time to the corresponding Glucose Unit Index (GUI). This calibration process involves the determination of retention time of dextrin ladders with different number of GUs (i.e., GU 2–12) followed by the polynomial (or logarithmic) curve fitting.
To assign the peaks of the dextrin ladders in LC-MS data, each peak in a full MS spectrum was first compared against the theoretical mass-to-charge-ratios of dextrin ladders with putative ion charges (by default up to +3) and abducts (by default the proton) using a user-defined mass tolerance. For each dextrin of a specific GU, only the most abundant isotopic ion among all matched peaks in the spectrum is recorded, along with its GU, retention time and the maximum intensity of matched peaks. However, sometimes multiple dextrin ladders with different number of GUs may be extracted from the same spectrum (Figure 1 for an example). We employed the dynamic programming algorithm as described in the Methods section to resolve the ambiguity. As shown in Figure 2, the retention time of the extracted peaks are consistent with the manual assignment in the previous study (Gautam et al., 2020) (Supplementary Figure S2), indicating GlycoGUI assigned the internal standards (dextrin ladders) accurately. Notably, for dextrins with large GUI (e.g., for
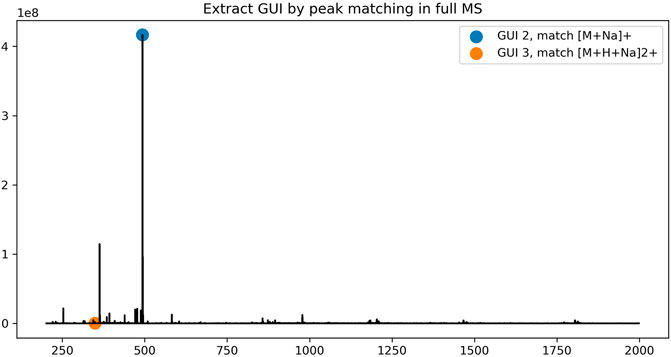
FIGURE 1. The peak assignment of dextrin ladders in a full MS spectrum.
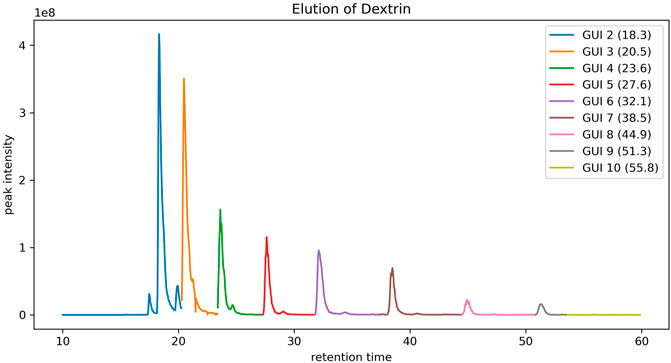
FIGURE 2. The elution profile of dextrin ladders extracted by using peak matching and the dynamic programming algorithm.
To calibrate the retention time into GUI, the value of GUs (i.e., GUIs) are regressed against the retention times of the dextrin ladders (corresponding to ithe most abundant isotopic peak) using a polynomial function as described in Method. Figure 3 shows the standard plot of the GUI against the retention times for the dextrin ladders observed in a human serum sample. The coefficient of determination (
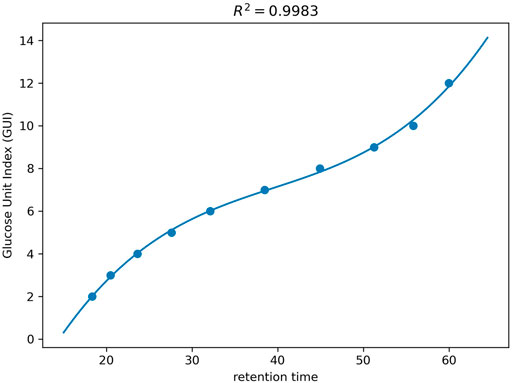
FIGURE 3. The curve fitting of GUI as a polynomial function of the retention time on dextrin ladders with different number of GUs.
3.2 Glycan Annotation
To facilitate glycan identifications, glycanGUI provides a graphic user interface that allows user to annotate glycans with GUI (as shown in Supplementary Figure S4). With reported GUI of annotated glycans, the annotated glycans can be easily verified according to calibrated retention time (Ashwood et al., 2019; Gautam et al., 2020). Moreover, the validation of annotated glycans can be conducted with GUI library of known glycans (Gautam et al., 2020) to filter putative false glycan annotations.
To evaluate the glycan annotation and GUI calibration by GlycanGUI, the GUI values reported by GlycanGUI for the annotated N-glycans in human serum glycomic data were compared with our manual calibrations reported previously (Gautam et al., 2020). As shown in Figure 4, the calibrated GUI values by GlycanGUI is highly correlated with the manually calibrated values (
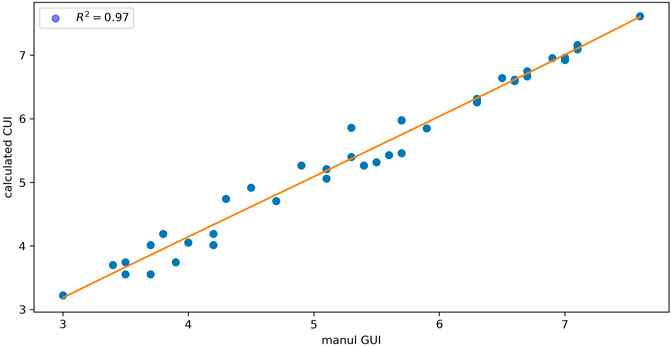
FIGURE 4. The comparison of GUI values calibrated by using GlycanGUI and by manual calibration for the N-glycans in human serum glycomic data.
In addition to the GUI values, GlycanGUI performs label-free quantification of the glycans with calibrated GUI values based on the peak areas in the extracted ion chromatograms (XIC). As shown in Figure 5, the XIC reported by GlycanGUI is highly correlated (
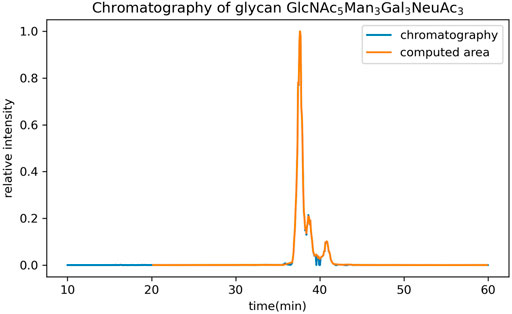
FIGURE 5. The comparison of extracted ion chromatograms reported by GlycanGUI, and by manual extraction using Xcalibur, respectively. The intensity is normalized to the highest intensity.
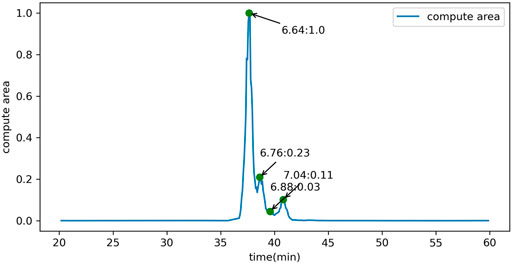
FIGURE 6. The calibration and quantification of glycan isomers distinguished by different peaks in the extracted ion chromatogram of the precursor ions with the same m/z.
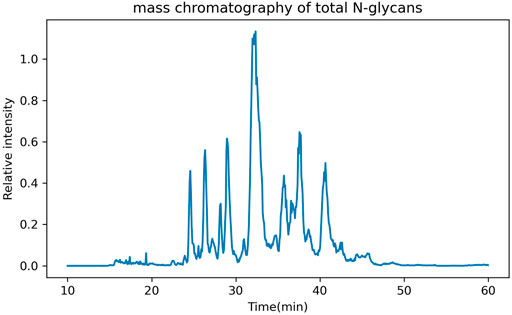
FIGURE 7. The full mass chromatography of the total N-glycans from human serum spiked dextrin.
4 Conclusion
Glycan annotation and label-free quantification from LC-MS data often involve time consuming manual efforts. Here, we report a open-source software tool GlycanGUI for automated calibration of the elution time of glycans into GUI values and the quantification of the corresponding ions based on peak intensities. The source code of GlycanGUI is released on Github at https://github.com/ruizhang84/GlycanGUIApp. We note that although GlycanGUI has been tested extensively on glycomic datasets, the glycan annotation results should be used with caution. To produce the more reliable results for glycan annotation, GlycanGUI is preferred to be used in combination with a library of glycan GUIs (Gautam et al., 2020) or with glycan annotation software tools (Yu et al., 2013; Hu et al., 2015). In the future, we plan to implement glycan identification algorithm in GlycanGUI, for example, by exploiting the fragment ion patterns in tandem mass spectra.
Data Availability Statement
The original contributions presented in the study are included in the article/Supplementary Material, further inquiries can be directed to the corresponding author.
Author Contributions
RZ and HT designed the study; RZ, SG, WP and YH investigated the study; RZ and HT drafted the manuscript; RZ, SG, WP, YH, YM, and HT reviewed and edited the manuscript.
Funding
This work was supported by NIH (5R01GM112490 and 1R01GM130091-01A1).
Conflict of Interest
The authors declare that the research was conducted in the absence of any commercial or financial relationships that could be construed as a potential conflict of interest.
The reviewer (SS) declared a past co-authorship with one of the authors (YM) to the handling Editor.
Supplementary Material
The Supplementary Material for this article can be found online at: https://www.frontiersin.org/articles/10.3389/fchem.2021.707382/full#supplementary-material
References
Abrahams, J. L., Campbell, M. P., and Packer, N. H. (2018). Building a Pgc-Lc-Ms N-Glycan Retention Library and Elution Mapping Resource. Glycoconj J. 35, 15–29. doi:10.1007/s10719-017-9793-4
Althoen, S. C., and Mclaughlin, R. (1987). Gauss-jordan Reduction: A Brief History. The Am. Math. monthly 94, 130–142. doi:10.2307/2322413
Aoshima, K., Takahashi, K., Ikawa, M., Kimura, T., Fukuda, M., Tanaka, S., et al. (2014). A Simple Peak Detection and Label-free Quantitation Algorithm for Chromatography-Mass Spectrometry. BMC bioinformatics 15, 1–14. doi:10.1186/s12859-014-0376-0
Ashwood, C., Pratt, B., MacLean, B. X., Gundry, R. L., and Packer, N. H. (2019). Standardization of Pgc-Lc-Ms-Based Glycomics for Sample Specific Glycotyping. Analyst 144, 3601–3612. doi:10.1039/c9an00486f
Ashwood, C., Waas, M., Weerasekera, R., and Gundry, R. L. (2020). Reference Glycan Structure Libraries of Primary Human Cardiomyocytes and Pluripotent Stem Cell-Derived Cardiomyocytes Reveal Cell-type and Culture Stage-specific Glycan Phenotypes. J. Mol. Cell Cardiol. 139, 33–46. doi:10.1016/j.yjmcc.2019.12.012
Campbell, M. P., Royle, L., Radcliffe, C. M., Dwek, R. A., and Rudd, P. M. (2008). Glycobase and Autogu: Tools for Hplc-Based Glycan Analysis. Bioinformatics 24, 1214–1216. doi:10.1093/bioinformatics/btn090
Dittwald, P., Claesen, J., Burzykowski, T., Valkenborg, D., and Gambin, A. (2013). Brain: a Universal Tool for High-Throughput Calculations of the Isotopic Distribution for Mass Spectrometry. Anal. Chem. 85, 1991–1994. doi:10.1021/ac303439m
Fabini, G., Freilinger, A., Altmann, F., and Wilson, I. B. H. (2001). Identification of Core α1,3-Fucosylated Glycans and Cloning of the Requisite Fucosyltransferase cDNA from Drosophila melanogaster. J. Biol. Chem. 276, 28058–28067. doi:10.1074/jbc.m100573200
Gautam, S., Peng, W., Cho, B. G., Huang, Y., Banazadeh, A., Yu, A., et al. (2020). Glucose Unit index (Gui) of Permethylated Glycans for Effective Identification of Glycans and Glycan Isomers. Analyst 145, 6656–6667. doi:10.1039/d0an00314j
Hu, Y., Zhou, S., Yu, C.-Y., Tang, H., and Mechref, Y. (2015). Automated Annotation and Quantitation of Glycans by Liquid Chromatography/electrospray Ionization Mass Spectrometric Analysis Using the Multiglycan-Esi Computational Tool. Rapid Commun. Mass. Spectrom. 29, 135–142. doi:10.1002/rcm.7093
Mellis, S. J., and Baenziger, J. U. (1981). Separation of Neutral Oligosaccharides by High-Performance Liquid Chromatography. Anal. Biochem. 114, 276–280. doi:10.1016/0003-2697(81)90480-2
Ohtsubo, K., and Marth, J. D. (2006). Glycosylation in Cellular Mechanisms of Health and Disease. Cell 126, 855–867. doi:10.1016/j.cell.2006.08.019
Pabst, M., and Altmann, F. (2011). Glycan Analysis by Modern Instrumental Methods. Proteomics 11, 631–643. doi:10.1002/pmic.201000517
Park, G. W., Kim, J. Y., Hwang, H., Lee, J. Y., Ahn, Y. H., Lee, H. K., et al. (2016). Integrated Glycoproteome Analyzer (I-gpa) for Automated Identification and Quantitation of Site-specific N-Glycosylation. Sci. Rep. 6, 1–12. doi:10.1038/srep21175
Pinho, S. S., and Reis, C. A. (2015). Glycosylation in Cancer: Mechanisms and Clinical Implications. Nat. Rev. Cancer 15, 540–555. doi:10.1038/nrc3982
Royle, L., Campbell, M. P., Radcliffe, C. M., White, D. M., Harvey, D. J., Abrahams, J. L., et al. (2008). Hplc-based Analysis of Serum N-Glycans on a 96-well Plate Platform with Dedicated Database Software. Anal. Biochem. 376, 1–12. doi:10.1016/j.ab.2007.12.012
Stöckmann, H., Adamczyk, B., Hayes, J., and Rudd, P. M. (2013). Automated, High-Throughput Igg-Antibody Glycoprofiling Platform. Anal. Chem. 85, 8841–8849. doi:10.1021/ac402068r
Stowell, S. R., Ju, T., and Cummings, R. D. (2015). Protein Glycosylation in Cancer. Annu. Rev. Pathol. Mech. Dis. 10, 473–510. doi:10.1146/annurev-pathol-012414-040438
Van den Steen, P. E., Van Aelst, I., Hvidberg, V., Piccard, H., Fiten, P., Jacobsen, C., et al. (2006). The Hemopexin and O-Glycosylated Domains Tune Gelatinase B/mmp-9 Bioavailability via Inhibition and Binding to Cargo Receptors. J. Biol. Chem. 281, 18626–18637. doi:10.1074/jbc.m512308200
Van Dongen, S., and Enright, A. J. (2012). Metric Distances Derived from Cosine Similarity and pearson and spearman Correlations.arXiv preprint arXiv:1208.3145
Varki, A., Cummings, R. D., Esko, J. D., Stanley, P., Hart, G. W., Aebi, M., et al. (2009). Essentials of glycobiology. 3rd Edn, Cold Spring Harbor, NY: Cold Spring Harbor Laboratory Press. Chapter 9
Yu, C.-Y., Mayampurath, A., Hu, Y., Zhou, S., Mechref, Y., and Tang, H. (2013). Automated Annotation and Quantification of Glycans Using Liquid Chromatography-Mass Spectrometry. Bioinformatics 29, 1706–1707. doi:10.1093/bioinformatics/btt190
Keywords: GUI, glycan, annotation, quantification, mass spectrometry
Citation: Zhang R, Peng W, Gautam S, Huang Y, Mechref Y and Tang H (2021) GlycanGUI: Automated Glycan Annotation and Quantification Using Glucose Unit Index. Front. Chem. 9:707382. doi: 10.3389/fchem.2021.707382
Received: 09 May 2021; Accepted: 03 June 2021;
Published: 15 June 2021.
Edited by:
Ganglong Yang, Jiangnan University, ChinaReviewed by:
Shunji Natsuka, Niigata University, JapanShiwei Sun, Institute of Computing Technology, Chinese Academy of Sciences (CAS), China
Copyright © 2021 Zhang, Peng, Gautam, Huang, Mechref and Tang. This is an open-access article distributed under the terms of the Creative Commons Attribution License (CC BY). The use, distribution or reproduction in other forums is permitted, provided the original author(s) and the copyright owner(s) are credited and that the original publication in this journal is cited, in accordance with accepted academic practice. No use, distribution or reproduction is permitted which does not comply with these terms.
*Correspondence: Haixu Tang, aGF0YW5nQGluZGlhbmEuZWR1