 Jing Wen
 Tianchen Tang
 Saima Kanwal
 Yongzheng Lu1
 Dawei Zhang
- 1Engineering Research Center of Optical Instrument and Systems, Ministry of Education and Shanghai Key Lab of Modern Optical System, University of Shanghai for Science and Technology, Shanghai, China
- 2Department of Urology, Xinhua Hospital, School of Medicine, Shanghai Jiao Tong University, Shanghai, China
Tumor cells circulating in the peripheral blood are the prime cause of cancer metastasis and death, thus the identification and discrimination of these rare cells are crucial in the diagnostic of cancer. As a label-free detection method without invasion, Raman spectroscopy has already been indicated as a promising method for cell identification. This study uses a confocal Raman spectrometer with 532 nm laser excitation to obtain the Raman spectrum of living cells from the kidney, liver, lung, skin, and breast. Multivariate statistical methods are applied to classify the Raman spectra of these cells. The results validate that these cells can be distinguished from each other. Among the models built to predict unknown cell types, the quadratic discriminant analysis model had the highest accuracy. The demonstrated analysis model, based on the Raman spectrum of cells, is propitious and has great potential in the field of biomedical for classifying circulating tumor cells in the future.
Introduction
Over the past few years, there has been a gradual increase in the number of cancer deaths (Jemal et al., 2010; Ferlay et al., 2015). It be known that human organs can produce cancer cells at any stage. In fewer cases, cancer cells may develop into tumors when they accumulate to a certain extent. Circulating tumor cells (CTCs) shed from the primary tumor and spread to the peripheral blood or lymph. These CTCs are the major cause of cancer metastases and death (Fidler, 1995; Mocellin et al., 2006). Thus, it is essential to distinguish these tumor cells. Nowadays, immunocytological is still the golden standard and specific biomarkers remain the main screening method for tumor cell examination (Oosterwijk-Wakka et al., 2013; Alix-Panabières and Pantel, 2014; Bhana et al., 2015). However, some cancer cells may exhibit inadequate or vague expression of bio-markers probably by completing the epithelial-mesenchymal transition (Choueiri et al., 2013; Zerati et al., 2013; Alix-Panabières and Pantel, 2014). Besides, the use of fluorescent probes often has the disadvantage of spectral overlap and the binding of fluorescent molecules is based on the specific binding of antigen and antibody, which may change the structure of the cell molecules. It is not conducive to the follow-up of other detection experiments (Chan et al., 2008; Jones et al., 2015). Therefore, a highly sensitive, label-free, cost-efficient CTCs detection method that can accurately identify cancer cells is a pressing need.
Raman spectroscopy is a rapid and non-destructive technique for studying a biological system based on detecting molecular vibration and rotation (Krafft, 2012; Krafft et al., 2016; Popp et al., 2016; Wang et al., 2020). Numerous biochemical components can be identified by Raman spectra, for instance, genetic material, protein, and lipid, all have their unique peaks in the Raman spectrum (Stone et al., 2004; Brauchle et al., 2014; Fang et al., 2019). As a well-known fact, mutations in cancer cells are always accompanied by wireless proliferation, which leads to a huge increase of genes in the nucleus. Some cancer cells also suffer protein changes on the cell membrane or accumulate large amounts of lipids in the cytoplasm (Abramczyk et al., 2009; Yue et al., 2014; Surmacki et al., 2015). At present, there have been many studies reporting the use of Raman microspectroscopy combined with multivariate statistical analysis methods to distinguish and classify cell types (Kong et al., 2015). Machine learning-based analysis methods such as support vector machine (SVM), principal component analysis (PCA), linear discriminant analysis (LDA), and quadratic discriminant analysis (QDA) were introduced in combination with Raman spectroscopy which has successfully attained the identification of many cells and tissues in the declining years (Dixon and Brereton, 2009; Neugebauer et al., 2010; Pudlas et al., 2011; Zhang et al., 2016; Siqueira et al., 2017). However, these research only compare tumor cells with normal cells produced by the same organ, the differences between tumor cells from different organs are not clear (Crow et al., 2005; Krishna et al., 2005; Chan et al., 2008; Pijanka et al., 2013). We expect to get a broader spectrum of cancer cells in order to recognize CTCs at an early stage, which will help to identify the diseased organs in advance, allowing cancer patients to avoid mortality outcomes. The accuracy and classification characteristics using the statistical analysis methods for cell samples also need to be verified by comparison.
In this article, we chose the cell samples from kidney, lung, liver, breast, and skin as the research object, and explore the process of living cell detection by confocal Raman spectroscopy. With the combination of multivariate statistical methods, Raman spectra of various types of cells are classified based on three models i.e. SVM, LDA, and QDA, the accuracy of classifying the accurate cell types is above 95%. In order to verify the feasibility of the model, the results validate that high sensitivity is realized to predict the unknown cell types. Furthermore, the comparison of the pros and cons of the three models is also discussed. The flexible combination of Raman spectroscopy and various modeling methods can immediately identify a variety of cells at a high accuracy which will provide potential applications in CTCs detection.
Methods and Experiments
Cell Culture and Sample Preparation
Cells in this study are obtained from the American Type Culture Collection (ATCC), which is listed in Table 1. All the cells were grown in Dulbecco's Modified Eagle’s Medium (DMEM) with 10% fetal bovine serum (FBS) and antibiotics (penicillin and streptomycin) at 37°C in a humidified atmosphere of 5% CO2. Cells in the logarithmic phase were taken to harvest with Trypsin-EDTA and suspended in phosphate-buffered saline (PBS 1×) before Raman measurement. All cells were collected under the same condition. About 2 ml of the cell suspension was added into a culture dish with a quartz glass bottom. Approximately three-quarters of the cells were used as training and validation, while another quarter was for the prediction set.
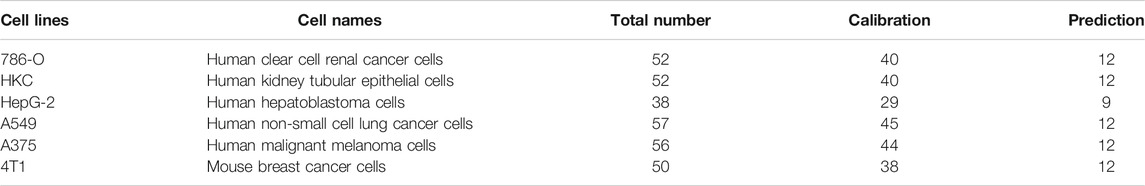
TABLE 1. Names of cell lines and cell numbers.
Raman Spectroscopy Measurement
Raman spectra of living cells were obtained from a laser confocal Raman spectrometer (RAMANtouch, Japan) with 532 nm laser excitation. Before the Raman test, a CCD detector must be cooled to −70°C, and the system was calibrated by using silicon with its peak at 520.5 cm−1. The laser was focused by a ×60 water immersion objective lens (NA = 1.0, Nikon, Japan) onto the sample. To ensure an appropriate signal-to-noise ratio without damaging the samples, the laser power was controlled at about 10 mW. Single point measurement mode was used and the laser spot size on the sample was about 0.65 µm. The exposure time for each cell was kept at 8 s for each time and tested three times. Subsequently, the spectrometer automatically took the averaged spectra. The test range was in the Raman low wavenumber region and a minimum of 35 spectra were obtained from each kind of cell. Regions of each cell’s nucleus were preferentially sampled. The measurements of all cells were worked out under the same conditions.
Data Processing and Analysis
Raman spectral data were pre-processed using WiRE 4.2 (Renishaw, United Kingdom), with baseline corrected and smoothed, and cosmic rays were removed if existing. Before analysis, the Raman shift in each spectrum was cut into the ‘fingerprint’ region from 600 to 1800 cm−1, which removed the Raman peak of the quartz glass substrate. The Raman intensity was normalized and unified as the relative intensity of arbitrary unit (a.u.) using OriginPro 9.1. (OriginLab Corp., Northampton, MA, United States) (Zhao et al., 2007; Zhang et al., 2010a; Zhang et al., 2010b). All spectral data were corrected for baseline translation and shift phenomena using the EMSC (extended multiplicative signal correction) algorithm, assuming the average of all spectral data as the ideal spectrum(Popp et al., 2018). Multivariate statistical analysis methods i.e. SVM, PCA, LDA, QDA were carried out with MATLAB R2016b (MathWorks, Inc., United States) and The Unscramble@10.4 (CAMO, Oslo, Norway).
Results and Discussion
To determine whether the spectral data obtained from the measurement were Raman signals of cells, we checked the signals around the cells, the laser point was slightly above the bottom to focus on the cells. Figure 1A shows the bright field image of a typical 786-O cell and the blank background near the cells, while Figure 1B shows the Raman spectra of the two corresponding points. Unlike the cell curve, deprived of a large number of sharp Raman peaks, the background curve is relatively smoother. The only background peak displayed in the spectrum was at about 1554 cm−1. It demonstrates that the Raman signal in quartz glass background exhibited extremely low interference which is consistent with the description in the previous report (Palonpon et al., 2013).
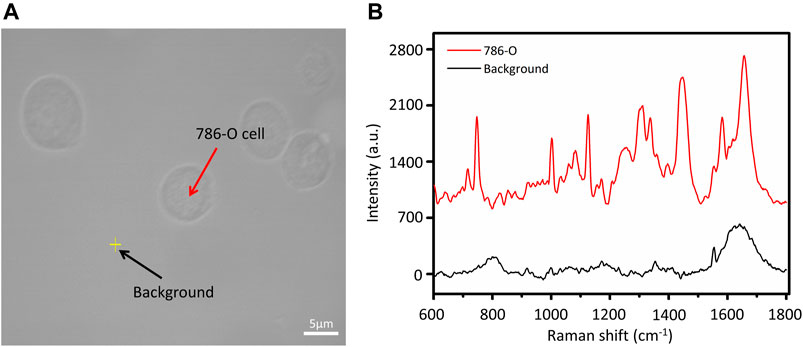
FIGURE 1. (A) Bright field image of 786‐O cells and (B) Raman spectrum of background and cell.
Figure 2 manifests the average Raman spectrum curves of six types of cells. The shadow area is the error bars which represent the standard deviation of the mean value. The main common Raman peaks at 642, 831, 851, 1171, 1208, 1604, 1620 cm−1 (tyrosine), 1003 cm−1 (phenylalanine), 1246 cm−1 (Amide III), 1337 cm−1 (tryptophan), 1655 cm−1 (Amide I) are assigned to proteins. Strong and wide peaks are corresponding with lipid at 1124 cm−1 (C–C stretching mode), 1252 cm−1 (=CH in-plane bending), and 1445 cm−1 (CH2 deformation). Other bands at around 747 cm−1 (thymine), 1176 cm−1 (cytosine, guanine), 1311 cm−1 (adenine), 1581 cm−1 (pyrimidine ring of nucleic acids) are assigned to DNA and RNA. Details of Raman peaks assignment to cell spectrum are presented in Table 2 (Stone et al., 2004; Notingher and Hench, 2006; Wood et al., 2007; Surmacki et al., 2015). Various cells have quite comparable Raman spectra due to the similar biochemical components (as shown in Figure 2). But there are also a few Raman peaks that are different, such as distinct peaks at 831 and 850 cm−1, which represent tyrosine residue conformations (Zhuang et al., 2013). These spectral peaks distinguished by the human eye may not be sufficient to accurately identify different cells. Herein, we used a multivariate statistical analysis algorithm (SVM, PCA, LDA) to process the data set and analyze the subtle differences of the Raman spectrum among different cells.
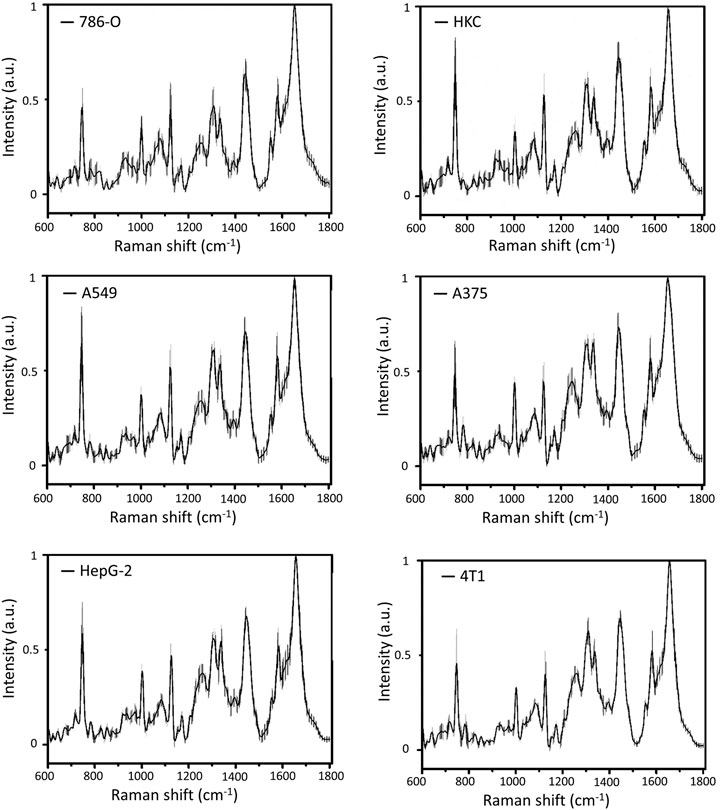
FIGURE 2. The average Raman spectra of 6 kinds of cells with error bars.
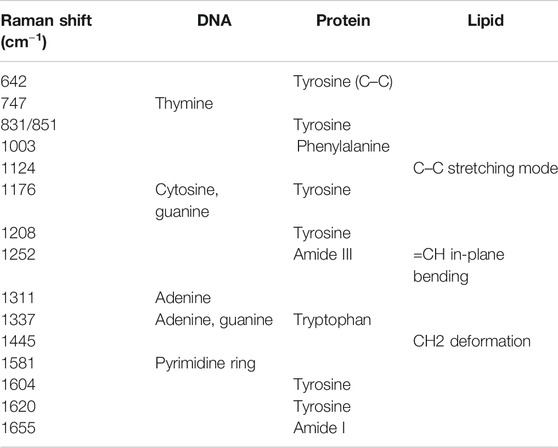
TABLE 2. The representative peak assignments in cell Raman spectra (Stone et al., 2004; Notingher and Hench, 2006; Wood et al., 2007; Surmacki et al., 2015).
SVM is a supervised learning method for the binary classification of data. It finds the maximum geometric margin hyperplane between two kinds of learning data sets and using the optimal hyperplane to distinct the two data sets into two sides to complete the classification (Dixon and Brereton, 2009; Zhang et al., 2016). In this paper, we use an SVM with a linear kernel function to realize the discriminative classification of prediction samples. To prevent overfitting, while ensuring the classification accuracy, the penalty factor C selection was set to 1. Each spectrum was cross-validated with 10 segments. Initially, we performed a feasibility validation using cancer and normal cells derived from the same organ which had an apparent difference of biochemical components. 40 cancer cells (786-O) and 40 normal cells (HKC) were used to construct the SVM model. Meanwhile, to verify the accuracy of the SVM model for predicting unknown cells, a set containing 24 new cells (12 786-O, 12 HKC) was used. The prediction accuracy was 100% so that the cancer cells and normal cells could be distinguished from each other. The details of predicting results are shown in Table 3. Using the same SVM method could additionally construct a classification model among five different cancer cells. 196 cancer cells are used to form a training set (including 40 786-O, 29 HepG-2, 45 A549, 44 A375, 38 4T1) to construct the model. Table 4 shows the details in a confusion matrix of the SVM classification model and the validation accuracy in the training set was 100%. However, the predictive performance needs to be tested. The prediction rate of these SVM models is verified by a prediction set of 57 new ‘unknown’ cells (actually already known but not included in the training set, including 12 786-O, 9 HepG-2, 12 A549, 12 A375, 12 4T1). The result is shown in Figure 3A and the prediction of accuracy is 98.25%.
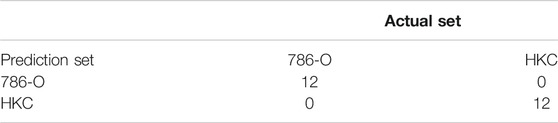
TABLE 3. Prediction result of cancer cells/normal cells with SVM classification.
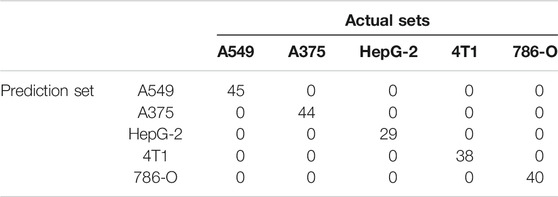
TABLE 4. Confusion matrix of five cancer cell lines using the SVM classification model.
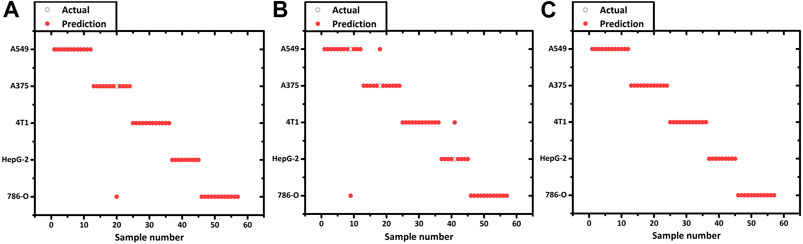
FIGURE 3. Prediction result of 5 kinds of cancer cell lines using the (A) SVM, (B) LDA and (C) QDA model.
Although SVM had successfully established the classification among different cancer cells, it has the drawbacks of a complex and time-consuming model. SVM is a binary classifier, seeking the optimal hyperplane between the two data sets. While dealing with the problem of multi-sample classification, SVM models should be constructed between every two samples. As for N different types of cells, at least N × (N-1)/2 decision values should be considered. While dealing with two distinct cell types (cancer cell 786-O and normal cells HKC, the N is not too large), the training speed is relatively swift. However, to deal with the classification of multiple cancer cells, the number of binary classifiers increases as a quadratic function concerning N, which significantly increases the amount of training operation and reduces the training speed (Dixon and Brereton, 2009). Therefore, we employ an LDA method to predict and classify various cancer cells. LDA is a classical linear supervised learning method to reduce the dimension and classify, which has been reported in classification of cancer Raman spectra(Dochow et al., 2011; Pijanka et al., 2013). Given a labeled set of training samples, LDA tries to project the samples into low-dimensional space, so that the projection points of the same samples are as close as possible and the projection points of the heterogeneous samples are as far as possible. After projection, the different types of the sample will be distributed in different regions of the lower dimensional space, and the prediction sets will also be projected in the space according to the previously calculated dimensionality reduction rules. Afterward, the category of the new sample is determined based on the location of the projection point (Dixon and Brereton, 2009; Siqueira et al., 2017).
Before constructing the LDA and QDA classification model the Raman spectral data needs further process due to a large number of variables arrays. PCA is introduced to eliminate any overlapped information in the spectrum through a multivariate linear transformation which extracts the eigenvalues of the data matrix and then reconstructs a basic eigenvector to form a new data set (Dixon and Brereton, 2009). Through the transformation, PCA could also classify some simple data sets. However, in this study, PCA is not implemented with the SVM model. Various studies have directly used the SVM method to analyze the Raman spectrum. We suppose that this is because the SVM method can better solve the problem of classification of high-dimensional data and there is no need of reducing the dimension of the data in advance. According to the validation on our spectrum dataset, the accuracy of PCA + SVM trained and predicted is indeed lower than the method that uses SVM directly. In this contribution, Raman shift in the spectrum was including 683 variables evenly distributed over the region of 600–1800 cm−1. The 197 cancer cell spectrum, previously used to build SVM models, is still used as the verification set here. Figure 4 shows the result of three dimensions of the first principal component (PC1, PC2, and PC3). The five groups of cells were spatially clustered but could not be well separated. This shows that the classification effect of PCA is not ideal when dealing with high-dimensional data with complex and fuzzy noise distribution. The comprehensive contribution rate of three PCs was 55.25%, which represented the main variances. Due to the more PC numbers retains more original Raman spectrum information (Tang et al., 2017), to improve the accuracy of subsequent predictions, we increased the number to the first 20 PCs, which described 85% of variables. Subsequently, the LDA model was constructed with these PCs. The prior probabilities were calculated from the training set. Cell spectral data was classified in fivefold dimensional space. Figure 5 selects the projection of two dimensions to plot, which represents the division of A375 (red) and A549 (blue). Under the combination of any two different dimensions, the discrimination of the two types of cells can be found. The prediction result is indicated in Figure 3B with an accuracy of 94.73%, which is a little lower than the SVM model.
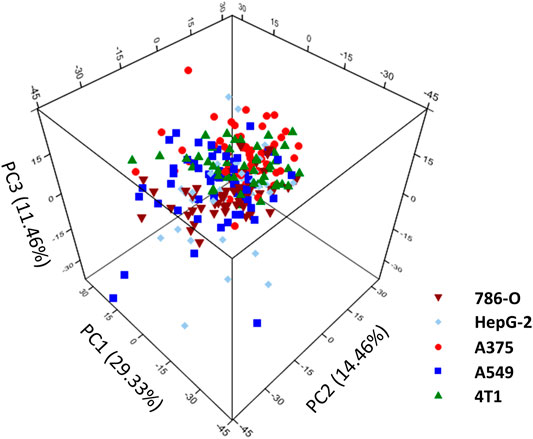
FIGURE 4. The top three PCs’ score plot of different cancer cells.
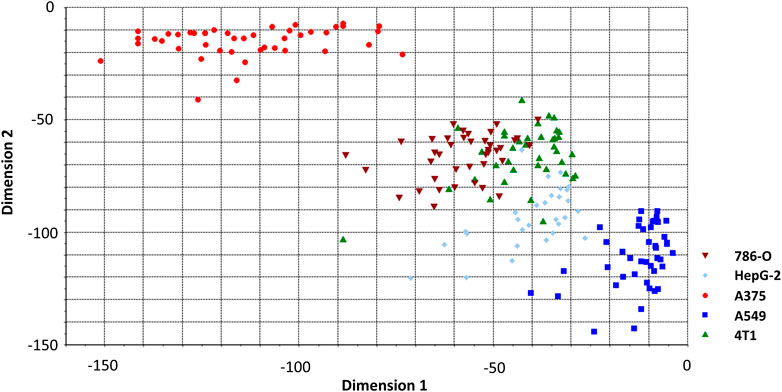
FIGURE 5. LDA classification model classifying spectrum of cancer cell lines. Two of five dimensions are plotted.
We perceived that some cell spectra were misclassified into the wrong category. It is due to the limitation of LDA which is linearly partitioned, while the boundary of the cell Raman spectrum is irregular. QDA is based on LDA which uses quadratic information and far higher complexity hypersurface to enhance the accuracy of classification (Dixon and Brereton, 2009; Tang et al., 2017). Figure 6 shows a QDA analysis model using two of the five dimensions. Utilizing the verification set previously constructed, the 57 unknown cell spectrum were also used for QDA. Figure 3C presents the prediction detail. Each cell spectra had precisely predicted with a 100% prediction accuracy. Finally, we compared the efficiency of building these models. The computation time to construct the SVM model costs 0.47 s, while the LDA and QDA method was 0.014 and 0.018 s. SVM costs the longest time, which is consistent with the previous theory. Constructing the QDA model is slightly slower than LDA, but both are in the same order of magnitude. Consequently, the QDA model had the elite classification and prediction ability with relatively good efficiency.
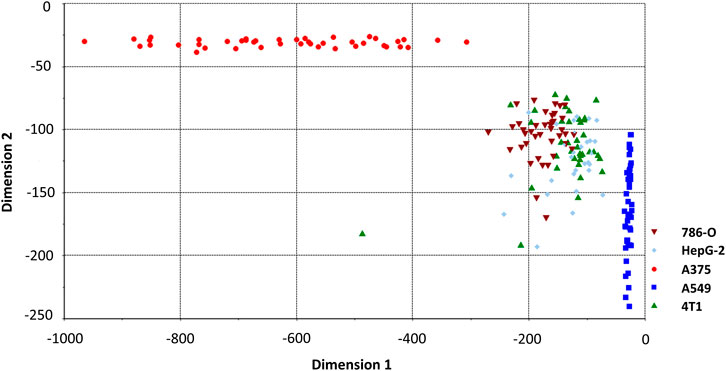
FIGURE 6. QDA classification model classifying spectrum of cancer cell lines. Two of five dimensions are plotted.
In practical applications (such as CTC detection), besides the tumor cells, another cellular material is contained in the peripheral blood. Mainly including leukocytes, red blood cells et al. Since the supervised learning model is used, we need to know the extent possible about the cell types that may be contained in the samples. Relative to the multivariate cancer cells, these haemocytes have a greater difference in size, morphology, components, and are easier to distinguish. By the existing devices, such as magnetic bead sorting or optical tweezers, the tumor cells can be preliminarily distinguished from these common haemocytes cells (Dochow et al., 2011; Rao et al., 2018; Chang et al., 2020). To avoid haemocytes, that are not completely excluded in the actual detection affecting the discrimination accuracy, the Raman spectrum of haemocytes could also be added to the training database. Some of the previous studies, for example, Zhang et al. successfully distinguished cancer cells from leukocytes using Raman spectroscopy(Zhang et al., 2016). For clinical applications, the analytical throughput of cells is also an important indicator. The time spent for each cell is 24 s. Considering a little more consumption of time by the spectrometer to automatically adjust the laser spot to switch to the other cells, the Raman test throughput was <150 cells/h. Usually, there are several CTCs out of 103–107 nucleated cells in a patient's blood sample (Pachmann et al., 2005). To meet the need for clinical application in the future, we can pre-dispose of tumor cells by magnetic bead enrichment before Raman spectroscopy measurement, with the number of tumor cells enriched being much smaller than this test throughput. Therefore, it is acceptable to measurement within an hour, which holds a great prospect for rapid detection in the future.
Conclusion
In this study, Raman spectra of six different cells were obtained from confocal Raman spectroscopy. Different cell lines had tiny different spectra. The Raman peaks of 831 and 850 cm−1 showed the tyrosine residue conformation, which revealed the difference of renal and breast cancer cells from the liver, lung, and skin cancer cells. By using multivariate statistical methods of SVM, LDA, and QDA, we further studied the spectral differences between various cancer cells. The identification accuracy and advantages were compared to discuss. The SVM and LDA model had identical specific accuracy of classifying and predicting cell spectrum, but LDA is more beneficial when the type and number of samples are vast. QDA is a variant of LDA and had a better sensitivity of 100% prediction accuracy in the analysis of cellular Raman spectra. In the follow-up study, we will accumulate more cell spectrum to improve the reliability of the calibration sample library and implement it to identify the circulating tumor cells in the peripheral blood of tumor patients. Raman spectroscopy is a powerful, rapid, and non-destructive means in the identification of biochemical components. It has the potential to play a substantial role in the detection of cancer metastasis in an early stage of cancer or after surgery in the future.
Data Availability Statement
The raw data supporting the conclusion of this article will be made available by the authors, without undue reservation.
Author Contributions
JW and TT contributed equally to this work. DZ and ZG designed the experiments. TT, CT, and YL conducted the experiments. TT, JW, SK, and LZ wrote this paper. All authors agreed to this manuscript.
Funding
This work was supported by the National Natural Science Foundation of China (Project No. 81701745) and the Interdisciplinary Program of Medicine and Engineering of USST.
Conflict of Interest
The authors declare that the research was conducted in the absence of any commercial or financial relationships that could be construed as a potential conflict of interest.
References
Abramczyk, H., Surmacki, J., Brożek-Płuska, B., Morawiec, Z., and Tazbir, M. (2009). The hallmarks of breast cancer by Raman spectroscopy. J. Mol. Struct. 924–926, 175–182. doi:10.1016/j.molstruc.2008.12.055
Alix-Panabières, C., and Pantel, K. (2014). Technologies for detection of circulating tumor cells: facts and vision. Lab. Chip 14, 57–62. doi:10.1039/c3lc50644d
Bhana, S., Wang, Y., and Huang, X. (2015). Nanotechnology for enrichment and detection of circulating tumor cells. Nanomedicine 10, 1973–1990. doi:10.2217/nnm.15.32
Brauchle, E., Thude, S., Brucker, S. Y., and Schenke-Layland, K. (2014). Cell death stages in single apoptotic and necrotic cells monitored by Raman microspectroscopy. Sci. Rep. 4, 4698–4699. doi:10.1038/srep04698
Chan, J., Fore, S., Wachsmann-hogiu, S., and Huser, T. (2008). Raman spectroscopy and microscopy of individual cells and cellular components. Laser Photon. Rev. 2, 325–349. doi:10.1002/lpor.200810012
Chang, Z., Zhang, R., Yang, C., Shao, D., Tang, Y., Dong, W., et al. (2020). Cancer-leukocyte hybrid membrane-cloaked magnetic beads for the ultrasensitive isolation, purification, and non-destructive release of circulating tumor cells. Nanoscale 12, 19121–19128. doi:10.1039/d0nr04097e
Choueiri, T. K., Cheng, S., Qu, A. Q., Pastorek, J., Atkins, M. B., and Signoretti, S. (2013). Carbonic anhydrase IX as a potential biomarker of efficacy in metastatic clear-cell renal cell carcinoma patients receiving sorafenib or placebo: analysis from the treatment approaches in renal cancer global evaluation trial (TARGET). Urol. Oncol. 31, 1788–1793. doi:10.1016/j.urolonc.2012.07.004
Crow, P., Barrass, B., Kendall, C., Hart-Prieto, M., Wright, M., and Persad, R. (2005). The use of Raman spectroscopy to differentiate between different prostatic adenocarcinoma cell lines. Br. J. Cancer 92, 2166. doi:10.1038/sj.bjc.6602638
Dixon, S. J., and Brereton, R. G. (2009). Comparison of performance of five common classifiers represented as boundary methods: euclidean distance to centroids, linear discriminant analysis, quadratic discriminant analysis, learning vector quantization and support vector machines, as dependent on data structure. Chemom. Intell. Lab. Syst. 95, 1–17. doi:10.1016/j.chemolab.2008.07.010
Dochow, S., Krafft, C., Neugebauer, U., Bocklitz, T., Henkel, T., and Mayer, G. (2011). Tumour cell identification by means of Raman spectroscopy in combination with optical traps and microfluidic environments. Lab. Chip. 11, 1484–149090. doi:10.1039/c0lc00612b
Fang, T., Shang, W., Liu, C., Xu, J., Zhao, D., Liu, Y., et al. (2019). Nondestructive identification and accurate isolation of single cells through a chip with Raman optical tweezers. Anal. Chem. 91, 9932–9939. doi:10.1021/acs.analchem.9b01604
Ferlay, J., Soerjomataram, I., Dikshit, R., Eser, S., Mathers, C., Rebelo, M., et al. (2015). Cancer incidence and mortality worldwide: sources, methods and major patterns in GLOBOCAN 2012. Int. J. Cancer 136, E359–E386. doi:10.1002/ijc.29210
Fidler, I. J. (1995). The pathogenesis of cancer metastasis: the ‘seed and soil’hypothesis revisited. Prod. Oper. Manag. 4, 46–56. doi:10.1038/nrc1098
Jemal, A., Center, M. M., DeSantis, C., and Ward, E. M. (2010). Global patterns of cancer incidence and mortality rates and trends. Cancer Epidemiol. Biomark. Prev. 19, 1893–1907. doi:10.1158/1055-9965.EPI-10-0437
Jones, S., Anagnostou, V., Lytle, K., Parpart-Li, S., Nesselbush, M., Riley, D. R., et al. (2015). Personalized genomic analyses for cancer mutation discovery and interpretation. Sci. Transl. Med. 7, 283ra53. doi:10.1126/scitranslmed.aaa7161
Kong, K., Kendall, C., Stone, N., and Notingher, I. (2015). Raman spectroscopy for medical diagnostics—from in-vitro biofluid assays to in-vivo cancer detection. Adv. Drug Deliv. Rev. 89, 121. doi:10.1016/j.addr.2015.03.009
Krafft, C., Dietzek, B., Schmitt, M., and Popp, J. (2012). Raman and coherent anti-stokes Raman scattering microspectroscopy for biomedical applications. J. Biomed. Opt. 17, 040801. doi:10.1117/1.JBO.17.4.040801
Krafft, C., Schie, I. W., Meyer, T., Schmitt, M., and Popp, J. (2016). Developments in spontaneous and coherent Raman scattering microscopic imaging for biomedical applications. Chem. Soc. Rev. 45, 1819–1849. doi:10.1039/c5cs00564g
Krishna, C. M., Sockalingum, G. D., Kegelaer, G., Rubin, S., Kartha, V. B., and Manfait, M. (2005). Micro-Raman spectroscopy of mixed cancer cell populations. Vib. Spectrosc. 38, 95–100. doi:10.1016/j.vibspec.2005.02.018
Mocellin, S., Keilholz, U., Rossi, C. R., and Nitti, D. (2006). Circulating tumor cells: the ‘leukemic phase’ of solid cancers. Trends Mol. Med. 12, 130–139. doi:10.1016/j.molmed.2006.01.006
Neugebauer, U., Bocklitz, T., Clement, J. H., Krafft, C., and Popp, J. (2010). Towards detection and identification of circulating tumour cells using Raman spectroscopy. Analyst 135, 3178–3182. doi:10.1039/c0an00608d
Notingher, I., and Hench, L. L. (2006). Raman microspectroscopy: a noninvasive tool for studies of individual living cells in vitro. Expert Rev. Med. Devices 3, 215–234. doi:10.1586/17434440.3.2.215
Oosterwijk-Wakka, J. C., Boerman, O. C., Mulders, P. F. A., and Oosterwijk, E. (2013). Application of monoclonal antibody G250 recognizing carbonic anhydrase IX in renal cell carcinoma. Int. J. Mol. Sci. 14, 11402–11423. doi:10.3390/ijms140611402
Pachmann, K., Clement, J. H., Schneider, C., Willen, B., Camara, O., Pachmann, U., et al. (2005). Standardized quantification of circulating peripheral tumor cells from lung and breast cancer. Clin. Chem. Lab. Med. 43, 617–627. doi:10.1515/CCLM.2005.107
Palonpon, A. F., Ando, J., Yamakoshi, H., Dodo, K., Sodeoka, M., Kawata, S., et al. (2013). Raman and SERS microscopy for molecular imaging of live cells. Nat. Protoc. 8, 677–692. doi:10.1038/nprot.2013.030
Pijanka, J. K., Stone, N., Rutter, A. V., Forsyth, N., Sockalingum, G. D., Yang, Y., et al. (2013). Identification of different subsets of lung cells using Raman microspectroscopy and whole cell nucleus isolation. Analyst 138, 5052–5058. doi:10.1039/c3an00968h
Popp, J., Bocklitz, T., and Jena, D. (2018). Extended multiplicative signal correction based model transfer for Raman spectroscopy in biological applications. Anal. Chem. 90 (16), 9787–9795. doi:10.1021/acs.analchem.8b01536
Popp, J., Krafft, C., Schmitt, M., Schie, I., Cialla-May, D., Matthaeus, C., et al. (2016). Label-free molecular imaging of biological cells and tissues by linear and non-linear Raman spectroscopic approaches. Angew. Chem. Int. Ed. Engl. 56 (16),4392–4430. doi:10.1002/anie.201607604
Pudlas, M., Koch, S., Bolwien, C., Thude, S., Jenne, N., Hirth, T., et al. (2011). Raman spectroscopy: a noninvasive analysis tool for the discrimination of human skin cells. Tissue Eng. Part C Methods 17, 1027–1040. doi:10.1089/ten.tec.2011.0082
Rao, L., Meng, Q., Huang, Q., Wang, Z., Yu, G., Li, A., et al. (2018). Platelet–leukocyte hybrid membrane-coated immunomagnetic beads for highly efficient and highly specific isolation of circulating tumor cells. Adv. Funct. Mater. 22, 1803531. doi:10.1002/adfm.201803531
Siqueira, L. F. S., Araújo Júnior, R. F., de Araújo, A. A., Morais, C. L. M., and Lima, K. M. G. (2017). LDA vs. QDA for FT-MIR prostate cancer tissue classification. Chemom. Intell. Lab. Syst. 162, 123–129. doi:10.1016/j.chemolab.2017.01.021
Stone, N., Kendall, C., Smith, J., Crow, P., and Barr, H. (2004). Raman spectroscopy for identification of epithelial cancers. Faraday Discuss 126, 141–157. doi:10.1039/b304992b
Surmacki, J., Brozek-Pluska, B., Kordek, R., and Abramczyk, H. (2015). The lipid-reactive oxygen species phenotype of breast cancer. Raman spectroscopy and mapping, PCA and PLSDA for invasive ductal carcinoma and invasive lobular carcinoma. Molecular tumorigenic mechanisms beyond Warburg effect. Analyst 140, 2121–2133. doi:10.1039/c4an01876a
Tang, M., Xia, L., Wei, D., Yan, S., Du, C., and Cui, H. L. (2017). Distinguishing different cancerous human cells by Raman spectroscopy based on discriminant analysis methods. Appl. Sci. 7, 900. doi:10.3390/app7090900
Wang, Y., Xu, J., Kong, L., Li, B., Li, H., Huang, W. E., et al. (2020). Raman-activated sorting of antibiotic-resistant bacteria in human gut microbiota. Environ. Microbiol. 22, 2613–2624. doi:10.1111/1462-2920.14962
Wood, B. R., Caspers, P., Puppels, G. J., Pandiancherri, S., and McNaughton, D. (2007). Resonance Raman spectroscopy of red blood cells using near-infrared laser excitation. Anal. Bioanal. Chem. 387, 1691–1703. doi:10.1007/s00216-006-0881-8
Yue, S., Li, J., Lee, S. Y., Lee, H. J., Shao, T., Song, B., et al. (2014). Cholesteryl ester accumulation induced by PTEN loss and PI3K/AKT activation underlies human prostate cancer aggressiveness. Cell Metab. 19, 393–406. doi:10.1016/j.cmet.2014.01.019
Zerati, M., Leite, K. R., Pontes-Junior, J., Segre, C. C., Reis, S. T., Srougi, M., et al. (2013). Carbonic anhydrase IX is not a predictor of outcomes in non-metastatic clear cell renal cell carcinoma-a digital analysis of tissue microarray. Int. Braz. J. Urol. 39, 484–492. doi:10.1590/S1677-5538.IBJU.2013.04.05
Zhang, Y., Ye, X., Xu, G., Jin, X., Luan, M., Lou, J., et al. (2016). Identification and distinction of non-small-cell lung cancer cells by intracellular SERS nanoprobes. RSC Adv. 6, 5401–5407. doi:10.1039/c5ra21758j
Zhang, Z. M., Chen, S., and Liang, Y. Z. (2010a). Baseline correction using adaptive iteratively reweighted penalized least squares. Analyst 135, 1138–1146. doi:10.1039/b922045c
Zhang, Z. M., Chen, S., Liang, Y. Z., Liu, Z. X., Zhang, Q. M., Ding, L. X., et al. (2010b). An intelligent background-correction algorithm for highly fluorescent samples in Raman spectroscopy. J. Raman Spectrosc. 41, 659–669. doi:10.1002/jrs.2500
Zhao, J., Lui, H., Mclean, D. I., and Zeng, H. (2007). Automated autofluorescence background subtraction algorithm for biomedical Raman spectroscopy. Appl. Spectrosc. 61, 1225–1232. doi:10.1366/000370207782597003
Keywords: Raman spectroscopy, cancer cells, SVM, LDA, QDA
Citation: Wen J, Tang T, Kanwal S, Lu Y, Tao C, Zheng L, Zhang D and Gu Z (2021) Detection and Classification of Multi-Type Cells by Using Confocal Raman Spectroscopy. Front. Chem. 9:641670. doi: 10.3389/fchem.2021.641670
Received: 14 December 2020; Accepted: 19 February 2021;
Published: 12 April 2021.
Edited by:
Xusan Yang, Cornell University, United StatesReviewed by:
Chenshuo Ma, Duke University, United StatesYiqing Lu, Macquarie University, Australia
Hugh Byrne, Dublin Institute of Technology, Ireland
Copyright © 2021 Wen, Tang, Kanwal, Lu, Tao, Zheng, Zhang and Gu. This is an open-access article distributed under the terms of the Creative Commons Attribution License (CC BY). The use, distribution or reproduction in other forums is permitted, provided the original author(s) and the copyright owner(s) are credited and that the original publication in this journal is cited, in accordance with accepted academic practice. No use, distribution or reproduction is permitted which does not comply with these terms.
*Correspondence: Dawei Zhang, ZHd6aGFuZ0B1c3N0LmVkdS5jbg==; Zhengqin Gu, Z3V6aGVuZ3FpbkB4aW5odWFtZWQuY29tLmNu