 Liangliang Zhou1
 Sergei A. Eremin
 Xiude Hua
 Minghua Wang
- 1Department of Pesticide Science, State & Local Joint Engineering Research Center of Green Pesticide Invention and Application, Ministry of Education, College of Plant Protection, Nanjing Agricultural University, Nanjing, China
- 2Chemical Faculty, M.V. Lomonosov Moscow State University, Moscow, Russia
A fluorescence polarization immunoassay (FPIA) for the determination of imidacloprid (IMI) was developed with advantages of simple operation and short assay time. The haptens of IMI, acetamiprid (ACE), and thiamethoxam (THI) were conjugated with fluorescein isothiocyanate ethylenediamine (EDF) and 4′-Aminomethyl fluorescein (AMF), respectively, to prepare six fluorescence tracers. The conjugation of IMI hapten and EDF (IMI-EDF) was selected to develop the FPIA due to the largest fluorescent polarization value increase in the presence of anti-IMI monoclonal antibody. Under the optimum condition, the limit of detection, 50% inhibition concentration and detection range of the FPIA were 1.7, 4.8, and 1.7–16.3 μg/L, respectively. The cross-reactivities (CRs) with the analogs of IMI were negligible except for imidaclothiz with CR of 79.13%. The average recovery of spiked paddy water, corn and cucumber samples were 82.4–118.5% with the RSDs of 7.0–15.9%, which indicated the FPIA had good accuracy. Thus, the developed FPIA was a potential tool for the rapid and accurate determination of IMI in agricultural and environmental samples.
Introduction
Imidacloprid (IMI) [1-6(chloro-3-pyridylmethyl)-N-nitroimidazo-lidin-2-ylideneamine] is one of the ultra-efficient neonicotinoid insecticides, which operates as a competitor to postsynaptic nicotinic receptors in a central nervous system of the insect. Currently, IMI has been extensively used in agricultural product in many countries because of its excellent insecticidal effectiveness (Lee et al., 2001). However, IMI shows high toxicity to honeybees (Rebecca et al., 2020; Wang et al., 2020) and its residues also have potentially hazardous for consumers and ecosystem (Ana et al., 2019; Zhang et al., 2020). Therefore, it is necessary to monitor the IMI residual in agricultural and environmental samples.
At present, the instrument-based methods, such as high-performance liquid chromatography (HPLC) (Carretero et al., 2003; Saeedeh et al., 2020) and gas chromatography-tandem mass spectrometry (Su et al., 2017; Massara et al., 2018), have been widely used for the determination of IMI. Compared with instrument, immunoassay, as a rapid detection technique, has been widely used for the detection of small molecules due to its advantages in simplicity, specificity, low consumption, and high sensitivity. There are also many immunoassays that have been established for the detection of IMI, such as enzyme-linked immunosorbent assay (ELISA) (Watanabe et al., 2004; Brian et al., 2009; Navarro et al., 2013), and immunochromatographic assay (ICA) (Xu and Xu, 2012; Fang et al., 2015; Yang et al., 2018). However, ELISAs require long incubation time and multi-step operation, and ICAs generally provide qualitative or semi-quantitative results. Fluorescence Polarization Immunoassay (FPIA), as a homogeneous immunoassay, has attracted more and more attention because of simple operation, short assay time and high throughput (Smith and Eremin, 2008; Yue et al., 2014), and has been used for determination of small molecular compounds (Nasir and Jolley, 2002; Shim et al., 2004; Chun et al., 2009; Mi et al., 2013). The general principle of FPIA for small molecule is that the reaction between fluorescent tracer (fluorescein labeled competing antigen) and antibody results in a change of fluorescence polarization (FP) value. With the increase of the concentration of analyte, the tracer bound to antibody would decrease, which leads to the decrease of the FP value. Compared with heterogeneous immunoassay, FPIA shows some valuable advantages, such as simple operation (one step), short assay time (10–20 min) and good reproducibility due to less interference from inner-filter effects (Anna et al., 2017; Elena et al., 2018; Zhang et al., 2018). Besides, the application and popularity of portable polarimeter makes FPIA show great potential in on-site detection.
In this paper, six fluorescent tracers were prepared by conjugation of haptens of IMI, acetamiprid (ACE), and thiamethoxam (THI) with fluorescein isothiocyanate ethylenediamine (EDF) and 4′-Aminomethyl fluorescein (AMF), respectively. A FPIA for the determination of IMI was developed by employing anti-IMI monoclonal antibody (mAb, 3D11B12E5) and IMI-EDF. The accuracy of the FPIA was evaluated by the detection of IMI in spiked and authentic samples, and validated by HPLC.
Materials and Methods
Reagents
Imidaclothiz (97.82%) was provided by Nantong Jiangshan Agrochemical and Chemicals Co., Ltd. (Jiangsu, China). IMI and its other structural analogs were purchased from Dr. Ehrenstorfer GmbH (Germany). The anti-IMI mAb (3D11B12E5) and IMI hapten were prepared as described previously (Yang et al., 2018). The haptens of ACE and THI were prepared as described previously (Wanatabe et al., 2001; Kim et al., 2003). N,N-Dimethylformamide (DMF), N, N′-Dimethylformamide (DCC) and 4′-Aminomethyl fluorescein (AMF) were purchased from Sigma-Aldrich Chemical Co., Ltd (St. Louis, USA). Ethylenediamine (EDF) was prepared was described previously (Ding et al., 2019).
Instruments and Equipments
The fluorescence intensity and FP value were measured by Spectra Max M5 (Molecular Devices, Sunnyvale, CA, USA). An Agilent 1260 HPLC equipped with an ultraviolet detector (Agilent, Wilmington, DE, USA) was used to verify the accuracy of the FPIA. Milli-Q purified water was obtained from a Milli-Q purification system (Millipore, Bedford, MA, USA). Black microplates (96-well) (3650, Corning Costar Corporation, NY, USA) was used as a reaction vessel for the FPIA.
Preparation of Fluorescent Tracers
The haptens of IMI, ACE and THI were conjugated with EDF and AMF to prepare the tracers for the development of the FPIA. The procedure was carried out according to the previous articles (Kolosova et al., 2003; Ma et al., 2016). Briefly, 40 μmol hapten was dissolved in 0.5 mL DMF containing 80 μmol DCC, the mixture was stirred overnight at room temperature. After centrifugation for 10 min at 10,000 rpm, the supernatant was collected. Then, 10 mmol fluorescein (AMF or EDF) and 10 μL of triethylamine were added to 150 μL aforementioned supernatant and the reaction was allowed to proceed for 4 h. The fluorescent tracers (IMI-EDF, IMI-AMF, ACE-EDF, ACE-AMF, THI-EDF, and THI-AMF) were purified by thin layer chromatography (TLC). TLC boards were deployed in a chromatography cylinder containing chloroform and methanol (4:1, v/v), until the liquid moves to the top of plate (Xu et al., 2011). The major yellow bands were collected and eluted with methanol. Meanwhile, the Rf values of the yellow bands were calculated.
Procedure of FPIA
One hundred microliter IMI standard solutions (or matrix solutions) and 50 μL fluorescent tracer in borate saline buffer (BB) were added to non-binding black microplates. Then, 50 μL mAb 3D11B12E5 in BB was added to the microplates to measure the FP value by SpectraMax M5 with the excitation wavelength of 492 nm and the emission wavelength of 526 nm.
Optimization of Assay Conditions
In this study, the experimental parameters (concentration of antibody, incubation time, organic solvent, ionic strength, and pH) were investigated to improve the sensitivities of the FPIA. Under 6,400-fold dilution of the tracer, the FP values of the FPIAs with serial concentrations of mAb 3D11B12E5 (from 0.07 to 2.14 mg/L) were detected in the absence of analyte. When the FP value reached 50–80% of the FPmax, the mAb concentration was desirable. The FPIA was used to detect IMI under the varying incubation time (from 0 to 15 min) and the serial working buffer with difference methanol content (0, 5, 10, 20, 30, and 40%), ionic strength (0.1, 0.2, 0.3, 0.4, 0.5, and 0.6 mol/L) and pH (4.4, 5.4, 6.4, 7.4, 8.4, and 9.4). The parameters that made the FPIA showed the lower IC50 and higher FPmax/IC50 values were desirable.
Specificity
A series of IMI analogs standard solutions were prepared and analyzed by the FPIA. The FPIA standard curves for different analogs were established to obtain 50% inhibition concentration (IC50). The IC50 values produced by analogs were used to calculate the cross-reaction (CR) according to the following formula:
Analysis of Spiked Samples
The IMI-free samples (corn, cucumber and paddy water, confirmed by HPLC) were collected from a farm in Nanjing, China, which were spiked with IMI at the final concentrations of 100, 500, and 1,000 μg/kg for corn and cucumber, final concentrations of 10, 50, and 100 μg/L for paddy water. The paddy water samples were filtered and directly analyzed using FPIA after mixing with an equal volume of 2× BB buffer. For other spiked samples, 10 g homogenized samples were weighed and extracted with 20 mL 80% methanol-BB. After vortexing for 5 min and ultrasonic for 10 min, the supernatants were separated by centrifugation for 10 min at 4,000 rpm, and adjusted to 25 mL. The concentrations of IMI in the spiked samples were analyzed by FPIA after appropriate dilution.
The Correlation of FPIA With HPLC
Seven samples containing incurred residues (two paddy waters, two corns and three cucumbers were collected from a local farm in Nanjing, China) were simultaneously analyzed by HPLC and FPIA. The pretreatments of the samples for the FPIA were the same as the spiked samples described above. For HPLC, 20 mL paddy water was extracted by 40 mL acetonitrile by vortexing for 10 min. Subsequently, 5 g sodium chloride was added to stratify acetonitrile and water. The half of acetonitrile (20 mL) was transferred and evaporated to dryness with a rotary evaporator at 40 °C. The other samples (20 g) were extracted by vigorously shaking for 1 h with 50 mL of 80% acetonitrile aqueous solution. After filtration, the solution was then stratified with 5 g sodium chloride. And then, 20 mL of acetonitrile were transferred and evaporated to dryness with a rotary evaporator at 40°C. The extracts were dissolved with 5 mL of acetonitrile:water (70:30, v/v) and the concentrations of IMI were detected by HPLC with a Eclipse plus C18 column (4.6 mm × 250 mm × 5 μm). A mixture of acetonitrile:water (70:30, v/v) was used as the mobile phase at a flow rate of 1.0 mL/min at 30°C. The detection wavelength was 270 nm and the injection volume was 20 μl (Yang et al., 2018).
Results and Discussion
Selection of Fluorescent Tracers
Three haptens of IMI, ACE and THI were conjugated with EDF and AMF, respectively (Figure 1), which yielded six fluorescent tracers (IMI-EDF, IMI-AMF, ACE-EDF, ACE-AMF, THI-EDF, and THI-AMF). The tracers were purified using TLC, the yellow bands with Rf = 0.6 for IMI-EDF, Rf = 0.7 for IMI-AMF, Rf = 0.6 for ACE-EDF, Rf = 0.7 for ACE-AMF, Rf = 0.5 for THI-EDF and Rf = 0.6 for THI-AMF were collected (Supplementary Figure 1). The tracers were diluted to fluorescence intensity near 100. The dilution times were 1,600, 6,400, 6,400, 6,400, 3,200, and 25,600 for IMI-AMF, IMI-EDF, THI-AMF, THI-EDF, ACE-AMF, and ACE-EDF, respectively (Supplementary Table 1). Under the dilutions, the tracers prepared by EDF (IMI-EDF, THI-EDF, and ACE-EDF) could bind with mAb 3D11B12E5 to increase the FP values, but the FP values of the tracers prepared by AMF (IMI-AMF, THI-AMF, and ACE-EDF) were not changed (Table 1). This result indicated that EDF was more suitable for the preparation of tracers, probably because EDF has a longer spacer. As expected, IMI-EDF showed the largest FP value increase, so it was chosen to develop the FPIA.

Figure 1. Synthesis of fluorescent tracers.
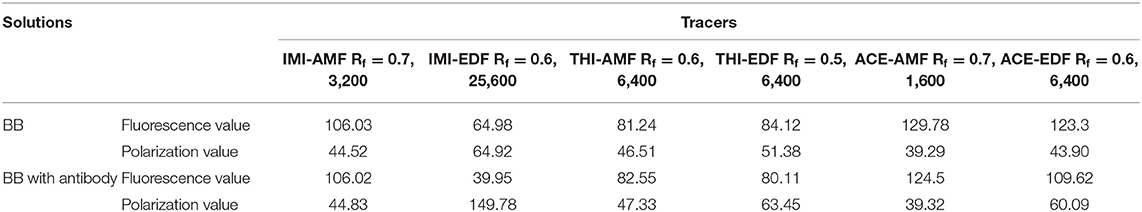
Table 1. The polarization of tracers.
Optimization of the FPIA
As shown in Table 2, the FP value increased with the increasing concentration of mAb 3D11B12E5. When the concentration of mAb was 0.13 mg/L, the FP value was 134.75, which was in the range of the 50 to 80% of combination. The IC50 values of the FPIA with different incubation time were in the range of 5.75 and 5.89 ng/mL (Supplementary Figure 2A), which were no significant difference. Therefore, the FP values could be determined immediately after addition of mAb 3D11B12E5. The organic solvent is essential reagent in extraction and dissolution of pesticide, which usually shows great influence on immunoassays. Methanol is commonly used in immunoassays because of its relatively weak effect on immunoreactions between antibody and antigen. As shown in Supplementary Figure 2B, with the increase of methanol content, the IC50 values increased and the mPmax/IC50 values decreased. Finally, the maximum tolerance to methanol of the FPIA was 5%. The optimal concentration of Na+ and pH were 0.1 mol/L and 7.4, respectively, because the FPIA showed the highest FPmax/IC50 (Supplementary Figures 2C,D).

Table 2. The polarization of antibody concentration.
Sensitivity and Specificity
The FPIA for IMI was developed in a competitive format. With the increase of concentration of IMI, the IMI-EDF bound to mAb 3D11B12E5 would decrease, which resulted in the decrease of FP value. Under the optimal conditions, the standard curve of the FPIA for IMI was shown in Figure 2. The IC50, limit of detection (LOD, IC10) and linear range were calculated as 4.8, 1.7, and 1.7–16.3 μg/L, respectively. Compared with the reported articles, the FPIA showed higher sensitivity (IC50) than the enzyme-linked immunosorbent assay (ELISA) with IC50 of 17.3 ng/mL (Jae et al., 2001) and inner filter effect (IFE) immunoassay with SC50 (the concentration recovering 50% saturation of the signal) of 18.7 μg/L (Si et al., 2018). Although the FPIA had lower sensitivity than the fluorescence-based immunoassay (FIA) with IC50 of 1.3 ng/mL (Li et al., 2019) and the lateral flow immunoassays (LFIAs) with IC50 values of 0.13 and 0.14 ng/mL (Tan et al., 2020), it had advantages of simpler operation and high-throughput test. Importantly, the maximum residue limits (MRL) of IMI on agricultural products are in the range of 0.05 to 10 mg/kg in China, for example, the MRLs of IMI are 0.05 mg/kg for corn and 1 mg/kg for cucumber. Besides, and the range of MRLs are 0.01 to 50 mg/kg in Food and Agriculture Organization of the United Nations (FAO), and the MRLs for cereal grains and cucumber are 0.05 and 1 mg/kg, respectively. The sensitivity of the FPIA could meet the requirements for the detection of IMI under an appropriate pre-treatment.
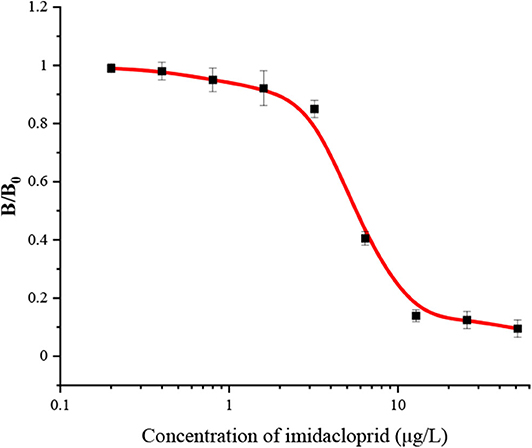
Figure 2. The standard curve of FPIA for IMI.
The CRs of the FPIA for the analogs were negligible (≤7.6%) except for imidaclothiz with CR of 79.1% (Table 3), because they both have nitro-dihydroimidazol-amine group, which was an important part for antibody recognition. According to the reported articles, most immunoassays for IMI showed CR with imidaclothiz. Si et al. (2018) reported an IFE immunoassay showed 90.3, 32.7, and 32.8% CRs for imidaclothiz, thiacloprid, and chothianidin, respectively. Guo et al. (2021) developed a fluorescence resonance energy transfer (FRET) immunoassay for IMI, which had 74.4% CR with imidaclothiz.
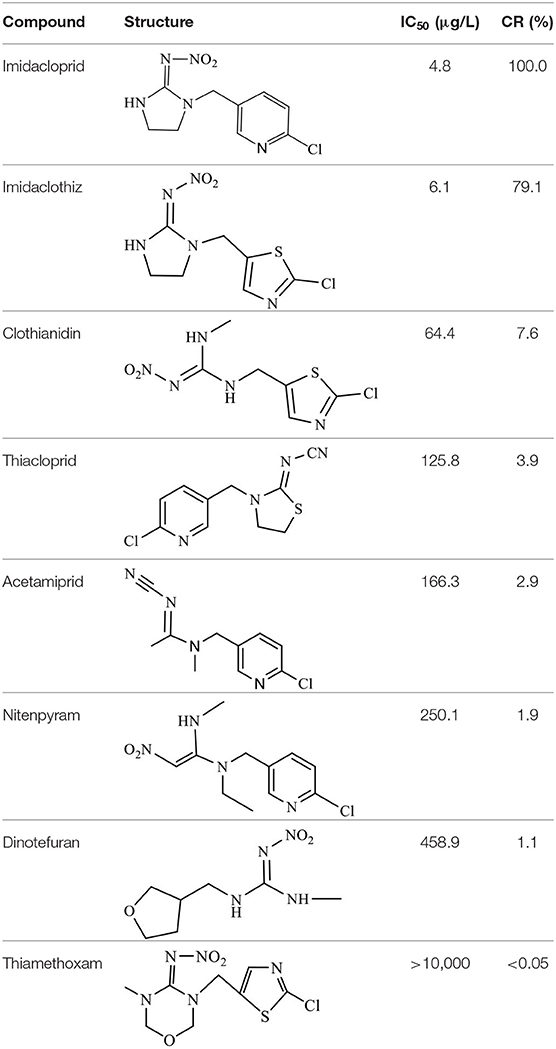
Table 3. Cross-reactivity of IMI toward some of its analogs by FPIA.
Matrix Effect and Recovery of Spiked Samples
The sample matrix could affect the accuracy of the immunoassay and is usually removed by dilution with buffer. As shown in Supplementary Figure 3, the matrix interference of corn and cucumber could be eliminated after 16-fold dilution, and paddy water was 2-fold dilution at least, because the standard curve prepared by the diluted matrix were closest to the standard curve prepared by buffer. Under the dilutions, the average recoveries of FPIA for spiked samples were range in 82.4–118.5% with relative standard deviation (RSD) of 7.0–15.9% (Table 4).
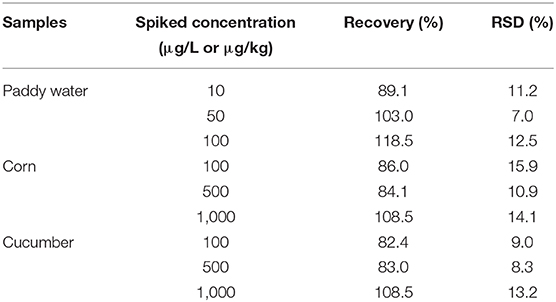
Table 4. Recovery of IMI in spiked samples.
The Validation of FPIA With HPLC
Seven authentic samples were tested by HPLC and FPIA simultaneously. There were good correlations between FPIA and HPLC, because the slope value of correlation curve was very close to 1 (y = 0.975x - 0.286, R2 = 0.980) (Figure 3). These results indicated that the FPIA were reliable for quantitative detection of IMI in authentic samples.
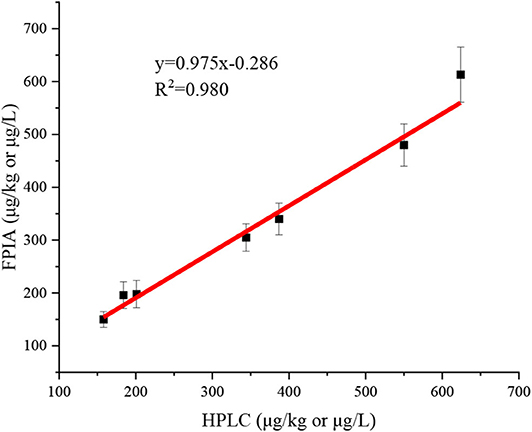
Figure 3. Correlation between FPIA and HPLC for the concentrations of IMI in authentic samples.
Conclusions
In this study, serial tracers were prepared by conjugation of IMI, ACE, and THI haptens with EDF and AMF. The tracer of IMI-EDF was employed to develop a FPIA for IMI because of the largest FP value increase in the presence of mAb. The FPIA was a homogeneous one-step assay that does not require incubation and washing. The samples can be tested directly after simple processing. The LOD, IC50 value and the linear range of the FPIA were 1.7, 4.8, and 1.7–16.3 μg/L, respectively. The FPIA showed the CR of 79.1% for imidaclothiz. In addition, the results of the FPIA for the authentic samples were in good agreement with those of HPLC. Therefore, the FPIA can be used to detect IMI in agricultural and environmental samples. Besides, the FPIA also can combine with the portable polarimeter to realize quickly and on-site detection.
Data Availability Statement
The original contributions presented in the study are included in the article/Supplementary Material, further inquiries can be directed to the corresponding author/s.
Author Contributions
LZ: conceptualization, methodology, software, investigation, formal analysis, and writing—original draft. JY: preparation of fluorescent tracers, formal analysis, and supervision. ZT: investigation, software, and original draft. SE: review, editing, visualization, and supervision. XH: validation, formal analysis, visualization, and supervision. MW: resources, writing—review and editing, supervision, data curation, and project administration. All authors contributed to the article and approved the submitted version.
Conflict of Interest
The authors declare that the research was conducted in the absence of any commercial or financial relationships that could be construed as a potential conflict of interest.
Supplementary Material
The Supplementary Material for this article can be found online at: https://www.frontiersin.org/articles/10.3389/fchem.2020.615594/full#supplementary-material
References
Ana, M.-C., Luis, B.-E., Christy, A.-M., and John, S.-R. (2019). Nutrients and sediment modify the impacts of a neonicotinoid insecticide on freshwater community structure and ecosystem functioning. Sci. Total Environ. 692, 1291–1303. doi: 10.1016/j.scitotenv.2019.06.301
Anna, K., Ksenia,. M., Sergei, A.-E., Anatoly, V.-Z., Josep, V.-M., Antonio, A.-F., et al. (2017). Fluorescence polarisation immunoassays for strobilurin fungicides kresoxim-methyl, trifloxystrobin and picoxystrobin. Talanta 162, 495–504. doi: 10.1016/j.talanta.2016.10.063
Brian, M.-E., Donald, E. M., Scott, M.-S., and Loke, T.-K. (2009). Evaluation of ELISA for imidacloprid detection in eastern hemlock (Tsuga canadensis) wood and needle tissues. Pest. Manag. Sci. 65, 122–128. doi: 10.1002/ps.1655
Carretero, A.-S., Cruces-Blanco, C., Duran, S.-P., and Gutierrez, A.-F. (2003). Determination of imidacloprid and its metabolite 6-chloronicotinic acid in greenhouse air by application of micellar electrokinetic capillary chromatography with solid-phase extraction. J. Chromatogr. A 1003, 189–195. doi: 10.1016/S0021-9673(03)00835-5
Chun, H.-S., Choi, E.-H., Chang, H.-J., Choi, S.-W., and Eremin, S.-A. (2009). A fluorescence polarization immunoassay for the detection of zearalenone in corn. Anal. Chim. Acta 639, 83–89. doi: 10.1016/j.aca.2009.02.048
Ding, Y., Chen, H., Yang, Q., Feng, L., Hua, X.-D., and Wang, M.-H. (2019). A fluorescence polarization immunoassay for detection of thiacloprid in environmental and agricultural samples. RSC Adv. 9, 36825–36830. doi: 10.1039/C9RA04776J
Elena, A.-Z., Anatoly, V.-Z., Andey, A.-F., Ramadan, A.-A., Sergei, A.-E., and Boris, B.-D. (2018). Fluorescence polarization immunoassay of colchicine. J. Pharmaceut. Biomed. 159, 326–330. doi: 10.1016/j.jpba.2018.07.008
Fang, Q.-K., Wang, L.-M., Cheng, Q., Cai, J., Wang, L.-L., Yang, M.-M., et al. (2015). A bare-eye based one-step signal amplified semiquantitative immunochromatographic assay for the detection of imidacloprid in Chinese cabbage samples. Anal. Chim. Acta 881, 82–89. doi: 10.1016/j.aca.2015.04.047
Guo, Y.-R., Zou, R.-B., Si, F.-F., Lang, W.-L., Zhang, T.-Y., Chang, Y.-Y., et al. (2021). A sensitive immunoassay based on fluorescence resonance energy transfer from up-converting nanoparticles and graphene oxide for one-step detection of imidacloprid. Food Chem. 335:127609. doi: 10.1016/j.foodchem.2020.127609
Jae, K.-L., Ki, C.-A., Oee, S.-P., Shin, Y.-K., and Bruce, D.-K. (2001). Development of an ELISA for the detection of the residues of the insecticide imidacloprid in agricultural and environmental samples. J. Agric. Food Chem. 49, 2159–2167. doi: 10.1021/jf001140v
Kim, H.-J., Liu, S.-Z.Y., Keum, Y.-S., and Li, Q.-X. (2003). Development of an enzyme-linked immunosorbent assay for the insecticide thiamethoxam. J. Agric. Food Chem. 51, 1823–1830. doi: 10.1021/jf0210472
Kolosova, A.-Y., Park, J.-H., Eremin, S.-A., Kang, S.-J., and Chung, D.-H. (2003). Fluorescence polarization immunoassay based on a monoclonal antibody for the detection of the organophosphorus pesticide parathion-methyl. J. Agric. Food Chem. 51, 1107–1114. doi: 10.1021/jf025801v
Lee, J.-K., Ahn, K.-C., Park, O.-S., Kang, S.-Y., and Hammock, B.-D. (2001). Development of an ELISA for the detection of the residues of the insecticide imidacloprid in agricultural and environmental samples. J. Agric. Food Chem. 49, 35–45.
Li, H.-X., Jin, R., Kong, D.-S., Zhao, X., Liu, F.-M., Yan, X., et al. (2019). Switchable fluorescence immunoassay using gold nanoclusters anchored cobalt oxyhydroxide composite for sensitive detection of imidacloprid. Sens. Actuat. B Chem. 283, 207–214. doi: 10.1016/j.snb.2018.12.026
Ma, M., Chen, M., Feng, L., You, H.-J., Yang, R., Boroduleva, A., et al. (2016). Fluorescence polarization immunoassay for highly efficient detection of imidaclothiz in agricultural samples. Food Anal. Methods 9, 2471–2478. doi: 10.1007/s12161-016-0434-5
Massara, M., Zohra, G., Maryem, B.-S., Sameh, B.-K., Khansa, C., Fatma, A., et al. (2018). Chemoprotective role of ethanol extract of Urtica urens L. against the toxicity of imidacloprid on endocrine disruption and ovarian morphometric in female rats, GC/MS analysis. Biomed. Pharmacother. 97, 518–527. doi: 10.1016/j.biopha.2017.10.150
Mi, T., Wang, Z.-H., Eremin, S.-A., Shen, J.-Z., and Zhang, S.-X. (2013). Simultaneous determination of multiple (fluoro) quinolone antibiotics in food samples by a one-step fluorescence polarization immunoassay. J. Agric. Food Chem. 61, 9347–9355. doi: 10.1021/jf403972r
Nasir, M.-S., and Jolley, M.-E. (2002). Development of a fluorescence polarization assay for the determination of aflatoxins in grains. J. Agric. Food Chem. 50, 3116–3121. doi: 10.1021/jf011638c
Navarro, P., Perez, A.-J., Gabaldon, J.-A., Nnuez-Delicado, E., Puchades, R., Maquieira, A., et al. (2013). Detection of chemical residues in tangerine juices by a duplex immunoassay. Talanta 116, 33–38. doi: 10.1016/j.talanta.2013.04.062
Rebecca, J.-R., Bartlomiej, J.-T., Laura, K., Emma, R., Martin, S.-W., Linda, M.-F., et al. (2020). Assessing the acute toxicity of insecticides to the buff-tailed bumblebee(Bombus terrestris audax). Pestic Biochem. Phys. 166:104562. doi: 10.1016/j.pestbp.2020.104562
Saeedeh, B., Parviz, A.-M., Sajjad, K., and Kaveh, M. (2020). Analysis of imidacloprid and penconazole residues during their pre-harvest intervals in the greenhouse cucumbers by HPLC-DAD. J Iran Chem Soc. 17:1439–1446. doi: 10.1007/s13738-020-01868-4
Shim, W.-B., Kolosova, A.-Y., Kim, Y.-J., Yang, Z.-Y., Park, S.-J., Eremin, S.-A., et al. (2004). Fluorescence polarization immunoassay based on a monoclonal antibody for the detection of ochratoxin A. Int. J. Food Sci. Technol. 39, 829–837. doi: 10.1111/j.1365-2621.2004.00856.x
Si, F.-F., Zou, R.-B., Jiao, S.-S., Qiao, X.-S., Guo, Y.-R., and Zhu, G.-N. (2018). Inner flter effect-based homogeneous immunoassay for rapid detection of imidacloprid residue in environmental and food samples. Ecotox. Environ. Safe 148, 862–868. doi: 10.1016/j.ecoenv.2017.11.062
Smith, D.-S., and Eremin, S.-A. (2008). Fluorescence polarization immunoassays and related methods for simple, high-throughput screening of small molecules. Anal. Bioanal. Chem. 391:1499. doi: 10.1007/s00216-008-1897-z
Su, W.-H., Sun, D.-W., He, J.-G., and Zhang, L.-B. (2017). Variation analysis in spectral indices of volatile chlorpyrifos and non-volatile imidacloprid in jujube (Ziziphus jujuba Mill.) using near-infrared hyperspectral imaging (NIR-HSI) and gas chromatograph-mass spectrometry (GC–MS). Comput. Electron. Agric. 139, 41–55. doi: 10.1016/j.compag.2017.04.017
Tan, G.-Y., Zhao, Y.-J., Wang, M., Chen, X.-J., Wang, B.-M., and Li, Q.-X. (2020). Ultrasensitive quantitation of imidacloprid in vegetables by colloidal gold and time-resolved fluorescent nanobead traced lateral flow immunoassays. Food Chem. 311:126055. doi: 10.1016/j.foodchem.2019.126055
Wanatabe, S., Ito, S., Kamata, Y., Omoda, N., Yamazaki, T., Munakata, H., et al. (2001). Development of competitive enzyme-linked immunosorbent assays (ELISAs) based on monoclonal antibodies for chloronicotinoid insecticides imidacloprid and acetamiprid. Anal. Chim. Acta 427, 211–219. doi: 10.1016/S0003-2670(00)01126-0
Wang, S., Xie, L.-X., Chen, H., Wu, G.-A., Zhou, H., Wang, Y., et al. (2020). Toxicity and risk assessment of eight neonicotinoid insecticides to workers of Bombus terrestris (Hymenoptera: Apoidea). Acta Entomol. Sin. 63, 29–35. doi: 10.16380/j.kcxb.2020.01.004
Watanabe, E., Eun, H., Baba, K., Arao, T., and Iahii, Y. (2004). Rapid and simple screening analysis for residual imidacloprid in agricultural products with commercially available ELISA. Anal. Chim. Acta 521, 45–51. doi: 10.1016/j.aca.2004.05.056
Xu, T., and Xu, Q.-D. (2012). Strip-based immunoassay for the simultaneous detection of the neonicotinoid insecticides imidacloprid and thiamethoxam in agricultural products. Talanta 101, 85–90. doi: 10.1016/j.talanta.2012.08.047
Xu, Z.-L., Wang, Q., Lei, H.-T., Eremin, S.-A., Shen, Y.-D., Wang, H., et al. (2011). A simple, rapid and high-throughput fluorescence polarization immunoassay for simultaneous detection of organophosphorus pesticides in vegetable and environmental water samples. Anal. Chim. Acta 708, 123–129. doi: 10.1016/j.aca.2011.09.040
Yang, J.-C., Yang, Q., Deng, J.-Q., Tao, Z.-Q., Hua, X.-D., and Wang, M.-H. (2018). Development of immunochromatographic assays for the detection of imidacloprid in soil chemical barrier. Environ. Sci. Pollut. R 25, 26617–26624. doi: 10.1007/s11356-018-2707-6
Yue, Q.-L., Shen, T.-F., Wang, L., Xu, S.-L., Li, H.-B., Xue, Q.-W., et al. (2014). A convenient sandwich assay of thrombin in biological media using nanoparticle-enhance fluorescence polarization. Biosens. Bioelectron. 56, 231–236. doi: 10.1016/j.bios.2014.01.021
Zhang, Q.-C., Wang, X.-L., Rao, Q.-X., Chen, S.-S., and Song, W.-G. (2020). Imidacloprid dissipation, metabolism and accumulation in Agaricus bisporus fruits, casing soil and compost and dietary risk assessment. Chemosphere 254:126837. doi: 10.1016/j.chemosphere.2020.126837
Zhang, X.-Y., Tang, Q.-Q., Mi, T.-J., Zhao, S.-J., Wen, K., Guo, L.-C., et al. (2018). Dual-wavelength fluorescence polarization immunoassay to increase information content per screen: applications for simultaneous detection of total aflatoxins and family zearalenones in maize. Food Control 87, 100–108. doi: 10.1016/j.foodcont.2017.12.002
Keywords: imidacloprid, fluorescence polarization immunoassay, fluorescent tracers, pesticide residue, high throughput detection
Citation: Zhou L, Yang J, Tao Z, Eremin SA, Hua X and Wang M (2020) Development of Fluorescence Polarization Immunoassay for Imidacloprid in Environmental and Agricultural Samples. Front. Chem. 8:615594. doi: 10.3389/fchem.2020.615594
Received: 09 October 2020; Accepted: 09 November 2020;
Published: 02 December 2020.
Edited by:
Xu Yan, Jilin University, ChinaReviewed by:
Lin Luo, South China Agricultural University, ChinaDongyang Li, University of California, Davis, United States
Copyright © 2020 Zhou, Yang, Tao, Eremin, Hua and Wang. This is an open-access article distributed under the terms of the Creative Commons Attribution License (CC BY). The use, distribution or reproduction in other forums is permitted, provided the original author(s) and the copyright owner(s) are credited and that the original publication in this journal is cited, in accordance with accepted academic practice. No use, distribution or reproduction is permitted which does not comply with these terms.
*Correspondence: Minghua Wang, d2FuZ21oYUBuamF1LmVkdS5jbg==