 Shreya Ghosh
 Yinghua Chen
 Anne George
 Mitra Dutta3,4
 Michael A. Stroscio
95% of researchers rate our articles as excellent or good
Learn more about the work of our research integrity team to safeguard the quality of each article we publish.
Find out more
ORIGINAL RESEARCH article
Front. Chem. , 11 August 2020
Sec. Nanoscience
Volume 8 - 2020 | https://doi.org/10.3389/fchem.2020.00594
This article is part of the Research Topic Functionalized Inorganic Semiconductor Nanomaterials: Characterization, Properties, and Applications View all 18 articles
A simple optical aptasensor has been synthesized for the detection of calcium ions. This sensing approach employs a semiconductor quantum dot (QD)–gold nanoparticle as the donor–quencher pair and operates on the principle of fluorescence resonant energy transfer (FRET). On binding with calcium ions, the DNA aptamer undergoes a conformational change, which changes the distance between the quantum dot and the gold nanoparticle, conjugated on the 5′ terminal and 3′ terminal of the aptamer, respectively. This phenomenon results in the quenching of the quantum dot emission. In this sensor, a maximum quenching of 22.42 ± 0.71% has been achieved at 35 nM calcium ion concentration while the limit of detection has been determined to be 3.77 pM. The sensor has been found to have high specificity for calcium ions in comparison to other metal ions like sodium, magnesium, and potassium. The molecular apta-beacons also demonstrated successful endocytosis and FRET-based calcium ion detection in osteocyte cells when conjugated with a cell-penetrating peptide (DSS).
Calcium ions (Ca2+) are an essential component of the physiological system. They play a significant role as an intracellular messenger, which regulates several cellular functions like secretion, contraction, excitability, and gene expression (Russell, 2011). An increased Ca2+ release can contribute to diseases like HIV, schizophrenia, and Alzheimer's disease (Wojda et al., 2008). The review by Feske et al. throws light on the role of Ca2+ signaling in congenital immunodeficiency syndromes along with autoimmunity and inflammatory conditions (Feske, 2007). For instance, in systemic lupus erythematosus (SLE), it has been observed that signaling through the B-cell receptor in B cells is abnormal and results in increased Ca2+ signals. Chung et al. reported that with an elevation in the Ca2+ concentration, there was a greater risk of long-term mortality after an acute ischemic stroke (Chung et al., 2015). Hence, owing to the significance of this metal ion in the physiological system, the objective of this study is to design a sensor, which rapidly detects Ca2+. Asif et al. reported a zinc oxide nanorod-extended gate field-effect transistor (MOSFET), which detected Ca2+ linearly between 1 μM and 1 mM (Asif et al., 2009). Several analytical techniques for Ca2+ sensing have been published in literature. Ankireddy designed an optical sensor consisting of highly fluorescent ethylenediaminetetraacetic acid (EDTA)-CDs (ECDs) to detect Ca2+ in human serum with a detection limit of 77 pM (Ankireddy and Kim, 2018). Calsequestrin-functionalized gold nanoparticles were employed by Kim et al. to detect Ca2+ colorimetrically in human serum (Kim et al., 2009). Asadnia et al. used an AlGaN/GaN transistor functionalized with poly(vinylchloride) (PVC)-based membranes as a sensing platform for Ca2+ (Asadnia et al., 2017). Other methods include potentiometric detection (Ganjali et al., 2005; Singh and Mehtab, 2007), microfluidic chips (Caglar et al., 2006), and ion-selective electrodes (Schefer et al., 1986). Although in the last few years the development of aptamer-based sensors for various kinds of target detection has attracted huge interest, they have been hardly explored in the field of Ca2+ detection. Aptasensors utilize short single-stranded DNA/RNA oligonucleotides to bind to a specific target molecule. The binding affinity can be transduced using various methods and therefore can be employed as a primary sensing component in several types of sensors. In this manuscript, we have designed a DNA aptamer-based optical sensor for the detection of calcium ions. This sensor is based on the principle of FRET, which changes the photoluminescence (PL) intensity of the semiconductor quantum dot crystal depending on its distance with the gold nanoparticle quencher (Figure 1A).
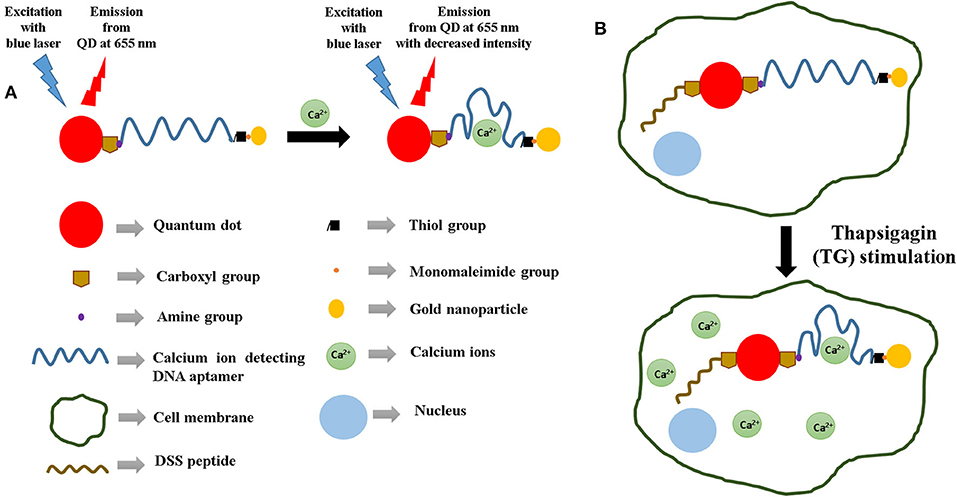
Figure 1. (A) Sensing strategy used for the detection of calcium ions using DNA aptamers and the quantum dot–gold nanoparticle FRET pair. (B) Illustration of the strategy used for the aptasensor-based detection of calcium ions inside cells. In this case, a cell-penetrating peptide (DSS) is used to endocytose the sensors within the cells.
The phenomenon of fluorescence resonance energy transfer (FRET) facilitates transfer of energy from a “donor” to an “acceptor.” In the process of FRET, the efficiency is proportional to 1/{1 + (d/do)6}, where d is the distance between the donor and the acceptor and do has been determined to be approximately 5 nm (Markvart, 2000; Yun et al., 2005; Shu et al., 2013). This distance-dependent behavior occurs due to dipole–dipole interactions between the donor and the acceptor. The effect of FRET is relatively strong when d is less than about 5 nm and starts getting weaker when d is greater than about 5 nm. This study incorporates a quantum dot as the donor and a gold nanoparticle as the acceptor. Variation of distance between the QD and the nanoparticle quencher causes a transfer of energy from the QD to the nanoparticle. When d between QD and the nanoparticle acceptor is less than 5 nm, there is less energy available in the QD to emit as photons because of a strong transfer of energy from it to the quencher. Consequently, the QD light emission decreases significantly. The sensor design involves the QD donor and the gold nanoparticle acceptor conjugated to opposite ends of a DNA aptamer, which functions as the primary sensing element here. This is because the aptamer has the ability to change its conformation on binding to the target analyte. As a result of the change in the conformational shape of the aptamer, there is a variation in d, which further causes a change in the intensity of the light emitted by the QD. Therefore, this change in QD emission can be considered as an indicator of d as well as the binding between the aptamer and the target. This phenomenon has been used as the principle of Ca2+ detection in this molecular beacon-based sensing platform.
In the recent years, quantum dots of various types of composition (Qi et al., 2016; Jia et al., 2020) have attracted huge attention because of their applicability in a wide variety of biomedical applications (Wegner et al., 2019; Song et al., 2020). We have successfully detected biomarker proteins like glycated albumin (Ghosh et al., 2017) and tumor necrosis factor-alpha (Ghosh et al., 2018) using this design strategy. Apart from biomarker proteins, our group has also used this sensing strategy to detect metal ions like potassium (Wu et al., 2011; Meshik et al., 2014), lead (Brenneman et al., 2013; Meshik et al., 2014), and mercury (Brenneman et al., 2010). The innovation of this study lies in the design of the sensor, which has a cell-penetrating peptide conjugated to the aptamer-based FRET sensor. Such a sensor for the detection of calcium ions has not been reported in literature previously. Therefore, this paper also investigates the response of a cell-penetrating peptide (DSS)-conjugated aptasensor inside a cellular environment and its effectiveness in detecting intracellular Ca2+ (Figure 1B). Such aptasensors have the potential of being incorporated in point-of-care setups for clinical applications.
The calcium-detecting DNA aptamer was purchased from Biosearch Technologies (Petaluma, CA). Calcium chloride dihydrate (CaCl2·2H2O), 2 M magnesium chloride (MgCl2) solution, and 5 M sodium chloride (NaCl) solution were purchased from Sigma-Aldrich (St. Louis, MO) while 4.6 M potassium chloride (KCl) solution was obtained from Fischer Chemicals (Fairlawn, NJ). 1-Ethyl-3-(3-dimethylaminopropyl)-carbodiimide (EDC) and tris(2-carboxyethyl)phosphine (TCEP) were purchased from Pierce Biotechnology (Rockford, IL). Monomaleimide-functionalized nanogold particles (diameter = 1.4 nm) were obtained from Nanoprobes (Yaphank, NY). Carboxyl-coated CdSe/ZnS QDs e-flour ITK 655NC (diameter = 20 nm) was obtained from Life Technologies (Carlsbad, CA). Nanosep molecular weight cutoff (MWCO) filters of 3 and 100 k pore sizes were purchased from Pall Life Sciences (Ann Arbor, MI).
The calcium-detecting DNA aptamer consisted of 12 bases and had been modified with an amine group on the 5′ terminal and a thiol functional group on the 3′ terminal (5′-amino C6/GGGGTTTTGGGG/thiol C6 SS 3′). The aptamer was dissolved into 654 μl of tris ethylenediamine tetraethyl acetate (EDTA) buffer to obtain 100 μM aptamer stock solution in order to prevent cation-induced degradation.
The molecular beacon was synthesized based on the protocol reported by Ghosh et al. (2017, 2018). Briefly, 9 μl of TCEP was added to 20 μl of the 100 μM calcium-detecting aptamer. The mixture was allowed to incubate for 30 min at room temperature so that the dithiol groups in the aptamer get reduced. One vial of gold nanoparticles (6 nmol) was added to 100 ml of deionized water to form a solution, which was further added to the aptamer–TCEP mixture (quencher: aptamer = 3:1 approximately). This mixture was then incubated for 2 h at room temperature, after which it was centrifuged [Fisher Scientific accuSpin Micro (Fisher Scientific, USA)] twice at 5,000 rpm for 15 min each using a 3 k MWCO filter. This step ensured the removal of excess unbound gold nanoparticles from the mixture. The supernatant after each centrifugation was washed with 50 μl of deionized water. 13 μl of carboxylated CdSe/ZnS QDs (0.1 nmol) was mixed with 87 μl of 10 mM borate buffer (pH 7.4) to form a 100 μl QD solution, which was further added to the filtered DNA aptamer/gold nanoparticle solution in the presence of 23 μl of 4 μg/μl EDC/Sulfo-NHS solution. The resulting mixture was then allowed to shake gently for 2 h at room temperature, following which the samples were centrifuged five times at 7,000 rpm for 5 min each using a 100 k MWCO filter in 50 mM borate buffer (pH 8.3). The supernatant left after each centrifugation was washed with 50 μl of the 50 mM borate buffer (pH 8.3). This resulted in the removal of unbound aptamers and EDC from the sensor solution.
9 μl of TCEP was added to 20 μl of the 100 μM calcium-detecting aptamer. The mixture was allowed to incubate for 30 min at room temperature so that the dithiol groups in the aptamer get reduced. One vial of gold nanoparticles (6 nmol) was added to 100 ml of deionized water to form a solution, which was further added to the aptamer–TCEP mixture (quencher: aptamer = 3:1 approximately). This mixture was then incubated for 2 h at room temperature, after which it was centrifuged (Fisher Scientific accuSpin Micro [Fisher Scientific, USA)] twice at 5,000 rpm for 15 min each using a 3 k MWCO filter. The supernatant after each centrifugation was washed with 50 μl of deionized water. 13 μl of carboxylated CdSe/ZnS QDs (0.1 nmol) was mixed with 87 μl of 10 mM borate buffer (pH 7.4) to form a 100 μl QD solution. A 10-mg/ml DSS peptide solution was prepared by adding 2.3 mg of the DSS peptide to 230 μl of deionized water. 30 μl of 4 μg/μl EDC/Sulfo-NHS solution was added to a mixture of 100 μl of the QD solution, 230 μl of the DSS peptide, and the filtered calcium aptamer/gold nanoparticle solution in order to facilitate binding. Subsequently, this mixture was allowed to shake for 2 h at room temperature, following which the samples were centrifuged five times at 7,000 rpm for 5 min each using a 100 k MWCO filter in 50 mM borate buffer (pH 8.3). The supernatant obtained after each centrifugation cycle was washed with 50 μl of the 50 mM borate buffer (pH 8.3).
The secondary structure of the calcium ion-detecting DNA aptamer was predicted using the M-fold web server (SantaLucia, 1998; Peyret, 2000; Zuker, 2003). The predicted secondary structures were compared at different temperatures and sodium ion (Na+) concentrations. The temperatures used are as follows: (1) 20°C: This has been considered as the room temperature and the temperature in which the optical characterization experiments were conducted (2) 37°C: This is the temperature under physiological conditions. There were three different ionic conditions considered: (1) 1.37 mM Na+, (2) 10 mM Na+, and (3) 150 mM Na+. These sodium ion concentrations were chosen because the Na+ concentration for this aptasensor is approximately 1.37 mM while the concentration of Na+ in a mammalian cell and blood is around 12 and 145 mM, respectively (Lodish et al., 2000).
The 1 M CaCl2 stock solution was prepared by adding 1 g CaCl2 to 10 ml deionized water. This stock solution was serially diluted to obtain solutions having concentrations of 0.7 nM, 3.5 nM, 7 nM, 35 nM, 0.7 μM, and 3.5 μM, respectively. These solutions were used as working solutions. 5 μl of these working solutions was added to 750 μl of the sensor solution in the cuvette, which was then allowed to stand undisturbed for 5 min. This time period ensured the binding of the calcium ion to the DNA aptamer in the sensor. The photoluminescence intensities were subsequently recorded using a USB4000 Ocean Optics (Dunedin, FL, USA) spectrophotometer with a continuous 375-nm LED excitation.
One-mM stock solutions of the control analytes (NaCl, MgCl2, and KCl) were obtained by serially diluting the respective 5 M NaCl, 2 M MgCl2, and 4.6 M KCl solutions. The respective stock solutions were then serially diluted to obtain 1 μM and 100 μM working solutions. These working solutions were added to the sensor solution in such a way that the final concentration of the control analytes were 660 pM, 7 nM, 600 nM, and 7 μM. The PL spectra corresponding to the controls were recorded after 5 μl of the control ion was added to 750 μl of the sensor solution and allowed to stand disturbed for 5 min.
Mouse pre-osteocyte cells (MC3T3 E1—ATCC, Manassas, VA) were cultured in α-MEM (Corning Inc., Corning, NY) with 10% FBS (Thermo Fisher Scientific, Waltham, MA) and 1% antibiotic–antimycotic (100×, Life Technologies) at 37°C in a humidified incubator with 5% CO2. The 300,000 cells were seeded on a φ 25-mm cover glass in a well of a 6-well culture plate. The next day, the DSS-conjugated molecular beacons (0.1 mg/ml) were added. After 1 h, the cells were washed with pre-warmed PBS without calcium and magnesium three times to remove un-incorporated/free molecular beacons. Then, thapsigargin (TG—final concentration at 1 μM) [MilliporeSigma, Burlington, MA)] in PBS without calcium and magnesium was added to trigger the calcium release from endoplasmic reticulum storage. At the indicated time point, formaldehyde solution (37%) (Thermo Fisher Scientific, Waltham, MA) was added at 1/10 of TG solution volume (20 μL to 200 μL) to stop the reaction and fix cells for 1 h at room temperature. After washing with PBS for 3 times, the cover glass was mounted on a glass slide with a mounting agent with DAPI (Vector Lab, Burlingame, CA). The fluorescence signals from the molecular beacons were observed with a Zeiss LSM 710 Confocal Microscope in Research Resources Center of University of Illinois at Chicago.
The secondary structure of the DNA aptamer was found to be similar under all conditions mentioned in Figures 2A–F. As predicted by the M-fold web server, the secondary structure had a characteristic external loop and a hairpin loop. The external loop was composed of 5 single-strand bases along with 1 closing helix. On the other hand, the hairpin loop had a closing pair at G1-T7. As shown in Table 1, Gibb's free energy was observed to increase with an increase in temperature while no such pattern was observed for the sodium ion concentration. The aptamer was chosen from the work reported by Miyoshi et al. (2003). They determined that the DNA aptamer underwent a structural transition from antiparallel to parallel G-quadruplex in the presence of Ca2+. This characteristic was utilized to induce FRET in the proposed sensor here.
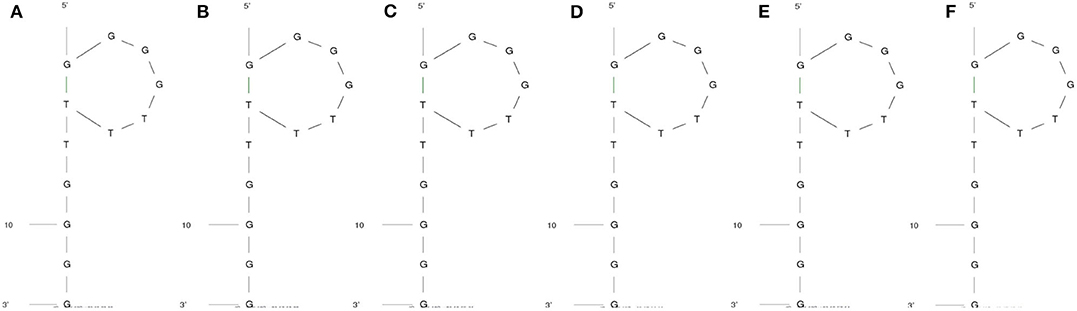
Figure 2. Secondary structure of the aptamer when the temperature and Na+ concentrations are (A) 20°C and 1.37 mM, (B) 37°C and 1.37 mM, (C) 20°C and 10 mM, (D) 37°C and 10 mM, (E) 20°C and 150 mM, and (F) 37°C and 150 mM, respectively.
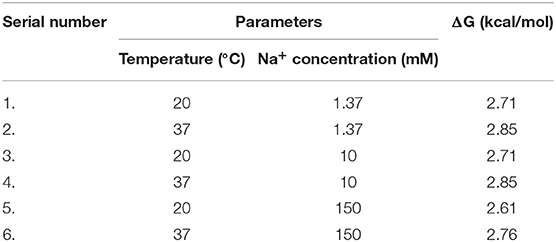
Table 1. Gibbs-free energy values of the Ca2+-detecting DNA aptamer under various Na+ concentrations and temperature conditions.
A decrease in photoluminescence intensity was observed with an increase in the concentration of the calcium ions. This phenomenon is shown in Figure 3A, where the PL spectra indicate a decrease when Ca2+ is progressively added between 0 pM and 35 nM. A consistent repetition of this behavior is observed in Figure 3B when the experiments are repeated in quintuplicates (n = 5), where the average PL intensity decreases with an increase in the target ion concentration. Figure 3C shows the quenching behavior of the sensor samples. Quenching (%) has been calculated using Equation (1), where Iblank is the peak photoluminescence intensity before the addition of target, ICa is the peak photoluminescence intensity after the addition of Ca2+, and quenching (%) is the quenching efficiency of the sensor. The quenching efficiency is an indicator of the occurrence of FRET in the sensor while detecting the target analyte (Held, 2005).
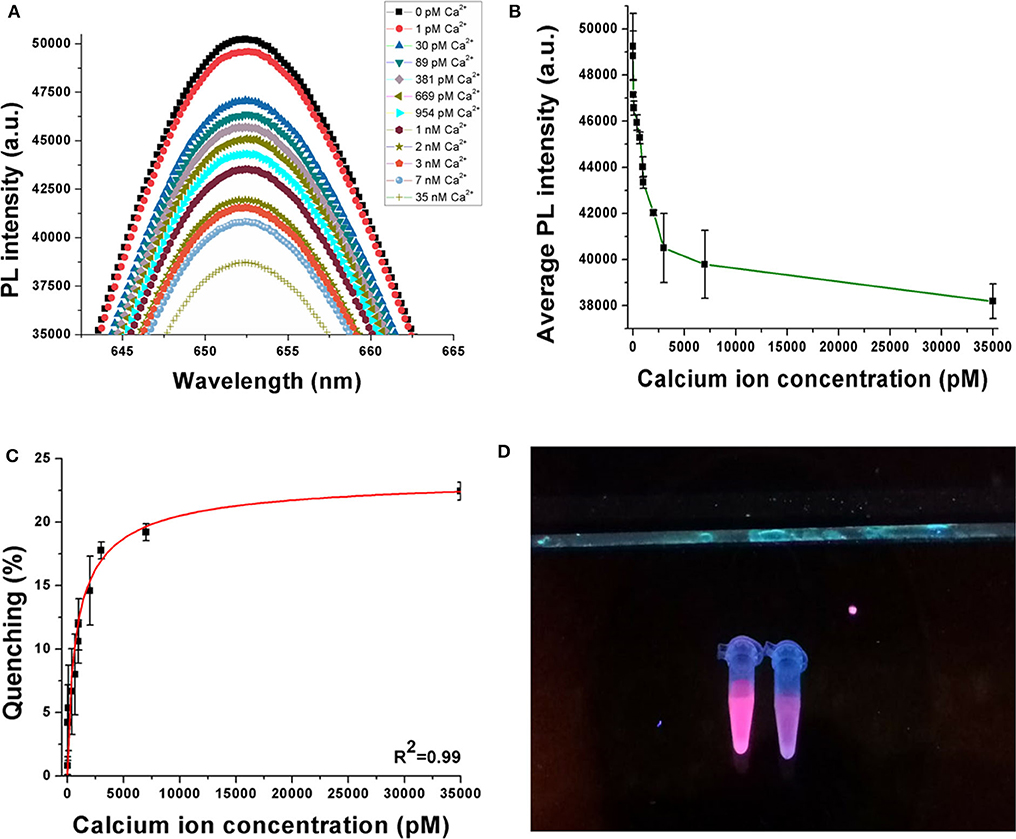
Figure 3. (A) Decrease in PL intensity with increase in Ca2+ concentration. (B) Average PL intensity curve of the sensor when experiments are repeated with multiple samples. (C) Quenching behavior of the sensor when the concentration of Ca2+ is increased up to 35 nM. (D) Visual illustration of quenching phenomena in the sensor on addition of target ion. Experiments have been conducted in quintuplicates (n = 5).
According to Figure 3C, the sensor achieves average quenching efficiencies of 4.2 ± 2.97% and 22.42 ± 0.71% at 30 pM and 35 nM Ca2+ concentrations, respectively. This behavior can be attributed to the phenomenon of FRET, where the DNA aptamer binds to the target analyte and changes its conformation, because of which the donor (QD) and the quencher (gold nanoparticles) are driven closer to each other. Consequently, owing to a dipole–dipole interaction between the FRET pair, there is an intersystem transfer of energy from the donor to the quencher. This reduces the resulting emission from the QDs, causing a decrease in PL intensity. As the concentration of the target ion is increased, a greater number of DNA aptamers bind to them and hence a higher number of QDs participate in FRET. In this case, the DNA aptamer has been reported to have an antiparallel G-quadruplex structure initially. Addition of Ca2+ induces the formation of a parallel G-quadruplex structure and finally to a G-wire structure. The parallel G-quadruplex has been found to be unstable, and hence, the aptamer rapidly transitions to the G-wire structure. The visual illustration shown in Figure 3D shows reduced fluorescence emission from the sample on the right compared to that on the left because the latter has no target analyte added to it while the former has 100 nM Ca2+ added. This further establishes the successful occurrence of FRET in the sensor on the addition of the target ion.
According to Figure 3C, the quenching behavior of the nanosensor follows the Hill chemical kinetics. In the Hill formalism, the quenching efficiency can be expressed as:
Based on the definition of Hill's equation, 906.703 pM refers to the concentration at which half of the receptors are occupied by the target. The Hill coefficient of 0.765 is the slope of the Hill curve and also refers to negative cooperativity with respect to substrate binding. Also, from the equation theory, the average binding constant (KD) can be estimated as 183 pM.
From the results obtained in Equation (3), where the SD0 is the normalized standard deviation of the blank sensor sample while SensitivityCa is the slope of the quenching curve (Figure 3C), the limit of detection (LOD) was calculated to be 3.77 pM or 0.55 pg/ml (assuming molecular weight of the CaCl2·2H2O = 147 g/mol). The LOD obtained from this sensor has been compared with several other sensing platforms for Ca2+ in Table 2.
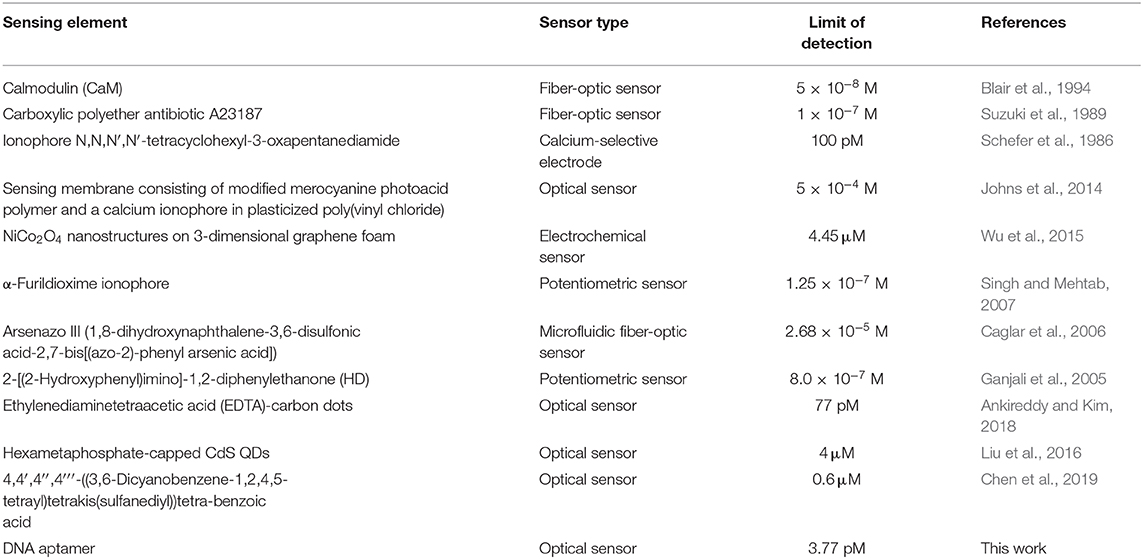
Table 2. Comparative summary of various sensing platforms reported in literature for calcium ion detection.
The sensor was observed to have significant selectivity toward Ca2+ when compared to the control metal ions like Na+, Mg2+, and K+. These cations were specifically chosen because of their importance and abundance in the physiological system. Figure 4 shows the quenching behavior of the control ions in the picomolar (pM) and nanomolar (nM) concentration range. In Figure 4A, the quenching efficiencies have been compared between all the four ions while keeping their concentrations the same (660 pM and 7 nM). Ca2+ was shown to have a significantly high quenching efficiency compared to Na+, Mg2+, and K+ at both 660 pM and 7 nM concentrations, respectively (Figure 4B), indicating a high selectivity of the sensor toward calcium in the pM concentration range. A similar response was observed even when the concentration of the control ions is much higher (660 nM and 7 μM) in the sensor solution. Their quenching efficiencies were significantly lower than that of Ca2+ at 35 nM concentration in the sensor. This further established the specificity of the aptasensor toward Ca2+.
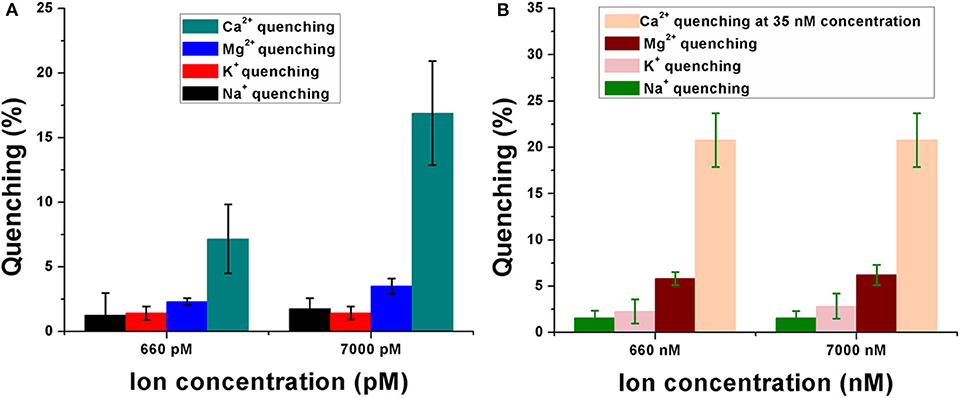
Figure 4. Response of the calcium ion-detecting nanosensor when tested with control ions like sodium (Na+), potassium (K+), and magnesium (Mg2+). Quenching efficiencies of the target ion have been compared with that of the control ions in the pM concentration range (A) as well as in the nM range (B). Experiments have been conducted in quintuplicates (n = 5).
The DSS peptide is a cell-penetrating peptide, which is composed of amino acids like aspartic acid and serine. It allows successful endocytosis of the DNA aptamer-based molecular beacons, and this has been shown in Figures 5a–h, which clearly indicates the red emission from the 655 nm QDs in the DSS-conjugated molecular beacons. A higher-intensity QD emission from the MC3T3 cells was observed in Figures 5a,b in the absence of TG stimulation. This sample has been indicated in the figure as control. TG stimulation increases intracellular calcium release, during which a greater number of aptasensors bind to the higher concentration of Ca2+, causing greater reduction in the fluorescence emission. As can be seen in Figures 5c–h, with an increase in the duration of TG stimulation, there was an elevation in the concentration of intracellular Ca2+. This decreased the fluorescence emission from the QDs with the progression of time and resulted in successful quenching in the presence of the target ion.
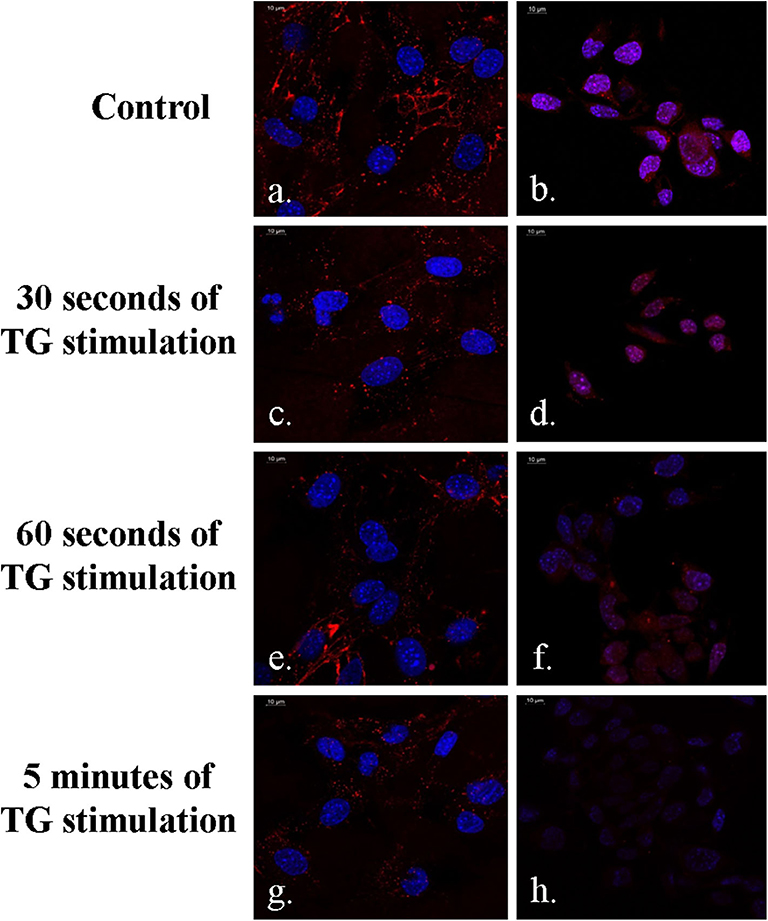
Figure 5. Demonstration of FRET in MC3T3 cells in the presence of the DSS conjugated aptasensors (a–h). Fluorescence emission is minimum at 5 min of TG stimulation (g,h).
It was observed that there was a slight increase in the QD emission from the DSS-conjugated molecular beacon when the duration of TG stimulation reached 15 min (Figures 6a–c). This phenomenon could be attributed to the structure of the DNA aptamer, which reorganizes itself to a G-wire formation. During this process, there is a possibility that the donor–quencher pair is driven away, causing a slight decrease in quenching. However, the difference in QD emission is not very high between 5 and 15 min (Figures 6b,c). Additionally, the phenomenon of FRET is still evident between the control sample and the sample with 15 min of TG stimulation (Figures 6a,c).
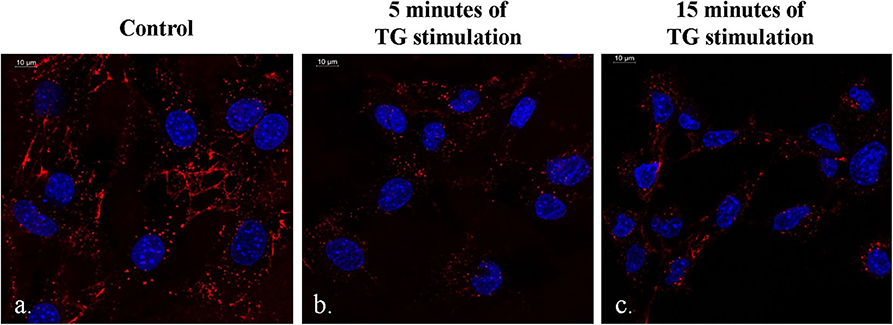
Figure 6. Difference in the quantum dot emission from the DSS-conjugated molecular beacon in the presence of no TG stimulation (a), 5 min of TG stimulation (b), and 15 minutes of TG stimulation (c).
This study reports a simple DNA aptamer-based optical sensor, which detects Ca2+ between 0 pM and 35 nM. It employs a DNA aptamer as the primary Ca2+ sensing element and operates on the principle of FRET. It has the ability to detect the target ion up to a lower limit of 3.77 pM. Primary advantages of this sensor lie in its ability to successfully detect Ca2+ in an intracellular environment when used in conjunction with a cell-penetrating peptide (DSS). Additionally, it has very low sample requirement (5 μl) and is quite flexible, i.e., the same sensing strategy can be used to detect other analytes by replacing the sensing element with a DNA aptamer specific to the analyte.
The original contributions presented in the study are included in the article/supplementary materials, further inquiries can be directed to the corresponding author/s.
MS and MD conceived and advised on the overall project idea. AG conceived the cell culture experiments. SG and YC performed the experiments and wrote the manuscript. All authors read and edited the manuscript.
This work was supported, in part, by the Army Research Office (subcontract FPO67468-01-PR to W911NF-18-1-0042) and the National Institutes of Health grant DE028531 (AG).
The authors declare that the research was conducted in the absence of any commercial or financial relationships that could be construed as a potential conflict of interest.
Ankireddy, S.R., and Kim, J. (2018). Chemical highly selective and sensitive detection of calcium (II) ions in human serum using novel fluorescent carbon dots. Sensor. Actuat. B-Chem. 255, 3425–3433. doi: 10.1016/j.snb.2017.09.172
Asadnia, M., Myers, M., Umana-membreno, G. A., Sanders, T. M., Mishra, U. K., Nener, B. D., et al. (2017). Analytica chimica Acta Ca 2 þ detection utilising AlGaN/GaN transistors with ion-selective polymer membranes, Anal. Chim. Acta. 987, 105–110. doi: 10.1016/j.aca.2017.07.066
Asif, M.H., Nur, O., Willander, M., and Danielsson, B. (2009). Selective calcium ion detection with functionalized ZnO nanorods-extended gate MOSFET. Biosens. Bioelectron. 24, 3379–3382. doi: 10.1016/j.bios.2009.04.011
Blair, T.L., Yang, S., Smith-palmer, T., and Bachas, L.G. (1994). Fiber optic sensor for Ca2+ based on an induced change in the conformation of the protein calmodulin. Anal. Chem. 66, 300–302. doi: 10.1021/ac00074a019
Brenneman, K.L., Poduri, S., Stroscio, M.A., and Dutta, M. (2013). Optical detection of lead (II) ions using DNA-based nanosensor. IEEE Sens. J. 13, 1783–1786. doi: 10.1109/JSEN.2013.2241757
Brenneman, K.L., Sen, B., Stroscio, M.A., and Dutta, M. (2010). Aptamer-based optical bionano sensor for mercury (II) ions. Nanotechnol. Mater. Devices Conf. (NMDC), IEEE 2010, 221–224. doi: 10.1109/NMDC.2010.5652331
Caglar, P., Tuncel, S. A., Malcik, N., Landers, J. P., and Ferrance, J. P. (2006). A microchip sensor for calcium determination. Anal. Bioanal. Chem. 386, 1303–1312. doi: 10.1007/s00216-006-0776-8
Chen, G., Zhou, Z., and Feng, H. (2019). An aggregation-induced phosphorescence probe for calcium ion-specific detection and live-cell imaging in Arabidopsis thaliana. Chem. Commun. 55, 4841–4844. doi: 10.1039/C9CC01580A
Chung, J., Ryu, W., Kim, J., and Yoon, B. (2015). Elevated calcium after acute ischemic stroke : association with a poor short-term outcome and long-term mortality. J. Stroke 17, 54–59. doi: 10.5853/jos.2015.17.1.54
Feske, S. (2007). Calcium signalling in lymphocyte activation and disease. Nat. Rev. Immunol. 7, 690–702. doi: 10.1038/nri2152
Ganjali, M. R., Zamani, H. A., Norouzi, P., Adib, M., and Accedy, M. (2005). Novel calcium sensor based on [2-(2-Hydroxyphenyl)aimino]−1, 2-diphenylethanone. Acta Chim. Slov. 52, 309–316. Available online at: http://acta-arhiv.chem-soc.si/52/52-3-309.pdf
Ghosh, S., Datta, D., Cheema, M., Dutta, M., and Stroscio, M. A. (2017). Aptasensor based optical detection of glycated albumin for diabetes mellitus diagnosis. Nanotechnology 28:aa893a. doi: 10.1088/1361-6528/aa893a
Ghosh, S., Datta, D., Chaudhry, S., Dutta, M., and Stroscio, M. A. (2018). Rapid detection of tumor necrosis factor-alpha using quantum dot based optical aptasensor. IEEE Trans. Nanobiosci. 17, 417–423. doi: 10.1109/TNB.2018.2852261
Held, P. (2005). An Introduction to Fluorescence Resonance Energy Transfer (FRET) Technology and its Application in Bioscience, BioTek. Available online at: https://www.biotek.com/resources/white-papers/an-introduction-to-fluorescence-resonance-energy-transfer-fret-technology-and-its-application-in-bioscience/
Jia, J., Sun, Y., Zhang, Y., Liu, Q., Cao, J., Huang, G., et al. (2020). Facile and efficient fabrication of bandgap tunable carbon quantum dots derived from anthracite and their photoluminescence properties. Front. Chem. 8:123. doi: 10.3389/fchem.2020.00123
Johns, V. K., Patel, P. K., Hassett, S., Calvo-marzal, P., Qin, Y., and Chumbimuni-torres, K. Y. (2014). Visible light activated ion sensing using a photoacid polymer for calcium detection. Anal. Chem. 86, 23–26. doi: 10.1021/ac500956j
Kim, S., Park, J. W., Kim, D., Kim, D., Lee, I., and Jon, S. (2009). Bioinspired colorimetric detection of calcium (II) ions in serum using calsequestrin-functionalized gold nanoparticles. Angew. Chem. Int. Ed. 48, 4138–4141. doi: 10.1002/anie.200900071
Liu, S., Wang, H., Cheng, Z., and Liu, H. (2016). Hexametaphosphate-capped quantum dots as fluorescent probes for detection of calcium ion and fluoride. Sensor. Actuat. B-Chem. 232, 306–312. doi: 10.1016/j.snb.2016.03.077
Lodish, H., Berk, A., Zipursky, S. L., Matsudaira, P., Baltimore, D., and Darnell, J. (2000). Intracellular Ion Environment and Membrane Electric Potential. Mol. Cell Biol. 4th Edn. New York, NY: WH Freeman.
Markvart, T. (2000). Light harvesting for quantum solar energy conversion. Prog. Quantum. Electron. 24, 107–186. doi: 10.1016/S0079-6727(00)00003-3
Meshik, X., Xu, K., Dutta, M., and Stroscio, M. A. (2014). Optical detection of lead and potassium ions using a quantum-dot-based aptamer nanosensor. IEEE Trans. Nanobiosci. 13, 161–164. doi: 10.1109/TNB.2014.2317315
Miyoshi, D., Nakao, A., and Sugimoto, N. (2003). Structural transition from antiparallel to parallel G-quadruplex of d (G 4 T 4 G 4) induced by Ca2+. Nucleic Acids Res. 31, 8–9. doi: 10.1093/nar/gkg211
Peyret, N. (2000). Prediction of Nucleic Acid Hybridization: Parameters and Algorithms. Detroit, MI: Wayne State University Detroit.
Qi, K., Wang, Y., Wang, R., Wu, D., and Li, G.D. (2016). Facile synthesis of homogeneous CuInS2 quantum dots with tunable near-infrared emission. J. Mater. Chem. C. 4, 1895–1899. doi: 10.1039/C5TC04232A
Russell, J. T. (2011). Imaging calcium signals in vivo: a powerful tool in physiology and pharmacology. Br. J. Pharmacol. 163, 1605–1625. doi: 10.1111/j.1476-5381.2010.00988.x
SantaLucia, J. (1998). A unified view of polymer, dumbbell, and oligonucleotide DNA nearest-neighbor thermodynamics. Proc. Natl. Acad. Sci. U.S.A. 95, 1460–1465. doi: 10.1073/pnas.95.4.1460
Schefer, U., Ammann, D., Pretsch, E., Oesch, U., and Simon, W. (1986). Neutral carrier based Ca2+-selective electrode with detection limit in the sub-nanomolar range. Anal. Chem. 58, 2282–2285. doi: 10.1021/ac00124a036
Shu, G. W., Chiu, C. H., Huang, L. T., Lin, T. N., Yang, C. C., Wang, J. S., et al. (2013). Efficient energy transfer from InGaN quantum wells to Ag nanoparticles. Phys. Chem. Chem. Phys. 15, 3618–3362. doi: 10.1039/c3cp43894e
Singh, A. K., and Mehtab, S. (2007). Calcium (II) -selective potentiometric sensor based on-furildioxime as neutral carrier, Sensor. Actuat. B-Chem. 123, 429–436. doi: 10.1016/j.snb.2006.09.016
Song, C., Haoyue, L., Xiaogang, L., Zhijia, P., Lingdong, W., Xiaosheng, T., et al. (2020). Study on AgInZnS-graphene oxide non-toxic quantum dots for biomedical sensing. Front. Chem. 8:331. doi: 10.3389/fchem.2020.00331
Suzuki, K., Tohda, K., Tanda, Y., Ohzora, H., Nishihama, S., and Inoue, H. (1989). Fiber-optic magnesium and calcium ion sensor based. Anal. Chem. 384, 382–384. doi: 10.1021/ac00179a018
Wegner, K. D., Dussert, F., Truffier-Boutry, D., Benayad, A., Beal, D., Mattera, L., et al. (2019). Influence of the core/shell structure of indium phosphide based quantum dots on their photostability and cytotoxicity. Front. Chem. 7:466. doi: 10.3389/fchem.2019.00466
Wojda, U., Salinska, E., and Kuznicki, J. (2008). Calcium ions in neuronal degeneration. Critical Rev. 60, 575–590. doi: 10.1002/iub.91
Wu, T.-C., Biswas, S., Dutta, M., and Stroscio, M. A. (2011). Quantum-dot-based aptamer beacon for the detection of potassium ions. IEEE Trans. Nanotechnol. 10, 991–995. doi: 10.1109/TNANO.2010.2091967
Wu, M., Meng, S., Wang, Q., Si, W., Huang, W., and Dong, X. (2015). Nickel – cobalt oxide decorated three-dimensional graphene as an enzyme mimic for glucose and calcium detection. ACS Appl. Mater. Interfaces. 7, 3–8. doi: 10.1021/acsami.5b06299
Yun, C. S., Javier, A., Jennings, T., Fisher, M., Hira, S., Peterson, S., et al. (2005). Nanometal surface energy transfer in optical rulers, breaking the FRET barrier. J. Am. Chem. Soc. 127, 3115–3119. doi: 10.1021/ja043940i
Keywords: aptamer, biosensor, calcium detection, FRET, quantum dot, optical sensor
Citation: Ghosh S, Chen Y, George A, Dutta M and Stroscio MA (2020) Fluorescence Resonant Energy Transfer-Based Quantum Dot Sensor for the Detection of Calcium Ions. Front. Chem. 8:594. doi: 10.3389/fchem.2020.00594
Received: 15 April 2020; Accepted: 08 June 2020;
Published: 11 August 2020.
Edited by:
Kezhen Qi, Shenyang Normal University, ChinaReviewed by:
Yongsheng Yang, Shenyang Normal University, ChinaCopyright © 2020 Ghosh, Chen, George, Dutta and Stroscio. This is an open-access article distributed under the terms of the Creative Commons Attribution License (CC BY). The use, distribution or reproduction in other forums is permitted, provided the original author(s) and the copyright owner(s) are credited and that the original publication in this journal is cited, in accordance with accepted academic practice. No use, distribution or reproduction is permitted which does not comply with these terms.
*Correspondence: Shreya Ghosh, c2hyZXlhZ2hvc2gyMTVAZ21haWwuY29t
Disclaimer: All claims expressed in this article are solely those of the authors and do not necessarily represent those of their affiliated organizations, or those of the publisher, the editors and the reviewers. Any product that may be evaluated in this article or claim that may be made by its manufacturer is not guaranteed or endorsed by the publisher.
Research integrity at Frontiers
Learn more about the work of our research integrity team to safeguard the quality of each article we publish.