 Niclas S. Mueller*
 Stephanie Reich
- Department of Physics, Freie Universität Berlin, Berlin, Germany
Theoretical modeling of surface-enhanced Raman scattering (SERS) is of central importance for unraveling the interplay of underlying processes and a predictive design of SERS substrates. In this work we model the plasmonic enhancement mechanism of SERS with perturbation theory. We consider the excitation of plasmonic modes as an integral part of the Raman process and model SERS as higher-order Raman scattering. Additional resonances appear in the Raman cross section which correspond to the excitation of plasmons at the wavelengths of the incident and the Raman-scattered light. The analytic expression for the Raman cross section can be used to explain the outcome of resonance Raman measurements on SERS analytes as we demonstrate by comparison to experimental data. We also implement the theory to calculate the optical absorption cross section of plasmonic nanoparticles. From a comparison to experimental cross sections, we show that the coupling matrix elements need to be renormalized by a factor that accounts for the depolarization by the bound electrons and interband transitions in order to obtain the correct magnitude. With model calculations we demonstrate that interference of different scattering channels is key to understand the excitation energy dependence of the SERS enhancement for enhancement factors below 103.
1. Introduction
Surface-enhanced Raman scattering (SERS) is the giant increase in the Raman cross section of a molecule close to a metallic nanostructure (Fleischmann et al., 1974). The local enhancement can exceed ten orders of magnitude making SERS an ideal tool for analytical chemistry that can be even applied for single-molecule detection (Kneipp et al., 1997; Nie and Emory, 1997; Sharma et al., 2012; Wang et al., 2013). The enhancement arises from an interplay of several mechanisms that act simultaneously. There is a general agreement that the strongest enhancement mechanism is the excitation of localized surface plasmon resonances in noble metal nanostructures (Ru and Etchegoin, 2009; Ding et al., 2017). The collective oscillation of conduction electrons leads to intense electromagnetic near fields close to the metal surface that drive the Raman process. The largest enhancement arises from so-called electromagnetic hot spots that occur in the nanometer gaps between plasmonic nanoparticles with a local field intensity that can be five orders of magnitude larger than that of the incident light. Besides plasmonic enhancement, the SERS intensity is affected by chemical enhancement which encompasses a number of effects that concern the chemical interaction of the molecule with the metal surface (Jensen et al., 2008). The metal-molecule interaction can lead to hybridized or charge transfer states that introduce new resonances in the SERS cross section or the molecular resonances can be shifted which may lead to an increase or decrease of the SERS intensity (Osawa et al., 1994; Morton and Jensen, 2009; Darby et al., 2015; Hu et al., 2015; Sevinc et al., 2016). A successful design of SERS substrates depends critically on our understanding of the underlying enhancement mechanisms and a predictive theoretical modeling.
Even though the phenomenon of SERS was discovered more than 40 years ago there are many aspects that remain not fully understood (Moskovits, 2013). Due to the multitude of involved processes it is a challenge to predict the outcome of a SERS experiment, such as the magnitude of the enhancement and its excitation energy dependence. For many years the focus has been on developing microscopic theories for the chemical enhancement mechanism which give insight into the interaction of a molecule with a metal surface and its effect on the Raman spectrum (Jensen et al., 2008; Lombardi and Birke, 2008; Galperin et al., 2009; Hu et al., 2015). The plasmonic enhancement mechanism, on the other hand, is usually modeled with a purely electromagnetic enhancement factor, which is known as the theory of electromagnetic enhancement (Ru and Etchegoin, 2009; Ding et al., 2017). This macroscopic approach is a powerful tool for designing SERS substrates with large enhancement factors but lacks microscopic insight into the different scattering processes underlying SERS. Recently, there has been renewed interest in plasmonic enhancement and in developing microscopic theories that complement the EM enhancement model and expand it to include quantum mechanical effects, such as electron tunneling, optomechanical backaction and non locality (Pustovit and Shahbazyan, 2006; Davis et al., 2010; Roelli et al., 2016; Schmidt et al., 2016; Kamandar Dezfouli and Hughes, 2017; Neuman et al., 2018).
Based on the microscopic theory of Raman scattering we suggested to describe SERS as higher-order Raman (HORa) scattering and developed a theory that treats the plasmonic excitation as a part of the Raman process (Mueller et al., 2016). The localized surface plasmon resonances were included in the Raman cross section in the same way as the molecular resonances. Considering the excitations of the plasmon and of the molecular transitions as subsequent steps of the Raman process allowed us to derive selection rules for SERS with group theory (Jorio et al., 2017). On the experimental side, we designed SERS substrates that allowed to measure exclusively the plasmonic enhancement of the Raman cross section (Heeg et al., 2013, 2014; Mueller et al., 2017b; Wasserroth et al., 2018). The approach of describing SERS as higher-order Raman scattering gives an intuitive picture of what happens in the various steps of the Raman transition (absorption of light by plasmon, electronic excitation by the plasmonic near field, vibronic coupling and so forth). We therefore argued that it should be an excellent tool to fit experimental data and extract information like the strength of light-matter coupling and the energy of the plasmonic resonance, but have not performed such an analysis.
Here we revisit the theory of SERS as higher-order Raman scattering and draw the comparison to experiments. We discuss how the analytic expression for the SERS cross section is used to interpret the excitation energy dependence of the enhancement in experiments. By treating the localized surface plasmon as a quasi-particle we derive analytic expressions for the coupling matrix elements. We account for the depolarization by bound electrons and interband transitions in the interaction Hamiltonians. These contributions were omitted in our previous work that, therefore, overestimated SERS enhancement factors. We calculate the optical absorption cross section of gold and silver nanoparticles as intermediate steps in the Raman process. The excellent agreement with experiments supports the quantitative predictions of our theory. Based on model calculations for a molecule close to a silver nanoparticle we demonstrate that interference between different scattering processes can strongly affect the excitation energy dependence of the SERS enhancement. Our theory leads to the same expression for the plasmonic enhancement in SERS as the commonly used electromagnetic enhancement. In addition, it is used to extract experimental data on the plasmonic system from Raman spectroscopy without requiring a detailed knowledge of the geometry of the plasmonic nanostructure as an input parameter.
2. SERS as Higher-Order Raman Scattering
The theory of surface-enhanced Raman scattering as a higher-order Raman process was introduced in Mueller et al. (2016) and will be reviewed in this section in order to set a theoretical basis for the rest of this paper. The implementation is based on the microscopic theory of Raman scattering which uses perturbation theory to calculate the Raman scattering cross section (Long, 2002; Yu and Cardona, 2010). The main idea is to consider the plasmonic excitation, similar to the molecular excitation, as a step in the Raman scattering process. SERS is therefore described as a higher-order Raman process and the plasmonic resonances appear in the Raman cross section.
We consider a plasmon-enhanced Raman process as illustrated in Figure 1A that consists of the following steps: (1) The incoming laser light ωL excites a localized surface plasmon ωpl. (2) The plasmonic nanostructure couples via its optical near field to a nearby molecule and induces a transition from the vibronic ground state g to an intermediate state i. The intermediate state can be also a virtual state. (3) The molecule relaxes to a final vibronic state f and excites again the localized surface plasmon. (4) Finally, the Raman-scattered light ωS is emitted by the plasmonic nanostructure (Mack et al., 2017; Raab et al., 2017). The plasmon-enhanced Raman process can be also illustrated by the Feynman diagram in Figure 1B. Each vertex of the diagram corresponds to one of the four steps of the Raman process. Additionally, there are three other relevant scattering processes that take place simultaneously; see Figure 1C: The processes where only the incoming light (i) or only the Raman-scattered light (ii) couples to the localized surface plasmon and the Raman process without plasmonic enhancement (iii).
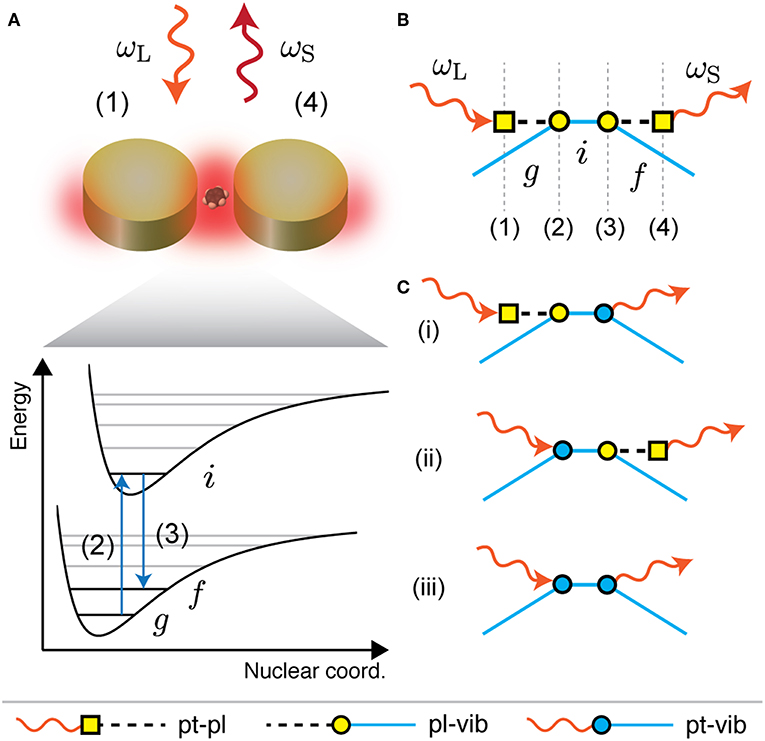
Figure 1. SERS as higher-order Raman scattering. (A) Sketch of a plasmon-enhanced Raman process relevant for SERS. The steps are: (1) excitation of a plasmon by the incoming light ωL; (2) molecular transition from ground state g to intermediate state i by coupling to the plasmonic near field; (3) molecular relaxation to final state f and excitation of the plasmon; (4) emission of Raman-scattered light ωS by the plasmon. (B) Plasmon-enhanced Raman process in (A) illustrated as a Feynman diagram which corresponds to fourth-order perturbation theory. (C) Feynman diagrams of three other scattering processes that are relevant for SERS, i.e., (i) only the incoming light or (ii) only the Raman-scattered light couples to the plasmon and (iii) the Raman process without plasmonic enhancement.
Following Martin and Falicov (1975) and Yu and Cardona (2010) the Feynman diagrams can be translated into Raman scattering amplitudes with perturbation theory.
corresponds to the Feynman diagram in Figure 1B,
to Figure 1C (i),
to Figure 1C (ii) and
to Figure 1C (iii). and are the energies of the vibronic molecular states and ℏωw and are the energies of two plasmon modes w and w′. The energy of the molecular ground state was referenced to zero. , γw = ℏ/τw and are the respective inverse life times , τw and of the excitations. The matrix elements correspond to the vertices of the Feynman diagrams and describe the coupling strength of the photon-plasmon (pt-pl), plasmon-molecule (pl-vib) and photon-molecule (pt-vib) interactions. We will derive explicit expressions below.
The energy terms in the denominators correspond to plasmonic and molecular resonances and generate the excitation energy dependence of the Raman cross section. When the incoming light matches the energy ℏωw of a plasmon mode, the real part of the corresponding energy term vanishes which leads to a resonance of the Raman cross section with spectral width 2γw. In the following we will term this “incoming plasmonic Raman resonance” because the incoming light matches a plasmon mode. Similarly an outgoing plasmonic Raman resonance occurs for , i.e., when the energy of the Raman-scattered light matches that of the plasmon mode. Furthermore, a molecular Raman resonance occurs when the incoming light matches a vibronic state i. The excitation of a virtual state is described by the off-resonant excitation of the vibronic state i. The resonances will have Lorentzian line shape. We will discuss the applicability of this approximation for plasmonic excitations below.
The Raman scattering rate that is relevant for the intensity that arrives at the detector can be calculated with the Fermi Golden Rule as
where . is the inverse lifetime of the final vibronic state and corresponds to the spectral width of the vibrational mode in the Raman spectrum. All Raman amplitudes that lead to the same final state f are summed before calculating the absolute square; i.e., summation over w, w′ and i in Equation (5). The different scattering channels might interfere constructively or destructively which will be discussed below. In a SERS experiment one typically divides the measured intensity of a Raman mode by a reference to calculate an enhancement factor
where is given by an expression similar to Equation (4). The enhancement factor can be only written in this way when referencing to the intensity of the same Raman mode. In experiments the measured Raman intensity of the SERS analyte is typically divided by the intensity of the same analyte in solution (Le Ru and Etchegoin, 2013). The different dielectric environment might shift the molecular resonance of the SERS analyte with respect to that of the reference. In this case the energies of the intermediate molecular states that appear in KSERS and Kref are different. On the other hand, if the molecular states of the SERS analyte and the reference are identical all terms related to the molecular resonance cancel and Equation (6) simplifies to
where and are coupling factors that describe the strength of the incoming and the outgoing plasmonic Raman resonances (Mueller et al., 2016). Additionally we have assumed that only one plasmon mode ωpl is excited and set . Equation (7) is a purely plasmonic enhancement factor of the SERS cross section. The enhancement at the incoming plasmonic Raman resonance is
and the enhancement at the outgoing plasmonic Raman resonance is
We will demonstrate below that the enhancement at the incoming- and outgoing plasmonic Raman resonances can differ significantly because of inteference between different scattering channels.
In previous works we have designed SERS experiments which allow to extract the plasmonic enhancement of the SERS cross section (Heeg et al., 2013, 2014; Mueller et al., 2017b; Wasserroth et al., 2018). For this we used carbon nanostructures as SERS analytes, i.e., graphene, carbon nanotubes and carbon nanotubes filled with molecules. These structures have a Raman response that is strong enough to be detected in the absence of plasmonic enhancement. The experiments were designed in such a way that the Raman intensities with and without the plasmonic nanostructure could be compared directly. In Figure 2 we show the excitation-energy dependent SERS enhancement for graphene deposited on top of a gold nanodimer (Wasserroth et al., 2018). The enhancement was measured for the two prominent Raman modes of graphene, the carbon-carbon stretching G mode (ℏωG = 0.19 eV) and the overtone of the ring-breathing mode 2D (ℏω2D ≈ 0.3 eV). An exemplary SERS spectrum (red) and a reference spectrum recorded away from the plasmonic nanodimer (black) are shown in Figure 2A. The enhanced Raman modes are shifted with respect to the reference because of strain that is induced in the graphene lattice by the nanodimer (Mueller et al., 2017a). By using tunable laser excitation we measured the excitation energy dependence of the plasmonic enhancement which is plotted for the G mode in Figure 2B and for the 2D mode in Figure 2C.
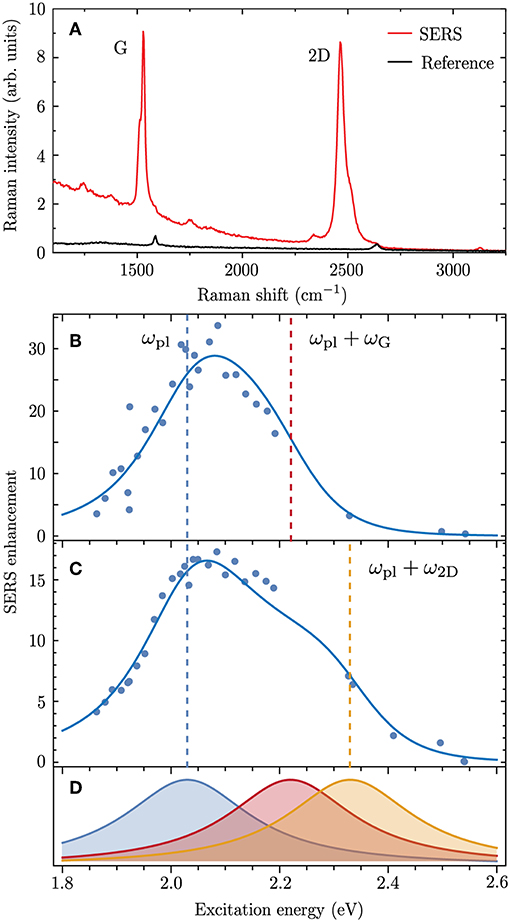
Figure 2. (A) SERS spectrum of graphene deposited on top of a gold nanodimer (red) and reference spectrum without the gold nanodimer (black) for ℏωL = 1.94 eV. (B,C) Excitation energy dependence of the SERS enhancement measured for (B) the Raman G mode and (C) the 2D mode (data from Wasserroth et al., 2018). Solid lines are a fit to the experimental data with Equation (7) using ℏωpl = 2.03 eV, ℏγpl = 140 meV and eV for the G mode and eV for the 2D mode. The Raman shifts ℏωG = 0.19 eV and ℏω2D ≈ 0.3 eV were obtained from the experimental spectra. The incoming (ωL = ωpl) and outgoing () plasmonic Raman resonances are indicated as dashed lines. The enhancement factor in Equation (7) was divided by a factor of 230 as it gives a local enhancement while the experimental data are a global enhancement (see Wasserroth et al., 2018 for details). (D) Normalized incoming (blue) and outgoing plasmonic Raman resonances (red for G mode and orange for 2D mode) which constitute the resonance profiles in (B,C).
The excitation energy dependence of the SERS enhancement can be interpreted with Equation (7) using , , ωpl and γpl as fitting parameters. The fits are illustrated as solid lines in Figures 2B,C and match excellently the experimental data. The corresponding incoming and outgoing plasmonic Raman resonances are illustrated in Figure 2D. The excitation energy dependence of the SERS enhancement is narrower than the sum of the two resonances as it mainly arises from their product. An asymmetry appears because of interference between different scattering channels, which will be discussed in detail below. Generally we observed that the outgoing Raman resonance is weaker than the incoming Raman resonance.
3. Interaction Hamiltonians
The description of surface-enhanced Raman scattering as higher-order Raman scattering considers the excitation of the localized surface plasmon by the incoming light and the coupling of the plasmon to the molecule as two subsequent steps of the Raman process. This requires to treat the localized surface plasmon as a quasiparticle. In the following we derive analytic expressions for the coupling matrix elements based on a quantization of the localized surface plasmon. We use the same interaction Hamiltonians to describe the incoming scattering pathway (absorption of light by plasmon, excitation of vibronic transition in molecule by plasmonic near field) and the outgoing scattering pathway (excitation of plasmon by molecule, emission of Raman scattered light by plasmonic nanostructure). We demonstrated in Mueller et al. (2016) that this is a good approximation in the backscattering geometry; see also Ausman and Schatz (2009) and Ausman and Schatz (2012).
3.1. Quantization of the Localized Surface Plasmon
To quantize the localized surface plasmon resonances of a metallic nanoparticle, we use a jellium model which assumes a density of free electrons that move in the presence of a uniform positively charged background (Gerchikov et al., 2002; Weick et al., 2005; Finazzi and Ciccacci, 2012). The center-of-mass Hamiltonian describing the collective motion of the electrons is given by
where Vp is the volume of the metallic nanoparticle. and are canonical position and momentum coordinates that are written in terms of creation and annihilation operators and of a plasmon mode w as
and
Using the bosonic commutation relations
the Hamiltonian in Equation (10) can be rewritten as
The plasmonic Hamiltonian may be written in this way when initially ignoring losses; otherwise the plasmonic modes are ill-defined (Waks and Sridharan, 2010; Finazzi and Ciccacci, 2012). We account for the decay by using complex energies ωw + iγw in the energy denominators of Equations (1–3) as is common practice within the microscopic theory of Raman scattering (Long, 2002; Yu and Cardona, 2010). The Hamiltonian in Equation (14) can also be applied for oligomers or arrays of plasmonic nanoparticles (Brandstetter-Kunc et al., 2015, 2016; Lamowski et al., 2018). In this case corresponds to the operator of the hybridized plasmon modes w of the coupled nanoparticles and is given by a Bogoliubov transformation of the single nanoparticle operators.
3.2. Plasmon-Photon Interaction
In the presence of an external light field, the plasmonic Hamiltonian in Equation (10) has to be modified by the Peierl's substitution which leads to the minimal coupling Hamiltonian
Âw is a projection of the vector potential of the external light field onto a plasmonic mode w. It can be calculated with a volume integral approach as Finazzi and Ciccacci (2012)
where qw(r) is the eigenvector of a plasmon mode w which has to fulfill the normalization condition (Yu et al., 2017)
CLF is a local field correction factor which accounts for the difference between the microscopic light field that couples to the plasmonic mode qw(r) and the incident macroscopic light field (Onsager, 1936; de Vries and Lagendijk, 1998; Dolgaleva and Boyd, 2012). For a single nanoparticle it is given by
where L is a depolarization factor that accounts for the shape of the nanoparticle, is the plasma frequency of the metal and ϵm is the dielectric constant of the surrounding medium; see Appendix for details. We note that this correction factor was not included in Mueller et al. (2016) which lead to an overestimation of the SERS enhancement calculated from the coupling matrix elements.
To derive an explicit expression for the photon-plasmon interaction Hamiltonian, we express the vector potential of the light field with second quantization as Ho and Kumar (1993); Loudon (2000)
where we considered for simplicity only one wavevector kpt and polarization εpt. The amplitude of the light field is with a normalization volume VR and the frequency of the light field ωpt. By using Equations (15), (12), (16), and (19) and dropping the counter-rotating terms the interaction Hamiltonian is given by
where
is a factor that gives the selection rules for the interaction of light with plasmonic modes w.
To discuss the applicability of the interaction Hamiltonian in Equation (20) we will first calculate the optical absorption cross section of plasmonic nanoparticles and draw a comparison to experimental data.
The absorption of a plasmon mode with frequency ωpl and spectral width 2γpl is given by the cross section
with the coupling matrix element
The absorption cross section is obtained by dividing the plasmon excitation rate (Fermi Golden Rule)
by the photon flux of the incident light field , where is the Poynting vector. We assumed a Lorentzian line shape of the plasmon resonance as in the SERS scattering amplitudes in Equations (1)–(3).
The plasmonic properties of small nanoparticles are well described by the point dipole approximation and the plasmon eigenvector of a dipole mode is given by
where εpl is the polarization and rpl is the position of the particle center. For larger nanoparticles the eigenvectors may be calculated with Mie theory as we demonstrated in Mueller et al. (2016). Using Equations (18) and (20)–(25) the absorption cross section of a plasmonic nanoparticle can be expressed as
The absorption cross section as a function of energy can be measured with optical modulation spectroscopy (Crut et al., 2014). In Figure 3 we compare the absorption cross section from Equation (26) with experimental data for spherical silver and gold nanoparticles and a gold nanorod from Lombardi et al. (2012), Billaud et al. (2007), and Muskens et al. (2006). By using ωpl and γpl as fitting parameters and the particle volume Vp measured in experiments we obtain perfect agreement with the magnitude and energy dependence of the experimental cross sections. In the case of the gold nanosphere the theory underestimates the cross section for energies larger than 2.5 eV. The asymmetry in the excitation energy dependence appears because of interband transitions which is not captured by the Lorentzian line profile in Equation (26). On the other hand, the excellent agreement of the magnitudes shows that the local field correction factor in Equation (18) correctly accounts for the optical properties of gold and silver at the energies ℏωpl of the localized surface plasmon resonances. The plasmon-photon interaction Hamiltonian in Equation (20) therefore gives the correct oscillator strength and will be used below to calculate the SERS enhancement for a molecule close to a plasmonic nanoparticle.
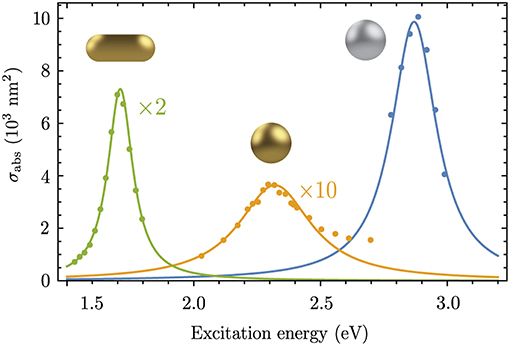
Figure 3. Experimental and calculated (Equation 26) optical absorption cross sections for a gold nanorod (green, Lombardi et al., 2012), a gold nanosphere (orange, Billaud et al., 2007) and a silver nanosphere (blue, Muskens et al., 2006). The nanoparticle volume Vp was taken from the experimental works. The following parameters were used to reproduce the experimental spectra: ℏωpl = 1.71 eV, ℏγpl = 60 meV, ϵm = 2.02 and L = 0.12 for the Au nanorod; ℏωpl = 2.32 eV, ℏγpl = 175 meV, ϵm = 1.96 and L = 1/3 for the Au nanosphere; ℏωpl = 2.87 eV, ℏγpl = 108 meV, ϵm = 2.31 and L = 1/3 for the Ag nanosphere.
3.3. Plasmon-Molecule Interaction
We consider the coupling of the plasmonic nanostructure to a molecule with vibronic states as illustrated in Figure 1A. We assume that the interaction is of dipolar nature and use the interaction Hamiltonian (Waks and Sridharan, 2010)
where is the electric field generated by the plasmonic nanostructure and
is a generic transition operator for the dipole transitions of the molecule. The matrix element μmn gives the transition probability from a vibronic state |m〉 to a state |n〉. The point dipole approximation for the molecule is justified as long as the plasmonic near field is approximately constant over the size of the molecule, which is a good approximation for metal-molecule distances much larger than the size of the molecule. For smaller distances, surface roughness and atomic scale protrusions of the metallic nanostructure become important which can be modeled by including field-dependent terms to the permanent molecular dipole in Equation (28) or by a quantum-mechanical modeling of the molecular states (Ayars et al., 2000; Jensen et al., 2008; Neuman et al., 2018).
We calculate the electric near field ELSP(r) = −∇rϕpl(r) of the plasmonic nanostructure within the electrostatic approximation as the gradient of the scalar potential
is a Green function that gives the field distribution outside the plasmonic nanoparticle and ρ(r) is the electric charge density (Novotny and Hecht, 2012). In order to obtain a quantized expression for the plasmonic near field we express the charge density in terms of a microscopic displacement s(r) of the charges inside the nanoparticle. It was shown in Finazzi and Ciccacci (2012) that a projection of the charge displacement onto the plasmonic eigenvectors can be substituted by the generalized position operator as
By using the normalization condition for the plasmonic eigenvectors in Equation (17), the plasmonic near field can be written as
with
The position dependence and polarization of the plasmonic near field is entirely contained in Gw(r) and contains plasmonic creation and annihilation operators; see Equation (11). Based on Equations (27) and (31) we obtain
for the plasmon-molecule interaction Hamiltonian.
Finally we also consider the direct coupling of the incident light to the molecular transition dipole, which is described by the interaction Hamiltonian . From Equation (19) and we obtain the explicit expression
4. SERS Enhancement by a Silver Nanosphere
In order to discuss the magnitude and excitation energy dependence of the plasmonic enhancement we calculate the enhancement of the SERS cross section for a molecule next to a silver nanoparticle. We consider a SERS experiment in which the same molecule is used as SERS analyte and reference and the molecular resonance is not perturbed by the metal surface; see e.g., Mueller et al. (2017b). In this case the SERS enhancement is given by the plasmonic enhancement factor in Equation (7). From the analytic expressions for the interaction Hamiltonians above we calculate the coupling factors as.
where “pl” refers to the dipolar plasmon resonance of the silver nanoparticle. emol is a unit vector along the transition dipole of the molecule. The coupling factors and are only equal for a Raman process where μgi ∥ μif. For the more general case of a Raman tensor with off-diagonal elements emol may differ in and .
In the following, we consider the spherical silver nanoparticle for which we calculated the absorption cross section in Figure 3 with radius rNP = 15.5 nm. As this nanoparticle is small compared to the wavelength of the incident light (350–500 nm), we calculate the plasmonic eigenvector of the dipole mode with the point dipole approximation; see Equation (25). That way we obtain and
The coupling factors and are, within the approximations made here, real valued quantities and take negative values for the places of strongest field enhancement. This nicely agrees with the assumptions that were made to explain the experimental SERS resonance profiles in Figure 2.
In Figure 4 we calculate the plasmonic SERS enhancement for a molecule close to the silver nanoparticle. We assume a molecular transition dipole parallel to the polarization of the incident light field and to the plasmonic near field. This configuration leads to the largest enhancement. The excitation energy dependence of the SERS enhancement is plotted in Figure 4 for different distances of the molecule to the silver nanoparticle. We consider a Raman shift of ℏωvib = 0.3 eV which is larger than the spectral width 2γpl ≈ 0.2 eV of the plasmon resonance. In this case the incoming and outgoing Raman resonances are visible as distinct and overlapping peaks in the SERS enhancement. When the molecular dipole is placed on the surface of the silver nanoparticle the Raman cross section is enhanced by a factor of 2 × 10⁴ (Figure 4A, d = 0, solid line). The incoming and outgoing plasmonic Raman resonances provide almost the same enhancement with a slight dominance of the incoming Raman resonance. The resonance profile looks strikingly different when the molecule is moved away from the metal surface. When the metal-molecule distance equals the nanoparticle radius (d = rNP) the enhancement occurs only at the incoming plasmonic Raman resonance with a factor of ~20 while the outgoing plasmonic Raman resonance is entirely missing. For an even larger distance of d = 2rNP the incoming and outgoing resonances obtain a Fano-like profile and only the incoming resonance provides a modest enhancement of 2.8. In the following we refer to these three cases as the regimes of strong, intermediate and weak plasmonic enhancement.
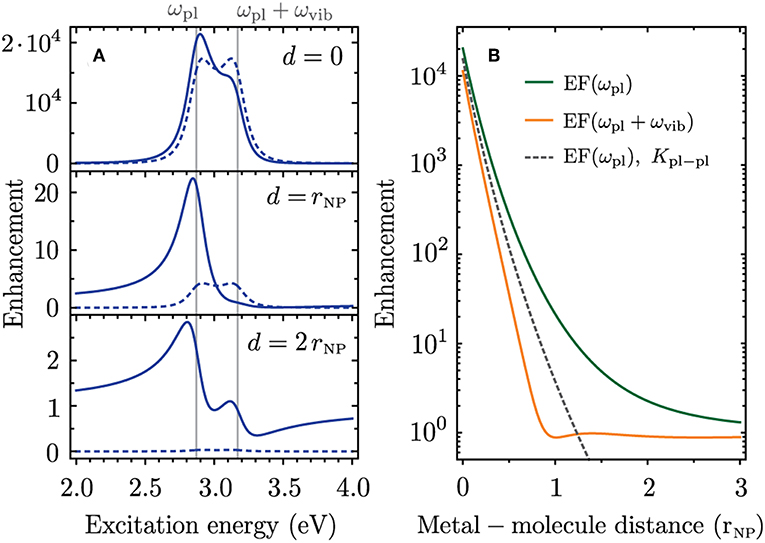
Figure 4. Plasmonic enhancement of the Raman cross section for a molecule close to a silver nanoparticle with properties similar to those in Figure 3, i.e., an Ag nanosphere with radius rNP = 15.5 nm, ℏωpl = 2.87 eV, ℏγpl = 108 meV and ϵm = 2.31. We place the Ag nanosphere center at the origin, consider εpl, emol ∥ x and move the molecule along the x axis. (A) Excitation energy dependence of the enhancement for three distances d of the molecule to the metal surface. (B) Enhancement at ωpl (incoming plasmonic Raman resonance, green) and ωpl + ωvib (outgoing plasmonic Raman resonance, orange) as a function of metal-molecule distance. Dashed lines show the enhancement when only Kpl−pl is used to calculate the enhancement factor.
The difference in enhancement at the incoming and outgoing plasmonic Raman resonances occurs because of interference between the scattering channels that are illustrated as Feynman diagrams in Figures 1B,C (i)–(iii). These scattering processes have the same final state, i.e., a molecular vibration is excited and the Raman-scattered light is emitted. The corresponding Raman amplitudes are therefore summed in Equation (6) before calculating the absolute square and the different terms can add constructively or destructively. When only considering the process in Figure 1B, where the incoming- and the Raman-scattered light couple to the plasmon, both Raman resonances provide the same enhancement (dashed lines in Figure 4A). This process is the dominant contribution in the regime of strong plasmonic enhancement, i.e., for d ≈ rNP. In the intermediate enhancement regime the scattering processes in Figure 1C (i) and (ii), where the plasmon resonance enhances either the incoming or the Raman-scattered light, have to be taken into account to explain the SERS resonance profile. The Raman amplitudes of the different scattering processes add constructively at the incoming plasmonic Raman resonance and cancel each other at the outgoing plasmonic Raman resonance. In the weak enhancement regime the Raman process without plasmonic enhancement (Figure 1C (iii)] becomes important as the enhancement is close to one. The contribution from the process in Figure 1B is negligible in this case.
In Figure 4B we plot the enhancement at the energies of the incoming and Raman-scattered light as a function of metal-molecule distance. The enhancement from the scattering process in Figure 1B is plotted as a dashed line for comparison. A constructive interference at the incoming plasmonic Raman resonance and destructive interference at the outgoing plasmonic Raman resonance occurs for all metal-molecule distances. The difference in enhancement is largest around d = 2rNP. More generally the effect of interference between different scattering channels is most pronounced when , which corresponds to the intermediate enhancement regime with enhancement factors of 101 − 102. The effect is clearly irrelevant for single-molecule SERS which requires enhancement factors on the order of 107 − 109 (Ru and Etchegoin, 2009). On the other hand, the intermediate enhancement regime becomes important when a spatially extended film of molecules or a two-dimensional material is coupled to a plasmonic nanostructure (McFarland et al., 2005; Heeg et al., 2013). Furthermore, the enhancement factors in tip-enhanced Raman scattering (TERS) are typically in the intermediate enhancement regime (Beams et al., 2014; Wang et al., 2017). The constructive interference between different scattering pathways can strongly increase the enhancement at a specific excitation energy making TERS sensitive to near-field coupling.
5. Comparison to Theory of Electromagnetic Enhancement
The plasmonic enhancement in SERS is commonly estimated by a theory that treats that plasmonic nanostructure as a nanoscale antenna which increases the local light intensity (Ru and Etchegoin, 2009; Ding et al., 2017). The enhancement of the Raman intensity for a molecule at position r is given by
where Eloc is the local electric field amplitude and E0 the amplitude of the incoming light field without enhancement. This theory of electromagnetic (EM) enhancement is a powerful tool for the design of plasmonic nanostructures with strong SERS enhancement (Ding et al., 2017). The local electric field enhancement can be calculated for complicated nanostructure geometries with numerical techniques (Solís et al., 2014). On the other hand, a precise knowledge of the nanostructure geometry is required to interpret the outcome of a SERS experiment and molecular resonances are not included in the enhancement factor. Our approach benefits from microscopic insight into the scattering processes underlying SERS and can be used to extract the spectral properties of the plasmonic and molecular resonances from SERS profiles. In the following we will show that both theories predict the same plasmonic enhancement and the enhancement factor in Equation (37) can be rewritten into an expression that is formally equivalent to Equation (7).
An important aspect that is disregarded when writing the electromagnetic enhancement factor as in Equation (37) is that only the electric field component along the molecular transition dipole contributes to the enhancement. We therefore project the local electric field vectors onto the transition dipoles μgi and μif that are relevant for the Raman process (see Figure 1A). By expressing the local electric field Eloc as the sum of the plasmonic near field Epl and the incident light field E0 we obtain
with
and
This enhancement factor can be rewritten as
which is formally equivalent with the plasmonic enhancement factor from our microscopic approach in Equation (7). The four terms can be identified with the scattering processes in Figures 1B,C (i)–(iii).
In order to compare the enhancement predicted by the two theories we repeat the model calculations in Figure 4 based on the enhancement factor in Equation (41). Within the quasi-static approximation the plasmonic near field of the silver nanoparticle is
with the plasmonic dipole moment
and the polarizability of the nanosphere
We use a Drude model for the dielectric function of silver ϵAg(ω) from Yang et al. (2015) and include a phenomenological surface broadening term to reproduce the experimentally determined spectral width of the plasmon resonance (see Muskens et al., 2006). In Figure 5A we compare the enhancement factors at the incoming and outgoing plasmonic Raman resonances as a function of metal-molecule distance. There is good agreement of the enhancement predicted by our microscopic approach (HORa, solid lines) and the electromagnetic enhancement model (EM, dashed lines). The weaker enhancement at the outgoing resonance is also predicted by the electromagnetic enhancement factor. When calculating the resonance profiles for different metal-molecule distances we obtain overall good agreement between both theories for all enhancement regimes (Figure 5B).
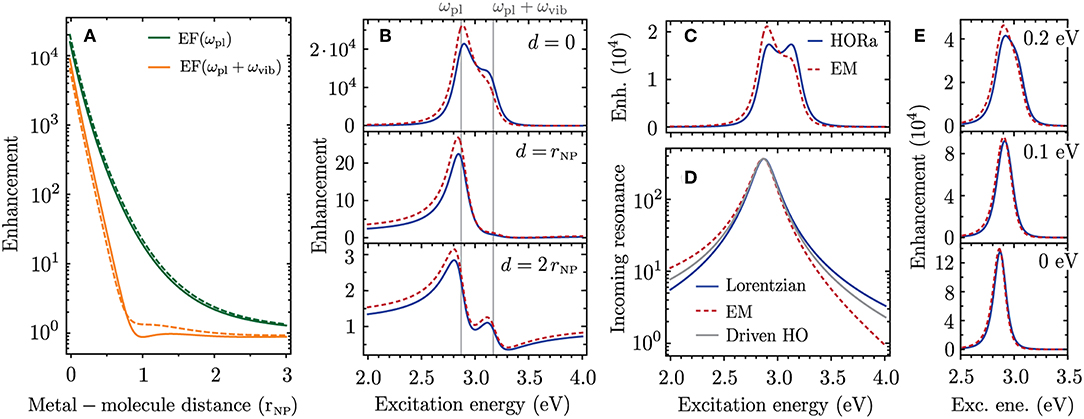
Figure 5. Comparison of enhancement factors from higher-order Raman approach (HORa, solid lines) and electromagnetic enhancement theory (EM, dashed lines). The parameters are the same as in Figure 4. (A) Enhancement at the incoming- and outgoing plasmonic Raman resonance as a function of metal-molecule distance. (B) Excitation energy dependence of the enhancement for three metal-molecule distances. (C) Enhancement for d = 0 when only considering the scattering process where the incoming- and Raman-scattered light couples to the plasmon. (D) Enhancement provided by the incoming plasmonic Raman resonance for a Lorentzian line profile as in the HORa approach (blue solid line), for the EM enhancement theory (red dashed line) and for the resonance of a driven harmonic oscillator (gray solid line). (E) Enhancement profiles for different Raman shifts given in the insets.
Upon a closer look it appears that the difference in enhancement at the incoming and outgoing plasmonic Raman resonances is even more pronounced for the EM enhancement model. To explain this small discrepancy we calculate the enhancement profiles for the case when only the scattering process in Figure 1B is considered; see Figure 5C. While the HORa theory predicts in this case two overlapping Raman resonances of equal intensity, the enhancement profile from the EM enhancement theory remains asymmetric. This asymmetry cannot be explained by interference between different scattering channels but is attributed to an intrinsic asymmetry of the plasmon resonance; see Figure 5D. It is only visible on a logarithmic scale and negligible in the absorption spectra in Figure 3. However, when multiplying two resonances that are spectrally displaced by the Raman shift, as is the case in Figure 5C, the asymmetry becomes important.
As our microscopic model is based on higher-order perturbation theory the plasmonic and molecular resonances have a symmetric Lorentzian line profile (blue line in Figure 5D). The asymmetry of the plasmonic resonance from the EM model arises for two reasons. First, when considering the localized surface plasmon as a driven and damped harmonic oscillator the Lorentzian energy denominators in Equation (7) have to be replaced by Zuloaga and Nordlander (2011)
which leads to a slight asymmetry of the plasmon resonance (gray line in Figure 5D). Second, the depolarization by the bound electrons which we modeled with a local field correction factor CLF is wavelength dependent and increases toward shorter wavelength. In this work we derived an analytic expression that is strictly only valid at the plasmon resonance [Equation (18)]. How to incorporate the wavelength dependent damping and depolarization when quantizing a localized surface plasmon oscillation is a matter of ongoing research and will be key to fully capture the energy dependence of the SERS enhancement. On the other hand, the differences in the enhancement profiles from EM and HORa only occur when the Raman shift is larger than the spectral width of the plasmon. For smaller Raman shifts the incoming and outgoing plasmonic Raman resonances cannot be spectrally resolved and there is excellent agreement between the enhancement profiles from both theories (Figure 5E).
6. Conclusions
In conclusion we presented a microscopic model of the plasmonic enhancement mechanism in SERS which is based on perturbation theory. The main idea of our approach is to treat the plasmonic excitation as an integral part of the Raman scattering process. This leads to a description of SERS as higher-order Raman scattering. We derived analytic expressions for the Raman scattering amplitudes that can be used to study the interplay of plasmonic and molecular resonances or the interference between different scattering channels. As the properties of the plasmonic and molecular resonances, such as frequency, spectral width and oscillator strength, appear as explicit parameters in the theoretical framework, it can be used for the interpretation of experimental data.
Based on a quantization of the localized surface plasmon we derived analytic expressions for all coupling matrix elements that describe the oscillator strength of the material excitations and lead to selection rules for SERS. We demonstrated that a local field correction factor must be included in the quantization model of the plasmon in order to reproduce the experimental absorption cross sections of plasmonic nanoparticles. This was not considered in our previous work (Mueller et al., 2016) and lead to an overestimation of the SERS enhancement factor. With model calculations for a molecule close to a silver nanoparticle we showed that interference between different scattering channels can strongly affect the excitation energy dependence of the SERS enhancement. This effect is most relevant in the intermediate enhancement regime with enhancement factors of 10−103 and is therefore particularly important when plasmonic nanostructures are coupled to spatially extended materials. We showed that the plasmonic enhancement obtained from our microscopic approach is overall in good agreement with that predicted by the commonly used theory of EM enhancement. While the EM enhancement theory is a powerful tool to design SERS substrates with strong plasmonic enhancement our approach gives microscopic insight, serves well in fitting experimental data, and can be used to study the interplay of different scattering channels underlying SERS.
Data Availability
All datasets generated for this study are included in the manuscript and/or the supplementary files.
Author Contributions
Both authors contributed in multiple ways to the research presented in this manuscript.
Conflict of Interest Statement
The authors declare that the research was conducted in the absence of any commercial or financial relationships that could be construed as a potential conflict of interest.
Acknowledgments
This work was supported by the European Research Council under grant DarkSERS (772108). NM acknowledges Deutsche Telekom Stiftung for financial support. We acknowledge support by the Open Access Publication Initiative of Freie Universität Berlin.
References
Ausman, L., and Schatz, G. (2012). “Dipole re-radiation effects in surface enhanced raman scattering,” in The Mie Theory, volume 169 of Springer Series in Optical Sciences, eds W. Hergert and T. Wriedt (Berlin; Heidelberg: Springer), 135–155.
Ausman, L. K., and Schatz, G. C. (2009). On the importance of incorporating dipole reradiation in the modeling of surface enhanced raman scattering from spheres. J. Chem. Phys. 131:084708. doi: 10.1063/1.3211969
Ayars, E. J., Hallen, H. D., and Jahncke, C. L. (2000). Electric field gradient effects in raman spectroscopy. Phys. Rev. Lett. 85, 4180–4183. doi: 10.1103/PhysRevLett.85.4180
Beams, R., Cançado, L. G., Oh, S.-H., Jorio, A., and Novotny, L. (2014). Spatial coherence in near-field raman scattering. Phys. Rev. Lett. 113:186101. doi: 10.1103/PhysRevLett.113.186101
Billaud, P., Huntzinger, J.-R., Cottancin, E., Lermé, J., Pellarin, M., Arnaud, L., et al. (2007). Optical extinction spectroscopy of single silver nanoparticles. Eur. Phys. J. D 43, 271–274. doi: 10.1140/epjd/e2007-00112-y
Bohren, C., and Huffman, D. R. (1998). Absorption and Scattering of Light by Small Particles. Weinheim: Wiley Science Paperback Series. doi: 10.1002/9783527618156
Brandstetter-Kunc, A., Weick, G., Downing, C. A., Weinmann, D., and Jalabert, R. A. (2016). Nonradiative limitations to plasmon propagation in chains of metallic nanoparticles. Phys. Rev. B 94:205432. doi: 10.1103/PhysRevB.94.205432
Brandstetter-Kunc, A., Weick, G., Weinmann, D., and Jalabert, R. A. (2015). Decay of dark and bright plasmonic modes in a metallic nanoparticle dimer. Phys. Rev. B 91:035431. doi: 10.1103/PhysRevB.91.035431
Crut, A., Maioli, P., Del Fatti, N., and Vallée, F. (2014). Optical absorption and scattering spectroscopies of single nano-objects. Chem. Soc. Rev. 43, 3921–3956. doi: 10.1039/c3cs60367a
Darby, B. L., Auguié, B., Meyer, M., Pantoja, A. E., and Le Ru, E. C. (2015). Modified optical absorption of molecules on metallic nanoparticles at sub-monolayer coverage. Nat. Photon. 10:40. doi: 10.1038/nphoton.2015.205
Davis, T. J., Gómez, D. E., and Vernon, K. C. (2010). Evanescent coupling between a raman-active molecule and surface plasmons in ensembles of metallic nanoparticles. Phys. Rev. B 82:205434. doi: 10.1103/PhysRevB.82.205434
de Vries, P., and Lagendijk, A. (1998). Resonant scattering and spontaneous emission in dielectrics: Microscopic derivation of local-field effects. Phys. Rev. Lett. 81, 1381–1384. doi: 10.1103/PhysRevLett.81.1381
Ding, S. Y., You, E. M., Tian, Z. Q., and Moskovits, M. (2017). Electromagnetic theories of surface-enhanced raman spectroscopy. Chem. Soc. Rev. 46, 4042–4076. doi: 10.1039/C7CS00238F
Dolgaleva, K., and Boyd, R. W. (2012). Local-field effects in nanostructured photonic materials. Adv. Opt. Photon. 4, 1–77. doi: 10.1364/AOP.4.000001
Finazzi, M., and Ciccacci, F. (2012). Plasmon-photon interaction in metal nanoparticles: second-quantization perturbative approach. Phys. Rev. B 86:035428. doi: 10.1103/PhysRevB.86.035428
Fleischmann, M., Hendra, P., and McQuillan, A. (1974). Raman spectra of pyridine adsorbed at a silver electrode. Chem. Phys. Lett. 26, 163–166. doi: 10.1016/0009-2614(74)85388-1
Galperin, M., Ratner, M. A., and Nitzan, A. (2009). Raman scattering in current-carrying molecular junctions. J. Chem. Phys. 130:144109. doi: 10.1063/1.3109900
Gerchikov, L. G., Guet, C., and Ipatov, A. N. (2002). Multiple plasmons and anharmonic effects in small metallic clusters. Phys. Rev. A 66:053202. doi: 10.1103/PhysRevA.66.053202
Heeg, S., Fernandez-Garcia, R., Oikonomou, A., Schedin, F., Narula, R., Maier, S. A., et al. (2013). Polarized plasmonic enhancement by au nanostructures probed through raman scattering of suspended graphene. Nano Lett. 13, 301–308. doi: 10.1021/nl3041542
Heeg, S., Oikonomou, A., Fernandez-Garcia, R., Lehmann, C., Maier, S. A., Vijayaraghavan, A., et al. (2014). Plasmon-enhanced raman scattering by carbon nanotubes optically coupled with near-field cavities. Nano Lett. 14, 1762–1768. doi: 10.1021/nl404229w
Ho, S.-T., and Kumar, P. (1993). Quantum optics in a dielectric: macroscopic electromagnetic-field and medium operators for a linear dispersive lossy medium—a microscopic derivation of the operators and their commutation relations. J. Opt. Soc. Am. B 10, 1620–1636. doi: 10.1364/JOSAB.10.001620
Hu, W., Duan, S., Zhang, G., Ma, Y., Tian, G., and Luo, Y. (2015). Quasi-analytical approach for modeling of surface-enhanced raman scattering. J. Phys. Chem. C 119, 28992–28998. doi: 10.1021/acs.jpcc.5b09793
Jensen, L., Aikens, C. M., and Schatz, G. C. (2008). Electronic structure methods for studying surface-enhanced raman scattering. Chem. Soc. Rev. 37, 1061–1073. doi: 10.1039/b706023h
Jorio, A., Mueller, N. S., and Reich, S. (2017). Symmetry-derived selection rules for plasmon-enhanced raman scattering. Phys. Rev. B 95:155409. doi: 10.1103/PhysRevB.95.155409
Kamandar Dezfouli, M., and Hughes, S. (2017). Quantum optics model of surface-enhanced raman spectroscopy for arbitrarily shaped plasmonic resonators. ACS Photon. 4, 1245–1256. doi: 10.1021/acsphotonics.7b00157
Kneipp, K., Wang, Y., Kneipp, H., Perelman, L. T., Itzkan, I., Dasari, R. R., et al. (1997). Single molecule detection using surface-enhanced raman scattering (sers). Phys. Rev. Lett. 78, 1667–1670. doi: 10.1103/PhysRevLett.78.1667
Lamowski, S., Mann, C.-R., Hellbach, F., Mariani, E., Weick, G., and Pauly, F. (2018). Plasmon polaritons in cubic lattices of spherical metallic nanoparticles. Phys. Rev. B 97:125409. doi: 10.1103/PhysRevB.97.125409
Le Ru, E. C., and Etchegoin, P. G. (2013). Quantifying sers enhancements. MRS Bull. 38, 631–640. doi: 10.1557/mrs.2013.158
Lombardi, A., Loumaigne, M., Crut, A., Maioli, P., Del Fatti, N., Vallée, F., et al. (2012). Surface plasmon resonance properties of single elongated nano-objects: gold nanobipyramids and nanorods. Langmuir 28, 9027–9033. doi: 10.1021/la300210h
Lombardi, J. R., and Birke, R. L. (2008). A unified approach to surface-enhanced raman spectroscopy. J. Phys. Chem. C 112, 5605–5617. doi: 10.1021/jp800167v
Long, D. A. (2002). The Raman Effect: A Unified Theory of Raman Scattering by Molecules. Weinheim: John Wiley & Sons, Ltd.
Mack, D. L., Cortés, E., Giannini, V., Török, P., Roschuk, T., and Maier, S. A. (2017). Decoupling absorption and emission processes in super-resolution localization of emitters in a plasmonic hotspot. Nat. Comm. 8:14513. doi: 10.1038/ncomms14513
McFarland, A. D., Young, M. A., Dieringer, J. A., and Van Duyne, R. P. (2005). Wavelength-scanned surface-enhanced raman excitation spectroscopy. J. Phys. Chem. B 109, 11279–11285. doi: 10.1021/jp050508u
Morton, S. M., and Jensen, L. (2009). Understanding the moleculesurface chemical coupling in sers. J. Am. Chem. Soc. 131, 4090–4098. doi: 10.1021/ja809143c
Moskovits, M. (2013). Persistent misconceptions regarding sers. Phys. Chem. Chem. Phys. 15, 5301–5311. doi: 10.1039/c2cp44030j
Mueller, N. S., Heeg, S., Alvarez, M. P., Kusch, P., Wasserroth, S., Clark, N., et al. (2017a). Evaluating arbitrary strain configurations and doping in graphene with raman spectroscopy. 2D Mater. 5:015016. doi: 10.1088/2053-1583/aa90b3
Mueller, N. S., Heeg, S., Kusch, P., Gaufrés, E., Tang, N. Y., Hübner, U., et al. (2017b). Plasmonic enhancement of sers measured on molecules in carbon nanotubes. Faraday Discuss. 205, 85–103. doi: 10.1039/C7FD00127D
Mueller, N. S., Heeg, S., and Reich, S. (2016). Surface-enhanced raman scattering as a higher-order raman process. Phys. Rev. A 94:023813. doi: 10.1103/PhysRevA.94.023813
Muskens, O., Christofilos, D., Fatti, N. D., and Vallée, F. (2006). Optical response of a single noble metal nanoparticle. J. Opt. A 8, S264–S272. doi: 10.1088/1464-4258/8/4/S28
Neuman, T., Esteban, R., Casanova, D., Garcí-a-Vidal, F. J., and Aizpurua, J. (2018). Coupling of molecular emitters and plasmonic cavities beyond the point-dipole approximation. Nano Lett. 18, 2358–2364. doi: 10.1021/acs.nanolett.7b05297
Nie, S., and Emory, S. R. (1997). Probing single molecules and single nanoparticles by surface-enhanced raman scattering. Science 275, 1102–1106. doi: 10.1126/science.275.5303.1102
Novotny, L., and Hecht, B. (2012). Principles of Nano-Optics, 2nd Edn. Cambridge, UK: Cambridge University Press.
Onsager, L. (1936). Electric moments of molecules in liquids. J. Am. Chem. Soc. 58, 1486–1493. doi: 10.1021/ja01299a050
Osawa, M., Matsuda, N., Yoshii, K., and Uchida, I. (1994). Charge transfer resonance raman process in surface-enhanced raman scattering from p-aminothiophenol adsorbed on silver: Herzberg-teller contribution. J. Phys. Chem. 98, 12702–12707. doi: 10.1021/j100099a038
Pustovit, V. N., and Shahbazyan, T. V. (2006). Microscopic theory of surface-enhanced raman scattering in noble-metal nanoparticles. Phys. Rev. B 73:085408. doi: 10.1103/PhysRevB.73.085408
Raab, M., Vietz, C., Daniel Stefani, F., Pedro Acuna, G., and Tinnefeld, P. (2017). Shifting molecular localization by plasmonic coupling in a single-molecule mirage. Nat. Comm. 8:13966. doi: 10.1038/ncomms13966
Roelli, P., Galland, C., Piro, N., and Kippenberg, T. J. (2016). Molecular cavity optomechanics as a theory of plasmon-enhanced raman scattering. Nat. Nanotechnol. 11, 164–169. doi: 10.1038/nnano.2015.264
Ru, E. C. L., and Etchegoin, P. G. (2009). Principles of Surface-Enhanced Raman Spectroscopy. Amsterdam: Elsevier.
Schmidt, M. K., Esteban, R., González-Tudela, A., Giedke, G., and Aizpurua, J. (2016). Quantum mechanical description of raman scattering from molecules in plasmonic cavities. ACS Nano 10, 6291–6298. doi: 10.1021/acsnano.6b02484
Sevinc, P. C., Dhital, B., Govind Rao, V., Wang, Y., and Lu, H. P. (2016). Probing electric field effect on covalent interactions at a molecule-semiconductor interface. J. Am. Chem. Soc. 138, 1536–1542. doi: 10.1021/jacs.5b10253
Sharma, B., Frontiera, R. R., Henry, A.-I., Ringe, E., and Duyne, R. P. V. (2012). Sers: materials, applications, and the future. Mater. Today 15, 16–25. doi: 10.1016/S1369-7021(12)70017-2
Solís, D. M., Taboada, J. M., Obelleiro, F., Liz-Marzán, L. M., and García de Abajo, F. J. (2014). Toward ultimate nanoplasmonics modeling. ACS Nano 8, 7559–7570. doi: 10.1021/nn5037703
Waks, E., and Sridharan, D. (2010). Cavity qed treatment of interactions between a metal nanoparticle and a dipole emitter. Phys. Rev. A 82:043845. doi: 10.1103/PhysRevA.82.043845
Wang, X., Huang, S. C., Huang, T. X., Su, H. S., Zhong, J. H., Zeng, Z. C., et al. (2017). Tip-enhanced raman spectroscopy for surfaces and interfaces. Chem. Soc. Rev. 46, 4020–4041. doi: 10.1039/C7CS00206H
Wang, Y., Yan, B., and Chen, L. (2013). Sers tags: novel optical nanoprobes for bioanalysis. Chem. Rev. 113, 1391–1428. doi: 10.1021/cr300120g
Wasserroth, S., Bisswanger, T., Mueller, N. S., Kusch, P., Heeg, S., Clark, N., et al. (2018). Graphene as a local probe to investigate near-field properties of plasmonic nanostructures. Phys. Rev. B 97:155417. doi: 10.1103/PhysRevB.97.155417
Weick, G., Molina, R. A., Weinmann, D., and Jalabert, R. A. (2005). Lifetime of the first and second collective excitations in metallic nanoparticles. Phys. Rev. B 72:115410. doi: 10.1103/PhysRevB.72.115410
Yang, H. U., D'Archangel, J., Sundheimer, M. L., Tucker, E., Boreman, G. D., and Raschke, M. B. (2015). Optical dielectric function of silver. Phys. Rev. B 91:235137. doi: 10.1103/PhysRevB.91.235137
Yu, P. Y., and Cardona, M. (2010). Fundamentals of Semiconductors: Physics and Materials Properties, 4th Edn. Berlin: Springer.
Yu, R., Liz-Marzán, L. M., and García de Abajo, F. J. (2017). Universal analytical modeling of plasmonic nanoparticles. Chem. Soc. Rev. 46, 6710–6724. doi: 10.1039/C6CS00919K
Zuloaga, J., and Nordlander, P. (2011). On the energy shift between near-field and far-field peak intensities in localized plasmon systems. Nano Lett. 11, 1280–1283. doi: 10.1021/nl1043242
Appendix
Local Field Correction Factor
As demonstrated above, a local field correction factor CLF must be included in our microscopic theory to reproduce the experimental absorption cross sections of plasmonic nanoparticles (see Figure 3). In this appendix we will derive the general expression for CLF in Equation (18).
Due to the normalization of the plasmon eigenvectors (Equation 17) all prefactors that accounted for the coupling to an external light field are not included. The plasmon eigenvector qw describes the microscopic oscillation of free charges inside the nanoparticle. The incident light field is described by a macroscopic amplitude which differs from the microscopic amplitude inside the nanoparticle because of a depolarization of the incident light field by the bound electrons of the metal. This can be modeled by considering a plasmonic point dipole inside a spherical nanoparticle with a dielectric function ϵb that accounts for the effect of the bound charges and interband transitions (Lamowski et al., 2018). The amplitude of the light field inside the nanoparticle is given within the quasi-static approximation by Bohren and Huffman (1998)
The factor 3ϵm/(ϵb + 2ϵm) is known as a local field correction factor and might take different forms depending on the considered geometry (Onsager, 1936; de Vries and Lagendijk, 1998; Dolgaleva and Boyd, 2012). It must be also included in when calculating the quantized electric field of the plasmon in Equations (31) and (32).
To obtain a more general expression we consider a nanoparticle with an ellipsoidal shape. Using a Drude model for the electromagnetic response of the metal, the dipolar plasmon resonance occurs at Bohren and Huffman (1998) and Ru and Etchegoin (2009)
where L is a shape-dependend depolarization factor which is 1/3 for a nanosphere (for explicit expressions see Bohren and Huffman, 1998; Ru and Etchegoin, 2009). The amplitude of the incident light field inside the nanoparticle is given by
Using Equation (2) we obtain the local field correction factor
As this factor only contains the bulk plasma frequency of the metal ωp, the dielectric constant of the environment ϵm and the plasmon frequency ωpl it can be used for any dipolar plasmon mode of a single nanoparticle.
Keywords: surface-enhanced Raman spectroscopy (SERS), plasmonics, perturbation theory, second quantization formalism, optical interference
Citation: Mueller NS and Reich S (2019) Modeling Surface-Enhanced Spectroscopy With Perturbation Theory. Front. Chem. 7:470. doi: 10.3389/fchem.2019.00470
Received: 07 March 2019; Accepted: 19 June 2019;
Published: 16 July 2019.
Edited by:
Ivano Alessandri, University of Brescia, ItalyReviewed by:
Lingxin Chen, Yantai Institute of Coastal Zone Research (CAS), ChinaMikolaj Kajetan Schmidt, Macquarie University, Australia
Copyright © 2019 Mueller and Reich. This is an open-access article distributed under the terms of the Creative Commons Attribution License (CC BY). The use, distribution or reproduction in other forums is permitted, provided the original author(s) and the copyright owner(s) are credited and that the original publication in this journal is cited, in accordance with accepted academic practice. No use, distribution or reproduction is permitted which does not comply with these terms.
*Correspondence: Niclas S. Mueller, bmljbGFzbUBwaHlzaWsuZnUtYmVybGluLmRl