
95% of researchers rate our articles as excellent or good
Learn more about the work of our research integrity team to safeguard the quality of each article we publish.
Find out more
ORIGINAL RESEARCH article
Front. Chem. , 24 April 2018
Sec. Analytical Chemistry
Volume 6 - 2018 | https://doi.org/10.3389/fchem.2018.00131
This article is part of the Research Topic Multisensor Systems for Analysis of Liquids and Gases: Trends and Developments View all 15 articles
 Celia Garcia-Hernandez1
 Cristina Medina-Plaza1
 Cristina Garcia-Cabezon2
 Yolanda Blanco2
 Jose A. Fernandez-Escudero3
 Enrique Barajas-Tola4
 Miguel A. Rodriguez-Perez1
 Fernando Martin-Pedrosa2
 Maria L. Rodriguez-Mendez1*
The maturity of grapes is usually monitored by means of the sugar concentration. However, the assessment of other parameters such as the phenolic content is also important because the phenolic maturity has an important impact on the organoleptic characteristics of wines. In this work, voltammetric sensors able to detect phenols in red grapes have been developed. They are based on metal oxide nanoparticles (CeO2, NiO, and TiO2,) whose excellent electrocatalytic properties toward phenols allows obtaining sensors with detection limits in the range of 10−8 M and coefficients of variation lower than 7%. An electronic tongue constructed using a combination of the nanoparticle-based sensors is capable to monitor the phenolic maturity of red grapes from véraison to maturity. Principal Component Analysis (PCA) can be successfully used to discriminate samples according to the ripeness. Regression models performed using Partial Least Squares (PLS-1) have established good correlations between voltammetric data obtained with the electrochemical sensors and the Total Polyphenolic Index, the Brix degree and the Total Acidity, with correlation coefficients close to 1 and low number of latent variables. An advantage of this system is that the electronic tongue can be used for the simultaneous assessment of these three parameters which are the main factors used to monitor the maturity of grapes. Thus the electronic tongue based on metal oxide nanoparticles can be a valuable tool to monitor ripeness. These results demonstrate the exciting possible applications of metal oxide nanoparticles in the field of electronic tongues.
Grapes must be harvested at the optimal maturity point. The sugar content has a direct influence on the alcoholic degree of wines and it is the analytical indicator commonly used to decide the harvest date (OIV, 2013). It is periodically assessed using fast and simple density measurements and it is expressed as degree Brix (°Brix). The variation of the acidity along ripening is also an important parameter which is expressed as Total Acidity (TA) (Boss et al., 2014).
The phenolic content of grapes also changes during ripening and the phenolic maturity has a direct impact on the organoleptic characteristics of wines, and it would be desirable to assess it routinely. However, the main changes in the phenolic content take place in skins and seeds, and the assessment of phenolic maturity requires the previous separation of seeds and skins using long and complex methods (Xu et al., 2011; Meléndez et al., 2013; Nogales-Bueno et al., 2014; Sharma et al., 2015). Oenologists require new methods capable to measure the phenolic maturity of grapes with simple and direct methods.
Besides, it would be of great interest to develop new technologies able to detect simultaneously the sugar content, acidity and phenolic composition. Such a method would help to take faster decisions about the optimal harvest date. One possible approach can be the use of holistic methods, where complex signals obtained from an instrument such as GC-MS, FTIR or NMR, are processed using multivariate methods. These holistic methods have been successfully used to classify wines according to quality, to monitor fermentation, to detect wine spoilage, etc. (Buratti et al., 2011; Cozzolino et al., 2012; Godelmann et al., 2014).
Electronic tongues (ET) are a new class of instruments which are gaining interest in the food industry (Cosio et al., 2012; Kirsanov et al., 2012; Lvova et al., 2014; Rodríguez-Méndez, 2016). They are multisensor systems where an array of sensors is combined with a multivariate data software. The most common sensors used in ETs dedicated to the analysis of wines are electrochemical (amperometric or voltammetric). They have been widely used to discriminate wines according to the variety of grape, the vintage, the type of barrel used for aging etc. (Gutiérrez et al., 2010; Prieto et al., 2011; Apetrei et al., 2012; Cetó et al., 2017; Rudnitskaya et al., 2017). In spite of the interest of winemakers to have available objective methods to determine the harvesting date and the quality of grapes, ETs have been rarely applied to the quality control of grapes or their musts (Codinachs et al., 2008; Gutiérrez et al., 2011; Campos et al., 2013; Medina-Plaza et al., 2014a,b).
Nowadays, it is clear that the performance of ETs can be improved by introducing in the array sensing units specifically dedicated to a particular application. Electrodes with enhanced performances can be obtained using new sensing materials linked to nanotechnology. Metal nanoparticles have been used in the fabrication of electrochemical sensors due to their electrocatalytic properties which are related to the formation of mixed valence states on their surface (Campbell and Compton, 2010; Saha et al., 2012; Lin et al., 2013). Metal nanoparticles have demonstrated their capability to catalyze the oxidation/reduction of organic acids and phenols commonly present in wines. The oxidation of phenols occurs at lower potentials, whereas the presence of metallic nanoparticles increases the reactivity of acids and enhances the intensity of the anodic wave at negative potentials (Medina-Plaza et al., 2015a,b). In spite of this interest, metal nanoparticles have rarely been included as sensing materials in electronic tongues (Gutiérrez et al., 2013; Sharpe et al., 2014; Mercante et al., 2015). Up to now, the sensing capabilities of metal oxide nanoparticles (MONPs) have never been tested in electronic tongues.
The aim of this work was to develop an electronic tongue (ET) formed by sensors based on metal oxide nanoparticles (CeO2, NiO, and TiO2,) and to evaluate their capabilities to detect phenols. Using chemometric techniques such as Principal Component Analysis (PCA), the ET was used to monitor the ripeness of 8 different varieties of grapes, from véraison (the onset of ripening) to post-maturity. Mathematical models were built to establish correlations between the phenolic index measured by traditional chemical techniques and the results of the ET. PLS-1 was used to predict the polyphenol index of the grapes along ripening. The possibility to obtain information about other classical indicators of maturity such as the °Brix and Total Acidity was also analyzed.
Metal oxide nanoparticles of Titanium (IV), Cerium (IV), and Nickel (II) (TiO2NP, CeO2NP, NiONP) were purchased from Sigma-Aldrich. All reagents and solvents were of high purity (Sigma–Aldrich). Deionized water (18.2 MΩ·cm−1) was obtained from a Millipore MilliQ purifier.
Electron Microscope TEM images were recorded using a high-resolution electron microscope (HRTEM: JEOL JEM 2200) (Tokyo, Japan) operating at an accelerating voltage of 200 kV. Sample images were processed using Image J image processing software (public software).
Eight varieties of red grapes typical from the Castilla-Leon region (Spain) were included in the study: Tempranillo, Garnacha, Cabernet-Sauvignon, Prieto Picudo, Mencia Regadio, Mencia Secano, Rufete, and Juan Garcia. Grapes were grown and harvested by the Agrotechnological Institute of Agriculture of the Regional Government (ITACyL) and the cellar Bodega Cooperativa de Cigales. Berries were collected in a weekly basis from véraison until grapes were completely mature. Ripeness rate was different from one variety to another. For this reason, the official harvest date indicated by traditional chemical parameters, varied from one variety of grape to another. Grapes from Tempranillo, Garnacha, and Cabernet Sauvignon were considered matured 6 weeks after véraison. The rest of varieties attained the optimal ripeness 5 weeks after véraison. In all cases several grape bunches were left in the vine and two extra samplings were collected in successive weeks in order to analyze over-ripened grapes.
Musts were prepared from 100 berries representative of the ripening state of the vineyard. Once collected, grapes were crushed, and peels and seeds were separated by decantation. 50 mL aliquots of musts thus obtained, were frozen at −20°C until used. Total Polyphenol Index (TPI), Brix degree (°Brix) and Total Acidity (TA) were analyzed following international standard methods (OIV, 2013; Boss et al., 2014). TPI was determined by diluting the samples with distilled water in a 1:100 ratio and measuring the absorbance directly at 280 nm (using a quartz cuvette of 10 mm optical path). The value of the I280 nm (TPI) was calculated by multiplying the absorbance × 100. The total acidity is the sum of its titratable acidities when it is titrated to pH 7 against a standard alkaline solution. Carbon dioxide is not included in the total acidity. The total acidity is usually expressed in grams of tartaric acid per liter. Brix measurements are taken with an Atago WM-7 digital refractometer.
A multisensor system consisting of 4 Carbon Paste Electrodes (CPE) was formed. Three electrodes were modified with metal oxide nanoparticles including NiO (NiONP-CPE), TiO2 (TiO2NP-CPE), and CeO2 (CeO2NP-CPE). One unmodified carbon paste electrode (C-CPE) was also included in the array. Electrodes were prepared following the classical method by mixing graphite with the corresponding metal oxide nanoparticle (15% w/w of the MONP) Nujol was used as the binder until a paste was obtained. The paste was packed in a 1 mL plastic syringe and compressed. A metallic copper wire was used as a contact (Apetrei et al., 2011). The size of MNOPS ranged from 20 to 50 nM. Figure 1 illustrates the shape and size of TiO2MNPs. As observed in the TEM image, MONPs were spheric with an homogeneous distribution of sizes that coincided with the size labeled by the supplier.
Electrochemical experiments were carried out using a potentiostat (Autolab. Metrohm, USA) combined with a multiplexor system. CPEs (surface of 2 mm in diameter) served as working electrodes, with an Ag|AgCl/KCl 3 mol·L−1 electrode acting as a reference electrode and a platinum wire as the counter electrode. The MONPs sensors were able to provide responses toward aqueous solutions of phenolic acids (vanillic and caffeic acids) and polyphenols (catechol and pyrogallol) present in wines. The electrocatalytic properties and the detection limits (LD) were evaluated. The calibration curves were constructed measuring standard solutions with concentrations ranging from 10−4 to 10−6 mol·L−1. LDs were calculated following the 3 SD/m criterion. The reproducibility of data provided by the MONPs sensors was evaluated by comparing data provided by three sensors measuring standard solutions in different days. Cyclic voltammograms were registered at a sweep rate of 0.1 V·s−1 from −0.8 to +1.0 V. Four replicas of each sample were measured. Principal Component Analysis (PCA) and Partial Least Squares (PLS) models were built using the software Matlab v5.3. (The Mathworks Inc., Natick, MA, USA).
Prior to perform the statistical analysis, the number of variables was reduced using a data reduction technique based on predefined response “bell-shaped-windowing” curves called “kernels” (Medina-Plaza et al., 2015b). In this method, each voltammogrammetric curve is multiplied by 10 smooth, bell-shaped windowing functions defined as:
where ai, bi, and ci define the width, shape, and center of the different windowing functions Ki. Subsequently, data were integrated with respect to voltage. As a result, each voltammogram was reduced to a vector of 10 variables that were used as the input data source for statistical analysis.
Ripening was monitored by measuring °Brix, TA, and TPI in a weekly basis (from véraison). These parameters were used by oenologists to establish the optimal date of harvest. The °Brix/TA ratio was also calculated. This parameter is also commonly used to decide the optimal maturity date even if there is no biochemical relationship between the acidity loss and the sugar increase. The complete list of parameters is collected in Supplementary Table. Details can be observed in Figure 2 for variety Tempranillo.
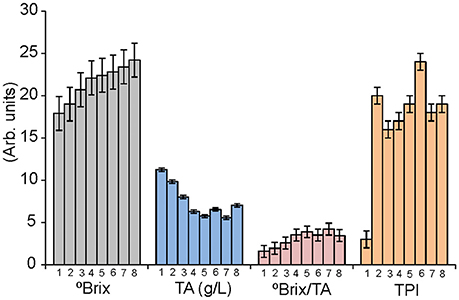
Figure 2. Variation of the °Brix (g sugar/ 100 g solution), TA (g/L), Brix/TA and TPI for juices obtained from the variety Tempranillo harvested weekly form véraison to over-ripening.
As observed in the Figure 2, TA and °Brix followed the expected trend: TA decreased along the ripening process, while sugar content increased. °Brix/TA ratio increased accordingly. These values were stabilized after week 5, indicating the proximity of the end of ripeness, and grapes were considered mature and harvested in week 6. Similar trends were observed in Garnacha and Cabernet-Sauvignon that also reached the maturity in week 6. Mencia Secano, Mencia Regadio, Rufete, and Juan Garcia gapes, matured at a faster rate, and were considered ripened and harvested in week 5.
In order to study the changes in over-ripened grapes, some bunches were kept in the plant during 2 more weeks. During these 2 extra weeks, TA values were almost constant, whereas °Brix raised drastically in Cabernet and Garnacha grapes, indicating that optimal ripening was not attained until weeks 7 or 8.
TPI values increased sharply just after the véraison. The following weeks, TPI varied irregularly. These results evidenced the difficulty to assess the phenolic maturity using traditional TPI measurements in pulps. It is therefore important for wine producers to develop new methods to define the peak of ripeness and in particular of the phenolic ripeness (which nowadays is difficult to assess).
The objective of this work was to develop a multisensory system based on metal oxide nanoparticles to monitor the phenolic ripening. As a first task, the response of the MONP-CPE electrodes toward four phenols present in musts (vanillic acid, catechol, caffeic acid, and pyrogallol 10−4 M), was evaluated (Figure 3). The response of the C-CPE electrode is also shown for comparison purposes.
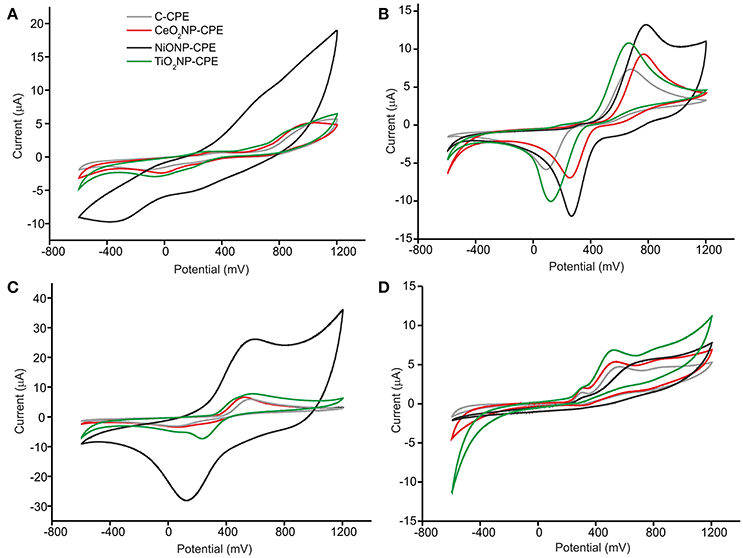
Figure 3. CV of (A) vanillic acid, (B) catechol, (C) caffeic acid, and (D) pyrogaloll at C-CPE, CeO2NP-CPE, NiONP-CPE, and TiO2NP-CPE electrodes. Concentration of 10−4M. Scan rate 100 mV·s−1.
The responses on MONP-CPEs were consistent with those already reported in bare CPE electrodes (Kilmartin et al., 2001), but the presence of MONPs caused shifts in the position of the peaks to lower potentials and/or increases in the intensity of the peaks. This effect could be attributed to the excellent electrocatalytic activity of MONPs due to the mixed valence state found at the nanoparticle surface (Medina-Plaza et al., 2015b). Depending on the nature of the MONPs used as modifiers, the responses toward a certain compound was more or less enhanced. For instance, the intensity of the redox peaks produced by the oxidation/reduction observed in vanillic acid and catechol at the graphite electrode surface increased drastically in the presence of NiONPs. The electrocatalytic effect was not so remarkable at TiO2NP-CPE or CeO2NP-CPEs electrodes. It is also worth noting that the electrocatalytic effect was more intense in the mono-phenol (vanillic acid) or di-phenols (catechol and caffeic acid) than in the tri-phenol (pyrogallol).
Limits of detection (LD) were calculated from the slope of the curves of the redox peaks registered at concentrations ranging from 10−4 to 10−6 M, using 3 SD/m method, where SD is the standard deviation of the current density. LDs as low as 10−8 M could be attained, which are much lower than those typically found in carbon electrodes (Kilmartin et al., 2001). The results are illustrated in Figure 4 for TiO2NP-CPE immersed in caffeic acid. Reproducibility was also evaluated by measuring repeatedly the standard solutions and Variation coefficients (CV) lower than 7% were found in all cases. From the above results it can be concluded that modification with metal oxide nanoparticles drastically increases the sensibility of voltammetric electrodes toward phenols present in musts.
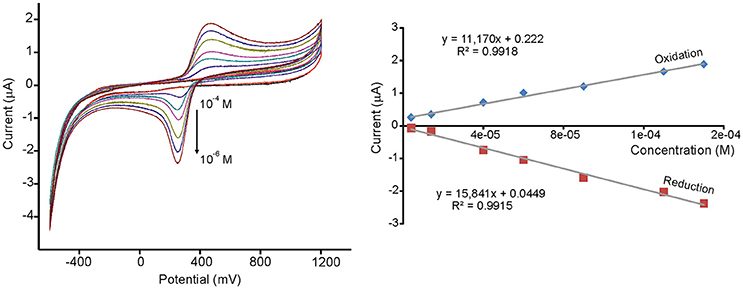
Figure 4. CVs and calibration curves of TiO2NP-CPE immersed in increasing concentrations of caffeic acid (from 4.0·10−6 M to 1.5·10−4 M). Scan rate 0.1 V·s-1.
As stated before, each sensor showed a characteristic response which is linked to the electrocatalytic properties of the type of nanoparticle introduced in the carbon paste. This cross-selectivity can be used to construct a multisensor system coupled to a pattern recognition software able to provide a pattern or “digital fingerprint” for each sample studied.
Figure 5 shows the Principal Component Analysis (PCA) scores plot obtained from the responses of the array to 10−4 M solutions of phenols. The PCA showed four distinct clusters in the plot of the two first principal components (PC1 61.31% and PC2 20.61%). The position of the clusters was related to the number of hydroxyl groups in the molecule. The monophenol (vanillic acid) was located at positive PC1 values, diphenols (catechol and caffeic acid) in the central part of the diagram and the triphenol (pyrogallol) on the left side corresponding to positive PC2 values.
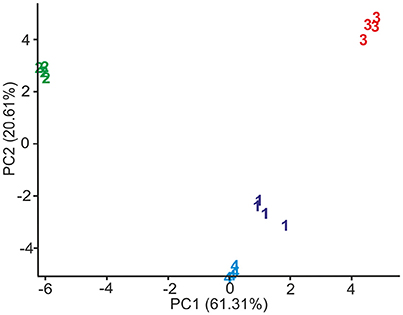
Figure 5. Scores plot of the first two principal components of the PCA model calculated from voltammograms registered when electrodes were immersed in 1: Catechol, 2: Pyrogallol, 3: Vanillic acid and 4: Caffeic acid.
The capacity of the electronic tongue to monitor the phenolic maturity of grapes was evaluated by analyzing juices obtained from grapes collected from véraison, in a weekly basis, during 7–8 weeks. Due to the complexity of the samples and in order to improve the repeatability, musts were diluted 1:2 with deionized water. Coefficients of variation lower than 7% were obtained in all cases.
Figure 6 illustrates the responses obtained using the NiONP-CPE and TiO2NP-CPE sensors immersed in musts obtained from grapes of the variety Garnacha collected during 7 weeks after véraison.
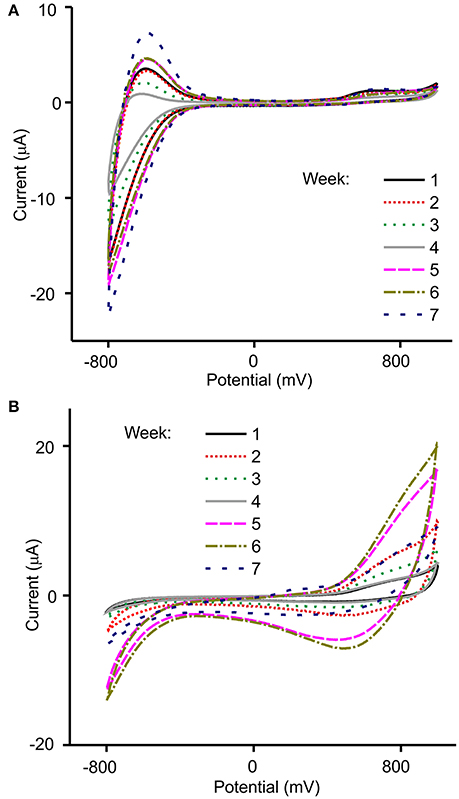
Figure 6. Voltammetric responses of (A) TiO2NP-CPE and (B) NiONP-CPE electrodes toward Garnacha grapes collected weekly after véraison.
As illustrated in the figure, voltammograms registered in must showed peaks in the 0.6–0.8 V region, produced by components with redox activity (mainly phenols). Other components present in musts also influenced the overall response. For instance, the peaks observed at negative potentials were affected by the acidity of the samples. The array of sensors showed an interesting cross-selectivity that was due to the different catalytic properties of the MONP selected. For instance, NiONP-CPEs were highly sensitive to phenols, whereas TiO2NP-CPEs were sensitive to the acidity.
The chemical changes occurring during the ripening process could be followed using the MONP-based sensors. First, the intensity of the peaks increased, then intensity decreased and finally increased according with the tendency shown in Figure 2 where TPI values varied similarly. The irregular increase stopped when optimal ripeness was attained. Simultaneously, a decrease in the total acidity corresponded with a progressive decrease in the intensity of the peaks at negative potentials. As already stated in the introduction, multivariate methods have demonstrated to be a good strategy for the analysis of wines. It can be expected that they can also be useful to monitor the ripeness of grapes.
When PCA was carried out using the data obtained from the electronic tongue, it was observed that clusters corresponding to grapes collected in the first 4 weeks after véraison, were positioned in a counterclockwise organization “drawing” a circle (Figure 7A). In sampling number 5, the circle was closed. Surprisingly, in next samplings the positions were repeated and clusters corresponding to next specimens were situated continuing the counterclockwise trend following a “screw” structure. According to PCA, grapes could be considered matured when the clusters reached the original positions. Similar results have been obtained for all the grape varieties analyzed in this work. Similar results have also been observed in previous works where ETs have been used to monitor maturity of grapes (Medina-Plaza et al., 2016)
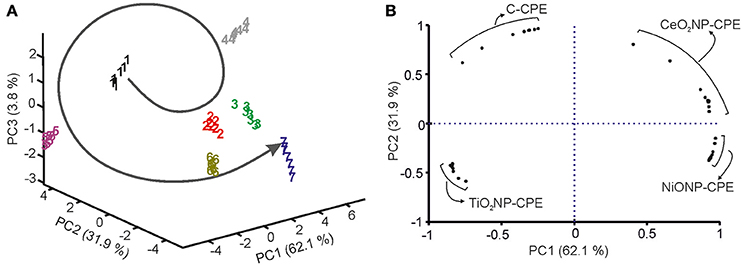
Figure 7. (A) 3D Score plot, (B) Loading plot of PCA performed from grape juices from the variety Juan Garcia harvested weekly from véraison to over-ripening (1: First week, 2: Second week, etc. 7: Over-ripening week).
Figure 7B show the contribution of the variables in a loading plot. The loadings of each sensor (ten variables per sensor) spread along the four quadrants. This graph shows the high cross-selectivity achieved by the array of sensors.
Table 1 shows the statistical parameters obtained from the PLS-1 regression models (leave one out validation) correlating the output of the array of sensors with the chemical parameters (TPI, °Brix, TA). PLS-1 builds regression models to establish a linear relationship between the set of predictors (X-variable: Voltammetric signals obtained from the array of sensors) and the set of responses (Y-variable: Chemical parameters obtained with traditional methods). PLS-1 finds the latent variables (indicated as number of components) in X that will best predict the latent variables in Y.
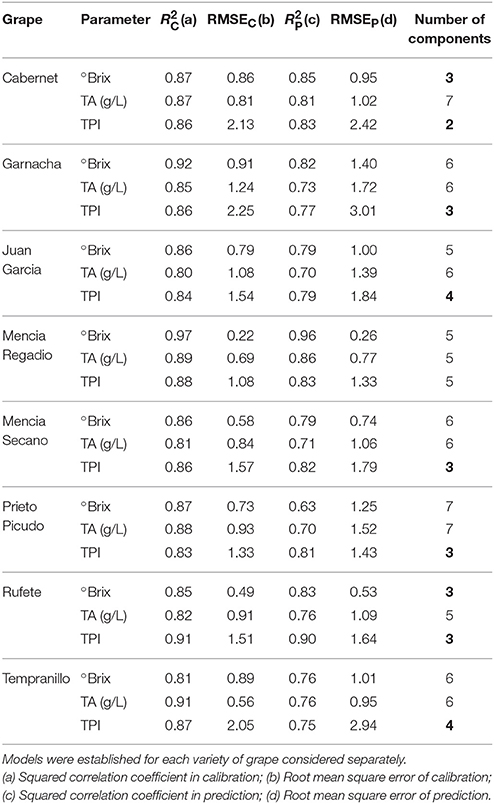
Table 1. Results of the PLS-1 regression models correlating the chemical parameters and the signals of the sensors.
In all varieties of grapes, good correlations were found with the Total Polyphenol Index. Using a low number of components, both the calibration and the prediction showed Squared Correlation Coefficients in calibration (R2C) and in prediction (R2V) of ca. 0.8. Additionally, low Root Mean Square Error of calibration (RMSEC) and of prediction (RMSEp) were accomplished. These results confirm that the ET can be used to monitor the phenolic maturity of grapes. The °Brix and Total Acidity which are the parameters commonly used to evaluate the maturity of grapes, could also be predicted using the PLS-1 models but with lower correlation coefficients in prediction (~0.7) and the models need a higher number of components. In spite of the lower correlation, the models are good enough to confirm that the electrochemical responses also reflected the acidity and the sugar concentration. This indicates that it is possible to obtain simultaneous information of the three main parameters used to monitor the maturity of grapes.
The advantages of metal oxide nanoparticles as sensing materials for the detection of phenols has been evidenced. They rely on the excellent electrocatalytic properties of the metal oxide nanoparticles, that improved the sensitivity and limits of detection toward phenols with respect to unmodified sensors. Using these exceptional sensing properties, and the cross-selectivity shown by different MONPs, an electronic tongue based on metal oxide nanoparticles has been developed. The chemical changes occurring during ripening could be followed using the MONP-based multisensor system. The sensors based on different MONP show an excellent degree of cross-selectivity. Using PLS-1, correlations have been established between the signal of the multisensor system and the Total Polyphenol Index TPI, the °Brix, and the Total Acidity.
According to this, simultaneous analysis of three important markers of maturity can be achieved using a multisensory system based on MONPs. This means that the ET can be a useful tool to establish with a better accuracy the optimal harvesting date in a single experiment. This method can be used as a supplementary tool to classical analytical techniques.
The results shown here demonstrate the excellent opportunities offered by metal oxide nanoparticles as sensing materials in electronic tongues.
MR-M: conceived the experiments an wrote the paper; CG-H, CM-P, CG-C, and YB: carried out the experiments; JF-E and EB-T: provided de grape samples and analyzed the grapes by chemical methods; MR-P and FM-P: carried out the chemometric analysis.
The authors declare that the research was conducted in the absence of any commercial or financial relationships that could be construed as a potential conflict of interest.
Financial support by MINECO and FEDER (AGL2015-67482-R) and the Junta de Castilla y León FEDER (VA011U16) is gratefully acknowledged. CG-H thanks for the grant of JCYL (BOCYL-D-24112015-9).
The Supplementary Material for this article can be found online at: https://www.frontiersin.org/articles/10.3389/fchem.2018.00131/full#supplementary-material
Apetrei, C., Apetrei, I. M., De Saja, J. A., and Rodríguez-Méndez, M. L. (2011). Carbon paste electrodes made from different carbonaceous materials: application in the study of antioxidants. Sensors 11, 1328–1344. doi: 10.3390/s110201328
Apetrei, I. M., Rodríguez-Méndez, M. L., Apetrei, C., Nevares, I., del Alamo, M., and de Saja, J. A. (2012). Monitoring of evolution during red wine aging in oak barrels and alternative method by means of an electronic panel test Food Res. Intnl. 45, 244–249. doi: 10.1016/j.foodres.2011.10.034
Boss, P. K., Bottcher, C., and Davies, C. (2014). Various influences of harvest date and fruit sugar content on different wine flavor and aroma compounds. Am. J. Enology Vitic. 65, 341–353. doi: 10.5344/ajev.2014.13137
Buratti, S., Ballabio, D., Giovanelli, G., Dominguez, C. M. Z., Moles, A., Benedetti, S., et al. (2011). Monitoring of alcoholic fermentation using near infrared and mid infrared spectroscopies combined with electronic nose and electronic tongue. Anal. Chim. Acta 697, 67–74. doi: 10.1016/j.aca.2011.04.020
Campbell, F. W., and Compton, R. G. (2010). The use of nanoparticles in electroanalysis: an updated review. Anal. Bioanal. Chem. 396, 241–259. doi: 10.1007/s00216-009-3063-7
Campos, I., Bataller, R., Armero, R., Gandia, J. M., Soto, J., Martínez-Mañez, R., et al. (2013). Monitoring grape ripeness using a voltammetric electronic tongue. Food Res. Int. 54, 1369–1375. doi: 10.1016/j.foodres.2013.10.011
Cetó, X., González-Calabuig, A., Crespo, N., Pérez, S., Capdevila, J., Puig-Pujol, A., et al. (2017). Electronic tongues to assess wine sensory descriptors. Talanta 162, 218–224. doi: 10.1016/j.talanta.2016.09.055
Codinachs, L. M. I., Kloock, J. P., Schöning, M. J., Baldi, A., Ipatov, A., Bratov, A., et al. (2008). Electronic integrated multisensor tongue applied to grape juice and wine analysis. Analyst 113, 1440–1448. doi: 10.1039/b801228h
Cosio, M. E., Benedetti, S., and Scampio, M. (2012). Electronic Noses and Tongues in Chemical Analysis of Food: Techniques and Applications. London: Academic Press.
Cozzolino, D., McCarthy, J., and Bartowsky, E. (2012). Comparison of near infrared and mid infrared spectroscopy to discriminate between wines produced by different Oenococcus oeni strains after malolactic fermentation: a feasibility study. Food Control 26, 81–87. doi: 10.1016/j.foodcont.2012.01.003
Godelmann, R., Fang, F., Humpfer, E., Schütz, B., Bansbach, M., Schäfer, H., et al. (2014). Targeted and nontargeted wine analysis by 1H NMR spectroscopy combined with multivariate statistical analysis. Differentiation of important parameters: Grape variety, geographical origin, year of vintage. J. Agric. Food Chem. 61, 5610–5619. doi: 10.1021/jf400800d
Gutiérrez, J. M., Haddi, Z., Amari, A., Bouchikhi, B., Mimendia, A., Cetó, X., et al. (2013). Hybrid electronic tongue based on multisensor data fusion for discrimination of beers Sens. Actuators B: Chem. 177, 989–996. doi: 10.1016/j.snb.2012.11.110
Gutiérrez, J. M., Moreno-Barón, L., Pividori, M. I., Alegret, S., and Del Valle, M. (2010). A voltammetric electronic tongue made of modified epoxy-graphite electrodes for the qualitative analysis of wine. Microchim. Acta 169, 261–268. doi: 10.1007/s00604-010-0351-z
Gutiérrez, M., Domingo, C., Vila-Planas, J., Ipatov, A., Capdevila, F., Demming, S., et al. (2011). Hybrid electronic tongue for the characterization and quantification of grape variety in red wines. Sens. Actuators B Chem. 153, 695–702. doi: 10.1016/j.snb.2011.02.020
Kilmartin, P. A., Zou, H. L., and Waterhouse, A. L. (2001). A cyclic voltammetry method suitable for characterizing antioxidant properties of wine and wine phenolics. J. Agric. Food Chem. 49, 1957–1965. doi: 10.1021/jf001044u
Kirsanov, D., Mednova, O., Vietoris, V., Kilmartin, P. A., and Legin, A. (2012). Towards reliable estimation of an electronic tongue predictive ability from PLS regression models in wine analysis. Talanta 90, 109–116. doi: 10.1016/j.talanta.2012.01.010
Lin, X. Y., Ni, Y. N., and Kokot, S. (2013). Glassy carbon electrodes modified with gold nanoparticles for the simultaneous determination of three food antioxidants. Anal. Chim. Acta 765, 54–62. doi: 10.1016/j.aca.2012.12.036
Lvova, L., Kirsanov, D., Di Natale, C., and Legin, A. (2014). Multisensor systems for chemical analysis: Materials and Sensors. Boca Ratón, FL: CRC Press.
Medina-Plaza, C., De Saja, J. A., Fernández-Escudero, J. A., Barajas-Tola, E., Medrano, G., et al. (2016). Array of biosensors for discrimination of grapes according to grapevariety, vintage and ripeness. Anal. Chim. Acta 947, 16–22 doi: 10.1016/j.aca.2016.10.032
Medina-Plaza, C., De Saja, J. A., and Rodríguez-Méndez, M. L. (2014a). Bioelectronic tongue based on lipidic nanostructured layers containing phenol oxidases and lutetium bisphthalocyanine for the analysis of grapes. Biosens. Bioelectron. 57, 276–283. doi: 10.1016/j.bios.2014.02.023
Medina-Plaza, C., García-Cabezón, C., García-Hernández, C., Bramorski, C., Blanco-Val, Y., Martín-Pedrosa, et al. (2015a). Analysis of organic acids and phenols of interest in the wine industry using Langmuir-Blodgett films based on functionalized nanoparticles. Anal. Chim. Acta 853, 572–578. doi: 10.1016/j.aca.2014.10.046
Medina-Plaza, C., Revilla, G., Muñoz, R., Fernández-Escudero, J. A., Barajas, E., Medrano, G., et al. (2014b). Electronic tongue formed by sensors and biosensors containing phthalocyanines as electron mediators. Application to the analysis of red grapes. J. Porphyrins Phthalocyanines 18, 76–86. doi: 10.1142/S1088424613501137
Medina-Plaza, C., Rodríguez-Méndez, M. L., Sutter, P., Tong, X., and Sutter, E. (2015b). Nanoscale Au–In alloy–oxide core–shell particles as electrocatalysts for efficient hydroquinone detection. J. Phys. Chem. C 119, 25100–25107. doi: 10.1021/acs.jpcc.5b07960
Meléndez, E., Ortiz, M. C., Sarabia, L. A., and Íñiguez, M., Puras, P. (2013). Modelling phenolic and technological maturities of grapes by means of the multivariate relation between organoleptic and physicochemical properties. Anal. Chim. Acta 761, 53–61. doi: 10.1016/j.aca.2012.11.021
Mercante, L. A., Scagion, V. P., Pavinatto, A., Sanfelice, R. C., Mattoso, L. H. C., and Correa, D. S. (2015). Electronic tongue based on nanostructured hybrid films of gold nanoparticles and phthalocyanines for milk analysis. J. Nanomat. 16:402. doi: 10.1155/2015/890637
Nogales-Bueno, J., Hernández-Hierro, J. M., Rodríguez-Pulido, F. J., and Heredia, F. J. (2014). Determination of technological maturity of grapes and total phenolic compounds of grape skins in red and white cultivars during ripening by near infrared hyperspectral image: a preliminary approach. Food Chem. 152, 586–591. doi: 10.1016/j.foodchem.2013.12.030
OIV (2013). Compendium of International Methods of Analysis of Wines and Musts; Organisation Internationale de la Vigne et du Vin. Paris.
Prieto, N., Gay, M., Vidal, S., Aagaard, O., De Saja, J. A., and Rodríguez-Méndez, M. L. (2011). Analysis of the influence of the type of closure in the organoleptic characteristics of a red wine by using an electronic panel. Food Chem. 129, 589–594. doi: 10.1016/j.foodchem.2011.04.071
Rodríguez-Méndez, M. L. (2016). Electronic Noses and Tongues in Food Industry. London: Academic Press.
Rudnitskaya, A., Schmidtke, L. M., Reis, A., Domingues, M. R. M., Delgadillo, I., Debus, B., et al. (2017). Measurements of the effects of wine maceration with oak chips using an electronic tongue. Food Chem. 229, 20–27. doi: 10.1016/j.foodchem.2017.02.013
Saha, K., Agasti, S. S., Kim, C., Li, X., and Rotello, V. M. (2012). Gold nanoparticles in chemical and biological sensing. Chem. Rev. 112, 2739–2779. doi: 10.1021/cr2001178
Sharma, S., Kori, S., and Parmar, A. (2015). Surfactant mediated extraction of total phenolic contents (TPC) and antioxidants from fruits juices. Food Chem. 185, 284–288. doi: 10.1016/j.foodchem.2015.03.106
Sharpe, E., Bradley, R., Frasco, T., Jayathilaka, D., Marsh, A., and Andreescu, S. (2014). Metal oxide based multisensor array and portable database for field analysis of antioxidants. Sens. Actuators B Chem. 193, 552–562. doi: 10.1016/j.snb.2013.11.088
Keywords: electronic tongue, grape, ripening, phenolic maturity, metal oxide nanoparticles
Citation: Garcia-Hernandez C, Medina-Plaza C, Garcia-Cabezon C, Blanco Y, Fernandez-Escudero JA, Barajas-Tola E, Rodriguez-Perez MA, Martin-Pedrosa F and Rodriguez-Mendez ML (2018) Monitoring the Phenolic Ripening of Red Grapes Using a Multisensor System Based on Metal-Oxide Nanoparticles. Front. Chem. 6:131. doi: 10.3389/fchem.2018.00131
Received: 23 January 2018; Accepted: 09 April 2018;
Published: 24 April 2018.
Edited by:
Larisa Lvova, Università degli Studi di Roma Tor Vergata, ItalyReviewed by:
Nicole J. Jaffrezic-Renault, Claude Bernard University Lyon 1, FranceCopyright © 2018 Garcia-Hernandez, Medina-Plaza, Garcia-Cabezon, Blanco, Fernandez-Escudero, Barajas-Tola, Rodriguez-Perez, Martin-Pedrosa and Rodriguez-Mendez. This is an open-access article distributed under the terms of the Creative Commons Attribution License (CC BY). The use, distribution or reproduction in other forums is permitted, provided the original author(s) and the copyright owner are credited and that the original publication in this journal is cited, in accordance with accepted academic practice. No use, distribution or reproduction is permitted which does not comply with these terms.
*Correspondence: Maria L. Rodriguez-Mendez, bWx1ekBlaWkudXZhLmVz
Disclaimer: All claims expressed in this article are solely those of the authors and do not necessarily represent those of their affiliated organizations, or those of the publisher, the editors and the reviewers. Any product that may be evaluated in this article or claim that may be made by its manufacturer is not guaranteed or endorsed by the publisher.
Research integrity at Frontiers

Learn more about the work of our research integrity team to safeguard the quality of each article we publish.