 Yeonju Park
 Isao Noda
 Young Mee Jung
- 1Department of Chemistry, Kangwon National University, Chunchon, South Korea
- 2Department of Materials Science and Engineering, University of Delaware, Newark, DE, USA
This review outlines the recent works of two-dimensional correlation spectroscopy (2DCOS) in polymer study. 2DCOS is a powerful technique applicable to the in-depth analysis of various spectral data of polymers obtained under some type of perturbation. The powerful utility of 2DCOS combined with various analytical techniques in polymer studies and noteworthy developments of 2DCOS used in this field are also highlighted.
Introduction
Noda developed two-dimensional correlation spectroscopy (2DCOS) for analyzing the small-amplitude dynamic strain-dependent time-resolved IR linear dichroism spectra of a polymer film (Noda, 1986). Since the concept of 2DCOS was expanded to the various spectroscopic applications in 1993 (Noda, 1993), the generalized 2DCOS has become a very powerful analytical technique in many fields of spectroscopic studies, especially in polymer study.
The generalized 2DCOS can elucidate information in spectral variations, e.g., IR (Kim et al., 2006b; Cerdà-Costa et al., 2009; Huang et al., 2009; Unger et al., 2009, 2011; Del Río et al., 2010; Huang and Kuo, 2010; Jelèić et al., 2010; Jia et al., 2010; Lee et al., 2010, 2012; Peng et al., 2010; Popescu and Vasile, 2010, 2011; Zheng et al., 2010; Cheng et al., 2011; Jin et al., 2011; Kuo and Liu, 2011; Musto et al., 2011; Quaroni et al., 2011; Wang and Wu, 2011; Zhang et al., 2011; Ando et al., 2012; Qu et al., 2012; Su et al., 2012; Wu et al., 2012; Chai et al., 2013; Lai and Wu, 2013; Park et al., 2013; Shinzawa et al., 2013; Wang et al., 2013, 2014; Galizia et al., 2014; Hou et al., 2014; Noda, 2014c; Seo et al., 2014), Raman (Radice et al., 2010; Tang et al., 2010; Ma et al., 2011; Ji et al., 2012; Pazderka and Kopecký Jr, 2012; Brewster et al., 2013; Grzeszczuk et al., 2013; Noda, 2014d), terahertz (THz) (Hoshina et al., 2012, 2014), X-ray (Guo et al., 2011), UV-Vis (Hong et al., 2005; Jiang and Wu, 2008; Sikirzhytski et al., 2012; Zhong et al., 2012), NMR (Oh et al., 2009; Li et al., 2013), fluorescence (Hur et al., 2011; Zhang et al., 2013), and even chromatography (Izawa et al., 2001), under various external perturbations, such as thermal, electrical, optical, magnetic, and chemical perturbations (Noda, 1986, 1993; Hong et al., 2005; Kim et al., 2006b; Jiang and Wu, 2008; Cerdà-Costa et al., 2009; Huang et al., 2009; Oh et al., 2009; Unger et al., 2009; Del Río et al., 2010; Huang and Kuo, 2010; Jelèić et al., 2010; Jia et al., 2010; Lee et al., 2010, 2012; Peng et al., 2010; Popescu and Vasile, 2010, 2011; Radice et al., 2010; Tang et al., 2010; Zheng et al., 2010; Zhang et al., 2011; Cheng et al., 2011; Guo et al., 2011; Jin et al., 2011; Kuo and Liu, 2011; Ma et al., 2011; Quaroni et al., 2011; Unger et al., 2011; Wang and Wu, 2011; Ando et al., 2012; Hoshina et al., 2012, 2014; Ji et al., 2012; Pazderka and Kopecký Jr, 2012; Qu et al., 2012; Sikirzhytski et al., 2012; Su et al., 2012; Wu et al., 2012; Zhong et al., 2012; Brewster et al., 2013; Chai et al., 2013; Grzeszczuk et al., 2013; Lai and Wu, 2013; Li et al., 2013; Park et al., 2013; Shinzawa et al., 2013; Wang et al., 2013, 2014; Hou et al., 2014; Noda, 2014c,d; Seo et al., 2014). IR spectroscopy is the most common analytical probes used in 2DCOS (Kim et al., 2006b; Cerdà-Costa et al., 2009; Huang et al., 2009; Unger et al., 2009, 2011; Del Río et al., 2010; Huang and Kuo, 2010; Jelèić et al., 2010; Jia et al., 2010; Lee et al., 2010, 2012; Peng et al., 2010; Popescu and Vasile, 2010, 2011; Zheng et al., 2010; Cheng et al., 2011; Jin et al., 2011; Kuo and Liu, 2011; Musto et al., 2011; Quaroni et al., 2011; Wang and Wu, 2011; Zhang et al., 2011; Ando et al., 2012; Qu et al., 2012; Su et al., 2012; Wu et al., 2012; Chai et al., 2013; Lai and Wu, 2013; Park et al., 2013; Shinzawa et al., 2013; Wang et al., 2013, 2014; Galizia et al., 2014; Hou et al., 2014; Noda, 2014c; Seo et al., 2014). The most popularly applied external perturbation in 2DCOS is temperature (Kim et al., 2006b; Unger et al., 2009, 2011; Jia et al., 2010; Peng et al., 2010; Popescu and Vasile, 2010; Tang et al., 2010; Zheng et al., 2010; Cheng et al., 2011; Wang and Wu, 2011; Pazderka and Kopecký Jr, 2012; Chai et al., 2013; Li et al., 2013; Wang et al., 2013, 2014; Hoshina et al., 2014; Hou et al., 2014; Seo et al., 2014). Applications of 2DCOS in investigations of intriguing properties of polymer system measured by different types of analytical probes has been substantially increased (Izawa et al., 2001; Hong et al., 2005; Kim et al., 2006b; Jiang and Wu, 2008; Huang et al., 2009; Oh et al., 2009; Unger et al., 2009, 2011; Del Río et al., 2010; Huang and Kuo, 2010; Jelèić et al., 2010; Jia et al., 2010; Lee et al., 2010, 2012; Peng et al., 2010; Popescu and Vasile, 2010, 2011; Radice et al., 2010; Tang et al., 2010; Zheng et al., 2010; Cheng et al., 2011; Guo et al., 2011; Jin et al., 2011; Kuo and Liu, 2011; Ma et al., 2011; Wang and Wu, 2011; Zhang et al., 2011; Ando et al., 2012; Hoshina et al., 2012, 2014; Qu et al., 2012; Su et al., 2012; Wu et al., 2012; Zhong et al., 2012; Chai et al., 2013; Grzeszczuk et al., 2013; Lai and Wu, 2013; Park et al., 2013; Shinzawa et al., 2013; Wang et al., 2013, 2014; Hou et al., 2014; Noda, 2014c,d; Seo et al., 2014). Generalized 2D correlation spectra has notable advantages: examination of inter- or intra-molecular interactions and determination of the sequential order of events, which is hardly depicted in conventional spectroscopy.
In this review, the background of the generalized 2DCOS is briefly discussed, and the powerful applications of 2DCOS in the studies of polymers are presented. Illustrative examples of 2DOCS in polymer research describing the improved information gained with noteworthy developments of 2DCOS are also provided.
Background
Generalized 2D Correlation Spectroscopy
The detailed background of the generalized 2DCOS is well introduced in books and book chapters (Noda, 2002, 2009; Ozaki, 2002; Noda and Ozaki, 2004; Ozaki and Šašic, 2005; Ozaki and Noda, 2006; Noda and Lindsey, 2010; Czarnik-Matusewicz and Jung, 2014; Jung and Noda, 2014) and review articles (Noda et al., 1993, 2000; Noda, 2000, 2004, 2006, 2007, 2008, 2014a,b; Jung and Noda, 2014). Here, we briefly describe the basic concept of 2DCOS.
In 2DCOS, a set of spectra A(νj, ti) is obtained as a function of the spectral variable νj with j = 1, 2, … n and some perturbation variable ti with i = 1, 2, … m during a well-defined observation interval between t1 and tm. A series of perturbation-induced dynamic spectra collected in a systematic manner are transformed into a set of 2D correlation spectra by a simple cross correlation analysis as shown in Figure 1.
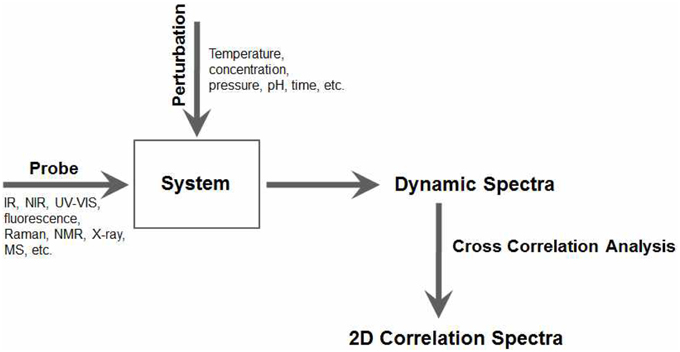
Figure 1. The general scheme for constructing generalized 2D correlation spectra.
The dynamic spectrum Ã(νj, ti) of a system induced by the application of an external perturbation is defined formally within the observation interval between t1 and tm as
where A(vj) is the reference spectrum of the system. The reference spectrum is mostly selected as the stationary or averaged spectrum given by
Synchronous Φ (ν1, ν2) and asynchronous Ψ (ν1, ν2) correlation spectra are given by
where, Nik is the elements of so-called Hilbert–Noda transformation matrix given by
2D Correlation Spectra
The simultaneous or coincidental changes of spectral intensities at ν1 and ν2 are represented in the synchronous 2D correlation spectrum. Positive correlation peaks on the diagonal in synchronous 2D correlation spectrum correspond to the autocorrelation functions of spectral intensity variations, which are called autopeaks. Cross peaks, which are located at off-diagonal in synchronous 2D correlation spectrum, represent the coincidental or simultaneous changes of spectral intensities observed at two different spectral variables. The positive cross peaks depict that the intensities at corresponding spectral variables increase or decrease together. On the other hand, the negative cross peaks depict that one of the spectral intensities is increasing while the other is decreasing.
In contrast, the sequential, or unsynchronized, changes of spectral intensities at ν1 and ν2 are represented in the asynchronous 2D correlation spectrum. Asynchronous 2D correlation spectrum consists of only cross peaks, which shows an antisymmetric cross peaks with respect to the main diagonal. From the sign of cross peaks in 2D correlation spectra, the sequential changes in spectral intensities observed under the external perturbation can be determined. The same signs of synchronous and asynchronous cross peaks represent that the intensity change at ν1 occurs before ν2. While the different signs of synchronous and asynchronous cross peaks represent that the intensity change at ν2 occurs before ν1. This rule to determine sequential order of intensity variations is named Noda's rule.
Application of 2DCOS in Polymer Studies
2DCOS, which can provide the easier access to the pertinent information in characterizing polymers, has been broadly applied to polymer studies to obtain new insights at the molecular level into the understanding behavior of polymers under an influence of an external perturbation. Various polymer systems, such as block copolymers (Kim et al., 2006b; Jia et al., 2010; Jin et al., 2011), biodegradable polymers (Guo et al., 2011; Unger et al., 2011; Ando et al., 2012; Hoshina et al., 2012, 2014; Wang et al., 2014), conducting polymer (Hong et al., 2005; Grzeszczuk et al., 2013), liquid crystals (Tang et al., 2010; Cheng et al., 2011), polymer blends (Oh et al., 2009; Unger et al., 2009, 2011; Jelèić et al., 2010; Popescu and Vasile, 2010, 2011; Kuo and Liu, 2011), and polymer nanocomposites (Huang et al., 2009; Huang and Kuo, 2010; Peng et al., 2010; Ando et al., 2012; Qu et al., 2012), etc., are analyzed by 2DCOS. Detailed information of polymers for polymerization (Izawa et al., 2001; Hong et al., 2005; Huang and Kuo, 2010; Qu et al., 2012; Noda, 2014d; Seo et al., 2014), melting behavior (Unger et al., 2009; Peng et al., 2010; Popescu and Vasile, 2010), crystallization (Huang et al., 2009; Zheng et al., 2010; Guo et al., 2011; Unger et al., 2011; Ando et al., 2012; Hoshina et al., 2012, 2014; Chai et al., 2013; Wang et al., 2013, 2014), gelation (Wang and Wu, 2011; Su et al., 2012; Park et al., 2013), photoreaction (Lee et al., 2010, 2012), hydration (Lai and Wu, 2013), sorption/desorption processes (Musto et al., 2011; Lai and Wu, 2013; Galizia et al., 2014), and phase transition/separation (Kim et al., 2006b; Cheng et al., 2011; Kuo and Liu, 2011; Hou et al., 2014), etc., which are undergoing under the influence of applied external perturbation, are obtained by 2DCOS. 2DCOS probes with various analytical techniques, such as IR, near-IR (NIR), Raman, X-ray, UV-Vis, THz, NMR spectroscopies, and even chromatography, have been successfully applied in polymer studies. 2DCOS has been extensively used in the IR study of polymers (Kim et al., 2006b; Huang et al., 2009; Unger et al., 2009, 2011; Del Río et al., 2010; Huang and Kuo, 2010; Jelèić et al., 2010; Jia et al., 2010; Lee et al., 2010, 2012; Peng et al., 2010; Popescu and Vasile, 2010, 2011; Zheng et al., 2010; Cheng et al., 2011; Jin et al., 2011; Kuo and Liu, 2011; Musto et al., 2011; Wang and Wu, 2011; Zhang et al., 2011; Ando et al., 2012; Qu et al., 2012; Su et al., 2012; Wu et al., 2012; Chai et al., 2013; Lai and Wu, 2013; Park et al., 2013; Shinzawa et al., 2013; Wang et al., 2013, 2014; Galizia et al., 2014; Hou et al., 2014; Noda, 2014c; Seo et al., 2014). Among the applications of 2DCOS in polymer study, temperature is the most used as an applied external perturbation (Kim et al., 2006b; Unger et al., 2009, 2011; Jia et al., 2010; Peng et al., 2010; Popescu and Vasile, 2010; Tang et al., 2010; Zheng et al., 2010; Cheng et al., 2011; Wang and Wu, 2011; Su et al., 2012; Wang et al., 2013, 2014; Hoshina et al., 2014; Hou et al., 2014; Seo et al., 2014).
Here, several illustrative examples are presented to demonstrate the utility of 2DCOS in polymer studies. Special techniques in 2DCOS, such as hetero-spectral correlation, positive null-space projection, and 2DOCS combined with chemometric methods are discussed.
2D IR Correlation Spectroscopy
In the field of polymer study through 2DCOS, IR spectroscopy is the most commonly used analytical probes. The advantages of 2DCOS, such as the enhanced spectral resolution and determination of sequential changes of spectral band intensities, can provide the useful information in characterizing structural changes of polymer obtained as a function of a perturbation, which is not readily observed in the conventional spectroscopy (Kim et al., 2006b; Huang et al., 2009; Unger et al., 2009, 2011; Del Río et al., 2010; Huang and Kuo, 2010; Jelèić et al., 2010; Jia et al., 2010; Lee et al., 2010, 2012; Peng et al., 2010; Popescu and Vasile, 2010, 2011; Zheng et al., 2010; Cheng et al., 2011; Jin et al., 2011; Kuo and Liu, 2011; Wang and Wu, 2011; Zhang et al., 2011; Ando et al., 2012; Qu et al., 2012; Su et al., 2012; Wu et al., 2012; Chai et al., 2013; Lai and Wu, 2013; Park et al., 2013; Shinzawa et al., 2013; Wang et al., 2013, 2014; Hou et al., 2014; Noda, 2014c; Seo et al., 2014).
Popular perturbations in polymer studies are temperature (Kim et al., 2006b; Unger et al., 2009, 2011; Jia et al., 2010; Peng et al., 2010; Popescu and Vasile, 2010; Tang et al., 2010; Zheng et al., 2010; Cheng et al., 2011; Wang and Wu, 2011; Su et al., 2012; Wang et al., 2013, 2014; Hoshina et al., 2014; Hou et al., 2014; Seo et al., 2014), concentration (Huang et al., 2009; Jelèić et al., 2010; Kuo and Liu, 2011; Popescu and Vasile, 2011; Wu et al., 2012; Grzeszczuk et al., 2013), time (Huang and Kuo, 2010; Jin et al., 2011; Ando et al., 2012; Lee et al., 2012; Qu et al., 2012; Su et al., 2012; Lai and Wu, 2013; Park et al., 2013; Noda, 2014c), and pressure (Zhang et al., 2011; Shinzawa et al., 2013), etc. Especially, temperature is the most commonly used because ordinary changes in density, which give rise to nonspecific spectral changes, usually are accompanied by structural changes in polymer upon heating or cooling.
Choi et al. demonstrated the details of thermal behavior of spin-coated films of biodegradable poly(3-hydroxybutyrate-co-3-hydroxyhexanoate) or P(HB-co-HHx) (HHx = 12.0, 10.0, 3.8 mol%) copolymers by using 2DCOS (Choi et al., 2010). The temperature-dependent infrared-reflection absorption (IRRAS) spectra of a spin-coated film of P(HB-co-HHx) (HHx = 12.0 mol%) copolymer, which were measured during the heating process, are shown in Figure 2. Two distinct C=O stretching bands, a crystalline band and an amorphous band are observed respectively at 1726 cm−1 and near 1751 cm−1. The 2D correlation spectra for the C=O stretching bands are shown in Figure 3. Two main bands are observed at 1726 and 1751 cm−1 assigned to the crystalline band and the amorphous band, respectively, in the synchronous 2D correlation spectrum. Interestingly the crystalline band at 1726 cm−1 observed in synchronous 2D correlation spectrum is clearly resolved into two bands at 1721 and 1730 cm−1 in the asynchronous 2D correlation spectrum, which is hardly detectable in the original IRRAS spectra shown in Figure 2. A band observed at a lower wavenumber corresponds to the well-ordered primary crystals and the other at a higher wavenumber corresponds to less ordered secondary crystals. From the analysis of the sign of cross peaks in 2D correlation spectra, they determined the sequential order of spectral changes with increasing temperature that the intensity of an amorphous band changes first and then that for less ordered secondary crystals changes before that for well-ordered secondary crystals.
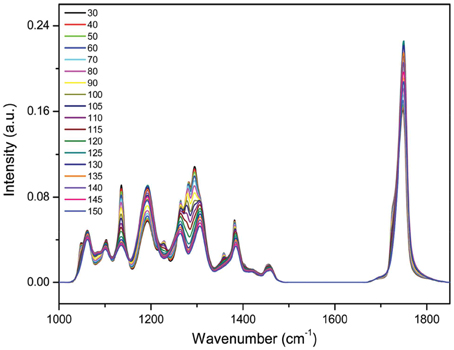
Figure 2. IRRAS spectra of a spin-coated film of P(HB-co-HHx) (HHx = 12.0 mol%) during heating from 30 to 150°C at an interval of 5°C. (Reproduced with permission J. Phys. Chem. B 2010, 14, 10979–10985, Copyright 2010, American Chemical Society).
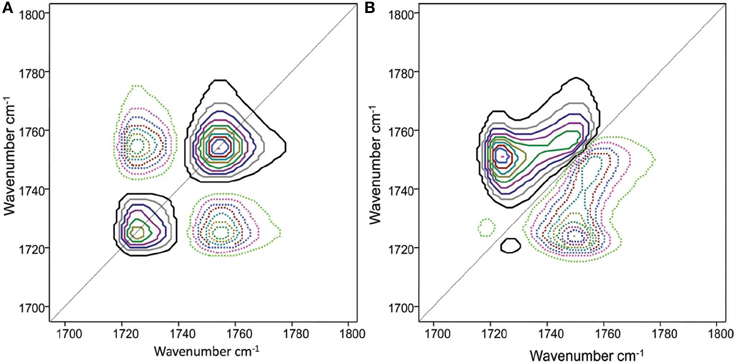
Figure 3. Synchronous (A) and asynchronous (B) 2D correlation spectra obtained from the temperature-dependent IRRAS spectra of a spin-coated film of P(HB-co-HHx) (HHx = 12.0 mol%). The solid and dashed lines represent positive and negative cross peaks, respectively. (Reproduced with permission J. Phys. Chem. B 2010, 14, 10979–10985, Copyright 2010, American Chemical Society).
The application of 2DCOS in the analysis of transport phenomena in polymers (Musto et al., 2011; Lai and Wu, 2013; Galizia et al., 2014) can provide useful insights about the distribution of penetrant in polymer matrix, which is of great practical relevance in several applications, such as membrane science, drug delivery, and polymer durability. Musto et al. applied 2D IR correlation spectroscopy for the investigation of the diffusion process and the sorption equilibrium of water vapor in polyimide films (Musto et al., 2011). The molecular level characterization of the mass-transport process and the sorption thermodynamics were detected. They also investigated the diffusion mechanism in biocompatible thermoplastic polymer, poly-e-caprolactone (PCL), by using 2D IR correlation spectroscopy, and the sorption-desorption cycle for a molecular level characterization of the H2O/PCL system and molecular interaction formed (H-bonding) were detected (Galizia et al., 2014). Lai and Wu reported the water sorption and desorption processes with a pharmaceutical amphiphilic copolymer poly(3-(2-methoxyethyl)-N-vinyl-2-pyrrolidone) investigated by using 2D IR correlation spectroscopy (Lai and Wu, 2013). Different states of hydrogen-bonded water molecules were also detected in 2D IR correlation spectra.
Park et al. reported the mechanism of chemical gelation process of poly(N-isopropylacrylamide) (PNiPAAm) hydrogel by using in situ observations with time-resolved FTIR and 2DCOS at two characteristic preparation temperatures below and above the lower critical solution temperature (LCST) of PNiPAAm aqueous solution (Park et al., 2013). Figures 4A,B show the FTIR spectra in the 1800-1050 cm−1 region for the NiPAAm gelation process measured at Tp = 22 and 38°C, respectively. The spectral changes during the NiPAAm gelation process at the two different temperatures were qualitatively similar except for the differences associated with the time required for completing the gelation reaction (~30 and ~15 min at Tp = 22 and 38°C, respectively). The bands at 1628 (Figure 4A) and 1630 cm−1 (Figure 4B) started to appear at ~20 and ~8 min after the onset of the reaction, respectively. Those bands became increasingly remarkable with time and most prominent at the end of the gelation process, independent of Tps. It identifies the specific time-spans for two stage reaction process: the first-stage giving rise to linear and branched random copolymers of NiPAAm and cross-linker monomers and the second-stage giving rise to cross-linking into macroscopic network structure. 2DCOS was thus applied both the first-stage and second-stage reaction processes to better elucidate the gelation process. The each stage of 2D correlation spectra for the NiPAAm gelation process at 22 and 38°C, respectively, shown in Figures 5, 6 are completely different, although IR spectra obtained below and above LCST are apparently similar. From the analysis of 2D correlation spectra, they firstly identified the specific time span for each stage of the two-stage reaction process at two temperatures. Two different gelation process below and above LCST are summarized in Tables 1, 2.
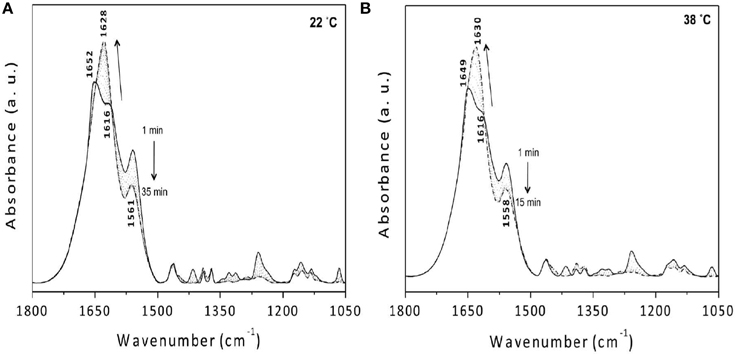
Figure 4. ATR-FTIR spectra of the NiPAAm gelation process measured at 22 (A) and 38°C (B). Spectra are collected at every 1 min. The solid and dashed lines represent, respectively, the spectrum measured at 1 and 35 min (A) and 1 and 15 min (B) after initiation of the gelation reaction. The dotted lines represent the time evolution of the spectra in between the first and last spectra, and the arrows indicate the trend for the band intensity change with the upward arrow and the downward arrow showing the intensity increase and decrease with time, respectively. (Reproduced with permission Macromolecules 2013, 46, 3587–3602, Copyright 2013, American Chemical Society).
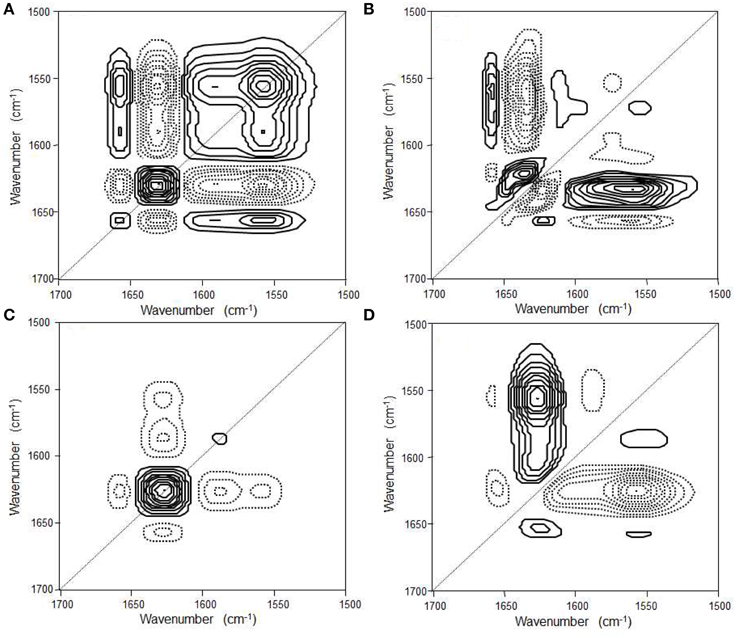
Figure 5. Synchronous (A) and asynchronous (B) 2D correlation spectra in the first-stage reaction process and synchronous (C) and asynchronous (D) 2D correlation spectra in the second-stage reaction process of the NiPAAm gelation process at 22°C. The solid and dashed lines represent positive and negative cross peaks, respectively. (Reproduced with permission Macromolecules 2013, 46, 3587–3602, Copyright 2013, American Chemical Society).
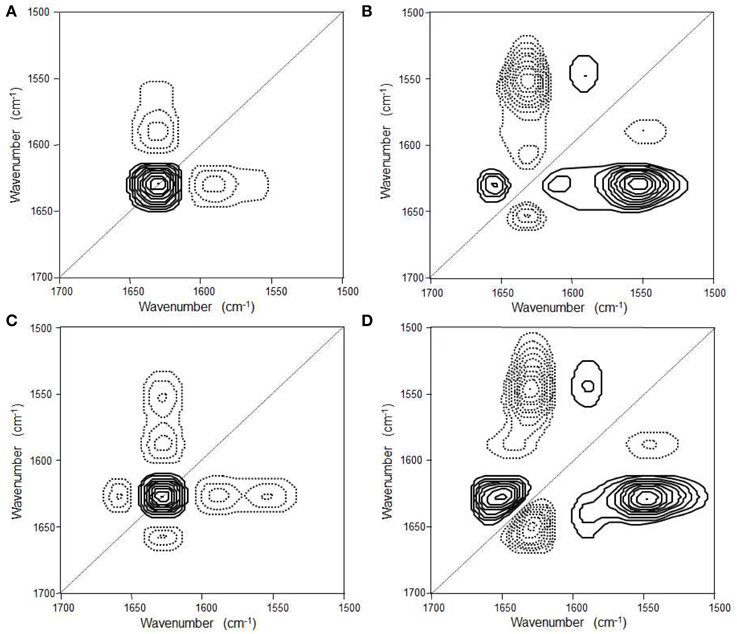
Figure 6. Synchronous (A) and asynchronous (B) 2D correlation spectra in the first-stage reaction process and synchronous (C) and asynchronous (D) 2D correlation spectra in the second-stage reaction process of the NiPAAm gelation process at 38°C. The solid and dashed lines represent positive and negative cross peaks, respectively. (Reproduced with permission Macromolecules 2013, 46, 3587–3602, Copyright 2013, American Chemical Society).
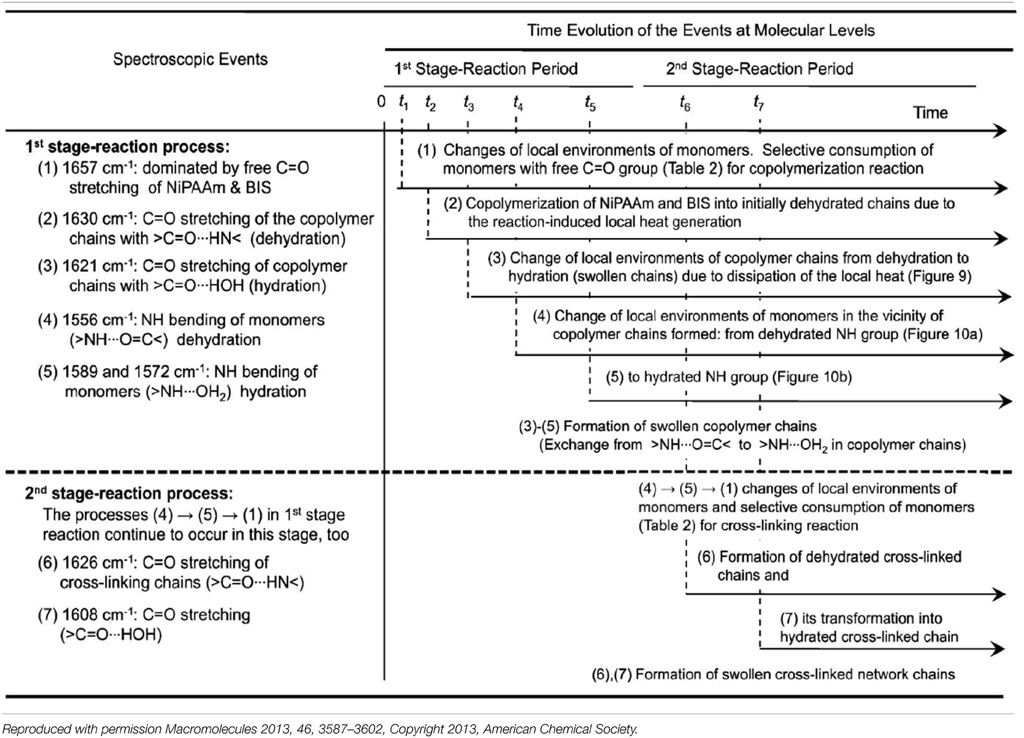
Table 1. Molecular significance of sequence changes of the spectroscopic events with time for two-stage chemical gelation processes below LCST (Tp = 22°C) as observed by the 2D IR correlation spectroscopy.
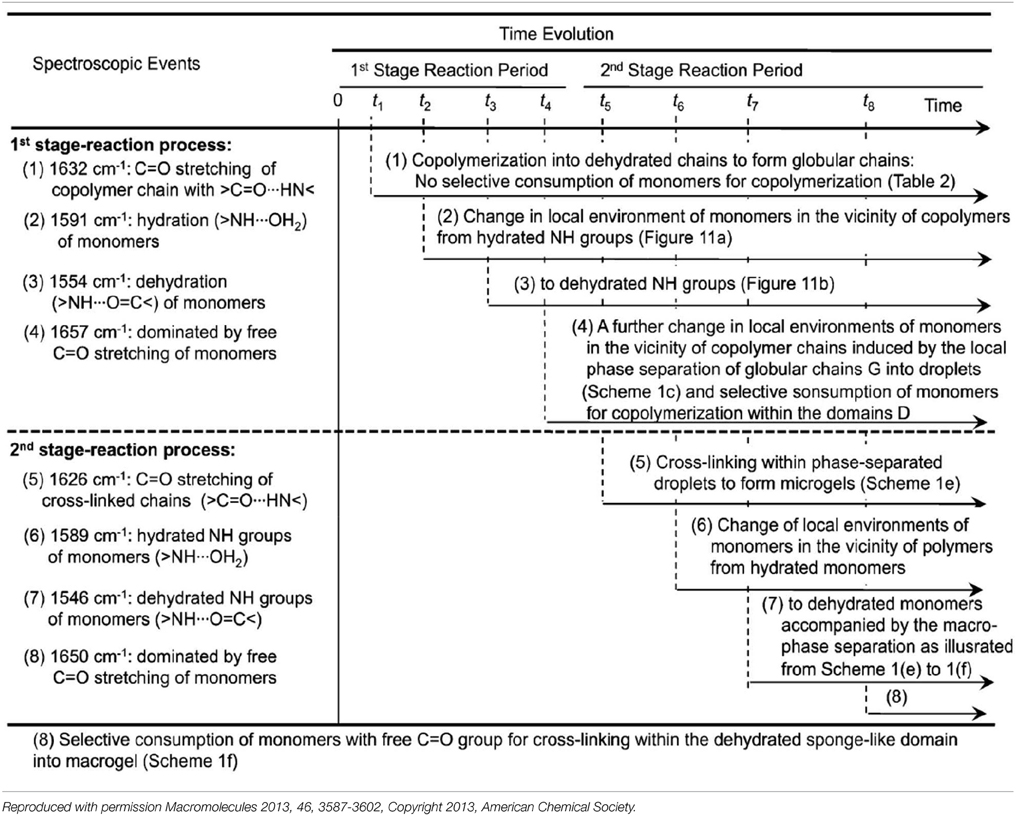
Table 2. Molecular significance of sequence changes of the spectroscopic events with time for two-stage chemical gelation processes below LCST (Tp = 38°C) as observed by the 2D IR correlation spectroscopy.
2D Hetero-Spectral Correlation Analysis
The hetero-correlation analysis provides a very powerful advantage to 2DCOS. Three possible possibilities in 2D hetero-correlation analysis are hetero-spectral correlation (Kim et al., 2006a; Choi et al., 2010; Katayama et al., 2010; Smirnova et al., 2011; Park et al., 2012; Ryu et al., 2012; Shinzawa et al., 2012), hetero-perturbation (or hybrid) correlation (Wu et al., 2002, 2006), and hetero-sample correlation (Czarnik-Matusewicz et al., 2009; Pi et al., 2010). Among them, 2D hetero-spectral correlation is the most active field in applications of 2D hetero-correlation analysis. It can compare two completely different types of spectral data obtained for a system under a similar external perturbation. In the 2D hetero-spectral correlation analysis, the correlation between different spectral signals under the same perturbation can be detected. It is possible to apply 2D hetero-spectral analysis to the correlation not only between closely related spectroscopic measurement, such as IR and Raman spectra, but also between completely different types of spectroscopic or physical techniques, such as IR and X-ray spectroscopy.
Choi et al. used 2D hetero-spectral correlation between completely different types of spectroscopy, such as IR and X-ray photoelectron spectroscopy (XPS), for the investigation of thermal behavior of biodegradable copolymers under increasing temperature (Choi et al., 2010). The 2D hetero-spectral IR/XPS correlation spectra of spin-coated film of P(HB-co-HHx) copolymer during heating process are shown in Figure 7. In synchronous 2D hetero-spectral IR/XPS correlation spectrum, two XPS band at 289.3 eV and near 288.3 eV, which are assigned to amorphous and crystalline components, respectively, are clearly observed. Very interestingly, asynchronous 2D hetero-spectral IR/XPS correlation spectrum reveals the sequential order of the intensity changes that spectral intensity changes detected by the IR probe always occurred earlier than those by XPS. This result provides that the thermal phase transition of P(HB-co-HHx) copolymer actually involves different level of microscopic scales. That is because IR probe detects long range molecular interactions while XPS detects more localized structure changes during the gradual melting process. This probe-dependent asynchronicity, which is spectral changes of IR probe appear first before those of XPS, clearly reflects the subtle difference in the selectivity and specificity of these probes toward molecular scale changes under the same external perturbation. The 2D hetero-spectral IR/XPS correlation analysis sheds light on the correlation between IR and XPS spectral changes, which is difficult to detect from a simple analysis of IR or XPS spectra alone.
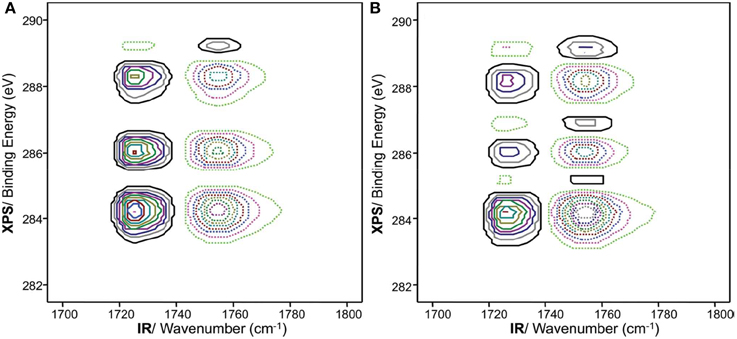
Figure 7. Synchronous (A) and asynchronous (B) hetero-spectral 2D XPS/IR correlation spectrum for a spin-coated film of P(HB-co-HHx) (HHx = 12.0 mol%). The solid and dashed lines represent positive and negative cross peaks, respectively. (Reproduced with permission J. Phys. Chem. B 2010, 14, 10979–10985, Copyright 2010, American Chemical Society).
Projection 2D Correlation Analysis
Noda has proposed a new generation technique of 2DCOS (Noda, 2010). Projection 2D correlation analysis can dramatically simplify highly congested 2D correlation spectra often encountered. This technique is based on the use of mathematical matrix projection to selectively filter out the unwanted portion of the information of spectral data. The combination of the projection and null-space projection operations might be a very useful technique to augment or attenuate select features within congested 2D correlation spectra for easier interpretation. Details of background of projection 2D analysis was previously described (Noda, 2010).
Here we will briefly provide the basic concept of projection 2D correlation spectra which is based on terms of a series of matrix manipulations (Noda, 2010). In generalized 2DCOS, spectral data matrix A (m × m) consisting of m rows of spectra with n columns of spectral variables, like wavenumber, represents the system response. For convenience, each column of the matrix A corresponds to dynamic spectrum Ã(νj, ti) used in Equations (3) and (4) scaled by square root of 1/(m – 1). Generalized 2D correlation spectra can be obtained by a simple matrix multiplication applied toward the spectral data matrix. The synchronous and asynchronous correlation spectra, Φ and Ψ, are then obtained as
As already indicated in Equation (5), N is the so-called Hilbert–Noda transformation matrix.
In projection analysis, an arbitrary m × m matrix Y, which is different from the spectral data matrix A, define the projection matrix RY of Y as
The superscripts T and −1, respectively, stand for the transpose and inverse operation of the matrix.
The spectral data matrix A can be transformed to a new form of data matrix by the projection operation. The projected data matrix AP is obtained by the simple multiplication of RY with A,
The newly obtained projected data matrix AP represents the matrix projection of A onto an abstract mathematical space spanned by the columns of Y. In other words, AP is the closest possible reconstruction of A by using only the linear combinations of all the columns of Y. To make this operation possible, matrices A and Y must have the same number of rows m. It is actually common to select Y from several select columns of A.
The corresponding null-space projection is carried out as
The null-space projected data matrix AN represents the projection of A onto the space spanned by vectors which are orthogonal to the columns of Y. In other words, AN is the residual after the removal of AP from A. Thus, the projection operations separate the original data into two orthogonal parts, A = AP + AN, by using the information contained within the chosen matrix Y.
Data matrices created by various projection-based transformation operations discussed above can be readily converted to 2D correlation spectra. For example, by using Equation (9), it is possible to obtain the 2D correlation spectra for the projected data matrix AP
The term RY appears in Equation (11) only once because this matrix is idempotent. 2D correlation spectra Φp and Ψp for the projected data provide the correlation information among select signals of A, which are in turn correlated with the projector matrix Y. In other words, all other signals not correlated Y will be filtered out prior to the 2D correlation analysis.
Correlation analysis of the null-space projected data, AN = A – AP, results in the following set of 2D spectra.
Kim et al. (2012) reported the dominant crystalline contribution in biodegradable polymer blend with temperature increase was successfully filtered out by using the null-space projection, which can extract other finer details. Figure 8 shows the conventional synchronous 2D correlation spectra of spin-coated film of poly(3-hydroxybutyrate-co-3-hydroxyhexanoate)/polyethylene glycol (P(HB-co-HHx)/PEG) blend. In conventional 2D correlation spectra, all spectral changes are contributed from not PEG but P(HB-co-HHx) in P(HB-co-HHx)/PEG blend during heating process. They performed null-space projection 2D correlation analysis to selectively filter out the contribution of P(HB-co-HHx). As shown in Figure 9, the synchronous null-space projection 2D correlation spectra, which are constructed from the null-space projected data with the crystalline signals of P(HB-co-HHx) removed, are completely different with conventional 2D correlation spectra. The observed new bands at 1313, 1105, and 1065 cm−1 in Figure 9A, which are hardly detected in conventional 2D correlation spectrum, can be assigned to PEG. In Figure 9B, two bands at 2972 and 2875 cm−1, which are not observed in conventional 2D correlation spectrum, can also be assigned to PEG. The subtle contribution of PEG in spin-coated film of P(HB-co-HHx)/PEG blend during heating process is clearly detected in null-space 2D projection correlation spectra.
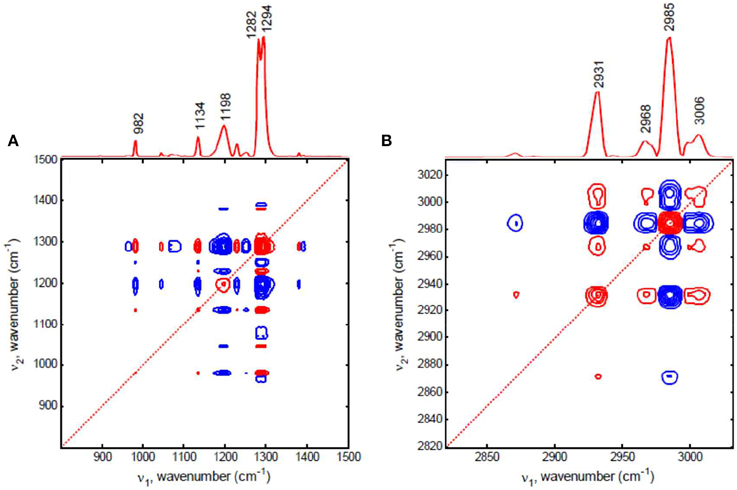
Figure 8. Synchronous conventional 2D correlation spectra in the region of C-H deformation, C-O-C stretching, and C=O stretching modes in 1000–1500 cm−1 (A) and C-H stretching mode in 2800–3050 cm−1 (B) for spin-coated film of P(HB-co-HHx)/PEG blend, respectively. The red and blue lines represent positive and negative cross peaks, respectively. (Reproduced with permission Vib. Spectrosc. 2012, 60, 163–167, Copyright 2012, Elsevier).
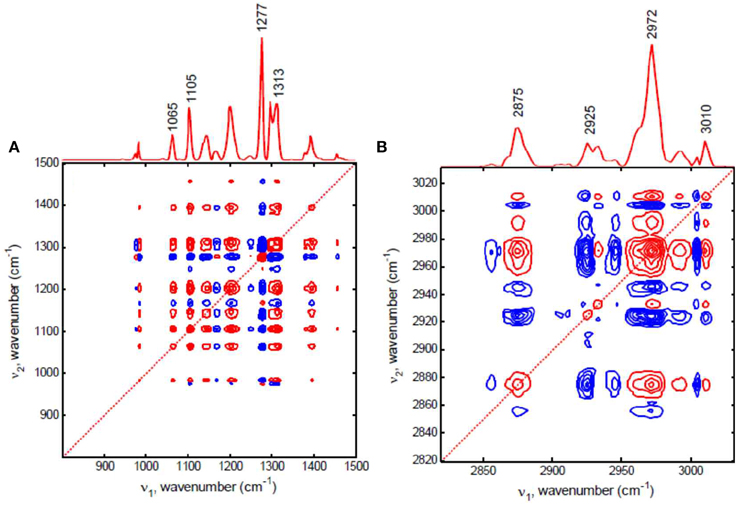
Figure 9. Synchronous null-space projection 2D correlation spectra in the region of C-H deformation, C-O-C stretching, and C=O stretching modes in 1000–1500 cm−1 (A) and C-H stretching mode in 2800–3050 cm−1 (B) for spin-coated film of P(HB-co-HHx)/PEG blend, respectively. The red and blue lines represent positive and negative cross peaks, respectively. (Reproduced with permission Vib. Spectrosc. 2012, 60, 163–167, Copyright 2012, Elsevier).
Combination of 2DCOS and Chemometric Techniques
The fruitful combination of 2DCOS and chemometric techniques often provides more useful information to interpret subtle spectral changes of system, which is barely detected in conventional 2DCOS (Jung, 2004; Jung et al., 2002, 2003a,b,c,d, 2006). Jung et al. introduced the possible combination of 2DCOS and principal component analysis (PCA). In this technique named PCA 2DCOS, PCA is an essential and integral part of the subsequent 2DCOS (Jung, 2004; Jung et al., 2002). Jung et al. also reported a new concept of engenvalue manipulating transformation (EMT) for PCA 2DCOS (Jung et al., 2003b,c,d, 2006).
A brief background of PCA 2DCOS and EMT are provided here. The original set of perturbation-dependent spectral data matrix A is an n × m matrix with n spectra and m wavenumber points. In PCA, the significant part of the data matrix A* can be expressed as the product of score and loading matricies
where W and V are the loading matrix (m × r) and score matrix (n × r), respectively, and E is the residual matrix often related with pure noise. The matrix product A* is the noise-free reconstructed data matrix of the original data A.
In PCA 2DCOS, this reconstructed data matrix A* is used instead of the original data matrix. PCA 2DCOS reconstructed from a few selected significant scores and loading vectors of PCA can accentuate only the most important features of synchronicity and asynchronicity without noise contribution. It is a very powerful technique for eliminating noise contribution from the spectra to extract useful information.
The PCA-reconstructed data matrix A* can be also expressed in the form of singular value decomposition (SVD),
and
where U and S are the orthonormal score matrix and diagonal matrix containing the singular value, respectively.
Here L = W′ W is a diagonal matrix where each diagonal element corresponds to the eigenvalue of principal component. The score matrix W is expressed in the form W = U S and can be obtained directly from W = A V.
By manipulating and replacing eigenvalues of A*, the new transformed data matrix A** can be obtained
where S** is given by varying the corresponding eigenvalues in S by raising them to the power of m.
The new EMT-reconstructed data matrix A** is used instead of A* to enhance 2D correlation spectra. The smaller eigenvalues becomes more prominent, by uniformly lowering the power of a set of eigenvalues associated with the original data. In this technique, the contributions of minor components but potentially important factors is amplified.
Jung et al. demonstrated that PCA 2DCOS through EMT technique was performed to more clearly understand the phase behavior of polystyrene-block-poly(n-pentyl methacrylate) (PS-PnPMA) (Jung et al., 2006). PS-PnPMA is a very interesting closed-loop block copolymer, which has a lower disorder-to-order transition (LDOT) temperature and an upper order-to-disorder transition (UODT) temperature. The temperature-dependent IR spectra of PS-PnPMA measured during heating from 100–260°C are shown in Figure 10. In the conventional 2D IR correlation spectra shown in Figure 11, the ordered state is completely different with two disordered states and these two disordered states at lower and higher temperatures are also different (Kim et al., 2006b). To highlight subtle differences of the two disordered states of PS-PnPMA, they applied PCA 2DCOS through EMT method to the temperature-dependent IR spectra. In PCA analysis, the original spectral data set shown in Figure 10 was decomposed into the scores and loading vectors. Synchronous PCA 2D correlation spectra generated from the reconstructed data matrix A* with the three principal components are like the conventional 2D correlation spectra but without noise contribution. Figures 12A–C shows synchronous PCA 2D correlation spectra generated from the EMT-reconstructed spectral data matrix A** obtained by replacing the original eigenvalues with m = 1/2 for disordered state at lower temperature, ordered state, and disordered state at higher temperature, respectively. By lowering the power of a set of eigenvalues associated with the original data, hidden property of phase transition from the contribution of minor but potentially interesting is much more greatly accentuated than conventional 2D correlation spectra. As shown in Figure 12, synchronous spectrum generated from the EMT-reconstructed spectral data matrix of the ordered state is completely different from those in the two disordered states and the clear difference between two disordered states is also observed. In the power spectrum, extracted along the diagonal line of the synchronous 2D correlation spectrum, in the top of Figures 12A,C, intensities of bands from C-C-O stretching, C-H deformation, and C=O stretching of PnPMA change greatly at lower temperature while those from phenyl group in PS change greatly at higher temperature. The distinct difference in two disordered states in the cross correlations of the bands from phenyl group in PS with that from C-C-O group in PnPMA reveals that the conformation of PS-PnPMA and the weak interaction between phenyl group of PS and the side chain of PnPMA in the two disordered states are different. The EMT technique clearly distinguish the very subtle differences of spectra which are not observed in conventional 2D correlation spectra.
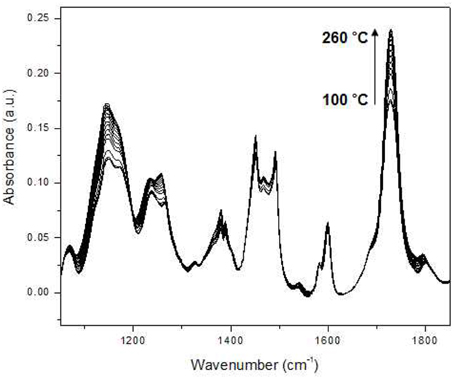
Figure 10. Temperature-dependent IR spectra of polystyrene-block-poly(n-pentyl methacrylate) (PS-PnPMA) measured during heating from 100 to 260°C at an interval of 5°C. (Reproduced with permission J. Mol. Struct. 2006, 799, 96–101, Copyright 2006, with permission from Elsevier).
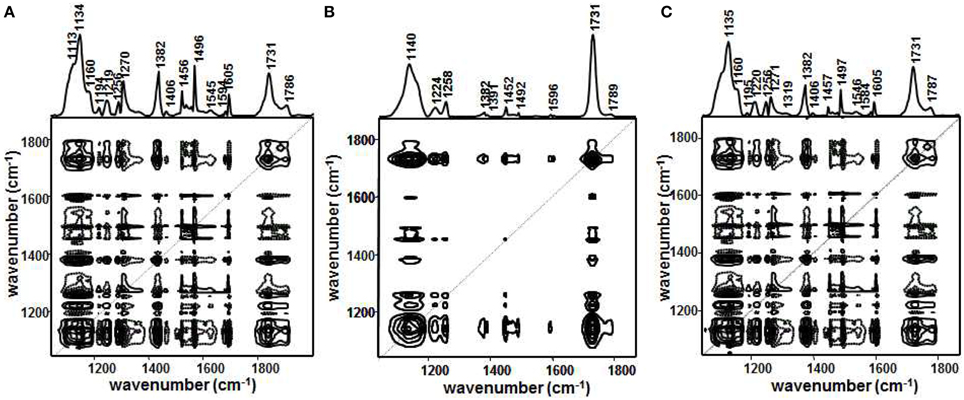
Figure 11. Conventional synchronous 2D correlation spectra obtained from the raw spectra in Figure 10 for disordered state in lower temperature (A), ordered state (B), and disordered state in higher temperature (C), respectively. Solid and dashed lines represent positive and negative cross peaks, respectively. (Reproduced with permission Macromolecules 2006, 39, 408–412, Copyright 2006, American Chemical Society).
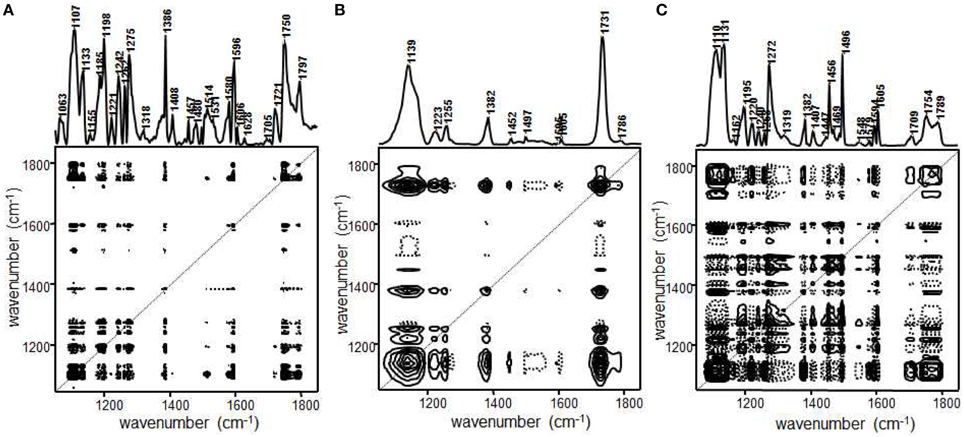
Figure 12. Synchronous PCA 2D correlation spectra obtained from the EMT reconstructed data with m = 1/2 for disordered state in lower temperature (A), ordered state (B), and disordered state in higher temperature (C), respectively. Solid and dashed lines represent positive and negative cross peaks, respectively. (Reproduced with permission J. Mol. Struct. 2006, 799, 96–101, Copyright 2006, with permission from Elsevier).
Jung et al. also demonstrated the use of 2DCOS in conjunction with alternating least squares (ALS) based self-modeling curve resolution (SMCR) analysis of spectral data sets (Jung et al., 2003a). In this iterative regression technique, asynchronous 2D correlation peaks for the identification of pure variables were used as the initial estimates in the ALS process. Choosing the most distinct bands via the positions of asynchronous 2D peaks is a viable starting point for ALS iteration (Jung et al., 2003a; Hong et al., 2005). Once the pure variables are selected, ALS regression can be used to obtain the concentration profiles and pure component spectra.
Hong et al. studied the electrochemical polymerization of aniline by using real-time spectroelectrochemical experiments conducted concurrently with potentiodynamic scans (Hong et al., 2005). They performed 2DCOS and subsequent extraction of pure component spectra as well as their relative concentration profiles from complex spectroelectrochemical data employing the ALS-based SMCR method. All of the spectra of intermediate species proposed in the literature are identified. The concentrations of intermediate species varying as a function of the scanned potential are also determined. It was the first complete analysis of the complex spectra of aniline oxidation, which provides full understanding of the aniline polymerization reaction.
Summary
2DCOS has become a very popular tool in the field of polymer study. It can be utilized with a number of spectroscopic and other analytical probes for a very broad range of polymer systems by employing different types of external perturbations to induce spectral variations. This review covers the basic concept of generalized 2DCOS and noteworthy progress in 2DCOS and their applications in polymer study. New developments in 2DCOS provide a powerful analytical technique applicable to the in-depth analysis of various spectral data. Active and steady progress in 2DCOS would open a way for studying polymers in many applications.
Conflict of Interest Statement
The authors declare that the research was conducted in the absence of any commercial or financial relationships that could be construed as a potential conflict of interest.
Acknowledgments
This work was supported by Kangwon National University.
References
Ando, Y., Sato, H., Shinzawa, H., Okamoto, M., Noda, I., and Ozaki, Y. (2012). Isothermal melt crystallization behavior of neat poly(l-lactide) (PLLA) and PLLA/organically modified layered silicate (OMLS) nanocomposite studied by two-dimensional (2D) correlation spectroscopy. Vibrat. Spec. 60, 158–162. doi: 10.1016/j.vibspec.2012.01.021
Brewster, V. L., Ashton, L., and Goodacre, R. (2013). Monitoring guanidinium-induced structural changes in ribonuclease proteins using raman spectroscopy and 2D correlation analysis. Anal. Chem. 85, 3570–3575. doi: 10.1021/ac303265q
PubMed Abstract | Full Text | CrossRef Full Text | Google Scholar
Cerdà-Costa, N., De La Arada, I., Avilés, F. X., Arrondo, J. L. R., and Villegas, S. (2009). Influence of aggregation propensity and stability on amyloid fibril formation as studied by fourier transform infrared spectroscopy and two-dimensional COS analysis. Biochemistry 48, 10582–10590. doi: 10.1021/bi900960s
PubMed Abstract | Full Text | CrossRef Full Text | Google Scholar
Chai, F., Chen, Y., You, Z., Xia, Z., Ge, S., Sun, Y., et al. (2013). Two Keggin-type heteropolytungstates with transition metal as a central atom: crystal structure and magnetic study with 2D-IR correlation spectroscopy. J. Solid State Chem. 202, 161–167. doi: 10.1016/j.jssc.2013.03.051
Cheng, Y.-H., Chen, W.-P., Shen, Z., Fan, X.-H., Zhu, M.-F., and Zhou, Q.-F. (2011). Influences of hydrogen bonding and peripheral chain length on mesophase structures of mesogen-jacketed liquid crystalline polymers with amide side-chain linkages. Macromolecules 44, 1429–1437. doi: 10.1021/ma102444t
Choi, H. C., Ryu, S. R., Ji, H., Kim, S. B., Noda, I., and Jung, Y. M. (2010). Two-dimensional heterospectral correlation analysis of X-ray photoelectron spectra and infrared spectra for spin-coated films of biodegradable Poly(3-hydroxybutyrate-co-3-hydroxyhexanoate) copolymers. J. Phys. Chem. B 114, 10979–10985. doi: 10.1021/jp103288x
PubMed Abstract | Full Text | CrossRef Full Text | Google Scholar
Czarnik-Matusewicz, B., and Jung, Y. M. (2014). “Two-Dimensional Mid-Infrared Correlation Spectroscopy in Protein Research,” in Optical Spectroscopy and Computational Methods in Biology and Medicine, ed M. Baranska (Berlin: Springer), 213–250.
Czarnik-Matusewicz, B., Kim, S. B., and Jung, Y. M. (2009). A study of urea-dependent denaturation of β-lactoglobulin by principal component analysis and two-dimensional correlation spectroscopy. J. Phys. Chem. B 113, 559–566. doi: 10.1021/jp808396g
PubMed Abstract | Full Text | CrossRef Full Text | Google Scholar
Del Río, V., Spegazzini, N., Callao, M., and Larrechi, M. (2010). Spectroscopic and quantitative chemometric analysis of the epoxidised oil/amine system. J. Near Infrared Spec. 18, 281–290. doi: 10.1255/jnirs.880
Galizia, M., La Manna, P., Mensitieri, G., Pannico, M., and Musto, P. (2014). Diffusion in polymers as investigated by two-dimensional correlation spectroscopy: the H2O/PCL system. J. Mol. Struct. 1069, 290–298. doi: 10.1016/j.molstruc.2014.02.045
Grzeszczuk, M., Grañska, A., and Szostak, R. (2013). Raman spectroelectrochemistry of polyaniline synthesized using different electrolytic regimes -multivariate analysis. Int. J. Electrochem. Sci. 8, 8951–8965.
Guo, L., Spegazzini, N., Sato, H., Hashimoto, T., Masunaga, H., Sasaki, S., et al. (2011). Multistep crystallization process involving sequential formations of density fluctuations, “intermediate structures,” and lamellar crystallites: poly(3-hydroxybutyrate) as investigated by time-resolved synchrotron SAXS and WAXD. Macromolecules 45, 313–328. doi: 10.1021/ma201475t
Hong, S.-Y., Jung, Y. M., Kim, S. B., and Park, S.-M. (2005). Electrochemistry of conductive polymers. 34. two-dimensional correlation analysis of real-time spectroelectrochemical data for aniline polymerization. J. Phys. Chem. B 109, 3844–3850. doi: 10.1021/jp046218f
PubMed Abstract | Full Text | CrossRef Full Text | Google Scholar
Hoshina, H., Ishii, S., Morisawa, Y., Sato, H., Noda, I., Ozaki, Y., et al. (2012). Isothermal crystallization of poly(3-hydroxybutyrate) studied by terahertz two-dimensional correlation spectroscopy. Appl. Phys. Lett. 100, 011907(011901–011903). doi: 10.1063/1.3673847
Hoshina, H., Ishii, S., and Otani, C. (2014). Separation of overlapping vibrational peaks in terahertz spectra using two-dimensional correlation spectroscopy. J. Mol. Struct. 1069, 152–156. doi: 10.1016/j.molstruc.2014.02.058
Hou, L., Ma, K., An, Z., and Wu, P. (2014). Exploring the volume phase transition behavior of POEGA- and PNIPAM-based core–shell nanogels from infrared-spectral insights. Macromolecules 47, 1144–1154. doi: 10.1021/ma4021906
Huang, K.-W., and Kuo, S.-W. (2010). High-performance polybenzoxazine nanocomposites containing multifunctional POSS cores presenting vinyl-terminated benzoxazine groups. Macromol. Chem. Phys. 211, 2301–2311. doi: 10.1002/macp.201000362
Huang, K.-W., Tsai, L.-W., and Kuo, S.-W. (2009). Influence of octakis-functionalized polyhedral oligomeric silsesquioxanes on the physical properties of their polymer nanocomposites. Polymer 50, 4876–4887. doi: 10.1016/j.polymer.2009.08.026
Hur, J., Jung, K.-Y., and Jung, Y. M. (2011). Characterization of spectral responses of humic substances upon UV irradiation using two-dimensional correlation spectroscopy. Water Res. 45, 2965–2974. doi: 10.1016/j.watres.2011.03.013
PubMed Abstract | Full Text | CrossRef Full Text | Google Scholar
Izawa, K., Ogasawara, T., Masuda, H., Okabayashi, H., and Noda, I. (2001). Two-dimensional correlation gel permeation chromatography study of octyltriethoxysilane sol-gel polymerization process. Macromolecules 35, 92–96. doi: 10.1021/ma010760+
Jelèić, Ž., Vranješ, N., and Rek, V. (2010). Long-range processing correlation and morphological fractality of compatibilized blends of PS/ HDPE/ SEBS block copolymer. Macromol. Symp. 290, 1–14. doi: 10.1002/masy.201050401
Ji, W., Spegazzini, N., Kitahama, Y., Chen, Y., Zhao, B., and Ozaki, Y. (2012). pH-response mechanism of p-aminobenzenethiol on ag nanoparticles revealed by two-dimensional correlation surface-enhanced raman scattering spectroscopy. J. Phys. Chem. Lett. 3, 3204–3209. doi: 10.1021/jz301428e
Jia, L., Guo, C., Yang, L., Xiang, J., Tang, Y., Liu, C., et al. (2010). Mechanism of PEO–PPO–PEO micellization in aqueous solutions studied by two-dimensional correlation FTIR spectroscopy. J. Colloid Interface Sci. 345, 332–337. doi: 10.1016/j.jcis.2010.01.060
PubMed Abstract | Full Text | CrossRef Full Text | Google Scholar
Jiang, Y., and Wu, P. (2008). Fabrication and elimination of PTAA/P4VP layer-by-layer films. Appl. Spec. 62, 207–212. doi: 10.1366/000370208783575555
PubMed Abstract | Full Text | CrossRef Full Text | Google Scholar
Jin, Y., Wang, W., and Su, Z. (2011). Spectroscopic study on water diffusion in poly(l-lactide)-poly(ethylene glycol) diblock copolymer film. Macromolecules 44, 2132–2139. doi: 10.1021/ma200062t
Jung, Y. M. (2004). Principal component analysis based two-dimensional correlation spectroscopy for noise filtering effect. Vib. Spec. 36, 267–270. doi: 10.1016/j.vibspec.2003.11.019
Jung, Y. M., Kim, H. J., Ryu, D. Y., Kim, S. B., and Kim, J. K. (2006). Application of principal component analysis-based two-dimensional correlation spectroscopy to characterization of order–disorder transition of polystyrene-block-poly(n-pentyl methacrylate) copolymer. J. Mol. Struct. 799, 96–101. doi: 10.1016/j.molstruc.2006.03.021
Jung, Y. M., Kim, S. B., and Noda, I. (2003a). Application of two-dimensional correlation spectroscopy to chemometrics: self-modeling curve resolution analysis of spectral data sets. Appl. Spec. 57, 1376–1380. doi: 10.1366/000370203322554536
PubMed Abstract | Full Text | CrossRef Full Text | Google Scholar
Jung, Y. M., Kim, S. B., and Noda, I. (2003b). New approach to generalized two-dimensional correlation spectroscopy. II: eigenvalue manipulation transformation (EMT) for noise suppression. Appl. Spec. 57, 557–563. doi: 10.1366/000370203321666597
PubMed Abstract | Full Text | CrossRef Full Text | Google Scholar
Jung, Y. M., Kim, S. B., and Noda, I. (2003c). New approach to generalized two-dimensional correlation spectroscopy. III: eigenvalue manipulation transformation (EMT) for spectral selectivity enhancement. Appl. Spec. 57, 564–570. doi: 10.1366/000370203321666605
PubMed Abstract | Full Text | CrossRef Full Text | Google Scholar
Jung, Y. M., Kim, S. B., and Noda, I. (2003d). New approach to generalized two-dimensional correlation spectroscopy. IV: eigenvalue manipulation transformation (EMT) for partial attenuation of dominant factors. Appl. Spec. 57, 850–857. doi: 10.1366/000370203322102951
PubMed Abstract | Full Text | CrossRef Full Text | Google Scholar
Jung, Y. M., and Noda, I. (2014). “Two-dimensional correlation spectroscopy: new developments and applications,” in Encyclopedia of Analytical Chemistry, ed R. A. Meyers (John Wiley & Sons, Ltd), 1–22.
Jung, Y. M., Shin, H. S., Kim, S. B., and Noda, I. (2002). New approach to generalized two-dimensional correlation spectroscopy. 1: combination of principal component analysis and two-dimensional correlation spectroscopy. Appl. Spec. 56, 1562–1567. doi: 10.1366/000370202321116020
Katayama, N., Kondo, M., and Miyazawa, M. (2010). Study on molecular structure and hydration mechanism of Domyoji-ko starch by IR and NIR hetero 2D analysis. J. Mol. Struct. 974, 179–182. doi: 10.1016/j.molstruc.2010.02.074
Kim, H. J., Kim, S. B., Kim, J. K., and Jung, Y. M. (2006a). Two-dimensional heterospectral correlation analysis of wide-angle X-ray scattering and infrared spectroscopy for specific chemical interactions in weakly interacting block copolymers. J. Phys. Chem. B 110, 23123–23129. doi: 10.1021/jp0638282
PubMed Abstract | Full Text | CrossRef Full Text | Google Scholar
Kim, H. J., Kim, S. B., Kim, J. K., Jung, Y. M., Ryu, D. Y., Lavery, K. A., et al. (2006b). Phase behavior of a weakly interacting block copolymer by temperature-dependent FTIR spectroscopy. Macromolecules 39, 408–412. doi: 10.1021/ma052259d
Kim, M. K., Ryu, S. R., Noda, I., and Jung, Y. M. (2012). Projection 2D correlation analysis of spin-coated film of biodegradable P(HB-co-HHx)/PEG blend. Vib. Spec. 60, 163–167. doi: 10.1016/j.vibspec.2012.02.008
Kuo, S.-W., and Liu, W.-C. (2011). Miscibility enhancement through hydrogen bonding interaction of biodegradable poly(3-hydroxybutyrate) blending with poly(styrene-co-vinyl phenol) copolymer. J. Appl. Polymer Sci. 119, 300–310. doi: 10.1002/app.32528
Lai, H., and Wu, P. (2013). Hydration capabilities and structures of carbonyl and ether groups in poly(3-(2-methoxyethyl)-N-vinyl-2-pyrrolidone) film. Polym. Chem. 4, 3323–3332. doi: 10.1039/c3py00239j
Lee, C. O., Chae, B., Kim, S. B., Jung, Y. M., and Lee, S. W. (2012). Two-dimensional correlation analysis study of the photo-degradation of poly(ethylene terephthalate) film. Vib. Spec. 60, 142–145. doi: 10.1016/j.vibspec.2011.10.013
Lee, S. H., Chae, B., Kim, H.-C., Kim, S. B., Jung, Y. M., and Lee, S. W. (2010). Photoreaction and molecular reorientation studies of ultra-violet light irradiated azobenzene containing polymer films using two-dimensional correlation infrared spectroscopy. J. Mol. Struct. 974, 35–39. doi: 10.1016/j.molstruc.2009.10.008
Li, X., Shen, Q., Zhang, D., Mei, X., Ran, W., Xu, Y., et al. (2013). Functional groups determine biochar properties (pH and EC) as Studied by two-dimensional C NMR correlation spectroscopy. PLoS ONE 8:e65949. doi: 10.1371/journal.pone.0065949
PubMed Abstract | Full Text | CrossRef Full Text | Google Scholar
Ma, L., Ahmed, Z., and Asher, S. A. (2011). Ultraviolet resonance raman study of side chain electrostatic control of poly-l-lysine conformation. J. Phys. Chem. B 115, 4251–4258. doi: 10.1021/jp2005343
PubMed Abstract | Full Text | CrossRef Full Text | Google Scholar
Musto, P., Mensitieri, G., Lavorgna, M., Scarinzi, G., and Scherillo, G. (2011). Combining gravimetric and vibrational spectroscopy measurements to quantify first- and second-shell hydration layers in polyimides with different molecular architectures. J. Phys. Chem. B 116, 1209–1220. doi: 10.1021/jp2056943
Noda, I. (1986). Two-dimensional infrared (2D IR) spectroscopy of synthetic and biopolymers. Bull. Am. Phys. Soc. 31:520.
Noda, I. (1993). Generalized two-dimensional correlation method applicable to infrared, raman, and other types of spectroscopy. Appl. Spec. 47, 1329–1336. doi: 10.1366/0003702934067694
Noda, I. (2000). Progress in 2D correlation spectroscopy. AIP Conf. Proc. 503, 3–17. doi: 10.1063/1.1302843
Noda, I. (2002). “General theory of two-dimensional (2D) analysis,” in Handbook of Vibrational Spectroscopy, eds J. M. Chalmers, and P. R. Griffiths (Chichester: John Wiley & Sons, Ltd), 2123–2134.
Noda, I. (2004). Advances in two-dimensional correlation spectroscopy. Vib. Spec. 36, 143–165. doi: 10.1016/j.vibspec.2003.12.016
Noda, I. (2006). Progress in two-dimensional (2D) correlation spectroscopy. J. Mol. Struct. 799, 2–15. doi: 10.1016/j.molstruc.2006.03.053
Noda, I. (2007). Two-dimensional correlation analysis useful for spectroscopy, chromatography, and other analytical measurements. Anal. Sci. 23, 139–146. doi: 10.2116/analsci.23.139
PubMed Abstract | Full Text | CrossRef Full Text | Google Scholar
Noda, I. (2008). Recent advancement in the field of two-dimensional correlation spectroscopy. J. Mol. Struct. 883–884, 2–26. doi: 10.1016/j.molstruc.2007.11.038
Noda, I. (2009). “Chapter 13 - generalized two-dimensional correlation spectroscopy,” in Frontiers of Molecular Spectroscopy, ed J. Laane (Amsterdam: Elsevier), 367–381.
Noda, I. (2010). Projection two-dimensional correlation analysis. J. Mol. Struct. 974, 116–126. doi: 10.1016/j.molstruc.2009.11.047
Noda, I. (2014a). Frontiers of two-dimensional correlation spectroscopy. part 1. New concepts and noteworthy developments. J. Mol. Struct. 1069, 3–22. doi: 10.1016/j.molstruc.2014.01.025
Noda, I. (2014b). Frontiers of two-dimensional correlation spectroscopy. Part 2. Perturbation methods, fields of applications, and types of analytical probes. J. Mol. Struct. 1069, 23–49. doi: 10.1016/j.molstruc.2014.01.016
Noda, I. (2014c). Two-dimensional correlation spectroscopy study of polystyrene. Macromol. Symp. 339, 17–23. doi: 10.1002/masy.201300129
Noda, I. (2014d). Vibrational spectroscopy in the development of surface hydrophilic elastomer latex (SHEL). Vib. Spec. 71, 70–75. doi: 10.1016/j.vibspec.2014.01.009
Noda, I., Dowrey, A. E., Marcoli, C., Story, G. M., and Ozaki, Y. (2000). Generalized two-dimensional correlation spectroscopy. Appl. Spec. 54, 236A–248A. doi: 10.1366/0003702001950454
Noda, I., Dowrey, A. E., and Marcott, C. (1993). Recent developments in two-dimensional infrared (2D IR) correlation spectroscopy. Appl. Spec. 47, 1317–1323. doi: 10.1366/0003702934067513
Noda, I., and Lindsey, S. B. (2010). “Plastics from Bacteria: natural functions and applications,” in Microbiology Monographs, ed G. G.-Q. Chen (Berlin: Springer), 237–256.
Noda, I., and Ozaki, Y. (2004). Two-Dimensional Correlation Spectroscopy: Applications in Vibrational and Optical Spectroscopy. Chichester: John Wiley & Sons Ltd. doi: 10.1002/0470012404
Oh, T.-J., Nam, J.-H., and Jung, Y. M. (2009). Molecular miscible blend of poly(2-cyano-1,4-phenyleneterephthalamide) and polyvinylpyrrolidone characterized by two-dimensional correlation FTIR and solid state 13C NMR spectroscopy. Vib. Spec. 51, 15–21. doi: 10.1016/j.vibspec.2008.09.017
Ozaki, Y. (2002). “2D correlation spectroscopy in vibrational spectroscopy,” in Handbook of Vibrational Spectroscopy, eds J. M. Chalmers, and P. R. Griffiths (John Wiley & Sons, Ltd), 2135–2172.
Ozaki, Y., and Šašic, S. (2005). “Two-dimensional correlation spectroscopy of biological and polymeric materials,” in Vibrational Spectroscopy of Biological and Polymeric Materials, eds V. G. Gregoriou and M. S. Braiman (New York, NY: CRC Press), 163–214.
Ozaki, Y., and Noda, I. (2006). “Two-dimensional vibrational correlation spectroscopy in biomedical sciences,” in Encyclopedia of Analytical Chemistry, ed R. A. Meyers (John Wiley & Sons, Ltd), 1–18.
Park, Y., Hashimoto, C., Hashimoto, T., Hirokawa, Y., Jung, Y. M., and Ozaki, Y. (2013). Reaction-induced self-assembly of gel structure: a new insight into chemical gelation process of N-isopropylacrylamide as studied by two-dimensional infrared correlation spectroscopy. Macromolecules 46, 3587–3602. doi: 10.1021/ma400457e
Park, Y., Kim, N. H., Choi, H. C., Lee, S. M., Hwang, H., Jeong, Y. U., et al. (2012). Two-dimensional hetero-spectral Raman/XAS correlation analysis of Li[Ni0.45Co0.18Mn0.25Al0.12]O2 cathode in the overcharged state. Vib. Spec. 60, 226–230. doi: 10.1016/j.vibspec.2012.03.004
Pazderka, T., and Kopecký Jr, V. (2012). Two-dimensional correlation analysis of Raman optical activity – Basic rules and data treatment. Vib. Spec. 60, 193–199. doi: 10.1016/j.vibspec.2011.10.002
Peng, H., Han, Y., Liu, T., Tjiu, W. C., and He, C. (2010). Morphology and thermal degradation behavior of highly exfoliated CoAl-layered double hydroxide/polycaprolactone nanocomposites prepared by simple solution intercalation. Thermochim. Acta 502, 1–7. doi: 10.1016/j.tca.2010.01.009
Pi, F., Shinzawa, H., Czarnecki, M. A., Iwahashi, M., Suzuki, M., and Ozaki, Y. (2010). Self-assembling of oleic acid (cis-9-octadecenoic acid) and linoleic acid (cis-9, cis-12-octadecadienoic acid) in ethanol studied by time-dependent attenuated total reflectance (ATR) infrared (IR) and two-dimensional (2D) correlation spectroscopy. J. Mol. Struct. 974, 40–45. doi: 10.1016/j.molstruc.2009.11.060
Popescu, M. C., and Vasile, C. (2011). Two-dimensional infrared correlation spectroscopic studies of polymer blends—Specific interactions in polyethylene adipate/cholesteryl palmitate blends. Spectrochim. Acta A Mol. Biomol. Spectrosc. 79, 45–50. doi: 10.1016/j.saa.2011.01.042
PubMed Abstract | Full Text | CrossRef Full Text | Google Scholar
Popescu, M.-C., and Vasile, C. (2010). Melting behavior of polytetra hydrofuran/cholesteryl palmitate blends investigated by two-dimensional infrared correlation spectroscopy. Soft Mater. 8, 386–406. doi: 10.1080/1539445X.2010.525168
Qu, Y., Huang, G., Wang, X., and Li, J. (2012). Study on the mechanism of the formation of polyhedral oligomeric silsesquioxanes by the 2D correlation infrared spectral. J. Appl. Polym. Sci. 125, 3658–3665. doi: 10.1002/app.36489
Quaroni, L., Zlateva, T., and Normand, E. (2011). Detection of weak absorption changes from molecular events in time-resolved FT-IR spectromicroscopy measurements of single functional cells. Anal. Chem. 83, 7371–7380. doi: 10.1021/ac201318z
PubMed Abstract | Full Text | CrossRef Full Text | Google Scholar
Radice, S., Tommasini, M., and Castiglioni, C. (2010). Two dimensional correlation Raman spectroscopy of perfluoropolyethers: effect of peroxide groups. J. Mol. Struct. 974, 73–79. doi: 10.1016/j.molstruc.2009.11.063
Ryu, S. R., Bae, W. M., Hong, W. J., Ihn, K. J., and Jung, Y. M. (2012). Characterization of chain transfer reaction during radical polymerization of silver nanocomposite polyvinylpyrrolidone by using 2D hetero-spectral IR/NMR correlation spectroscopy. Vib. Spec. 60, 168–172. doi: 10.1016/j.vibspec.2011.12.009
Seo, H., Chae, B., Im, J. H., Jung, Y. M., and Lee, S. W. (2014). Imidization induced structural changes of 6FDA-ODA poly(amic acid) by two-dimensional (2D) infrared correlation spectroscopy. J. Mol. Struct. 1069, 196–199. doi: 10.1016/j.molstruc.2014.02.012
Shinzawa, H., Awa, K., Noda, I., and Ozaki, Y. (2013). Pressure-induced variation of cellulose tablet studied by two-dimensional (2D) near-infrared (NIR) correlation spectroscopy in conjunction with projection pretreatment. Vib. Spec. 65, 28–35. doi: 10.1016/j.vibspec.2012.11.009
Shinzawa, H., Awa, K., and Ozaki, Y. (2012). Compression effect on sustained-release and water absorption properties of cellulose tablets studied by heterospectral two-dimensional (2D) correlation analysis. Anal. Methods 4, 1530–1537. doi: 10.1039/c1ay05392b
Sikirzhytski, V., Topilina, N. I., Takor, G. A., Higashiya, S., Welch, J. T., Uversky, V. N., et al. (2012). Fibrillation mechanism of a model intrinsically disordered protein revealed by 2D correlation deep UV resonance raman spectroscopy. Biomacromolecules 13, 1503–1509. doi: 10.1021/bm300193f
PubMed Abstract | Full Text | CrossRef Full Text | Google Scholar
Smirnova, D. S., Kornfield, J. A., and Lohse, D. J. (2011). Morphology development in model polyethylene via two-dimensional correlation analysis. Macromolecules 44, 6836–6848. doi: 10.1021/ma200774u
Su, Z., Jiang, Z., Huang, G., Li, L., and Wang, X. (2012). Mechanism of formation of partially crosslinked polyacrylamide complexes. J. Macromol. Sci. B 52, 22–35. doi: 10.1080/00222348.2012.687330
Tang, H., Sun, S., Wu, J., Wu, P., and Wan, X. (2010). Conformational changes in novel thermotropic liquid crystalline polymer without conventional mesogens: a raman spectroscopic investigation. Polymer 51, 5482–5489. doi: 10.1016/j.polymer.2010.09.036
Unger, M., Morita, S., Sato, H., Ozaki, Y., and Siesler, H. W. (2009). Variable-temperature fourier transform infrared spectroscopic investigations of poly(3-Hydroxyalkanoates) and perturbation-correlation moving-window two-dimensional correlation analysis. part ii: study of poly(ε-Caprolactone) homopolymer and a poly(3-Hydroxybutyrate)–Poly(ε-Caprolactone) Blend. Appl. Spec. 63, 1034–1040. doi: 10.1366/000370209789379240
Unger, M., Sato, H., Ozaki, Y., and Siesler, H. W. (2011). Crystallization behavior of poly(3-hydroxybutyrate) (PHB), Poly(ε-caprolactone) (PCL) and Their Blend (50:50?wt.%) Studied by 2D FT-IR correlation spectroscopy. Macromol. Symp. 305, 90–100. doi: 10.1002/masy.201000135
Wang, L., Di, S., Wang, W., Chen, H., Yang, X., Gong, T., et al. (2014). Tunable temperature memory effect of photo-cross-linked star PCL–PEG networks. Macromolecules 47, 1828–1836. doi: 10.1021/ma4023229
Wang, X., Xiang, K., Nie, Y., Huang, G., Wu, J., and Su, Z. (2013). Intermediate state and weak intermolecular interactions of α-trans-1,4-Polyisoprene during the gradual cooling crystallization process investigated by In situ FTIR and two-dimensional infrared correlation spectroscopy. Macromol. Res. 21, 493–501. doi: 10.1007/s13233-013-1045-2
Wang, Z., and Wu, P. (2011). Spectral insights into gelation microdynamics of PNIPAM in an ionic liquid. J. Phys. Chem. B 115, 10604–10614. doi: 10.1021/jp205650h
PubMed Abstract | Full Text | CrossRef Full Text | Google Scholar
Wu, Q.-Y., Chen, X.-N., Wan, L.-S., and Xu, Z.-K. (2012). Interactions between polyacrylonitrile and solvents: density functional theory study and two-dimensional infrared correlation analysis. J. Phys. Chem. B 116, 8321–8330. doi: 10.1021/jp304167f
PubMed Abstract | Full Text | CrossRef Full Text | Google Scholar
Wu, Y., Jiang, J.-H., and Ozaki, Y. (2002). A new possibility of generalized two-dimensional correlation spectroscopy:? hybrid two-dimensional correlation spectroscopy. J. Phys. Chem. A 106, 2422–2429. doi: 10.1021/jp012140g
Wu, Y., Meersman, F., and Ozaki, Y. (2006). A novel application of hybrid two-dimensional correlation infrared spectroscopy:? exploration of the reversibility of the pressure- and temperature-induced phase separation of poly(N-isopropylacrylamide) and Poly(N-isopropylmethacrylamide) in aqueous solution. Macromolecules 39, 1182–1188. doi: 10.1021/ma0521755
Zhang, M., Dang, Y.-Q., Liu, T.-Y., Li, H.-W., Wu, Y., Li, Q., et al. (2013). Pressure-induced fluorescence enhancement of the BSA-protected gold nanoclusters and the corresponding conformational changes of protein. J. Phys. Chem. C 117, 639–647. doi: 10.1021/jp309175k
Zhang, M., Zhang, L., and Wu, Y. (2011). The pressure tolerance of different poly-l-lysine conformers in aqueous solution: infrared spectroscopy and two-dimensional correlation analysis. Vib. Spec. 57, 319–325. doi: 10.1016/j.vibspec.2011.09.007
Zheng, K., Liu, R., and Huang, Y. (2010). A two-dimensional IR correlation spectroscopic study of the conformational changes in syndiotactic polypropylene during crystallization. Polym. J. 42, 81–85. doi: 10.1038/pj.2009.304
Keywords: two-dimensional correlation spectroscopy, 2DCOS, polymer, hetero-spectral correlation, projection 2D, PCA 2DCOS, eigenvalue manipulating transformation, self-modeling curve resolution
Citation: Park Y, Noda I and Jung YM (2015) Two-dimensional correlation spectroscopy in polymer study. Front. Chem. 3:14. doi: 10.3389/fchem.2015.00014
Received: 27 December 2014; Accepted: 17 February 2015;
Published: 11 March 2015.
Edited by:
Shigeaki Morita, Osaka Electro-Communication University, JapanReviewed by:
Michele Galizia, University of Texas at Austin, USAYusuke Hattori, Musashino University, Japan
Copyright © 2015 Park, Noda and Jung. This is an open-access article distributed under the terms of the Creative Commons Attribution License (CC BY). The use, distribution or reproduction in other forums is permitted, provided the original author(s) or licensor are credited and that the original publication in this journal is cited, in accordance with accepted academic practice. No use, distribution or reproduction is permitted which does not comply with these terms.
*Correspondence: Young Mee Jung, Department of Chemistry, Kangwon National University, 1 Kangwondaehak-gil, Chunchon 200-701, South KoreaeW1qdW5nQGthbmd3b24uYWMua3I=