 Hafsa Yaqoubi1,2
 Geremia Sassetto1
 Maria Presutti1Mustapha Belfaquir2
 Bruna Matturro3,4
 Simona Rossetti3
 Laura Lorini1
 Marco Petrangeli Papini1
 Marco Zeppilli1,5*
- 1Department of Chemistry, University of Rome Sapienza, Rome, Italy
- 2Department of Chemistry, Laboratory of Advanced Material and Process Engineering, Ibn Tofail University, Kenitra, Morocco
- 3Water Research Institute (IRSA), National Research Council (CNR), Rome, Italy
- 4National Biodiversity Future Center, Palermo, Italy
- 5Research Center for Applied Sciences to the Safeguard of Environment and Cultural Heritage (CIABC), University of Rome Sapienza, Rome, Italy
Chlorinated aliphatic hydrocarbons (CAHs) are common groundwater contaminants due to improper utilization in past industrial activity. Anaerobic reductive dechlorination, where bacteria use CAHs as electron acceptors, is crucial for bioremediation. Environmental conditions, such as nutrient availability and electron donors (i.e., molecular hydrogen), can influence the effectiveness of bioremediation processes. Also, bioremediation strategies like bioaugmentation (i.e., the supply of the enriched dechlorinating consortium) and bio-stimulation (i.e., the supply of electron donor) can improve CAHs removal performances. Here, a microcosm study is presented to assess the effectiveness of bioaugmentation with an enriched dechlorinating consortium for groundwater remediation. Target contaminants used were tetrachloroethane (TeCA), trichloroethylene (TCE) and sulphate ion. Various conditions, including biostimulation and bioaugmentation approaches were tested to evaluate the feasibility of biological treatment. Operating conditions, i.e., mineral medium and lactate, facilitated the dechlorination of TCE into ETH, leading to an increase in the dechlorinating population (Dehalococcoides mccartyi) to 67% of the total bacteria, with reductive dechlorination (RD) rates up to 7 µeq/Ld. Conversely, the RD performance of microcosms with real contaminated groundwater was negatively affected by the combined presence of TeCA and sulphate, indicated by a low abundance of D. mccartyi (<3%) and low RD rates (up to 0.39 µeq/Ld), suggesting that the native microbial population lacked the capacity for effective dechlorination. Moreover, the principal component analysis plot highlighted distinct groupings based on microbial community across different microcosm conditions, indeed, microbial community structures dominated by D. McCarty were associated with higher reductive dechlorination rates while non-augmented and non-stimulated microcosms reflected distinct microbial communities dominated by non-dechlorinating taxa. Additionally, RD decreased (48, 23, 22, and 14 µeq/Ld) with increasing sulphate concentrations (0, 150, 225, and 450 mgSO4 -2/L), further demonstrating the inhibitory effect of sulphate in the treated contaminated groundwater. Overall, this study highlights the complex interplay between environmental conditions, treatment strategies, and microbial communities in driving dechlorination processes. Specifically, the effectiveness of reductive dechlorination is heavily influenced by the availability of electron donors and the composition of the medium or groundwater, which can drive significant shifts in microbial community dynamics, either supporting or hindering the reductive dechlorination process.
1 Introduction
Chlorinated aliphatic hydrocarbons (CAHs) are organic compounds used in industrial applications, such as solvents and degreasers (Guan et al., 2013). CAHs can migrate through soil and groundwater due to their resistance to degradation, and long-term exposure can cause damage to the liver, kidneys, and central nervous system (McGuinness and Dowling, 2009). Some common examples include trichloroethylene (TCE), tetrachloroethylene (PCE), and chloroform; these compounds are known for their volatility, persistence, and the potential for long-range transport through groundwater (Moran et al., 2007). Chlorinated aliphatic hydrocarbons mixtures may contain also chlorinated ethanes like 1,1,2,2-tetrachloroethane (TeCA) and chlorinated methanes like tetrachloromethane (carbon tetrachloride, CT) and trichloromethane (chloroform, CF) (Field and Sierra-Alvarez, 2004). Treating groundwater contaminated with CAHs is challenging due to their persistence in the environment, potential to leach into groundwater, and health risks associated with exposure (David and Niculescu, 2021). Treatment of CAHs-contaminated groundwater typically involves various remediation techniques, and bioremediation is one of the approaches utilized (Rossi et al., 2021). This anaerobic process relies on the metabolic activities of anaerobic microorganisms to detoxify these complex chlorinated compounds in the absence of oxygen (van Eekert and Schraa, 2001). A commonly used method for remediating groundwater is in situ stimulation of reductive dechlorination (RD) of CAHs, which depends on a variety of bacteria that can use CAHs as electron acceptors in anaerobic respiration (Holliger and Schraa, 1994). These reductive processes are facilitated by several key microbial groups, also known as organohalide respiring bacteria (OHRB) that conserve energy for growth from cleavage of carbon–halogen bonds. The OHRB (organohalide-respiring bacteria) are primarily derived from various phyla, including Deltaproteobacteria (e.g., Geobacter, Desulfuromonas, Anaeromyxobacter, Desulfoluna, Desulfomonile, and Desulfovibrio), Epsilonproteobacteria (e.g., Sulfurospirillum), Betaproteobacteria (e.g., Shewanella and Comamonas), Firmicutes (e.g., Dehalobacter and Desulfitobacterium), and Chloroflexi (e.g., Dehalococcoides, Dehalogenimonas, and Dehalobium) (Atashgahi et al., 2016; Molenda et al., 2020). In the anaerobic degradation, the electron acceptor is a molecule other than O2. This could be NO3−, SO4−2, Fe3+, H+, S, fumarate, trimethylamine oxide, an organic compound, or CO2 (Bhatt et al., 2007). Dehalococcoides species are recognized as important organohalide-respiring bacteria capable of completely degrading chlorinated aliphatic hydrocarbons into harmless end products (Vainberg et al., 2009). Bioremediation technologies can be generally classified as in situ or ex-situ. In-situ bioremediation involves treating the contaminated material at the site while ex-situ involves the removal of the contaminated material to be treated elsewhere (Kensa, 2011). In-situ bioremediation of chlorinated ethenes is a method of reducing contaminants that utilize microorganisms to convert them into less dangerous products (Romantschuk et al., 2023). Biostimulation (meaning the addition of limiting nutrients to support microbial growth) and bioaugmentation (meaning the addition of living cells capable of degradation) studies have enjoyed a heavy presence in literature and reviews of these technologies focusing on the technical aspects are very few if at all available (Azubuike et al., 2016). The microcosm experiment can be a useful approach for determining degradation rate, acclimation periods, monitoring dechlorination products, and determining the type and dose of electron donor (Aulenta et al., 2007; Benton et al., 2007). Environmental conditions, such as nutrient availability and electron donors (e.g., molecular hydrogen), can impact the effectiveness of reductive dechlorination at the field scale. These conditions also affect the assessment of bioremediation potential in a contaminated matrix and influence decision-making regarding the appropriate bioremediation strategy for a specific site. Among the critical factors that can affect CAHs dechlorination, sulphate play a role as it can compete for available hydrogen (H2) with microbial reductive dechlorination of CAHs (Huang and Kao, 2016). Previous research combining field and laboratory data concluded that sulphate contamination at trichloroethylene (TCE) sites could delay but not preclude dechlorination (Antoniou et al., 2019). Both sulphate and nitrate have considerable effects on the dechlorination of chlorinated aliphatic hydrocarbons (CAHs), although their effects vary depending on the microbial processes stimulated and environmental circumstances (Lai et al., 2015; Zhang et al., 2022). In this study, we present a microcosm experiment conducted on real contaminated groundwater to assess the effectiveness of reductive dechlorination processes under various conditions. These conditions include bioaugmentation with an enriched dechlorinating consortium, biostimulation using lactate as an external electron donor, and natural attenuation. The target contaminants were tetrachloroethane (TeCA), trichloroethylene (TCE), and sulfate ions. A comprehensive set of kinetic and biomolecular analyses was performed to evaluate the effects of each tested condition on the targeted biodegradation processes.
2 Material and methods
2.1 Microcosm experiment with real groundwater
For the first microcosm set, which includes the study on a real TeCA contaminated groundwater, nine microcosm treatments were set using serum bottles of 240 mL, as shown in Figure 1. The aim of microcosm study was to define the biodegradation potential of the microbial communities present in the groundwater. Nine anaerobic batch microcosms at different conditions were prepared and incubated statically in the dark at room temperature (18°C–22°C) and operated for almost 60 days (Matturro et al., 2016) (Table 1). To maintain anaerobic conditions, bottles were sealed using a septum and crimp-top cap. A needle was inserted through the septum, and the flask was thoroughly flushed with nitrogen gas (N2) to remove any oxygen. All microcosms were then incubated statically in the dark at room temperature (18°C–22°C) for approximately 60 days. The dechlorinating activity of the microbial inoculums was tested with and without an electron donor by adding 200 µL of a 5% (w/v) lactate solution, which is the substrate on which the dechlorinating inoculum is acclimated. The specific conditions for each microcosm were as follows:
• B0 (Endogenous control): 240 mL of real groundwater (GW) without any added contaminants or inoculum.
• B1: 100 mL of enriched dechlorinating consortium inoculum mixed with 140 mL of contaminated groundwater. No electron donor (lactate) added, to evaluate the dechlorinating capacity using residual substrate from the enriched culture.
• B2: 100 mL of enriched dechlorinating consortium inoculum mixed with 140 mL of real contaminated groundwater. 200 μL of 5% (w/v) lactate added as the electron donor. Spiked with TCE at a nominal concentration of 50 μM, to assess the potential inhibitory effects of groundwater composition on dechlorination.
• B3: 100 mL of enriched dechlorinating consortium inoculum mixed with 140 mL of optimized mineral medium. 200 μL of 5% (w/v) lactate added as the electron donor. Spiked with TCE at a nominal concentration of 50 μM, to evaluate dechlorination under optimized conditions.
• B4: 240 mL of contaminated groundwater spiked with 200 µL of TCE, without bioaugmentation. Assessed for the capability of the autochthonous microbial community to degrade TCE under natural conditions.
• B5: 100 mL of enriched dechlorinating consortium inoculum mixed with 140 mL of contaminated groundwater. 200 μL of 5% (w/v) lactate added as the electron donor and spiked with TeCA at a nominal concentration of 50 µM.
• B6: 100 mL of enriched dechlorinating consortium inoculum mixed with 140 mL of real contaminated groundwater. 200 μL of 5% (w/v) lactate added as the electron donor. Spiked with TeCA at a nominal concentration of 50 μM, to assess the potential inhibitory effects of groundwater composition on dechlorination.
• B7: 100 mL of enriched dechlorinating consortium inoculum mixed with 140 mL of optimized mineral medium (REF). 200 μL of 5% (w/v) lactate added as the electron donor. Spiked with TeCA at a nominal concentration of 50 μM, to assess dechlorination under optimized growth conditions.
• B8: 240 mL of contaminated groundwater spiked with 200 µL of TeCA, without bioaugmentation. Assessed for the capability of the autochthonous microbial community to degrade TeCA under natural conditions.
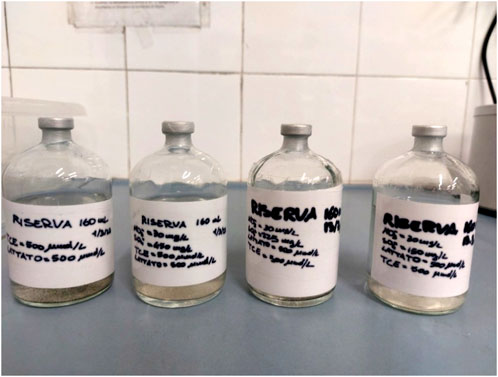
Figure 1. Serum bottles used for microcosm experiments.
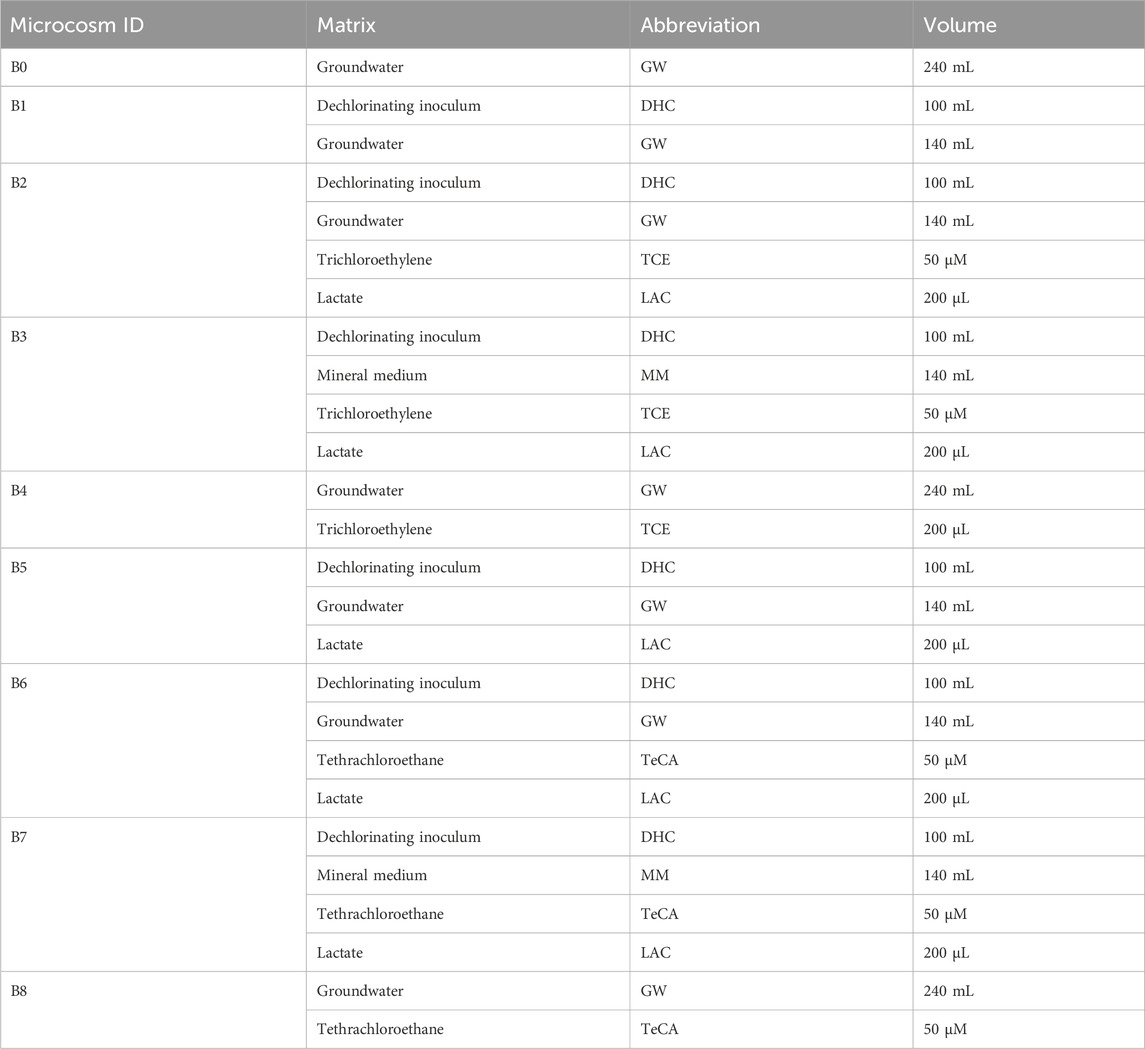
Table 1. Microcosms serum bottles experimental conditions.
The dechlorinating enrichment culture used in the bioaugmented microcosms was composed of 75% D. mccartyi. The raw data of the 16S rRNA gene amplicon sequencing of the consortium are available in the DDBJ/ENA/GenBank under the BioProject PRJNA705054 (SRA: SRX10172732) (Rossi et al., 2021). The composition of the anaerobic mineral medium utilized in this experiment was the same as previously reported (Dell’Armi et al., 2022).
2.2 Microcosm study for sulphate and nitrate inhibitory effects assessment on the dechlorinating enriched colture (DHC)
In the second microcosms study, we present a thorough analysis of the use of different sulphate concentrations in batch microcosms for testing its potential inhibitory effect on reductive dechlorination rate. To assess the potential inhibitory effects of sulphate and nitrate anions concentration on the activity of the enriched dechlorinating inoculum, microcosms containing the dechlorinating enriched culture at different sulphate and nitrate concentration were prepared and monitored. All microcosms (Figure 1) were kept in serum bottles of 240 mL with liquid volume of 160 mL, with different starting sulphate and nitrate concentrations for almost 6 months. As reported in Table 2, the sulphate concentration was adjusted to four levels: S0 (0 mg/L, zero-sulfate), S150 (150 mg/L putting 35.6 mg of Na2SO4in 160 mL), S225 (225 mg/L, putting 53.4 mg of Na2SO4 in 160 mL), and S450 (450 mg/L, putting 106.7 mg of Na2SO4 in 160 mL), while the nitrate concentration was adjusted only at two levels: S0 (0 mg/L of nitrate), S150, S225 and S450 (30 mg/L of nitrate). All microcosms were spiked with 7 μL of pure TCE resulting in a nominal concentration of 500 μmol/L, while 122 µL of lactate 5% (v/v) solution were used as electron donor of the reductive dechlorination process.
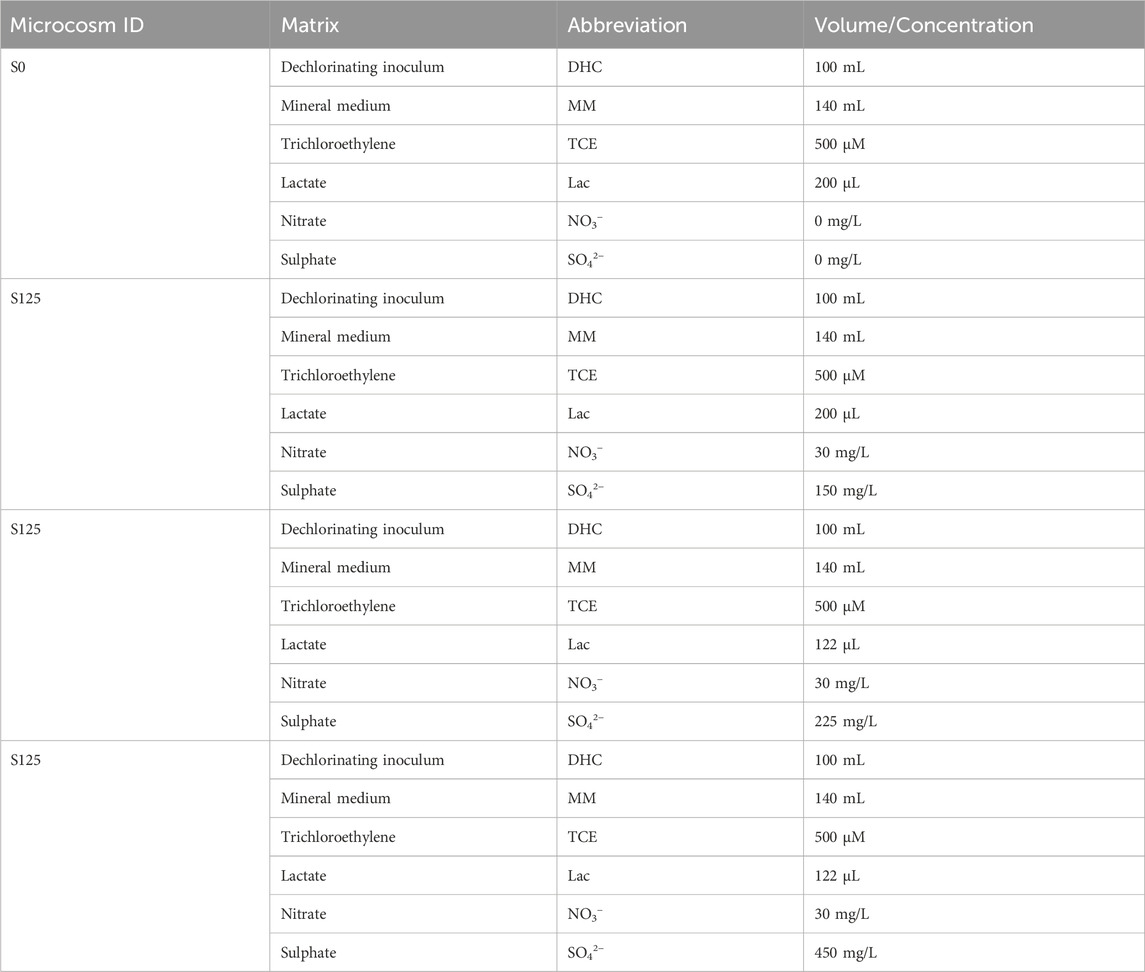
Table 2. Microcosms experimental conditions for sulphate inhibitory effects.
2.3 Analytical procedures
The CAHs were determined by a Dani GC 1000 (Contone, Switzerland) gas chromatograph equipped with a flame ionization detector (FID) using a header analyzer HSS 86.50 (Dani, Contone, Switzerland). The gas chromatography analysis was conducted by a capillary TRB 264 column, 75 m in length, Teknokroma (Spain) (N2 carrier gas: 18 mL/min; oven temperature: 80°C–210°C; flame ionization detector temperature: 260°C). Headspace concentrations were converted to aqueous-phase concentrations using tabulated Henry’s law constants (Fennell et al., 1997) and assuming equilibrium conditions between the gas and liquid phase. For all the chlorinated species, nominal concentrations were reported, representing the total amount (e.g., in moles) per unit of liquid volume. Ethylene in the second microcosm study was measured in headspace samples using a DANI master gas chromatograph equipped with a thermal conductivity detector (TCD) (DANI Instruments, Contone, Switzerland) equipped with a flame ionization detector (FID). The analysis was conducted manually by injecting 50 µL of sample gaseous in the gas-chromatography system equipped with a Carbopack column (N2 carrier gas: 25 mL/min, oven temperature: 50°C–210°C with temperature ramp 20°C/min, flame ionization detector temperature: 260°C) (Zeppilli et al., 2024).
2.4 Calculations
In the microcosm of a real groundwater test, we consider the decrease of the concentration over time. The speed measurement presented in the microcosms with TeCA (B0, B1, B2, B4, B5, B6, B7) indicates the difference in TeCA concentration calculated over the entire duration of the experiment between the first day to the last day. In the groundwater tests, the molar RD rate for TeCA was assessed taking into account the concentration at the beginning and the end of the test (∆[TeCA]) considering the duration of the experiment (days, ∆d) and the liquid volume of the serum bottle (V) (Equation 1). For calculating the RD rate expressed as equivalent, 2 electrons were considered for the dehydrochlorination of TeCA to cis DCE (Equation 2).
For the microcosms contaminated with an additional TCE amount, the molar RD rate was assessed according to Equation 3, which take into account the concentration difference of the different byproducts generated by TCE reductive dechlorination. Moreover, to express the RD rate in terms of equivalents, each concentration difference has been multiplied for the corresponding number of electrons involved in the progressive reduction of the molecule (i.e. 2, 4 or 6 electrons for RD intermediates cisDCE, VC, Eth) as reported in Equation 4. In the microcosms S0-S125-S225-S450 Equations 3, 4 were used to assess molar and equivalent RD rate.
2.5 Microbial community analysis
Samples for biomolecular analysis were collected from groundwater (1 L) and at the end of the microcosm experiments (20 mL). The samples were filtered using polycarbonate filters (pore size 0.22 μm, 47 mm diameter, Nuclepore) to capture the biomass. DNA was extracted from the filters using the DNeasy PowerSoil Pro Kit (Qiagen, Italy), following the manufacturer’s instructions. Purified DNA from each sample was eluted in 50 μL of sterile Milli-Q water and used for microbial characterization through 16S rRNA gene amplicon sequencing. Amplicon libraries were prepared and sequenced on a MiSeq instrument (Illumina, San Diego, CA, USA) using the MiSeq Reagent Kit v3, 600 cycles (Illumina, USA), following protocols previously published (Matturro et al., 2021). Bioinformatic analysis included a read quality check with FastQC software (v 0.11.7), followed by quality filtering and analysis using QIIME2 version 2018.2 (Bolyen et al., 2018). The DADA2 algorithm was employed to denoise paired-end sequences, dereplicate them, filter chimeras using the “consensus” method, and resolve amplicon sequence variants (ASVs) (Callahan et al., 2016). Taxonomy was assigned using the Silva 132–99 database (release December 2017, https://www.arb-silva.de/documentation/release-132/) (Quast et al., 2013). The sequencing data generated in this study have been deposited in the DDBJ/ENA/GenBank under the Bioproject PRJNA1156794.
3 Results and discussion
3.1 Real groundwater microcosms study
A detailed characterization of the collected groundwater for microcosm study have been performed after sampling the contaminated groundwater from a depth between 6.5 and 9.5 m using a submergible pump. Chemical characterization of the collected groundwater is reported in Table 3.
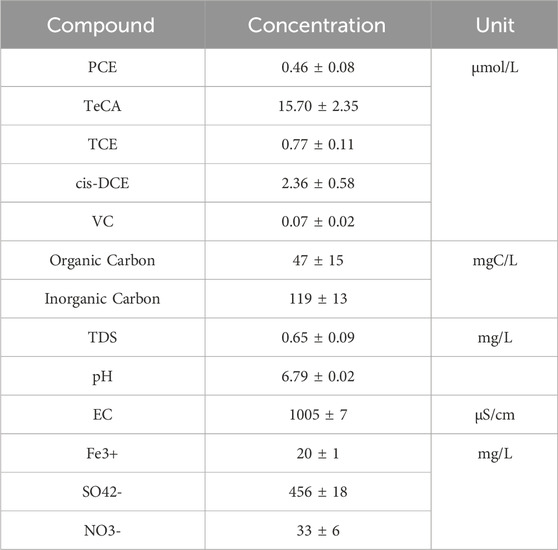
Table 3. Groundwater chemical characterization.
3.1.1 Groundwater CAHs degradation under endogenous conditions
As shown in Figure 2, the groundwater contains a variety of chlorinated aliphatic compounds, including chlorinated ethane compounds (i.e., TeCA, TCA) and chlorinated ethenes (i.e., PCE, TCE, cisDCE, VC) with TeCA and cis-DCE detected at high concentrations. In a control batch test of groundwater without the addition of the dechlorinating enrichment, no biodegradation of the contaminants CAHs was observed throughout the 60 days of incubation, with reductive dechlorination rate (RD) of (−0.15 µmol/Ld (Table 4).
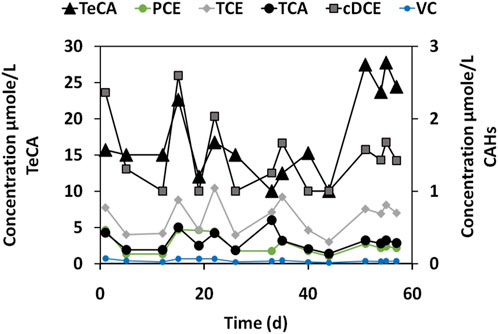
Figure 2. CAHs concentrations during the groundwater endogenous test (microcosm B0).

Table 4. RD rates of the overall microcosm study.
The microbial community in B0 was composed mostly of non-dechlorinating bacteria, as shown by the extremely low abundance of D. mccartyi (5.0%), in line with the lack of dechlorination activity. Instead, Epsilonbacteraeota_Sulfuricurvum (7.2%) and Alphaproteobacteria_Rhodospirillales (11.3%) dominated the community. These bacteria are involved in other environmental processes, such as sulfur cycling, but do not contribute to reductive dechlorination of chlorinated hydrocarbons like TCE or TeCA. Since no external dechlorinating microorganisms were added and no electron donors were supplied to stimulate microbial activity, the native microbial community in the real groundwater (B0) was not capable to perform RD under environmental conditions. The negative RD rate and the microbial composition highlighted the need for bioaugmentation and biostimulation to drive dechlorination processes in contaminated groundwater (Figure 3). The kinetics and microbial composition of B0, allowed us to consider this microcosm primarily as a baseline for comparison with other microcosm conditions.
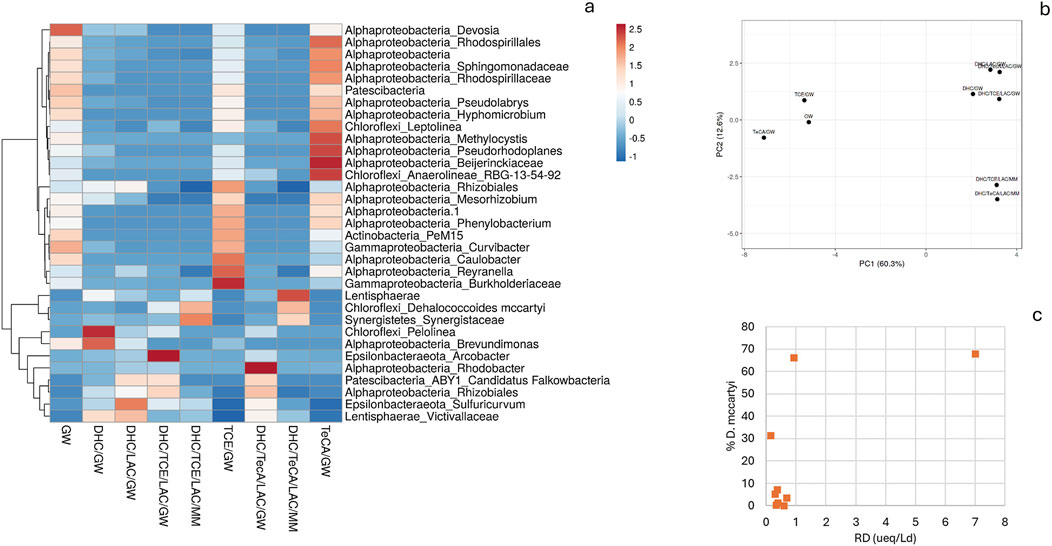
Figure 3. (A) Relative abundance of various microbial taxa (% ASV) across different experimental conditions. The color scale indicates the relative abundance, ranging from blue (low abundance) to red (high abundance), with values from −1 to 2.5. (B) PCA plot: SVD with imputation is used to calculate principal components. X and Y-axis show principal component 1 and principal component 2 that explain 60.3% and 12.6% of the total variance, respectively. N = 9 data points. (C) Correlations between RD rates and % D. mccartyi estimated in the microcosms under various conditions.
3.1.2 Groundwater microcosms amended with dechlorinating inoculum and lactate as electron donor
After the addition of dechlorinating bacteria to real groundwater (Figure 4A) under anaerobic conditions, minimal dechlorination of TeCA and cis-DCE was observed at the end of incubation period. These contaminants were degraded at low rates, primarily converting to VC. The dechlorination rate (RD) in the B1 microcosm was 0.18 μmol/L/day (Table 4). The addition of lactate (Figure 4B) allowed a slight increase in the dechlorination rate (RD) of the B5 microcosm, from 0.18 μmol/L/day to 0.20 μmol/L/day. The TeCA concentration decreased to 3.6 μmol/L after 60 days. Several daughter products, including TCA, cis-DCE, and TCE, were also dechlorinated to very low concentrations. Additionally, during the final stage of the experiment, VC levels ranged between 0.76 and 0.91 μmol/L. As a result, neither the B1 (without lactate) nor the B5 (with lactate) microcosms allowed a complete or high dechlorination in the real groundwater. As described, the microcosm B1 (DHC/GW), bioaugmented with D. mccartyi in the absence of biostimulation (i.e., no external electron donor like lactate was added), showed only moderate RD. The addition of D. mccartyi facilitated some dechlorination, especially for ethene-chlorinated species, however, the lack of an external electron donor and the presence of inhibitors limited the extent of this activity. Likely, the dechlorinating inoculum was able to use some residual organic matter present in the groundwater, however, the presence of inhibitors (i.e., TeCA and sulphate anion) or competitive metabolisms, negatively affected the RD performances of the enriched inoculum. Indeed, the abundance of D. mccartyi in this microcosm was 7.2%, which is much higher than in the control (B0), but still relatively low compared to other microcosms with both bioaugmentation and biostimulation. This indicates that while D. mccartyi is present, its activity might be restricted due to suboptimal growth conditions without a dedicated electron donor. Chloroflexi_Pelolinea (43.6%) was highly abundant in DHC/GW, which might suggest its involvement in other metabolic processes in the system, but not directly contributing to RD. Epsilonbacteraeota_Sulfuricurvum (18.5%) was also present, which may play a role in sulfur cycling, but again as mentioned before, does not directly contribute to reductive dechlorination. In the microcosm B5 (DHC/LAC/GW), bioaugmented with D. mccartyi and biostimulate with lactate as an electron donor, RD rate was similar to DHC/GW (B1), although lactate was added. This suggests that while the presence of lactate did provide electron donors for microbial activity, other limiting factors, such as the groundwater composition or competition between microbial populations, may have constrained the dechlorination process. In line with this finding D. mccartyi represented 1.2% of the microbial community, which is lower than in DHC/GW (B1). This relatively low abundance of D. mccartyi might explain why the RD rate did not increase significantly, despite the addition of lactate. Likely, other microbial species were outcompeting D. mccartyi for available resources. Epsilonbacteraeota_Sulfuricurvum (54.4%) dominated the microbial community in this condition, indicating a significant presence of microorganisms involved in sulfur cycling, which may have limited the overall efficacy of the RD process. Chloroflexi_Pelolinea (6.5%) was present but at a lower abundance compared to other conditions, such as DHC/GW. There was also an increased presence of Patescibacteria ABY1 (9.4%), suggesting that this group could be actively involved in other bioprocesses occurring within the microbial community, though not directly contributing to dechlorination.
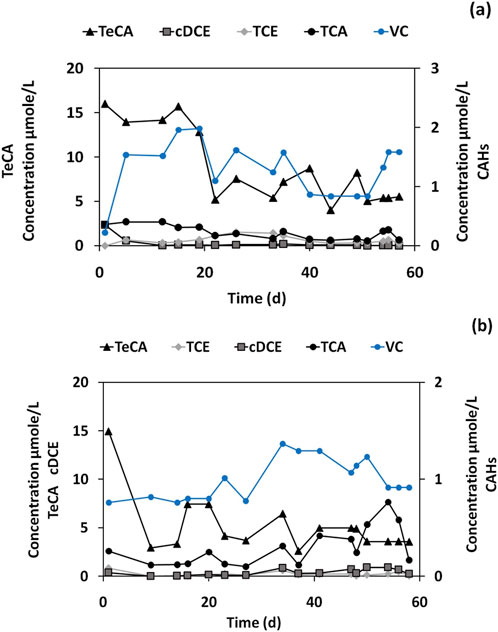
Figure 4. CAHs concentrations in (A) Dechlorinating inoculum, Groundwater for microcosm B1, (B) Dechlorinating inoculum, Groundwater, and Lactate for microcosm B5.
3.1.3 Groundwater microcosms amended with dechlorinating inoculum lactate and TCE
TCE degradation in the B2 microcosm with groundwater (CAHs-contaminated environment) was visible (Figure 5A). During the first 4 days of the experiment, VC (2.95 μmol/L) and cis-DCE (29 μmol/L) were the main products of TCE degradation. After 15 days, VC was produced and increased to 33 μmol/L, while cis-DCE decreased to 5.3 μmol/L. During the latter phase of the experiment, a slight TeCA dechlorination was observed with a concentration ranging from 10 μmol/L to 3 μmol/L. Cis-DCE and VC were also observed, which means that the dechlorinating inoculum in the presence of lactate allowed the TCE reductive dechlorination (Wen et al., 2017). The RD rate of this experiment was 0.08 µmol/Ld suggesting an inhibition of TCE dechlorinating activity of the inoculum. Indeed, the TCE dechlorination capacity of the inoculum is shown in Figure 5B in the B3 microcosm. The TCE dechlorination to Cis-DCE (20.02 μmol/L) and VC (4.7 μmol/L) was observed since the first day of the experiment with the full conversion of TCE and cis-DCE to VC (up to 42 μmol/L) obtained after only 5 days. The VC was fully converted to ethene after 50 days of the experiment. The B3 microcosm shows that inoculum was able to dechlorinate TCE with a high RD rate of 0.91 µmol/Ld. However, when the RD process was analysed in the real groundwater (B4 microcosm) by adding only TCE (Figure 5C the RD rate decreased to 0.16 µmol/Ld (Table 2). As a result, in CAHs-contaminated groundwater amended with the enriched inoculum, lactate and TCE (B2 microcosm), anaerobic conversion of TCE to vinyl chloride and cis-DCE was achieved. However, complete dechlorination of TCE was achieved in B3 microcosm, which consisted with a high RD rate of 0.91 µmol/Ld as shown in Table 2.
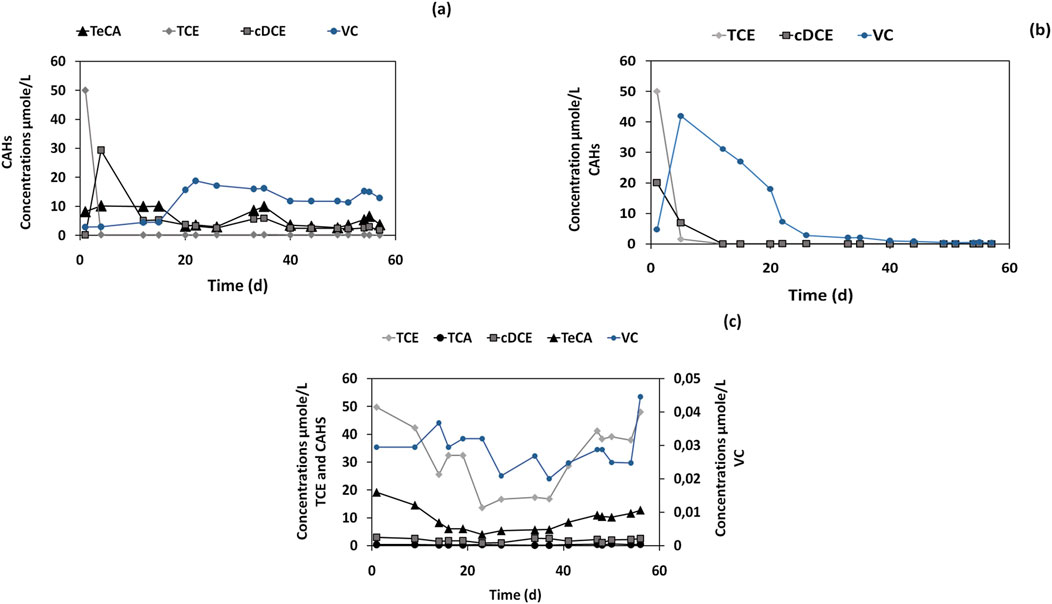
Figure 5. CAHs concentrations in (A) Dechlorinating inoculum, Groundwater, TCE (50 μmol/L), and Lactate for the microcosm B2. (B) Dechlorinating inoculum, Mineral medium, TCE (50 μmol/L), and Lactate for microcosm B3, (C) Groundwater and TCE (50 μmol/L) for microcosm B4.
The microcosm B2 (DHC/TCE/LAC/GW), bioaugmented and biostimulated with TCE addition as contaminant, showed RD rates lower than DHC/GW (B1) and DHC/LAC/GW (B5). D. mccartyi was relatively abundant in this microcosm, representing 31.3% of the microbial community, which is significantly higher than in DHC/LAC/GW (B5). Despite this higher abundance, the RD rate was still low, indicating that other environmental factors or competition within the microbial community might be limiting the efficiency of D. mccartyi in this specific condition. Epsilonbacteraeota_Sulfuricurvum was also present at a notable level (24.7%), suggesting that other microbial processes, such as sulfur cycling, may have competed with dechlorination. Chloroflexi_Pelolinea (12.2%) and Patescibacteria_ABY1 (9.1%) were also present, indicating a diverse microbial community, but also in this case their contributions were likely unrelated to RD. The presence of several non-dechlorinating groups, such as Sulfuricurvum and Pelolinea, may have reduced the overall dechlorination efficiency by outcompeting D. mccartyi for resources. Interestingly, these findings highlight the complexity of groundwater systems, where multiple microbial processes interact and can influence the success of bioaugmentation and biostimulation strategies for dechlorination. Indeed, the same conditions applied to the microcosm B3 (DHC/TCE/LAC/MM) prepared with optimized mineral medium (MM) instead of real groundwater, allowed to increase the RD rate (7.0 µeq/Ld). Diversely from the use of GW, these are the most favorable conditions for efficient TCE reductive dechlorination. Accordingly, D. mccartyi was the dominant microorganism in this microcosm, accounting for 67.7% of the total microbial community. This high abundance directly correlates with the high RD rate, confirming that D. mccartyi is the key driver of RD in the microcosm. Other microbial groups, such as Sulfuricurvum spp. (19.2%), were present but at lower abundances, indicating that RD activity in this microcosm was the main bioprocess. Moving to the microcosm B4 (TCE/GW) with real groundwater spiked with TCE as the contaminant, a low RD rate was observed. This finding is in line with the native microbial community composition of the groundwater, where D. mccartyi was present in extremely low abundance (0.1%). This indicates a very limited dechlorinating capability, which correlates with the low RD rate. Overall, the B4 microbial community in TCE/GW was dominated by non-dechlorinating microorganisms, such as Alphaproteobacteria_Rhodospirillales (6.1%) and Chloroflexi_Leptolinea (5.4%), which are not known for their involvement in RD. This suggests that other metabolic processes, unrelated to TCE dechlorination, were predominant in this microcosm.
3.1.4 Groundwater microcosms amended with dechlorinating inoculum, lactate and TeCA
The B6 microcosm (Figure 6A) supplemented with the dechlorinating inoculum, TeCA (50 μmol/L), and lactate, showed an RD rate of 0.35 μmol/L/day (Table 2). This rate was higher than in the not bioaugmented or unoptimized conditions, suggesting that the addition of D. mccartyi and lactate stimulated dechlorination of TeCA to some extent, but the rate remained lower than the optimal conditions observed in B3 microcosm (DHC/TCE/LAC/MM). Indeed, D. mccartyi was present at low levels (3.5%). Despite the bioaugmentation with D. mccartyi, it did not become a dominant species in this microcosm, possibly due to competition with other microbes or suboptimal conditions of the groundwater. Sulfuricurvum spp. (34.1%) and Rhodobacter spp. (26%) dominated the microbial community in this microcosm. These organisms are not directly involved in RD but may be thriving due to sulfur cycling or other metabolic activities in the groundwater. Their dominance could also indicate that they were competing for resources, limiting the growth and activity of D. mccartyi. The increase in Rhodococcus spp., which is known for hydrocarbon biodegradation, was observed, though its specific role in dechlorination is unclear. This genus is more commonly associated with breaking down hydrocarbons rather than chlorinated compounds like TeCA.
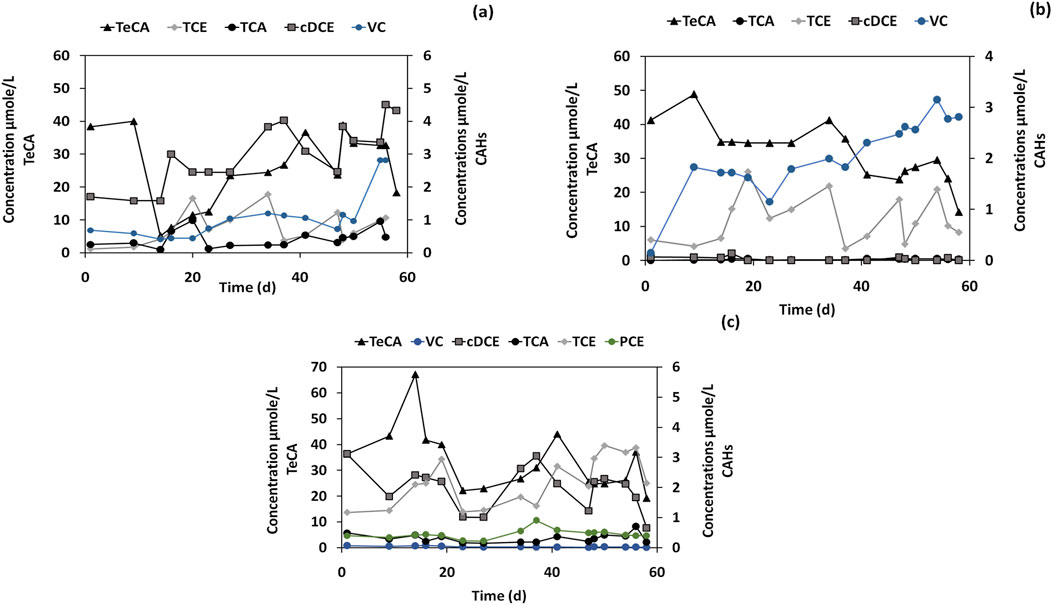
Figure 6. TeCA and other CAHs concentrations in microcosms: (A) Inoculum, Groundwater, TeCA (50 μmol/L) and Lactate for microcosm B6. (B) Inoculum, Mineral medium, TeCA (50 μmol/L) and Lactate for microcosm B7. (C) Groundwater and TeCA (50 μmol/L) for microcosm B8.
The conditions of the microcosm B7 (DHC/TeCA/LAC/MM) (Figure 6B) positively affected and accelerated the RD. In the final stage of the experiment, TeCA decreased to 14.46 μmol/L, VC increased to 2.8 μmol/L, and cis-DCE was eliminated, with the RD rate increase to 0.47 µmol/Ld. As expected, this rate was higher compared to the B6 microcosm (DHC/TeCA/LAC/GW) where real groundwater was tested. The microbial community in B7 was dominated by D. mccartyi, which accounted for 66.0% of the total community, correlating with the enhanced RD rate. The optimized medium provided favorable conditions for D. mccartyi growth and activity, enabling more efficient dechlorination of TeCA. In contrast, non-dechlorinating species, such as Sulfuricurvum spp. (9.4%) and Rhodobacter spp. (0%), were present in much lower or negligible quantities, further emphasizing that the optimized conditions promoted dechlorinators over other microbial taxa. In the microcosm B8 (TeCA/GW) (Figure 6C) real groundwater was spiked with TeCA without any bioaugmentation or biostimulation. The B8 microcosm results show a little increase in TCE concentration, reaching 2.14 μmol/L at the end of the experiment and the RD rate was 0.29 µmol/Ld, this may be the result of a slight TeCA dechlorination. This indicates a limited capacity of the real groundwater for TeCA biological dechlorination, also due to the absence of dechlorinating microorganism, including D. mccartyi. Indeed, the microbial community in this microcosm was dominated by non-dechlorinating taxa such as Alphaproteobacteria_Rhodospirillales (19.1%) and Chloroflexi_Leptolinea (8.8%).
3.2 Consideration on the microbiome dynamics driving RD
This microcosm study allowed to gain insights into how different microbial compositions, conditions, and treatments influence RD rates in the described microcosms. The microbial community dynamics in the various microcosms revealed clear patterns associated with dechlorination activity, particularly the impact of bioaugmentation with D. mccartyi and the addition of electron donors like lactate. The microcosms treated with bioaugmentation and biostimulation, especially those using an optimized mineral medium (MM) such as B3 (DHC/TCE/LAC/MM) and B7 (DHC/TeCA/LAC/MM), exhibited the highest RD rates and D. mccartyi abundances. For example, B3 achieved an RD rate of 7.06 µeq/Ld, driven by a dominant D. mccartyi population (67.7%), highlighting the effectiveness of optimized conditions in promoting dechlorinating activity (Figure 3C). The PCA analysis further supported these findings, showing that microcosms treated with MM clustered distinctly from those treated with real groundwater (GW), indicating that MM provided more favorable conditions for D. mccartyi proliferation and RD (Figure 3B). In contrast, microcosms with real GW and without bioaugmentation or biostimulation, such as B0 and B4, showed negligible dechlorination activity (RD of −0.30 µeq/Ld and 0.16 µeq/Ld, respectively) and very low D. mccartyi abundances. This indicates that the native microbial communities in the groundwater lacked the capacity for significant RD without external intervention. Even when D. mccartyi was present in the GW-treated microcosms (e.g., B6, B5, B2), RD rates were moderate (ranging from 0.2 to 0.7 µeq/Ld), suggesting that while bioaugmentation can introduce dechlorinating capabilities, the natural composition of groundwater, as well as competition from other microbial taxa such as Epsilonbacteraeota and Chloroflexi, can limit the effectiveness of D. mccartyi for RD processes. The correlation between D. mccartyi abundance and RD rates was evident under optimized conditions (Figure 3C). Indeed, microcosms B3 and B7, which had both bioaugmentation and biostimulation, showed the highest D. mccartyi abundance and corresponding RD rates. This suggests that, although D. mccartyi is a critical driver RD, the presence of suitable electron donors (e.g., lactate) and an optimized medium that supports D. mccartyi growth are crucial for maximizing dechlorination efficiency. Conversely, in microcosms like B5 (DHC/LAC/GW), the addition of lactate did not significantly enhance RD due to low D. mccartyi abundance (1.2%), implying that competition for resources or unfavorable groundwater conditions may have restricted D. mccartyi growth and activity. Overall, these findings underscore the complex interplay between microbial community composition, environmental conditions, and treatment strategies in driving dechlorination processes. The data suggests that while bioaugmentation with D. mccartyi may improve the RD process, the success of reductive dechlorination is heavily dependent on a variety of conditions including the availability of electron donors, the autochthonous microbial community composition and the occurrence of competitive metabolisms from non-dechlorinating taxa strictly linked to the real groundwater chemistry and pollution.
3.3 Effect of sulphate concentration on TCE reductive dechlorination
The TCE reductive dechlorination throughout the operation of the S0, S150, S225, and S450 microcosms experiment is shown in Figures 7, 8. The results demonstrate the TCE RD was achieved, regardless of the starting sulphate concentration in every batch experiment; however, because TCE RD rate decreases with the increase of sulphate (Table 4), increasing the sulphate content required longer operating times. In S0, which is the control culture, complete TCE dechlorination was achieved, VC concentration gradually decreased to zero and the final product ethylene increased to 954.1 μmol/L after 194 days of operation (Figure 7) with a TCE removal rate of 8.89 µmol/Ld (Table 5).
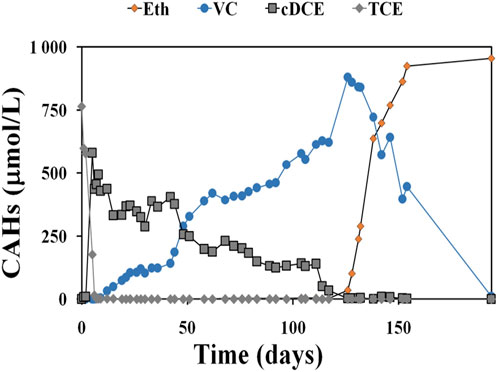
Figure 7. CAHs concentrations in the presence of an enriched dechlorination culture and the absence of sulphate.

Figure 8. CAHs concentrations in an anaerobic environment included the same enriched dechlorination culture and nitrate amount with the addition of sulphate: (A) 450 mg/L sulphate concentration, (B) 225 mg/L sulphate concentration and (C) 150 mg/L sulphate concentration.
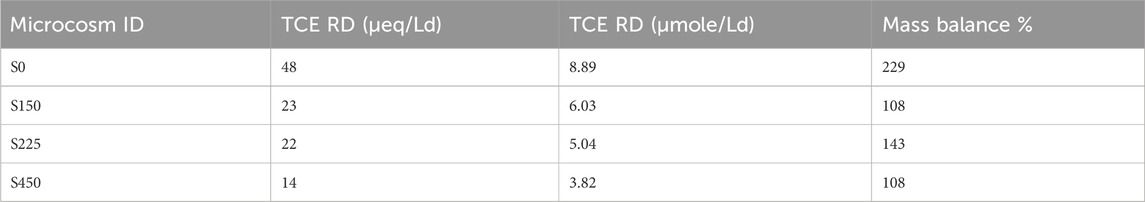
Table 5. Reductive dechlorination rate of TCE expressed as µeq/Ld and µmol/Ld for the microcosms study at different sulphate concentration.
As reported in Figure 7, S0 control test required 5 days for the complete TCE depletion while in the S450 microcosm, the first dechlorination step from TCE to cis DCE required 26 days for the complete TCE reduction. By the evaluation of RD rate S450, S225, and S150 microcosms, TCE RD rates were 14 µeq/Ld, 22 μeq/Ld, and 23 μeq/Ld respectively (Table 5).
RD rate decreased according to the sulphate concentration increase confirmed previous studies (Pantazidou et al., 2012; Schiffmacher et al., 2016). Indeed, control microcosm S0 without sulphate and nitrate anions showed a quantitative reduction of TCE into ethylene and a RD rate of 48 μeq/Ld. The microcosms S150, S225, and S450 showed a lower RD rate, (as reported in Table 5), due to the loss of the final dechlorination stage from VC to ethylene.
4 Conclusion
The microcosms test conducted on the real contaminated groundwater highlighted the presence of combined inhibitory effects derived from the presence of TeCA co-contaminant and sulphate ion concentration. Despite the bioaugmentation of real groundwater with the enriched dechlorinating inoculum, whose activity has been detected in the control B3 microcosm (DHC + MM + TCE + Lac), the removal of TeCA and the other unsaturated byproducts resulted limited in all the tests containing real groundwater. The findings from the first study, which examined microcosms under various conditions, highlight the almost undetectable removal rates of the different chlorinated compounds due to the combined presence of TeCA and sulphate anion. Indeed, while the D. mccartyi enriched dechlorinating consortium can achieve total TCE dechlorination into ethylene in control tests conducted under optimized conditions (i.e., mineral medium and lactate), the presence of CAHs contaminants may hinder the effective biodegradation by this inoculum. The microcosm study highlights that the composition and abundance of microbial taxa varied significantly depending on the experimental conditions, such as the presence or absence of bioaugmentation (mostly D. mccartyi), biostimulation (lactate), and the type of medium (real groundwater or anaerobic mineral medium). Microcosms that were bioaugmented with D. mccartyi and biostimulated with lactate showed higher dechlorination rates, as observed in DHC/TCE/LAC/MM and DHC/TeCA/LAC/MM. These conditions supported the dominance of D. mccartyi, with up to 67.7% of the microbial community, driving efficient RD of chlorinated hydrocarbons like TCE and TeCA. In contrast, microcosms with real groundwater and no bioaugmentation, such as TCE/GW and TeCA/GW, exhibited low D. mccartyi abundance (0%) and low reductive dechlorination (RD) rates, suggesting that the native microbial population lacked the capacity for effective dechlorination. The principal component analysis (PCA) plot highlighted distinct groupings based on microbial community composition across different microcosm conditions. Microcosms that were bioaugmented and biostimulated, such as DHC/LAC/GW, DHC/TCE/LAC/MM, and DHC/TeCA/LAC/MM, clustered together, indicating similar microbial community structures dominated by D. mccartyi. These groupings were associated with higher reductive dechlorination rates. In contrast, non-augmented and non-stimulated microcosms like GW, TCE/GW, and TeCA/GW were separated on the PCA plot (Figure 4B), reflecting distinct microbial communities dominated by non-dechlorinating taxa. This separation demonstrates how bioaugmentation and biostimulation can drive significant shifts in microbial community dynamics toward a composition that supports reductive dechlorination.
Moreover, our enriched dechlorination culture achieved full TCE dechlorination under optimal laboratory conditions without co-contaminants, with an RD rate of 7.06 µeq/Ld. However, in real groundwater with the addition of a dechlorinating inoculum and under lactate stimulation, the RD rate decreased to 0.39 µeq/Ld, with an RD reduction of 95% compared to the control. In the microcosm experiment assessing the impact of sulfate inhibition/competition, successful reductive dechlorination of TCE was observed in all batches, although longer operating times were required at higher sulfate levels. For instance, in the S0 microcosm, complete TCE dechlorination was achieved within 194 days, with an RD rate of 8.89 µmol/Ld, as indicated by the gradual decrease in vinyl chloride concentration to zero and the corresponding increase in ethylene. The microcosms study, focusing on the effect of sulfate, confirmed a clear inverse relationship between RD rates and sulfate concentration. Specifically, RD rates of TCE were recorded at 3.82 µmol/Ld, 5.04 µmol/Ld, and 6.03 µmol/Ld in the S450, S225, and S150 microcosms, respectively. Overall, the results from all microcosm experiments suggest that the presence of other electron acceptors, such as sulfate and CAHs co-contaminants can influence the microbial community involved in the dechlorination process. Additionally, high concentrations of electron acceptors, like sulfate, may slow down the rate of reductive dechlorination.
Data availability statement
The datasets presented in this study can be found in online repositories. The names of the repository/repositories and accession number(s) can be found below: https://www.ncbi.nlm.nih.gov/genbank/, PRJNA1156794.
Author contributions
HY: Writing–original draft, Data curation, Investigation. GS: Data curation, Investigation, Writing–original draft. MPr: Investigation, Writing–original draft. MB: Supervision, Writing–review and editing. BM: Funding acquisition, Investigation, Writing–original draft. SR: Supervision, Writing–review and editing. LL: Supervision, Writing–review and editing. MPe: Supervision, Funding acquisition, Writing–review and editing. MZ: Supervision, Writing–original draft.
Funding
The author(s) declare that financial support was received for the research, authorship, and/or publication of this article. Part of this work was conducted as part of the BISURE project (2022AXYMKY), funded under the framework of the National Recovery and Resilience Plan (PNRR), Mission 4“Education and Research” - Component C2, Investment 1.1, “Fund for the National Research Program and Projects of National Relevance (PRIN). Part of this work has been conducted as part of the RETURN (Multi-risk science for resilient communities under a changing climate) project (PE00000005), funded under the framework of the National Recovery and Resilience Plan (PNRR), Mission 4“Education and Research” - Component C2, Investment 1.3 NextGenerationEU.
Acknowledgments
Edoardo Dell’Armi is acknowledged for his assistance in the microcosms set up. Prof. Mauro Majone is acknowledged for his support in data analysis.
Conflict of interest
The authors declare that the research was conducted in the absence of any commercial or financial relationships that could be construed as a potential conflict of interest.
The author(s) declared that they were an editorial board member of Frontiers, at the time of submission. This had no impact on the peer review process and the final decision.
Generative AI statement
The author(s) declare that no Generative AI was used in the creation of this manuscript.
Publisher’s note
All claims expressed in this article are solely those of the authors and do not necessarily represent those of their affiliated organizations, or those of the publisher, the editors and the reviewers. Any product that may be evaluated in this article, or claim that may be made by its manufacturer, is not guaranteed or endorsed by the publisher.
References
Antoniou, K., Mamais, D., and Pantazidou, M. (2019). Reductive dechlorination of trichloroethene under different sulfate-reducing and electron donor conditions. J. Contam. Hydrology 226, 103519. doi:10.1016/j.jconhyd.2019.103519
Aulenta, F., Pera, A., Rossetti, S., Petrangeli Papini, M., and Majone, M. (2007). Relevance of side reactions in anaerobic reductive dechlorination microcosms amended with different electron donors. Water Res. 41 (1), 27–38. doi:10.1016/j.watres.2006.09.019
Azubuike, C. C., Chikere, C. B., and Okpokwasili, G. C. (2016). Bioremediation techniques–classification based on site of application: principles, advantages, limitations and prospects. World J. Microbiol. Biotechnol. 32 (11), 180. doi:10.1007/s11274-016-2137-x
Benton, T. G., Solan, M., Travis, J. M. J., and Sait, S. M. (2007). Microcosm experiments can inform global ecological problems. Trends Ecol. and Evol. 22 (10), 516–521. doi:10.1016/j.tree.2007.08.003
Bhatt, P., Kumar, M. S., Mudliar, S., and Chakrabarti, T. (2007). Biodegradation of chlorinated compounds—a review. Crit. Rev. Environ. Sci. Technol. 37 (2), 165–198. doi:10.1080/10643380600776130
Bolyen, E., Rideout, J. R., Dillon, M. R., Bokulich, N. A., Abnet, C., Al-Ghalith, G. A., et al. (2018). QIIME 2: reproducible, interactive, scalable, and extensible microbiome data science. PeerJ Prepr. 6, e27295v27292. doi:10.7287/peerj.preprints.27295v2
Callahan, B. J., Mcmurdie, P. J., Rosen, M. J., Han, A. W., Johnson, A. J. A., and Holmes, S. P. (2016). DADA2: high-resolution sample inference from Illumina amplicon data. Nat. Methods 13 (7), 581–583. doi:10.1038/nmeth.3869
David, E., and Niculescu, V. C. (2021). Volatile organic compounds (VOCs) as environmental pollutants: occurrence and mitigation using nanomaterials. Int. J. Environ. Res. Public Health 18 (24), 13147. doi:10.3390/ijerph182413147
Dell’armi, E., Rossi, M. M., Taverna, L., Petrangeli Papini, M., and Zeppilli, M. (2022). Evaluation of the bioelectrochemical approach and different electron donors for biological trichloroethylene reductive dechlorination. Toxics 10 (1), 37. doi:10.3390/toxics10010037
Fennell, D. E., Gossett, J. M., and Zinder, S. H. (1997). Comparison of butyric acid, ethanol, lactic acid, and propionic acid as hydrogen donors for the reductive dechlorination of tetrachloroethene. Environ. Sci. and Technol. 31 (3), 918–926. doi:10.1021/es960756r
Field, J. A., and Sierra-Alvarez, R. (2004). Biodegradability of chlorinated solvents and related chlorinated aliphatic compounds. Rev. Environ. Sci. Biotechnol. 3 (3), 185–254. doi:10.1007/s11157-004-4733-8
Guan, X., Liu, F., Xie, Y., Zhu, L., and Han, B. (2013). Microbiota associated with the migration and transformation of chlorinated aliphatic hydrocarbons in groundwater. Environ. Geochem. Health 35 (4), 535–549. doi:10.1007/s10653-013-9513-3
Holliger, C., and Schraa, G. (1994). Physiological meaning and potential for application of reductive dechlorination by anaerobic bacteria. FEMS Microbiol. Rev. 15 (2-3), 297–305. doi:10.1016/0168-6445(94)90119-8
Huang, W. H., and Kao, C. M. (2016). Bioremediation of petroleum-hydrocarbon contaminated groundwater under sulfate-reducing conditions: effectiveness and mechanism study. J. Environ. Eng. 142 (3), 04015089. doi:10.1061/(asce)ee.1943-7870.0001055
Lai, A., Verdini, R., Aulenta, F., and Majone, M. (2015). Influence of nitrate and sulfate reduction in the bioelectrochemically assisted dechlorination of cis-DCE. Chemosphere 125, 147–154. doi:10.1016/j.chemosphere.2014.12.023
Matturro, B., Presta, E., and Rossetti, S. (2016). Reductive dechlorination of tetrachloroethene in marine sediments: biodiversity and dehalorespiring capabilities of the indigenous microbes. Sci. Total Environ. 545-546, 445–452. doi:10.1016/j.scitotenv.2015.12.098
Matturro, B., Zeppilli, M., Lai, A., Majone, M., and Rossetti, S. (2021). Metagenomic analysis reveals microbial interactions at the biocathode of a bioelectrochemical system capable of simultaneous trichloroethylene and Cr(VI) reduction. Front. Microbiol. 12 (2901), 747670. doi:10.3389/fmicb.2021.747670
Mcguinness, M., and Dowling, D. (2009). Plant-associated bacterial degradation of toxic organic compounds in soil. Int. J. Environ. Res. Public Health 6 (8), 2226–2247. doi:10.3390/ijerph6082226
Molenda, O., Puentes Jácome, L. A., Cao, X., Nesbø, C. L., Tang, S., Morson, N., et al. (2020). Insights into origins and function of the unexplored majority of the reductive dehalogenase gene family as a result of genome assembly and ortholog group classification. Environ. Sci. Process. and Impacts 22 (3), 663–678. doi:10.1039/c9em00605b
Moran, M. J., Zogorski, J. S., and Squillace, P. J. (2007). Chlorinated solvents in groundwater of the United States. Environ. Sci. and Technol. 41 (1), 74–81. doi:10.1021/es061553y
Pantazidou, M., Panagiotakis, I., Mamais, D., and Zikidi, V. (2012). Chloroethene biotransformation in the presence of different sulfate concentrations. Groundw. Monit. and Remediat. 32 (1), 106–119. doi:10.1111/j.1745-6592.2011.01372.x
Quast, C., Pruesse, E., Yilmaz, P., Gerken, J., Schweer, T., Yarza, P., et al. (2013). The SILVA ribosomal RNA gene database project: improved data processing and web-based tools. Nucleic acids Res. 41 (Database issue), D590–D596. doi:10.1093/nar/gks1219
Romantschuk, M., Lahti-Leikas, K., Kontro, M., Galitskaya, P., Talvenmäki, H., Simpanen, S., et al. (2023). Bioremediation of contaminated soil and groundwater by in situ biostimulation. Front. Microbiol. 14, 1258148. doi:10.3389/fmicb.2023.1258148
Rossi, M. M., Dell’armi, E., Lorini, L., Amanat, N., Zeppilli, M., Villano, M., et al. (2021). Combined strategies to prompt the biological reduction of chlorinated aliphatic hydrocarbons: new sustainable options for bioremediation application. Bioengineering 8 (8), 109. doi:10.3390/bioengineering8080109
Schiffmacher, E. N., Becker, J. G., Lorah, M. M., and Voytek, M. A. (2016). The effects of co-contaminants and native wetland sediments on the activity and dominant transformation mechanisms of a 1,1,2,2-tetrachloroethane (TeCA)-degrading enrichment culture. Chemosphere 147, 239–247. doi:10.1016/j.chemosphere.2015.12.033
Vainberg, S., Condee, C. W., and Steffan, R. J. (2009). Large-scale production of bacterial consortia for remediation of chlorinated solvent-contaminated groundwater. J. Ind. Microbiol. Biotechnol. 36 (9), 1189–1197. doi:10.1007/s10295-009-0600-5
Van Eekert, M. H. A., and Schraa, G. (2001). The potential of anaerobic bacteria to degrade chlorinated compounds. Water Sci. Technol. 44 (8), 49–56. doi:10.2166/wst.2001.0462
Wen, L.-L., Zhang, Y., Chen, J.-X., Zhang, Z.-X., Yi, Y.-Y., Tang, Y., et al. (2017). The dechlorination of TCE by a perchlorate reducing consortium. Chem. Eng. J. 313, 1215–1221. doi:10.1016/j.cej.2016.11.021
Zeppilli, M., Yaqoubi, H., Dell’armi, E., Lai, A., Belfaquir, M., Lorini, L., et al. (2024). Tetrachloroethane (TeCA) removal through sequential graphite-mixed metal oxide electrodes in a bioelectrochemical reactor. Environ. Sci. Ecotechnology 17, 100309. doi:10.1016/j.ese.2023.100309
Keywords: chlorinated aliphatic hydrocarbons (CAHs), reductive dechlorination (RD), sulphate reduction, bioremediation, bioaugmentation
Citation: Yaqoubi H, Sassetto G, Presutti M, Belfaquir M, Matturro B, Rossetti S, Lorini L, Petrangeli Papini M and Zeppilli M (2025) Evaluation of the biological treatment of a real contaminated groundwater through reductive dechlorination biostimulation. Front. Chem. Eng. 7:1511251. doi: 10.3389/fceng.2025.1511251
Received: 14 October 2024; Accepted: 09 January 2025;
Published: 24 January 2025.
Edited by:
Federico Battista, University of Verona, ItalyReviewed by:
Giuseppe Mancini, University of Catania, ItalyUttarini Pathak, Rostfrei Steels Pvt. Ltd., India
Copyright © 2025 Yaqoubi, Sassetto, Presutti, Belfaquir, Matturro, Rossetti, Lorini, Petrangeli Papini and Zeppilli. This is an open-access article distributed under the terms of the Creative Commons Attribution License (CC BY). The use, distribution or reproduction in other forums is permitted, provided the original author(s) and the copyright owner(s) are credited and that the original publication in this journal is cited, in accordance with accepted academic practice. No use, distribution or reproduction is permitted which does not comply with these terms.
*Correspondence: Marco Zeppilli, bWFyY28uemVwcGlsbGlAdW5pcm9tYTEuaXQ=