 João Lameu da Silva Jr.
 Harrson Silva Santana
 Maximilian Joachim Hodapp
- 1Center for Engineering, Modeling and Applied Social Sciences, Federal University of ABC, São Bernardo do Campo, Brazil
- 2Renato Archer Information Technology Center, Campinas, Brazil
- 3Institute of Natural Resources, Federal University of Itajubá, Itajubá, Brazil
Methanol is one of the most important primary chemical compounds, being an interesting alternative for portable energy applications and also acting as a molecular platform for the synthesis of a wide range of commodities and high-added-value products. Traditionally, methanol is obtained by catalytic hydrogenation using synthesis gas (CO/CO2/H2) in fixed-bed reactors (FBRs), which require large reaction volumes and are limited by heat and mass transfer. Wall-coated microreactor technology (MRT) offers a promising alternative to traditional fixed-bed reactors. Despite their potential, industrial-scale adoption of microreactors faces challenges related to scale-up. This article aimed to assess methanol synthesis in wall-coated microreactors (planar, or MRP, and monolithic, or MRM) through numerical performance evaluation, using a fixed-bed reactor as a reference. A pre-analysis of carbon conversion into methanol from experimental data provided insightful conclusions about recommended operating parameters, suggested as 50 bar, 250°C, a CO2 ratio of 0.3–0.4, a gas hourly space velocity (GHSV) of 6,000–8,000 mL/g.h, and a stoichiometric hydrogen/carbon ratio of 2–4. The numerical model, coupling chemical kinetics into fluid dynamics, demonstrated good agreement with experimental data. Subsequently, a design of experiments identified optimal operating conditions for methanol synthesis (250°C, 50 bar, CO2 ratio = 0.32, GHSV = 7,595 mL/g.h, hydrogen/carbon ratio = 2.4) in an FBR. The MRP and MRM presented equivalent performance with the FBR after adjusting the surface catalytic loading. In particular, the MRP showed a potential feature for scale-up due to the decreased pressure drop. A reactor block with 10 parallelized channels was designed and evaluated by changing GHSV between 5,000 and 50,000 mL/g.h and varying surface catalytic loading from 0.04 to 0.12 kg/m2. Despite the formation of recirculation zones in the conical region, the flow distribution remained satisfactory, ensuring virtually uniform methanol production among units, providing increased operational flow, and maintaining the microscale efficiency with a relatively low pressure drop. The present article provides a comprehensive analysis of the fundamental interplay between kinetic effects, mass transfer phenomena, and reactor design in methanol synthesis by applying MRT concepts, offering important insights for performance optimization and scale-up of wall-coated microreactors.
1 Introduction
Methanol is one of the most important primary chemical compounds, C1, with an approximate production of more than 110 million tons annually to fill demand (Roode-Gutzmer et al., 2019; Azhari et al., 2022; Liu et al., 2023). Methanol is an interesting alternative for portable energy applications, offering a high hydrogen–carbon ratio, high energy density (5,600 Wh/kg), ready availability, and low boiling point (Choi and Stenger, 2002). It is sulfur-free, and it can be reformed relatively simply at low temperatures (250°C–300°C), simplifying the design of portable fuel cells (Shah and Besser, 2008). Furthermore, methanol acts as a chemical intermediate and molecular platform for the synthesis of important commodities and products, including formaldehyde, acetic acid, methyl tert-butyl ether (MTBE) (Jadhav et al., 2014; Ali et al., 2015), dimethyl ether (via methanol-to-dimethyl ether, MTD) (Brunetti et al., 2020), olefins (via methanol-to-olefins, MTO) (Tian et al., 2015), gasoline (via methanol-to-gasoline, MTG) (Keil, 1999), aromatics (via methanol-to-aromatics, MTA) (Wang et al., 2014), and dimethyl carbonate (via methanol-to-dimethyl carbonate, MTC) (Kohli et al., 2022).
Traditionally, methanol is obtained by catalytic hydrogenation (Cu-ZnO in alumina) using synthesis gas (syngas, or CO/CO2/H2), using carbon monoxide as the main carbon source. The addition of CO2 to the synthesis gas showed an increase in process efficiency. In the last decades, the conversion of CO2 into methanol has demonstrated industrial viability (Sahibzada et al., 1998; Olah et al., 2009). The conversion of carbon dioxide, the main greenhouse gas, into high-value chemicals could be a good solution to restrict global warming, in addition to generating new opportunities for catalysts and industrial process development (Centi et al., 2004; Wang et al., 2023). Compared to the level of greenhouse gases in 2010, reductions in CO2 emissions of 41%–72% by 2050 and 78%–118% by 2100 are necessary to preserve the global temperature, with a temperature change of less than 2°C compared to pre-industrial levels (Stocker et al., 2013). Conversion of CO2 into value-added products through various processes is one of the promising strategies to reduce its emission (Portha et al., 2017; Azhari et al., 2022).
The production of methanol from carbon sources (carbon monoxide and carbon dioxide) in catalytic processes in the gas phase occurs according to three reversible reactions: Reaction 1: hydrogenation of carbon monoxide, Reaction 2: reverse water-gas shift reaction (RWGS), and Reaction 3: hydrogenation of carbon dioxide:
From the CO2 hydrogenation process, the desired reaction is Reaction 3, which occurs in parallel to the RWGS reaction, in which CO2 can be converted into CO. Reaction 3 is highly exothermic and kinetically limited to a 15%–25% conversion (Yang et al., 2011). Therefore, the effect of CO on the overall process must also be considered. Some secondary reactions may occur, especially methanation or dehydration of methanol, forming dimethyl ether (DME). However, secondary reactions can be minimized by using specific catalysts and optimal operating conditions. Reaction 1 is exothermic, and the number of molecules gradually decreases toward the direct reaction; therefore, high pressure and low temperature are favorable to producing methanol. Reaction 2 (RWGS) produces CO and is endothermic; that is, high temperatures favor CO generation. Reactions 1 and 3 are exothermic, requiring efficient heat exchange in the reactor to maximize conversion. One way to characterize the reactions is by using the parameter M, defined by the stoichiometric hydrogen/carbon molar ratio at the reactor inlet:
For a stoichiometric mixture of CO/CO2/H2, the parameter M is equal to 2. Therefore, a value greater than 2 indicates a mixture rich in hydrogen. A value slightly above 2 is reported as optimal for methanol synthesis (Graaf et al., 1986; Bussche and Froment, 1996).
The reactor design must be efficient in order to remove the heat released from methanol synthesis, maintain an isothermal condition, maximize CO2 conversion, and minimize the RWGS reaction. Additionally, water is produced as a byproduct in methanol synthesis from CO2. The presence of water can cause catalyst deactivation, especially for commercial copper-based catalysts (Cui and Kær, 2020). Therefore, the design and kinetic study of the catalyst are crucial to optimize and enable the synthesis of methanol from CO2.
The overall process performance depends mainly on the development of efficient catalysts with excellent performance at high pressures and low temperatures, which can suppress the RWGS reaction, reduce the production of the CO co-product, and increase methanol selectivity (Álvarez et al., 2017; Wang et al., 2023). Currently, methanol synthesis is obtained industrially by multitubular fixed-bed reactors with a Cu-ZnO/Al2O3 catalyst, developed to produce methanol from syngas (CO2/CO/H2) at high pressure (50–100 bar) and moderate temperature (200°C–300°C) (Wang et al., 2023; Portha et al., 2017).
Due to the exothermic nature of CO2 hydrogenation, the accumulation of heat of reaction can lead to local increases in temperature on the particle surfaces, as well as in the global system temperature, consequently decreasing methanol selectivity, promoting secondary reactions, and causing sintering and degradation of the catalyst (Rodriguez et al., 2015; Dong et al., 2016). Catalysts supported with noble metals or oxides have shown promise in catalytic activity and methanol selectivity (Wang et al., 2020). Catalysts based on Cu-Zn and In-Zr in alumina stand out, with high selectivity: 98.2% at 36 MPa, 220°C–300°C (Cu-Zn) (Bansode and Urakawa, 2014) and 99.8% at 5 MPa and 300°C (In-Zr) (Martin et al., 2016). The remarkable selectivity was attributed to the high pressure used. Relatively high selectivity (82%) was obtained by gold catalysts supported on Ti, Zr, Zn, and Al under milder conditions of 5 bar and 220°C–240°C (Zhong et al., 2020). In the context of process intensification, the reactor design can also be addressed to improve the process performance.
Microreactor technology (MRT) has gained attention in the energy sector for its ability to intensify processes through various means: enhancing heat and mass transfer rates, facilitating rapid mixing due to microscale dimensions, and maintaining relatively low pressure drops. Particularly in gas-phase catalytic processes, where selectivity and conversion are influenced by these factors, MRT offers significant advantages. However, when scaling-out from microreactors to millireactors to increase the total operating flow rate, efficiency can suffer due to a decrease in the effective transport related to transverse or radial diffusion, a fundamental step for transporting reactants to the active catalytic surfaces. Current approaches to integrate heterogeneous catalysts in microreactors, such as direct filling microchannels with catalyst particles (fixed beds), face operational challenges. Fixed beds often encounter limitations in heat and mass transfer (Ryu et al., 2007; Wang et al., 2013; Ricca et al., 2017), high pressure drops, the occurrence of cold or hot spots, and also issues like clogging or fouling, which could deprecate the continuous flow (Roy et al., 2004; Mei et al., 2005; Hafeez et al., 2022). Various strategies are being explored to address these challenges, such as employing microscale reactors with surface-coated catalysts, including planar chambers and monolithic structures. These designs generally lead to decreased pressure drops (Moulijn and Kapteijn, 2013; Hafeez et al., 2018), more uniform temperature distribution (Palma et al., 2014), and decreased diffusion path from bulk fluid onto the catalytic surface (Arzamendi et al., 2009). Accordingly, for achieving process intensification, promoting plant modularity, and decreasing costs, an effective strategy should prioritize decreasing both the catalyst load and the reactor volume, which aligns with the main goals of MRT in chemical processing.
Microreactors featuring catalytic-coated surfaces, or, simply, wall-coated microreactors, offer significant advantages over traditional fixed beds, including lower pressure drops, enhanced mass and heat transfer rates, and the potential for easy modular design. Recent research and development efforts have explored innovative techniques like additive manufacturing to create customizable, highly porous catalytic supports tailored to specific processes or microreactor designs. Numerical simulation appears as a powerful tool for designing and optimizing geometries (both catalyst supports and microreactor design) and identifying optimal operating conditions for catalytic processes.
Monolithic catalyst microreactors offer notable advantages, including lower pressure drops and superior heat transfer characteristics compared to conventional fixed-bed reactors (Boger et al., 2004; Palma et al., 2014). Monolithic structures find application across various chemical processes in diverse industrial sectors, notably in gas–liquid–solid reactions. These structures consist of thin, well-defined mechanical frameworks with high surface area per volume, where catalysts are impregnated. Typically made from ceramic or metallic materials, monolithic supports exhibit geometric cross-sectional patterns such as triangular, square, or polygonal honeycomb shapes (Moulijn and Kapteijin, 2013). These structures form straight, parallel channels at micro or milli scales (Gundlapally and Balakotaiah, 2013; Sharma et al., 2015; Gu and Balakotaiah, 2016). Monolithic reactors demonstrate good performance, especially in processes characterized by significant exothermic or endothermic reactions, due to the high thermal conductivity inherent in monolith structures, which consequently favors thermal management (Palma et al., 2014).
Slit or planar microreactor design can operate under very decreased pressure drops. Microstructured pillars can be designed and manufactured in the planar channel, increasing the catalytic surface area (Bakhtiary-Davijany et al., 2011; 2020). In addition, the operation under a laminar flow regime results in a narrow residence time distribution and accurate chemical reaction control. These features make the planar microreactor configuration a good alternative for numbering-up and modular plant assembling for the catalytic process (Lei et al., 2010; Bakhtiary-Davijany et al., 2011; 2020; de Oliveira et al., 2022; Wang et al., 2014).
Despite these advantages, few studies have used microreactors in methanol synthesis. Bakhtiary-Davijany et al. (2011) designed and manufactured the integrated micro packed bed reactor-heat exchanger (IMPBRHE), a sophisticated reactor block employing a multi-slit microdevice design for the synthesis of methanol from syngas over Cu/ZnO/Al2O3 catalysts, operating at industrial conditions (80 bar and 523 K). Constructed from stainless steel, the IMPBRHE module was specifically designed to withstand pressures of up to 100 bar. It featured eight reaction slits intricately integrated with cross-flow oil channels to facilitate efficient heat transfer. The catalyst slits were etched with hexagonally arranged cylindrical pillar structures within stainless steel foils, providing a substantial surface area for catalytic reactions. Thermocouples and temperature measurement apertures were incorporated to enable precise temperature monitoring. Experimental findings demonstrated near-equilibrium conversion rates per pass within remarkably short contact times (approximately 470 m g/mL), showcasing the reactor’s efficient catalytic performance. Furthermore, the IMPBRHE demonstrated exceptional heat dissipation capabilities, maintaining isothermal conditions, with pressure drop measurements indicating isobaric reaction media within the slits.
Recently, Bakhtiary-Davijany et al. (2020) developed a comprehensive mathematical model to simulate the IMPBRHE using computational fluid dynamics (CFD), incorporating kinetic rate expressions for methanol synthesis over commercial Cu/ZnO catalysts. The simulation encompassed a broad spectrum of operating conditions (ranging from 473 K to 558 K, with pressures reaching up to 100 bar). The model accurately predicted experimental CO conversion rates and effectively captured the superior thermal stability of the reactor block under various contact times, feed gas compositions, and reactor temperatures. These results underscored the reactor’s capability to sustain optimal performance across diverse operating conditions without any degradation in efficiency.
Advancements in MRT coupled with innovative catalyst integration methods hold promise for increasing chemical processing efficiency. To achieve these benefits, scale-up and numbering-up strategies must be addressed. Achieving optimal scaling from micro to milliscale devices involves maintaining the enhanced mixing and reaction performance observed at smaller scales. While microreactors offer higher reaction yields, they come with drawbacks such as increased pressure drops, manufacturing costs, and operational complexities (Chen et al., 2015). Recent investigations into scale-up methodologies have explored innovative approaches to boosting production rates using larger microdevices, including implementing passive micromixers (Silva Jr. et al., 2020; 2024; Santana et al., 2021; 2022). However, traditional scale-out methods often compromise mixing efficiency and species dispersion, leading to decreased overall performance (Billo et al., 2015; Lopes et al., 2019; Santana et al., 2021; 2022; Silva Jr. et al., 2024). Finding ways to scale-out while preserving microfluidic characteristics, especially in catalytic processes, requires further research. Alternative or even complementary strategies, such as numbering-up, that is, the parallelization of multiple micro or milliscale reactors, and modular plant design, that is, the integration of multiple reactor blocks, have been proposed to address these challenges (Zhang et al., 2017). Numbering-up is a prevalent scale-up approach in microfluidics, involving multiple channels or reactors operating simultaneously to maintain uniform mixing and reaction conditions. While this method offers the benefit of preserving fluid dynamics and heat and mass transfer characteristics from the microscale, it necessitates intricate and accurate management of fluid flow and chemical species distribution in each parallel channel (Zhang et al., 2017; Lopes et al., 2019).
Therefore, this article aims to evaluate the synthesis of methanol in coated-wall MRs (planar, or MRP, and monolithic, or MRM), making a numerical assessment of their performance using a fixed-bed reactor as reference and process intensification indicators, including catalyst load and reactor volume. For this purpose, a mathematical model coupling the methanol synthesis kinetics to fluid dynamics was implemented and validated using computational fluid dynamics. The MRs showed performance equivalent to the fixed bed after adjusting the surface catalytic load, obtaining good performance for low contact times and relative low pressure drops (MRP). In addition, the scale-up was carried out by a module with 10 parallelized MRP channels, evaluating indicators such as carbon conversion, methanol/water selectivity, methanol space-time yield, and pressure drop for a wide range of flow rates (GHSV = 5,000–50,000 mL/g.h). The optimized design of the distributor allowed equivalent performance in all units, thus providing an increase in operational flow while maintaining the efficiency obtained in microreactor units with relatively low pressure drop. The analysis determined that the catalytic processes for carbon conversion into methanol can benefit from MRT, and smart scale-up is a key factor in enabling such applications at industrial levels, allowing processes with greater operational flexibility, efficiency, and sustainability.
2 Mathematical modeling
The mathematical model consisted of coupling the kinetic expressions into the fluid flow. The models were implemented and simulated using the Ansys CFX code. Details of the modeling (fixed-bed and wall-coated reactors) are provided below.
2.1 Kinetic modeling of methanol synthesis
To implement a model coupling kinetic patterns to fluid dynamics, it is first necessary to evaluate the kinetic models for methanol synthesis, considering the specificities of the process. These gas-phase catalytic reactions are typically modeled by Langmuir−Hinshelwood−Hougen−Watson (LHHW) type mechanisms. Copper-based catalysts are usually used, both in laboratory-scale studies and in traditional industrial processes (e.g., Cu-Zn in alumina). This type of catalyst was developed to convert synthesis gas, which is a mixed carbon source of CO and CO2. Most of the developed kinetic models and experimental studies of carbon-to-methanol conversion have been reported for this catalyst composition (Klier, 1982a; Bussche and Froment, 1996; Park et al., 2014; Portha et al., 2017). The implemented kinetic model was proposed by kinetic expressions of the LHHW type obtained from the literature (Graaf et al., 1986; Bussche and Froment, 1996) for Cu-Zn catalysts in alumina for wide industrial use. The LHHW model is based on the occurrence of three reaction steps, previously explained in Eqs 1–3:
• Step 1: hydrogenation of carbon monoxide—given by reaction rate r1 (Eq. 5) (Bussche and Froment, 1996).
• Step 2: reverse gas-water shift reaction—given by reaction rate r2 (Eq. 6) (Graaf et al., 1986).
• Step 3: hydrogenation of carbon dioxide—given by reaction rate r3 (Eq. 7) (Bussche and Froment, 1996).
where pi is the partial pressure of the ith chemical species in bar (Eq. 8), fj (j = 1–9) are kinetic constants given as the Arrhenius law (Eq. 9) by Eqs 10–18, and Keq are the equilibrium constants (Eqs 19–21) given by Van’t Hoff expressions (Bussche and Froment, 1996). The parameters from the Arrhenius and Van’t Hoff expressions were taken from Bussche and Froment (1996) and Graaf et al. (1986). They conducted a series of experimental runs and applied regression methods to obtain these parameters, also accessing their validity for the evaluated operating conditions. For more details on the development and estimation of the parameters of kinetic and equilibrium models, readers may want to consult the original articles (Graaf et al., 1986; Bussche and Froment, 1996). The reaction rates r1, r2, and r3 are given in mol/kgcat s.
where yi is the molar fraction of ith chemical species i, and P is the absolute pressure of the system.
with the activation factor Eaj given in J/mol, T is the absolute temperature, and R is the universal gas constant in coherent SI units.
2.2 Fluid dynamic modeling of the fixed bed reactor (FBR)
The FBR model considerations were single-phase and multi-species in a gas-phase system. The densities of the gaseous species were determined by the Lee–Kesler equation of state (LK-EoS) and are given in Supplementary Material. The LK-EoS is a relatively simpler and computationally efficient model that accurately predicts the thermodynamic properties of fluids using only critical temperature, pressure, density, and acentric factors. LK-EoS is derived from extensive experimental data, making it reliable for a wide range of conditions and valuable for practical engineering calculations. Considering the main goal of the present article, which focused on the fluid dynamics and chemical kinetics of the methanol synthesis, the LK-EoS was employed because it provides a good balance between accuracy and calculation complexity (Xiang and Deiters, 2008; Estela-Uribe, 2012). Other considerations include laminar flow due to the characteristic scale used in the FBR (7 mm inner diameter, based on Park et al., 2014) (maximum Reynolds number approximately 250), Newtonian fluid, ideal isothermal conditions—considering effective thermal exchange, temperature control and stability observed in previous studies (Bussche and Froment, 1996; Bakhtiary-Davijany et al., 2011; 2020; Nestler et al., 2020), inherent from the FBR length scale. Accordingly, the equations of total mass conservation (continuity), momentum, and mass conservation of the ith chemical species (where i = Ar, CH3OH, CO, CO2, H2, and H2O) to be numerically solved are given by Eqs 22–24, respectively:
where ρ is the specific mass (total density of the gas mixture) in kg/m3, U is the velocity vector in m/s, P is the pressure in kg/m.s2, µ is the dynamic viscosity in kg/m.s, and Yi is the mass fraction of the ith chemical species. Di is the molecular diffusion coefficient of the chemical species in the mixture in m2/s, estimated by data available in Welty et al. (2008) for ambient conditions, corrected as a function of operational conditions (P and T) and by Wilke’s correlation (1950) for multicomponent mixtures (further details are found in Welty et al., 2008). ε is the bed void fraction (bed porosity), K is the area porosity tensor, and SM is the extra source of momentum exchange due to the porous medium. For a fixed bed, ε = 0.5, SM was calculated from the Ergun correlation (Eq. 27), as explained below. Si is the mass source term due to the generation/consumption of the chemical species, modeled as a volumetric reaction term for the FBR in kg/m3. s, given by Eqs 30–34.
In addition, inert N2 was used as a constraint species for the mass fraction, as determined by Eq. 25. The inclusion of Ar and N2 was necessary to reproduce the operating conditions of methanol synthesis from syngas mixtures.
According to the Ergun equation (Eq. 27), the pressure drop per unit length in a porous medium is given by two contributions: viscous dissipation and inertial/kinetic losses:
where Dp is the particle average diameter of the fixed bed. Comparing Eqs 26, 27, the permeability (Kperm) and loss coefficients (Kloss) are defined by Eqs 28, 29, respectively:
Considering the LHHW models described by Eqs 5–7, combined with the stoichiometry of methanol synthesis in three steps (Eqs 1–3) and also considering the chemical reactions occurring in the fluid phase, the conservation of species was solved numerically for five species (CH3OH, CO, CO2, H2, H2O) considering the mass source terms by Eqs 30–34:
where the reaction rates r1, r2, and r3 were given based on catalyst mass in mol/kgcat s, where Mw is the molar mass of the ith chemical species, and ρcat is the catalyst density, considered equal to 1,300 kg/m3 (commercial Cu/ZnO/Al2O catalyst, Ledakowicz et al., 2013). The mean particle diameter of the catalyst was considered equal to 50 μm (Bussche and Froment, 1996; Nestler et al., 2020). Accordingly, the chemical species mass sources were given on a mass basis in kg/m3s.
Figure 1 shows details of the FBR geometry and the boundary conditions used.
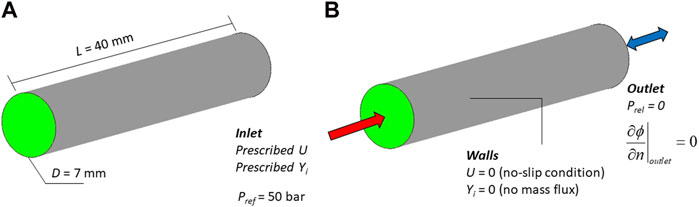
Figure 1. (A) Details of the FBR used in the simulations (D = 7 mm, L = 40 mm; diameter × length, based on Park et al., 2014) and (B) boundary conditions used in CFD modeling.
The boundary conditions used were as follows:
• Inlet: normal velocity, prescribed on the inlet according to the operating condition, calculated from the GHSV or by the contact time. The mass fractions at the inlet were prescribed according to the molar composition of the syngas fed. The values used are given in Supplementary Material.
The gas hourly space velocity (GHSV) is defined as the ratio between the volumetric flow at standard conditions (P0 = 1.01325 bar, T0 = 273.15 K) by the catalyst volume of the reactor (Eq. 35). For the FBR:
where V0 is the gas mixture volumetric flow rate at the standard conditions, and mcat is the catalyst mass. After obtaining V0, it was corrected to obtain the real volumetric flow rate, Vreal, in the operating condition (P, T), according to Eq. 36:
Finally, Vreal was used to obtain the average, normal inlet velocity (Uinlet), considering the cross-sectional area of FBR inlet, A:
For cases of obtaining the real flow rate from the contact time τc, defined as the ratio between catalyst mass and the real operating volumetric flow rate, Eq. 38 was employed along with Eq. 37:
where VFBR is the total volume of the FBR.
• Outlet: zero relative pressure with a reference pressure of 50 bar. Then, the reaction medium was subjected to an average absolute pressure of 50 bar. The other variables were defined by the zero-gradient condition at the outlet.
• Walls: non-slip conditions for fluid–wall interaction. In the FBR, chemical reactions took place in the gas phase; therefore, there is no mass transfer and/or generation/consumption of chemical species at the wall boundaries.
2.3 Fluid dynamic modeling of wall-coated microreactors (MR)
Two configurations of wall-coated microreactors were considered: planar or slit (MRP) and monolithic structured (MRM). The model considerations were single-phase multi-species and a gas-phase system. The gaseous species densities were determined by the LK-EoS and are given in Supplementary Material. Other considerations include laminar flow due to the microscale of MR (maximum Reynolds number of 155), Newtonian fluid under ideal isothermal conditions for effective thermal exchange, and the temperature control and stability observed in previous studies (Bussche and Froment, 1996; Bakhtiary-Davijany et al., 2011; 2020; Nestler et al., 2020), inherent from the microscale. In this way, the equations of total mass conservation (continuity), momentum, and mass conservation of the ith chemical species (where i = Ar, CH3OH, CO, CO2, H2, and H2O) to be numerically solved are given by Eqs 39–41, respectively:
Inert nitrogen, N2, was employed as a constraint species for the mass fraction (Eq. 42). For these MR, the chemical reactions were considered to occur instantaneously in the catalytic-coated walls, that is, no mass transport effect from the bulk fluid to the catalyst pores was modeled, nor were adsorption and desorption phenomena modeled (i.e., microkinetic modeling). These effects were included implicitly in the reaction rates using the LHHW models described previously.
The conversion of reactants to products was modeled by mass fluxes at the boundaries of the reactive walls. The conversion between chemical reaction rates per unit of reactor volume into the reaction rate per unit of the catalytic surface area was obtained according to Levenspiel (1999) (Eq. 43):
where r” is the reaction rate per unit of catalytic surface area given in kmol/m2. s, r is the reaction rate on a volumetric basis, V is the fluid volume in the reactor, and As is the total catalytic surface area. Note that the term V/As is the inverse of the specific catalytic surface area as and can be understood as a specific catalytic volume. Based on this definition and literature data (Levenspiel, 1999; Irani et al., 2011; Ledakowicz et al., 2013), the conversion of LHHW reaction rates described by Eqs 5–7 were converted into r” (i,e., per surface area) taking as a reference catalyst coating load of Γcat = 0.04 kgcat/m2, reported by Irani et al. (2011) and Uriz et al. (2014). Other values were simulated to evaluate the relationship between process performance and the mass of the catalyst used in the catalytic coating. Therefore, the specific catalyst surface area was estimated by Eq. 44, considering ρcat = 1,300 kg/m3 and Γcat = 0.04 kgcat/m2 (Irani et al., 2011; Ledakowicz et al., 2013; Uriz et al., 2014):
Therefore, considering the same catalytic surface area for all species in the system, the source terms of chemical species for MRP and MRM were modeled by a boundary condition, considering an equilibrium between mass diffusion at catalytic walls and the chemical reactions, according to Eq. 45:
where Si is defined according to Eqs 30–34. The term on the left-hand side of Eq. 45 represents the mass flux of the chemical species from the bulk fluid onto the reactive walls, while the right-hand side represents the chemical reaction rate per unit of catalytic surface area.
2.3.1 Wall-coated planar microreactor (MRP)
Figure 2 shows details of the slit or planar microreactor (MRP) geometry (Figure 2A) used and the boundary conditions used (Figure 2B). The MRP geometry was based on the Bakhtiary-Davijany et al. (2011) microreactor.
• Inlet: normal velocity prescribed according to the contact time, as described below. The mass fractions at the inlet were prescribed according to the molar composition of syngas fed. The values used are given in Supplementary Material.
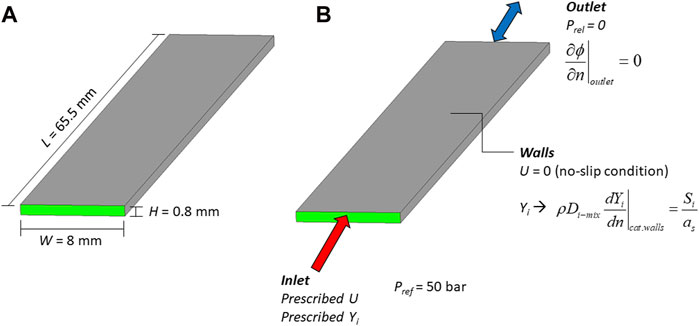
Figure 2. (A) MRP geometry with dimensions (H × W × L: height × width × length) and (B) boundary conditions used.
The contact time τc (Eq. 46), calculated by the ratio between catalyst mass and the real operating volumetric flow rate, was employed to define the inlet velocity:
where As is the total catalytic surface area of the MRP (i.e., the contour walls in Figure 2B).
• Outlet: zero relative pressure with a reference pressure of 50 bar defined in the domain; that is, the reactor operated at an average absolute pressure of 50 bar. The other variables were defined by the zero-gradient condition at the outlet.
• Walls: non-slip condition for fluid–wall interaction. In coated-wall microreactors, there is a mass flux of species from the fluid phase to the wall, and the species are then converted by chemical reactions. There is no mass flux for inert species. In this way, the boundary condition of equilibrium between molecular diffusion and chemical reactions was used, as described by Eq. 45.
2.3.2 Monolithic wall-coated Microreactor (MRM)
A monolithic structure with the same hydraulic diameter as the fixed-bed reactor was considered (diameter of 7 mm), aiming for a direct performance comparison among the reactors. Considering a 100 ppi (100 pores per linear inch) monolith, the complete MRM would be composed of a 28 × 28 pore structure (Figure 3A), resulting in 784 pores and, therefore, a high computational cost. A simplification was carried out by modeling and simulating 1/16 of the monolith structure, represented by a 7 × 7 pore matrix (Figure 3B) with a linear length (channel depth) of 13.1 mm, to obtain the same useful volume capacity of the FBR after the reconversion by a factor of 16 to represent the complete MRM. The modeled MRM then presents square channels (macropores) with dimensions Hp × Wp = 202 μm, separated by a structure of width lp = Wp/4 = 50.5 μm and length 13.1 mm (Figure 3B). In addition, a uniform fluid distributor (inert section) encompassing the 7 × 7 matrix of macropores was added, with a square section of 1.75 mm × 1.75 mm and a length of 2 mm, as shown in Figure 3C.
• Inlet: normal velocity prescribed according to the contact time, as described below. The mass fractions at the inlet were prescribed according to the molar composition of the syngas feed. The values used are given in Supplementary Material. The contact time τc was estimated by the catalytic mass by the real operating flow rate, estimated by Eq. 47:
where As is the total catalytic surface area, considered the porous matrix shown as the reactive walls contour in Figure 3D.
• Outlet: zero relative pressure with a reference pressure of 50 bar, resulting in an average absolute pressure of 50 bar in the domain. The other variables were defined by the zero-gradient condition at the outlet.
• Inert walls: non-slip condition for the fluid–wall interaction. There is no mass transfer and/or generation/consumption of chemical species in these boundaries because they are inert walls.
• Catalytic/reactive walls: non-slip conditions for the fluid–wall interaction. In the catalytic-coated surfaces, there is a mass flux of species from the fluid phase to the wall, which are then converted by chemical reactions. There is no mass flux for inert species. In this way, the boundary condition of equilibrium between molecular diffusion and chemical reactions was used, as described by Eq. 45.
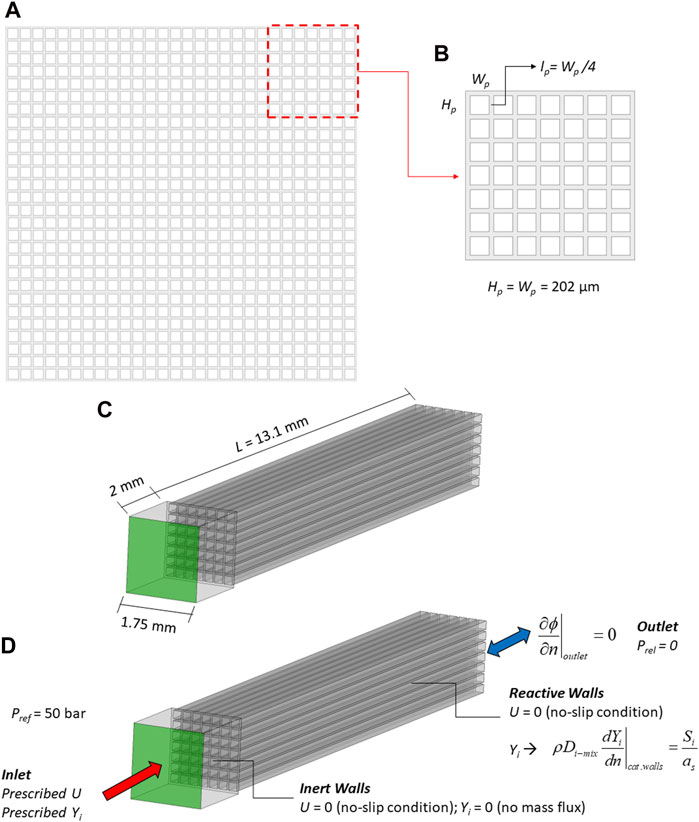
Figure 3. (A) Cross-section of the 100 ppi monolithic structure (7 × 7 mm, containing 28 × 28 pores), (B) detail of the modeled section: 7 × 7 matrix of macropores (Hp, Wp, lp–height, width, and spacing between pores), (C) detail of the monolithic structure model, including the inert distributor, with square section 1.75 mm × 1.75 mm and length of 2 mm, connected to the 13.1-mm-long monolithic matrix (reacting channels), and (D) boundary conditions used (L: length/depth).
2.4 Methodology
The methodology was divided into five stages as follows:
1. Pre-assessment of operating conditions
2. Validation of the kinetic model coupled to fluid dynamics
3. Optimization of operating conditions in the fixed-bed reactor
4. Performance analysis of wall-coated microreactors (planar and monolithic)
5. Numbering-up
2.4.1 Pre-assessment of operating conditions
In addition to the catalyst effect, intrinsically characterized in the kinetic model, the operating conditions strongly affect the carbon conversion from CO and CO2 into methanol. Specifically, one can highlight the effect of temperature, varying between 200°C and 300°C; pressure, varying between 50 and 100 bar; GHSV, in the range between 5,000 h−1 and 30,000 h−1 (or mL/g.h); and the reactor feed composition, characterized by two main stoichiometric ratios: the CO2 (or CO) ratio and the hydrogen/carbon ratio, M (Eq. 4). The CO2 ratio was defined as: CO2/(CO + CO2). The interaction between these operational variables and carbon conversion presents great complexity. Therefore, the operating conditions were previously analyzed using literature data, aiming to observe the behavior of process performance.
As a previous step from implementation and validation of the numerical model for the methanol synthesis, a large dataset on the catalytic conversion of carbon into methanol obtained from 185 experiments in the literature was evaluated (Klier, 1982b; Park et al., 2014; Portha et al., 2017). The data set encompassed a wide range of operating conditions: T (200°C–340°C), P (50–90 bar), CO2 ratio (0–1), and M (1.03–10.67). The complete dataset used is tabulated in Supplementary Material.
2.4.2 Validation of the kinetic model coupled to fluid dynamics
The numerical model validation was carried out for 15 cases covering the entire operating conditions range in a fixed-bed reactor based on Park et al. (2014). Most of these cases were in the recommended process range, as defined in the previous analysis. Details of the operating conditions of validation cases are listed in Table 1.
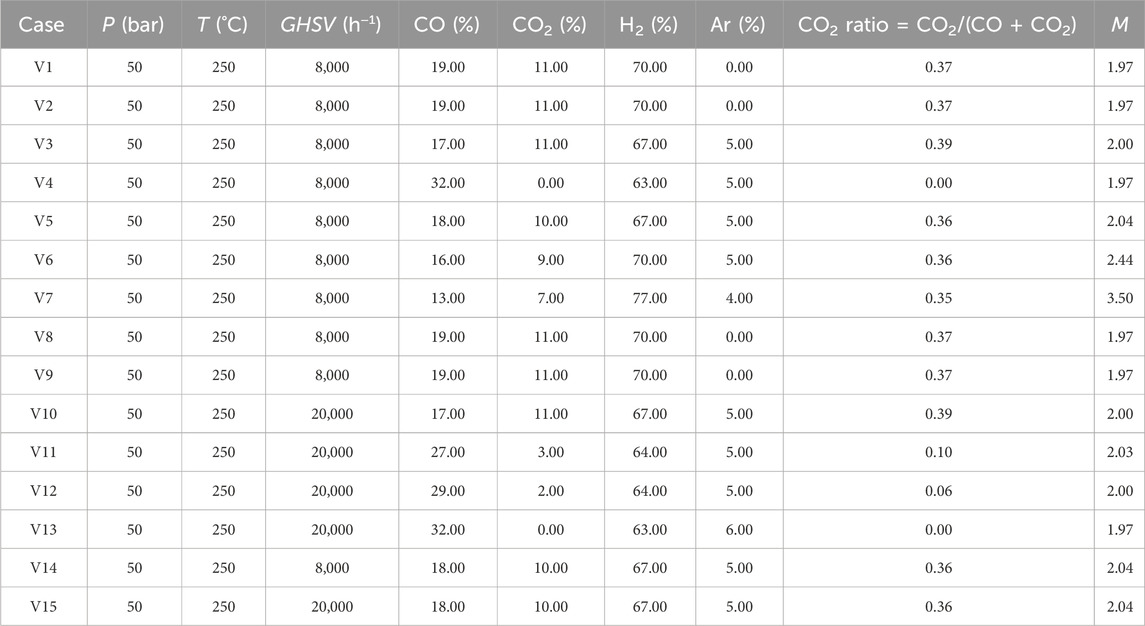
Table 1. Operating conditions of the numerical validation cases (V1–V15) (data from Park et al., 2014).
2.4.3 Optimization of operational conditions in fixed bed reactor
After validation, an optimization of three operating conditions for CO2 ratio, GHSV, and hydrogen/carbon ratio was conducted over five levels, following a 23 Central Composite Rotatable Design (CCRD) Design of Experiments (DoE), generating a design matrix with a total of 15 runs, as summarized in Table 2. ANOVA analyses were carried out in Statistica software by using the numerical data to statistically evaluate the effects of design variables in the output parameters. The output variables evaluated were carbon conversion, Ψ (Eq. 48), methanol/water selectivity (Eq. 49), and methanol production rate, that is, the mass flow rate of methanol at the reactor outlet. An alternative definition of the hydrogen-to-carbon ratio was necessary, M′ (Eq. 50), due to the constraint imposed by the molar fraction of components, allowing the range of the variables within the DoE.
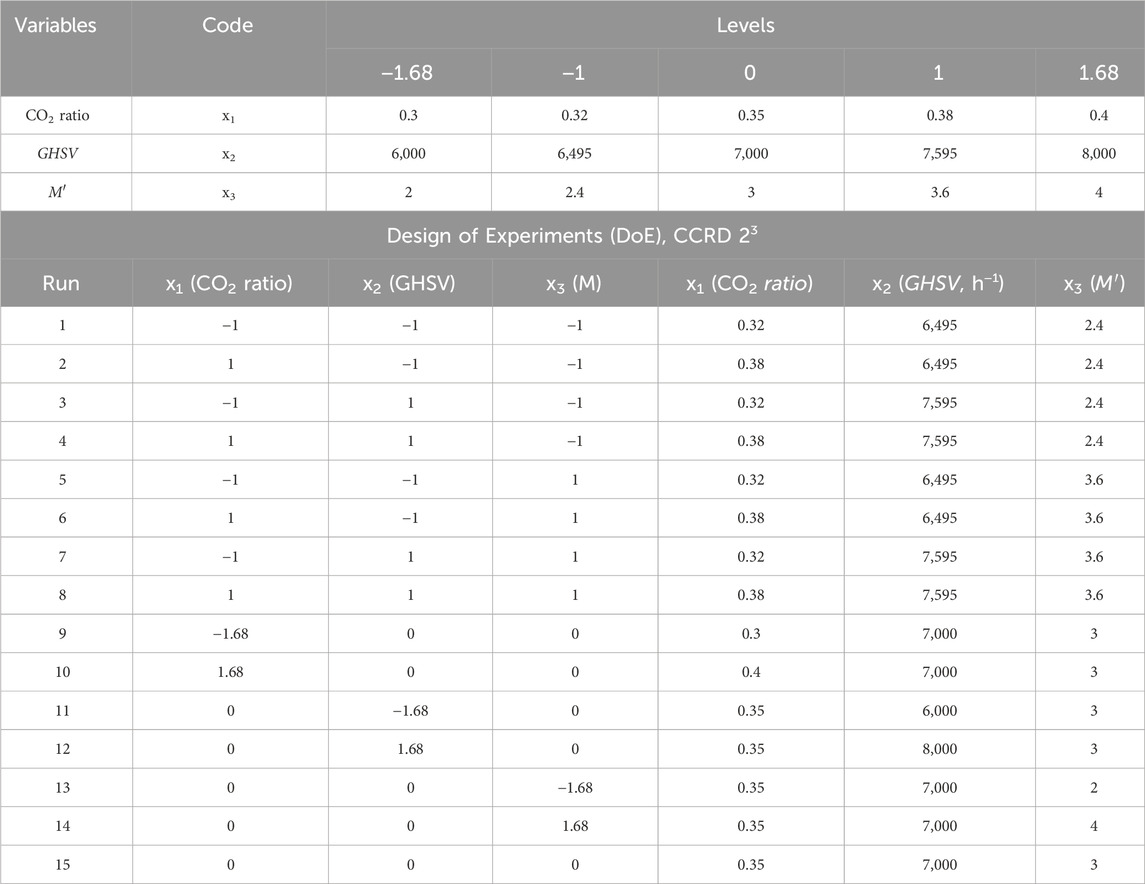
Table 2. Details of DoE (CCRD 23) for CO2 ratio, GHSV, and M′ to evaluate the optimal conditions for methanol synthesis in the FBR.
where
2.4.4 Performance analysis of wall-coated microreactors: planar (MRP) and monolithic (MRM)
After defining the optimized conditions using the fixed-bed reactor, due to the availability of experimental data for validation and its wide use at the industrial level, different microreactor designs (wall-coated: planar and monolithic structured) were modeled and simulated. Their performance was evaluated regarding the fixed-bed reactor by the parameters: conversion of carbon to methanol (%), methanol/water selectivity, methanol production rate (g/h), methanol production rate per unit of catalyst mass (gmethanol/h.gcatalyst), and reactor pressure drop, ΔP (Pa). The performance comparison of the reactors was made under the same operating conditions, useful volume, and contact time, τc. The latter is defined by the ratio of catalyst mass in the system to the real inlet flow rate of the reactor. τc ranged from 50 ms/g.mL to 1,000 ms/g.mL, based on the work of Bakhtiary-Davijany et al. (2011, 2020). In addition, for the planar and monolithic microreactors, an analysis of the catalytic surface coating, Γcat, on the process performance was performed for Γcat varying over 0.04–0.28 kgcat/m2. Table 3 presents the geometric characteristics of the evaluated reactors.
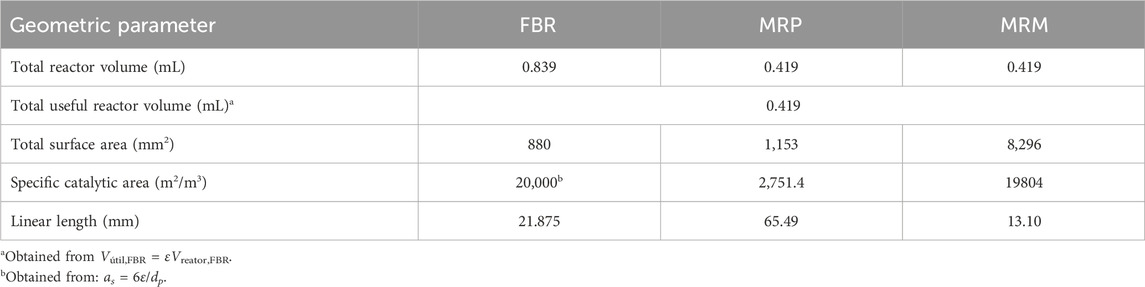
Table 3. Summary of the reactors’ geometric details.
2.4.5 Numbering-up
After analyzing the microreactor configurations on methanol synthesis performance, a scale-up strategy was carried out, integrating scale-out and numbering-up concepts. The MRP configuration was used in this stage due to the lower associated pressure drop and intensification potential inherent to the planar configuration. A linear increment factor (scale-out) of 2 was applied to the width and length of the MRP configuration, keeping the MR height at 0.8 mm. In addition, a reactor block was designed for 10 parallelized reactors (numbering-up). The flow distributor was designed based on Uriz et al. (2014) to provide an ideally distributed flow among all reactor units to maintain similar processing conditions. The flow regime was also kept under laminar conditions, with a maximum Reynolds number of 387. Figure 4 shows the details of the reactor block.
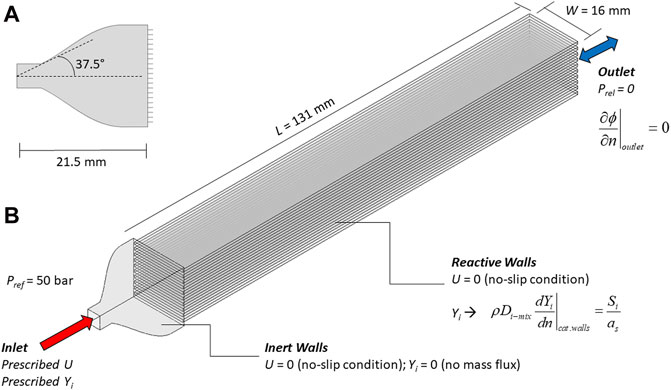
Figure 4. Details of the proposed reactor block using 10 units of scaled MRP: (A) distributor design, with diffusion angle based on Uriz et al. (2014) and (B) full reactor block with geometric and boundary condition details.
The reactor block performance was evaluated for different catalyst coating rates (0.04 kgcat/m2, 0.08 kgcat/m2, and 0.12 kgcat/m2) for a GHSV range of 5,000–50,000 mL/g.h (or h−1). The carbon conversion, methanol/water selectivity, pressure drop, methanol production rate, and flow non-uniformity coefficient ϕ, based on the definition of Chiou (1982), using the standard deviation concept, are defined according to Eqs 51–53:
where φi is the individual flow rate (or methanol production rate) at the outlet of the ith unit; φ is the total flow (or the total methanol production rate),
2.5 Numerical grids and solution details
The numerical grids of all reactor geometries were defined after independence mesh tests. Briefly, for FBR, a numerical grid with approximately 600,000 hybrid elements was used. For MRP, a hexahedral grid composed of approximately 460,000 elements was used, while a hybrid-element mesh composed of approximately 2.5 million cells was employed for MRM. For the block reactor, a hybrid-mesh with approximately 2.7 million cells was used. The GCI indexes (Celik et al., 2008) were estimated for all reactors, being <1% for pressure, velocity, and mass fraction for FBR and MRP and approximately 4% for MRP, except for mass fraction (also <1%). Further details of the mesh independence test are provided in Supplementary Material.
Steady-state simulations were carried out using a false time step with a physical scale of 1 × 10⁻³s, defined after initial tests as stable and with good convergence of the numerical solution. This strategy was defined due to the different time scales inherent in the kinetics of methanol synthesis. High-order schemes were used in the numerical solution. The residual target of RMS = 1 × 10⁻⁵ was set with a maximum imbalance of 0.01.
3 Results and discussion
3.1 Recommended operating conditions: pre-analysis of carbon to methanol conversion data
Important conclusions were observed from the analysis of carbon conversion data into methanol from experimental studies by Portha et al. (2017), Park et al. (2014), and Klier. (1982b) (for detailed analysis, please refer to Section 1 of Supplementary Material), carried out through different operating conditions. Pressure has a significant effect on carbon conversion to methanol. Higher pressures tend to result in higher conversions, especially for stoichiometric ratios of hydrogen/carbon (M) above 4.5. However, the influence of pressure on conversion varies depending on other parameters, such as GHSV. Increasing the GHSV tends to decrease carbon conversion, likely due to the decreased residence time of species in the reactor. This remarks the fundamental importance of residence time in catalytic conversion efficiency. The reactor operating temperature also plays a crucial role in carbon conversion to methanol. Temperatures around 250°C have been shown to be optimal for achieving high conversions.
The proportion of carbon dioxide (CO2) in the feed directly influences carbon conversion to methanol. CO2 ratios in the range of 0.3–0.4 have proven to be ideal for achieving high conversions, with a decrease in efficiency observed at extreme values. The stoichiometric ratio of hydrogen/carbon (M) in the feed also plays a critical role in carbon conversion. M values between 2 and 4 were recommended for microreactors due to operational limitations and considerations of residence time.
Based on these conclusions, the suggested optimal operating conditions for methanol synthesis in microreactors were 50 bar, 250°C, a CO2 ratio of 0.3–0.4, a GSHV range of 6,000–8,000 h−1, and a hydrogen/carbon stoichiometric ratio (M) of 2–4. These conditions were selected based on a detailed analysis of experimental conversion data, aiming to optimize the efficiency of the methanol synthesis process in microreactors.
3.2 Validation of the kinetic model coupled to fluid dynamics in the FBR
The simulated cases for model validation were described in Table 1, with operating conditions of 50 bar, 250°C, with a CO2 ratio = 0–0.39, a GHSV = 8,000–20,000 h−1, and an M = 1.97–3.5. Figure 5 presents the conversion data obtained by the implemented CFD model compared to experimental data from Park et al. (2014).
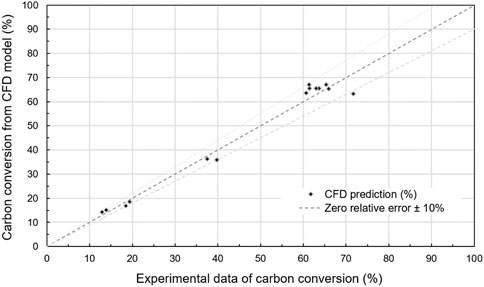
Figure 5. Numerical model validation and comparison between CFD predictions and experimental data for carbon conversion (%) from Park et al. (2014).
The numerical model coupling the LHHW kinetics of methanol synthesis to the fluid dynamics presented a good agreement with experimental data of carbon conversion. The relative deviations between CFD prediction and experimental data were observed with a range of ±10% (Figure 5) with an average deviation of 6.1%. Considering the complexity of the inherent chemical kinetics coupled to the fluid flow, the numerical results can be considered in good agreement with experiments, validating the model.
3.3 Optimization of operational conditions in the fixed bed reactor
After validation, an optimization of the operational conditions for CO2 ratio, GHSV, and M was conducted, following the experimental design (CCDR-DoE) shown below in Table 4, evaluating total carbon conversion, methanol/water selectivity, and methanol production rate. Figure 6 shows the surface response for the process performance indicators.
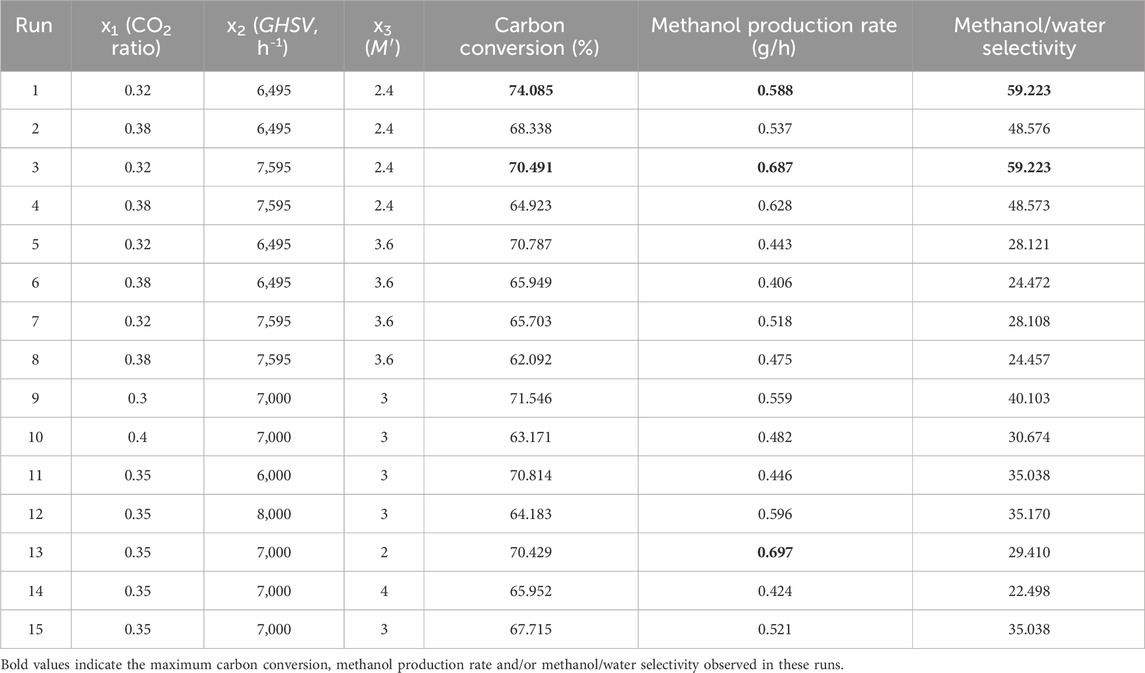
Table 4. Details of Design of Experiments runs for the operating condition evaluation.
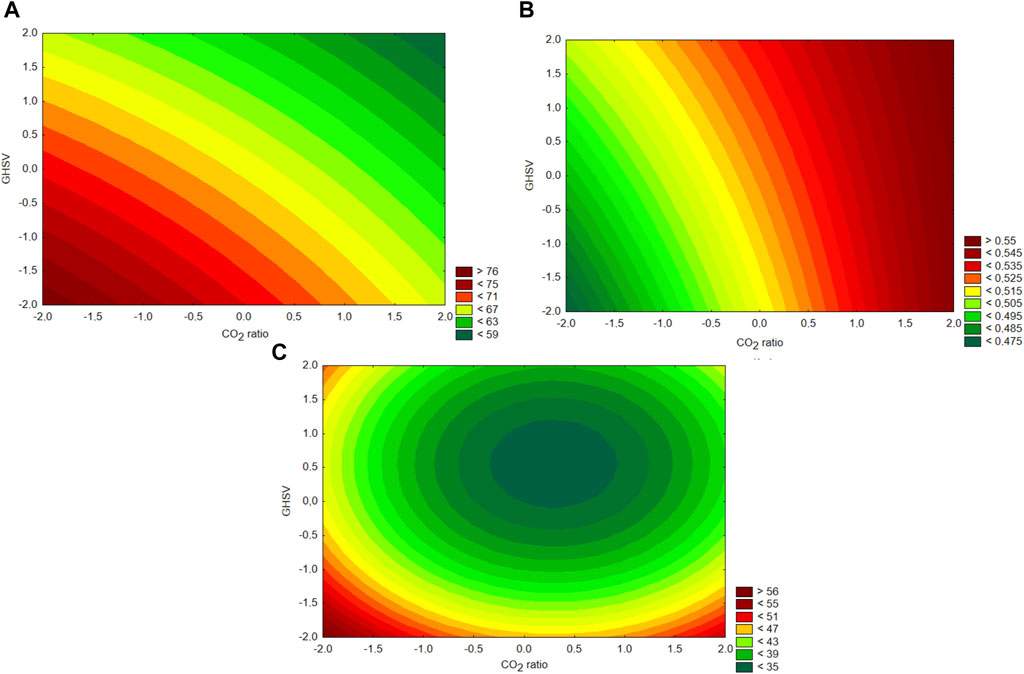
Figure 6. Response surfaces obtained from the DoE for the statistically significant variables (CO2 ratio and GHSV): (A) carbon conversion, (B) methanol production rate, and (C) methanol/water selectivity.
Analyzing the results from Table 4 along with the ANOVA analysis (ANOVA table is provided in Supplementary Material), the CO2 ratio and GHSV presented a statistically significant effect on the process performance variables. No statistical significative interaction among CO2 ratio, GHSV, and M was observed. From this analysis, along with Figure 6, the negative effects of the CO2 ratio and GHSV in carbon conversion (Figure 6A) and methanol/water selectivity (Figure 6C) were observed. These were attributed to the characteristics of the catalyst considered, developed for traditional syngas (CO as a primary source of carbon); also, the increase of M′ subsequently decreased the carbon amount in syngas feed, decreasing the carbon conversion, albeit with no statistical significance. The negative effect of GHSV can be attributed to the decreased contact time inherent in the increase in operating flow rate. However, in some cases, the increase of GHSV resulted in an increase in the production rate of methanol despite the decreased carbon conversion (Figure 6B). These results agree with the observed behavior of methanol synthesis, presented in the previous section based on a wide range of datasets from literature (Klier, 1982a; Park et al., 2014; Portha et al., 2017). Accordingly, the recommended operating conditions for methanol synthesis are 250°C, 50 bar, a CO2 ratio = 0.32; an M′ = 2.4, and a GHSV in the range of 6,495–7,595 h−1 to maximize the carbon conversion or methanol rate production, respectively.
3.4 Performance analysis of wall-coated microreactors: planar (MRP) and monolithic (MRM)
After defining the best operational condition, the performance of the catalytic wall-coated microreactors (MRP and MRM) was assessed, ranging the contact time from 50 ms/g.mL to 1,000 ms/g.mL, and subsequently, the catalytic surface coating.
3.4.1 Performance analysis of microreactors by the contact time
In this analysis, a catalytic surface coating of 0.04 kg/m2 was considered, based on Irani et al. (2011). Figures 7, 8 present the numerical results of carbon conversion into methanol (%), methanol/water selectivity, methanol production rate (g/h), methanol production rate per catalyst mass (gmethanol/h.gcatalyst), and reactor pressure drop, for operating conditions: 250°C, 50 bar, CO2 ratio = 0.32, and M′ = 2.4.
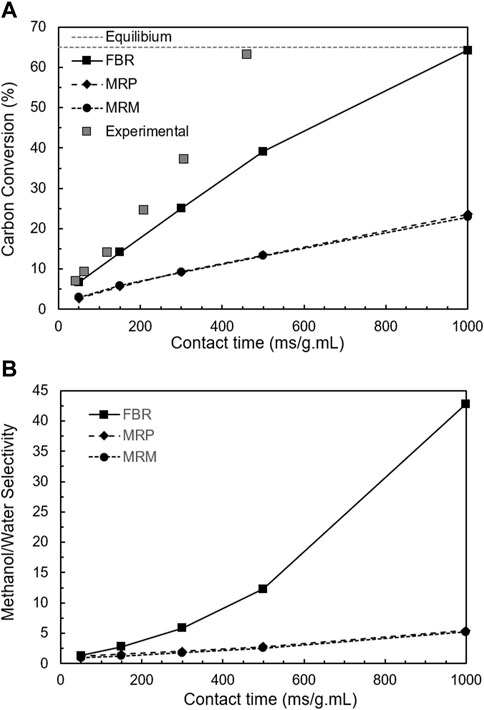
Figure 7. Performance analysis of the reactors (FBR, MRP, and MRM) as a function of contact time: (A) carbon conversion (%), along with experimental data from Bakhitary-Davijany et al. (2011) (528 K, 80 bar, feed composition: H2/CO/CO2/N2 = 65/25/5/5 mol%) and (dotted line) the thermodynamic limit of conversion (equilibrium at 523 K and 50 bar) and (B) methanol/water selectivity. (MRP and MRM, Γcat = 0.04 kg/m2).
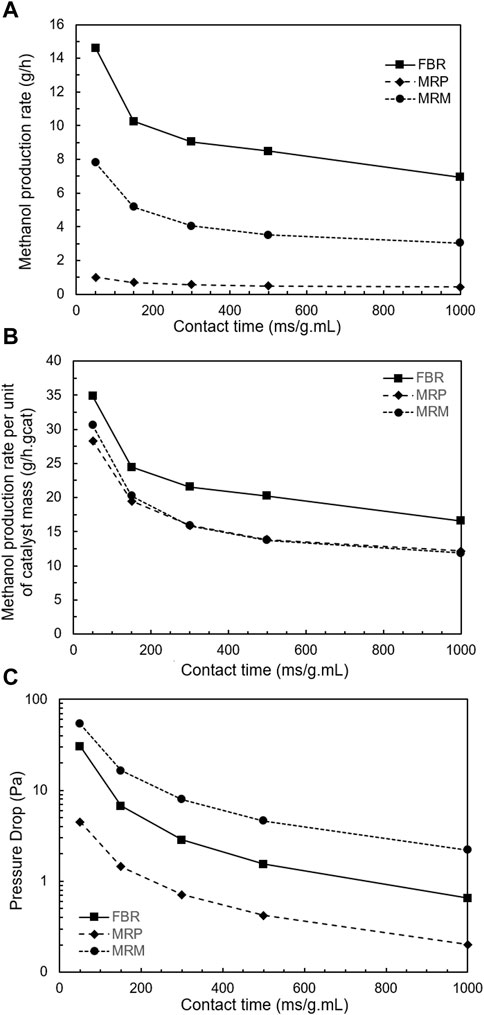
Figure 8. Performance analysis of the reactors (FBR, MRP, and MRM) as a function of contact time: (A) methanol production rate in g/h, (B) methanol production rate per unit of catalyst mass in gmethanol/h.gcatalyst (MRP and MRM, Γcat = 0.04 kg/m2), and (C) pressure drop in the reactors (FBR, MRP, and MRM) as a function of contact time. For MRP and MRM, Γcat = 0.04 kg/m2.
Figure 7 shows the carbon conversion obtained by the different reactors. As expected, the contact time increase resulted in an increase in carbon conversion (Figure 7A), as observed experimentally by Bakhitary-Davijany et al. (2011) in a slit/planar microreactor. For the maximum time evaluated (1,000 ms/g.mL), the FBR reached the maximum conversion, thermodynamically limited at 50 bar and 523 K. The conversions obtained by the catalytic wall-coated microreactors (MRP and MRM) were close, with lower performance regarding the FBR, reaching a maximum of approximately 22%–23% for Γcat = 0.04 kg/m2 (initial catalytic surface load based on Irani et al. (2011)). Similarly, the methanol selectivity to water increased with contact time (Figure 9B), remaining close to 40 mol methanol/mol water in FBR for τc = 1,000 ms/g.mL. The behavior was not linear due to the chemical reaction steps for methanol synthesis. The methanol/water selectivity in the wall-coated microreactors presented values lower than FBR, achieving a maximum of 5.4 mol methanol/mol water (MRP) and 5.1 mol methanol/mol water (MRM).
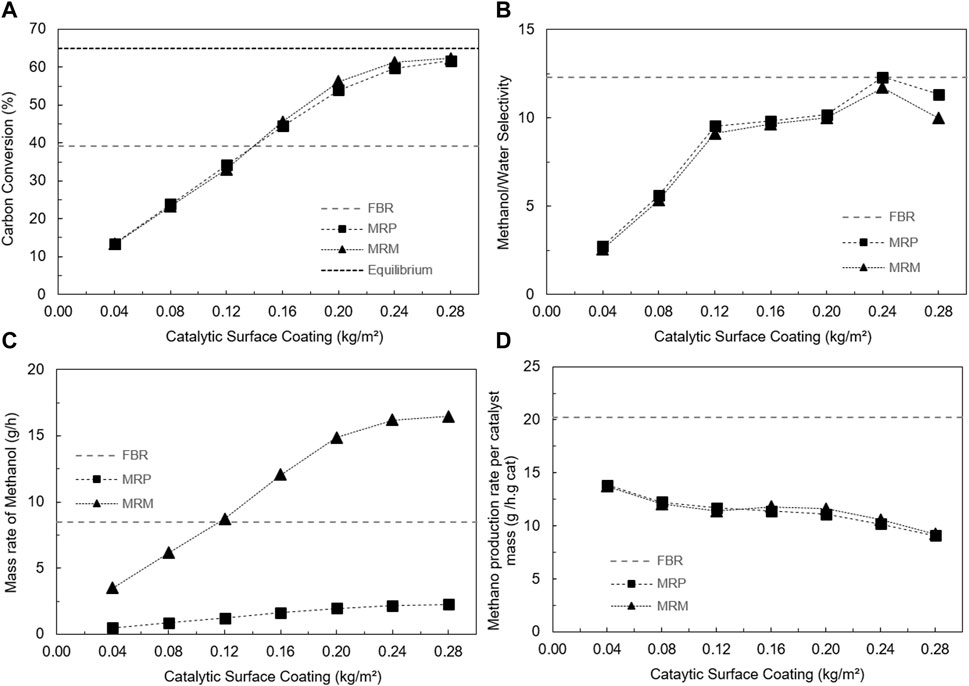
Figure 9. Performance analysis of the wall-coated reactors (MRP and MRM) as a function of catalytic surface coating time for τc = 500 ms/g.mL, compared to the FBR results: (A) carbon conversion (%), along the thermodynamic conversion limit (dotted line) (equilibrium at 523 K and 50 bar), (B) methanol/water selectivity, (C) methanol production rate in g/h, and (D) methanol production rate per unit mass of catalyst in gmethanol/h.gcatalyst.
Figure 8A shows the methanol production rate in g/h, and Figure 8B shows the methanol production rate per unit of catalyst mass. In terms of absolute production, the fixed bed showed higher methanol production rates. This decreased with the increase in contact time because longer contact times represent lower operating flow rates. For τc ≥ 300 ms/g.mL, the methanol production rate was virtually constant for the three reactors evaluated, indicating a balance between the contact time and kinetic timescale. The MRM showed a relatively high production rate considering the microfluidic channels present in a monolithic structure, with a maximum of approximately 4 g methanol/h for a conversion of only 23% (Figure 7A). This can be attributed to the hydraulic diameter of the MRM, of similar dimensions to the FBR, and the inherent parallelization effects of the monolith matrix. The MRP presented the lowest methanol production rate, which was related to the smaller cross-sectional area of this reactor, and the catalytic surface area was related to the catalytic load in the reactor, resulting in a lower operating flow rate and, consequently, lower throughput of methanol. The methanol production rate per mass of catalyst is a useful parameter when comparing the performance of different reactor configurations. Figure 8B shows that the performance of the reactors became closer, with MRP and MRM showing practically equivalent performance, especially when τc ≥ 300 ms/g.mL. Despite the lower production rates of the MRP, the potential of these is seen after a smart scale-up, including concepts of scale-out and numbering-up, presented in the subsequent sections.
From Figure 8C, the highest pressure drop was observed for the monolithic reactor, approximately 53.8 Pa, for τc = 50 ms/g.mL, decreasing to 2.2 Pa for τc = 1,000 ms/g.mL. This is attributed to the microscale (202 μm) square section porous matrix of the monolith. The MRP presented a very low pressure drop, ranging from 4.5 Pa to 0.2 Pa, with a contact time increase. In addition, the pressure gradients ranged from 1,393 Pa/mm to 30 Pa/mm (FBR), 68.5 Pa/mm to 3.1 Pa/mm (MRP), and 4,113 Pa/mm to 169 Pa/mm (MRM), as the contact time increased. These results highlighted the great potential of MRPs in parallelization strategies. In general, the three reactors presented low pressure drops, confirming the practically isobaric operation of the reactors. The FBR also showed low pressure drops due to the small bed length used (only 22 mm of linear length), despite the porous medium.
Considering these results, a contact time of 500 ms/g.mL was defined for subsequent analysis once it was found to be sufficient to obtain relatively high conversion and selectivity, low pressure drop, without limiting the operating throughput to decreased values, compared to 1,000 ms/g.mL. This contact time was also close to that reported by Bakhitary-Davijany et al. (2011) (470 ms/g.mL) to achieve good performance in a slit microreactor block operating at 80 bar, 528 K, and a feed composition of H2/CO/CO2/N2 = 65/25/5/5 mol%.
3.4.2 Performance analysis of microreactors by the catalytic coating rate
In this analysis, a contact time of 500 ms/g.mL was considered. The catalytic surface coating was varied between 0.04 kg/m2 and 0.28 kg/m2. Figure 9 presents the carbon conversion to methanol (%), methanol/water selectivity, methanol production rate (g/h), and methanol production rate per mass of catalyst (gmethanol/h.gcatalyst) for operating conditions of 250°C, 50 bar, a CO2 ratio = 0.32, and M′ = 2.4.
Figure 9A shows the carbon conversion as a function of the catalytic surface coating (i.e., directly related to the total catalyst mass of the reactor) for the MRP and MRM reactors. The increase in the catalyst mass resulted in carbon conversion with a logarithmic-like behavior, achieving a maximum value at 0.24 kg/m2, close to the thermodynamically limited conversion of approximately 59%–62%. The performance of MRP and MRM became equivalent to the FBR (39.1% conversion for τc = 500 ms/g.mL) for a catalytic surface coating of approximately 0.14 kg/m2. For the methanol/water selectivity (Figure 9B), a linear behavior was observed at 0.16–0.20 kg/m2, with a further increase reaching a maximum of 0.24 kg/m2, equivalent to the FBR selectivity, followed by a further decrease in selectivity to 0.28 kg/m2. Therefore, it was suggested that the ideal catalyst surface coating should be limited to 0.24 kg/m2. However, other factors must be considered regarding the viability of the catalytic coating method and/or integration of catalytic structured to the microreactor.
Few data are reported in the literature regarding catalytic surface coating (Irani et al., 2011), which is essential for the design, modeling, and optimization of wall-coated catalytic reactors. Therefore, for the subsequent analysis, the intermediate value of 0.12 kg/m2 was adopted because it presents a performance close to that observed in the FBR, being only three times higher than that reported by Irani et al. (2011); that is, it was estimated as a feasible catalytic coat loading to produce a microreactor.
Figure 9C shows the methanol production rate of MRP and MRM as a function of the increase in catalyst mass in the reactors. The increase in production presents a profile similar to that of carbon conversion, with the MRM exceeding the FBR production rate (8.48 g methanol/h) for catalytic surface coating above 0.12 kg/m2, reaching maximums above 16 g/h for Γcat ≥ 0.24 kg/m2. The lower MRP production rate was attributed to the smaller cross-sectional area of this reactor, limiting the methanol production rate to a maximum of 2.16 g/h methanol for Γcat = 0.24 kg/m2, with good potential for increasing by parallelization (numbering-up) due to the decreased pressure drop, as addressed in the next section. Figure 9D shows the methanol production rate per unit mass of catalyst. A similar behavior was observed between MRP and MRM, with the increase in catalyst mass leading to a relatively low decrease in these parameters, remaining approximately 7–9 gmethanol/h.gcatalyst. For these parameters, the microreactors did not reach the performance obtained by the FBR.
Considering these results, a catalytic surface coating of 0.12 kg/m2 was defined as a feasible coating concentration for microreactor production to provide performance close to the FBR, and it was used as a reference. In the next section, the scale-up analysis of the MRP reactor will be carried out due to its lower pressure drop compared to MRM and FBR. Even with the decreased methanol throughput, the MRP configuration was used in the subsequent analysis because it presents great potential in increasing the catalytic surface area by scale-out strategies along numbering-up (parallelization) with a relatively low pressure drop.
3.4.3 Performance analysis of the reactor block
Figures 10, 11 show the results of the performance analysis of the reactor block with 10 parallelized MRP units, varying the catalytic surface coating from 0.04 kg/m2 to 0.12 kg/m2 for an operational range of GHSV = 5,000–50,000 mL/g.h (or h−1).
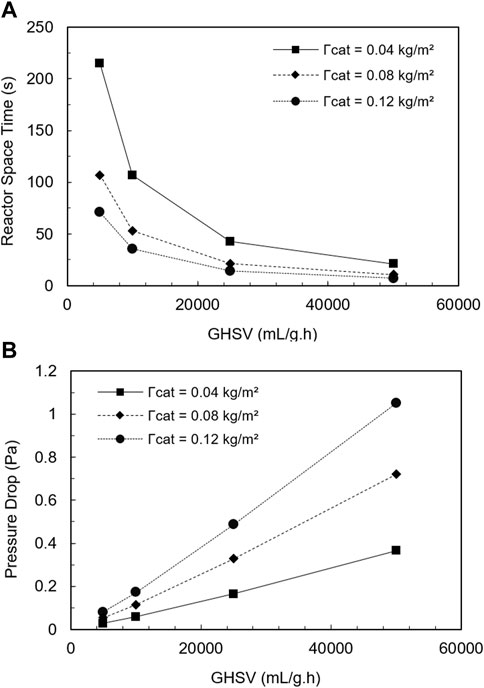
Figure 10. Performance analysis of the reactor block: (A) space time (operating flow rate/reactor volume) and (B) pressure drop.
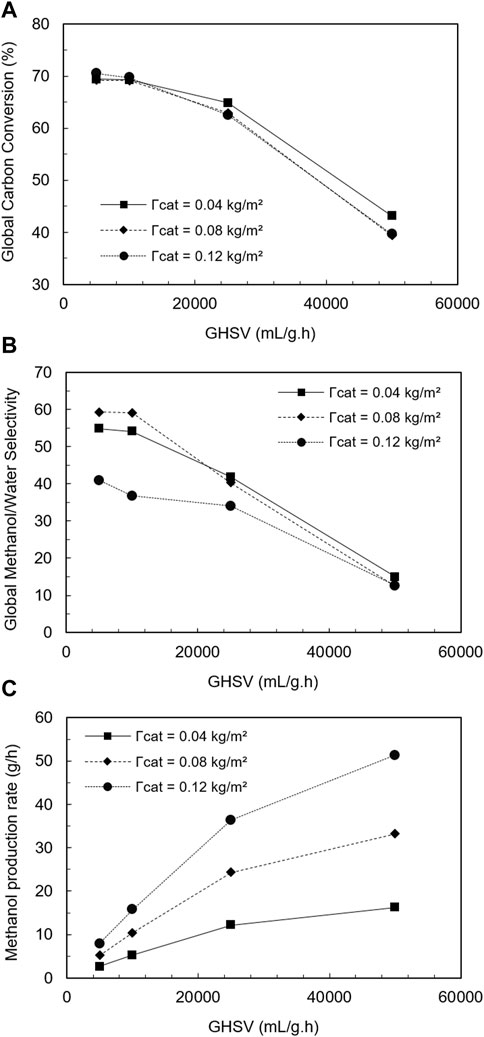
Figure 11. Performance analysis of the reactor block: (A) global carbon conversion, (B) global methanol/water selectivity, and (C) total methanol production rate in g/h. Global indicates the average among the 10 parallelized reaction units.
Figure 10A presents the reactor block space time to elucidate its performance, improving the comprehension of the subsequent analyses. In general, an increase in GHSV results in a shorter space time, which is the ideal residence time of the fluid in the reactor; in other words, a shorter contact time of the fluid with the catalytic surface. The GHSV is given by the ratio between the volumetric flow rate and the volume of the catalyst contained in the reactors. A decrease in the catalytic surface coating results in an increase in space time due to the lower operating flow rate required to maintain the specific GHSV. Therefore, for a fixed GHSV, a lower catalytic load results in more time for chemical reactions to complete, for example, at GHSV = 5,000 mL/g.h, there is a space time of 71.2 s for 0.12 kg/m2, against 214.8 s for 0.04 kg/m2. This effect of increasing the operating flow rate as a function of the catalytic load also affected the resulting pressure drop in the reactor block, as seen in Figure 10B. Higher catalytic loads presented elevated pressure drops. For the GHSV range evaluated, the pressure drop increased linearly, as expected for operation in a laminar flow regime. For the maximum GHSV of 50,000 mL/g.h, the pressure drop varied from 0.37 Pa to 1.05 Pa for Γcat = 0.04 and 0.12 kg/m2, respectively, highlighting the good hydraulic performance of planar microreactors, resulting in low pressure drops. This also proves the isobaric operating condition of the reactor block.
Figure 11A shows the global carbon conversion, that is, the average conversion between the ten parallelized MRP units. The increase in GHSV resulted in a decrease in conversion, with a more abrupt decrease observed above 25,000 mL/g.h, which can be attributed to the shorter contact time of the fluid with the catalytic wall, which is related to the kinetic timescale. In general, conversions in the range of 60%–70% observed for the lowest GHSV were decreased to less than 45% for GHSV = 50,000 h−1. The overall conversion was similar between the different catalytic surface coatings, being slightly superior for the highest catalytic load at low GHSV, in contrast to higher conversions for the lowest catalytic load (0.04 kg/m2) at higher GHSV (25,000 h−1 and 50,000 h−1). This behavior can be attributed to the characteristic timescale of the chemical kinetics. For higher catalytic loads, at a given GHSV, the residence time was decreased; however, for lower GHSV values, even with the decrease, the space time was sufficient to provide higher conversion due to the increased available catalytic area inherent from the higher catalytic load. However, with the increase in GHSV, especially above 25,000 h−1, the space time was decreased, and the larger catalytic area was not enough to maintain the superior performance. As a result, the kinetic effects prevailed over the mass transfer effects, and the lower catalytic covering (0.04 kg/m2) provided superior conversion because for GHSV = 50,000 mL/g.h, the space time reached a minimum value of 7 s for Γcat = 0.12 kg/m2 against 21 s for Γcat = 0.04 kg/m2.
Figure 11B shows that the methanol/water selectivity also decreased with increasing GHSV, especially above 25,000 mL/g.h. The highest catalytic surface coating resulted in the lowest selectivity, while the 0.08 kg/m2 coating resulted in the superior selectivity, approximately 59.3 (mol/s methanol)/(mol/s water) for GHSV = 5,000 and 10,000 mL/g.h. The selectivity demonstrates the influence of parallel reactions in methanol synthesis, which requires a balance between mass transfer phenomena and space time related to the kinetic timescale.
Figure 11C shows a proportional increase between the methanol production rate and the catalytic load. There was also an increase in the methanol production rate with an increase in GHSV, which was related to the operating flow increase. This behavior was approximately linear up to GHSV = 25,000 mL/g.h, tending to become asymptotic at 50,000 mL/g.h or higher values; that is, it tended to achieve a maximum value limited by the shortest space time or contact time. The maximum methanol production was obtained at GHSV = 50,000 mL/g.h, being 16.2 g/h, 33.2 g/h, and 51.4 g/h for Γcat = 0.04 kg/m2, 0.08 kg/m2, and 0.12 kg/m2, respectively. For GHSV = 25,000 mL/g.h, that is, with the reactor block operating at half the volumetric flow rate, methanol production rates were 12.2 g/h, 24.3 g/h, and 36.4 g/h for Γcat = 0.04 kg/m2, 0.08 kg/m2, and 0.12 kg/m2, respectively, corresponding to approximately 70%–75% of the production rate at GHSV = 50,000 mL/g.h. For the GHSV variation from 5,000 mL/g.h to 25,000 mL/g.h, the increase in the production rate followed approximately the same GHSV increment factor, which is the increase in operating flow rate for each specific catalyst load. Accordingly, it can be suggested that the superior operating condition of the reactor block occurs at GHSV = 25,000 mL/g.h and Γcat = 0.08 kg/m2, providing a balance between scale-up of operational flow rate and allowing the required residence time for the kinetic time scale, aligned with a sufficient catalytic surface area that is not much larger than that reported in the literature (Irani et al., 2011). This is viable from the perspective of microreactor construction.
Finally, the reactor block operability was assessed regarding the non-uniformity of flow and reactor performance along all parallelized units. Figure 12 presents the velocity distributor and vector fields in the conical distributor for all operating conditions. Figure 13 presents the non-uniformity coefficient for the flow distribution and methanol production rate.
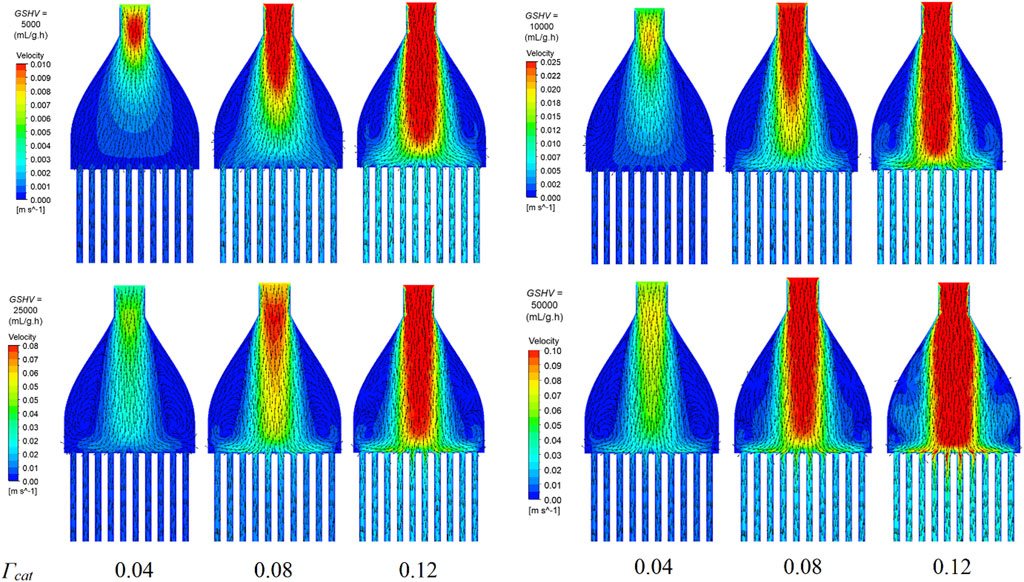
Figure 12. Velocity fields on a central plane in the conical section of the flow distributor for all operating conditions (GHSV: 5,000 mL/g.h, 10,000 mL/g.h, 25,000 mL/g.h, and 50,000 mL/g.h, and Γcat = 0.04 kg/m2, 0.08 kg/m2, and 0.12 kg/m2).
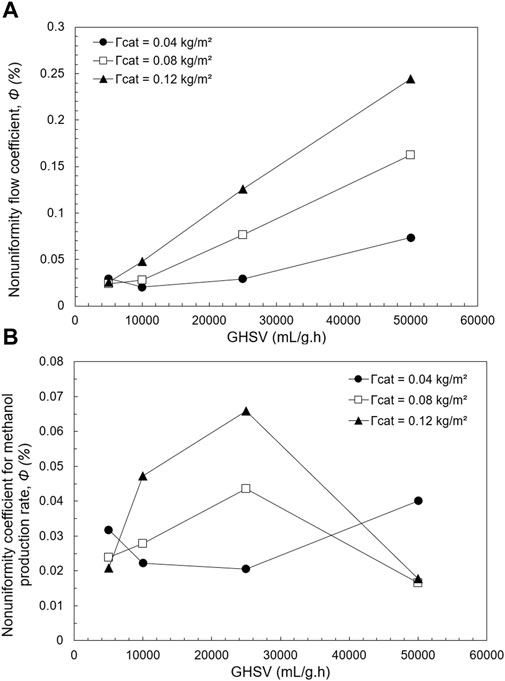
Figure 13. Non-uniformity coefficients for (A) flow rate and (B) methanol production rate.
Figure 12 shows that a completely laminar flow, that is, without recirculation in the distributor, was obtained only for the lowest operational velocity (GHSV = 5,000 mL/g.h, Γcat = 0.04 kg/m2). With the increase in GHSV, a recirculation area was observed in the conical region of the distributor, with the presence of a central region of higher velocity. For higher surface catalytic loading, higher operational flow rates were required for a specific GHSV; therefore, for Γcat = 0.12 kg/m2, the largest recirculation zones were observed in the conical region. In general, two large, virtually symmetrical vortices were observed in the distributor for the operational conditions of Γcat = 0.04 kg/m2 (GHSV from 10,000 mL/g.h to 50,000 mL/g.h), Γcat = 0.08 kg/m2 (GHSV from 5,000 mL/g.h to 25,000 mL/g.h), and Γcat = = 0.12 kg/m2 (GHSV from 5,000 mL/g.h to 10,000 mL/g.h). For the highest operational flow rates and higher catalytic loading, Γcat = 0.08 kg/m2 (GHSV = 50,000 mL/g.h) and Γcat = 0.12 kg/m2 (GHSV ≥ 25,000 mL/g.h), the two vortices formed in the conical distributor. One occurred near the entrance of the planar channels of the reactor block and contributed to the higher non-uniform flow index observed in Figure 13A.
The non-uniformity flow coefficient increased proportionally with the increase in GHSV (Figure 13A) due to the fluid dynamic behavior observed. In general, the formation of large symmetrical vortices in the distributor, observed at lower flow rates and catalytic load, did not significantly affect the flow distribution through the microreactor channels and the methanol production rate (Figure 13B). This behavior can be attributed to differences in flow distribution and residence time in the channels, resulting in a compensatory effect of the peripheral channels with higher process yield (longer residence times inherent from decreased flow rate), resulting in an overall yield equivalent to an ideal distribution among the channels, consistent with the observations of Uriz et al. (2014). It is worth noting that despite this increase, the non-uniformity coefficients were still below 1%, classifying the distributor as good performance according to the literature (Su et al., 2016; Lopes et al., 2019). To minimize or even avoid the recirculation zones, an optimization of the conical angle and distributor total length should be performed considering the required operating flow rate, aiming to equalize the flow rate and contact time through all parallelized units.
In addition, the carbon conversion was evaluated at each parallelized MRP unit by quantifying the relative deviation according to Eq. 54:
where Ψ is the carbon conversion, calculated from Eq. 48e. The subscripts i and avg denote the ith parallelized MRP unit and the average conversion of the reactor block. The carbon conversions in each of the reactor units closely approached the average conversion of the reactor block, deviating from it by approximately 0.4%–0.6%. The largest deviations were observed under the condition of GHSV = 25,000 mL/g.h for Γcat = 0.12 kg/m2, with maximum deviations of 1.07% and −0.52% relative to the average (62.5%, Figure 11A), consistent with the non-uniformity coefficient of methanol production (Figure 13B).
Although deviations in conversion among the parallelized units were observed, the methanol production rate showed good uniformity among the units (Figure 13B), below 0.1%, which is considered a good performance for a flow distributor in microplants (Su et al., 2016; Lopes et al., 2019). Thus, it can be concluded that for the evaluated methanol synthesis operational range, the distributor exhibited satisfactory performance in accordance with the design based on the observations and recommendations from Rebrov et al. (2011) and Uriz et al. (2014).
4 Conclusion
The pre-analysis of carbon conversion into methanol using experimental data from the literature revealed important conclusions. Pressure significantly affects conversion, with higher pressures generally leading to higher conversions, particularly for hydrogen/carbon ratios (M) above 4.5. However, the influence of pressure varies with GHSV, which tends to decrease conversion as it increases, emphasizing the importance of fluid residence time. Optimal operating temperatures for high conversions are approximately 250°C. The proportion of carbon dioxide (CO2 ratio) in the feed and the stoichiometric ratio of hydrogen/carbon (M) also play crucial roles in methanol synthesis performance. Recommended operating conditions for methanol synthesis in microreactors were suggested: 50 bar pressure, 250°C temperature, a CO2 ratio of 0.3–0.4, a GHSV range of 6,000–8,000 mL/g.h, and an M ratio of 2–4.
The numerical model coupling LHHW kinetics of methanol synthesis with fluid dynamics shows good agreement with experimental data, with deviations within ±10% and an average deviation of 6.1%, validating the numerical models despite the complexity of the simulated process. After this, a Design of Experiments using a Central Composite Rotatable Design (CCRD) was employed to evaluate the optimal conditions (CO2 ratio, GHSV, M′) for methanol synthesis in the FBR by numerical simulations. The optimal operating condition was: 250°C, 50 bar, CO2 ratio = 0.32, GHSV = 7,595 h−1, and M′ = 2.4. The validated numerical model was used to assess the performance of two microreactor configurations, planar (MRP) and monolithic structured (MRM), operating under different conditions, first varying the contact time (50–1,000 ms/g.mL) and then changing the catalytic surface load (0.04–0.28 kg/m2). The microreactor performance was compared with the FBR.
Increasing contact time led to higher carbon conversion rates. The FBR achieved maximum conversion at the longest contact time evaluated, while wall-coated microreactors (MRP and MRM) showed slightly lower conversions. Methanol/water selectivity also increased with contact time, although non-linearly due to the complexity of methanol synthesis reactions. Methanol production rates were higher in FBR but decreased with longer contact times, while production rates in wall-coated microreactors remained relatively constant, indicating a balance between contact time and kinetic timescale. Despite lower production rates, wall-coated microreactors showed potential for smart scale-up strategies like scale-out and numbering-up. Pressure drop analysis revealed the highest pressure drops by the monolithic reactor, while MRP demonstrated low pressure drops, making it suitable for parallelization strategies.
The evaluation of surface catalytic loading revealed a logarithmic-like behavior of carbon conversion, indicating a maximum value at a catalytic surface coating of 0.24 kg/m2, close to the thermodynamically limited conversion. The performance of MRP and MRM became comparable to the FBR for a catalytic surface coating of approximately 0.14 kg/m2. Meanwhile, the methanol/water selectivity exhibited a linear behavior within a certain range of catalytic surface coating, reaching a maximum at 0.24 kg/m2, equivalent to the FBR selectivity. Therefore, it was suggested that the ideal catalyst surface coating should be limited to 0.24 kg/m2, considering factors such as the viability of the catalytic coating method and integration into the microreactor. MRM presented a better methanol production rate than the FBR for catalytic surface coatings above 0.12 kg/m2. The methanol production rate of MRP was limited due to its smaller cross-sectional area; however, it had a very reduced pressure drop compared to MRM and FBR. The MRP configuration was chosen for scale-up due to the potential prompt increase in the catalytic surface area through scale-out and numbering-up strategies while maintaining a relatively low pressure drop.
A reactor block composed of 10 units of MRP was proposed. A flow distributor was designed based on Uriz et al. (2014) to provide an ideally distributed flow and chemical species concentration. The performance of the reactor block was evaluated for the GHSV ranging from 5,000 to 50,000 mL/g.h. The carbon conversion decreased from 60% to 70% at lower GHSV values to less than 45% at GHSV = 50,000 mL/g.h. Conversions were similar across different catalytic surface coatings, with slightly higher conversions observed for the highest catalytic load at low GHSV. This behavior underscores the interplay between kinetic effects and mass transfer phenomena. The methanol/water selectivity decreased with GHSV increase, particularly above 25,000 mL/g.h. The highest catalytic surface coating resulted in the lowest selectivity, highlighting the need to balance mass transfer phenomena and space time related to the kinetic timescale in methanol synthesis. The methanol production rate increased with catalytic load. The maximum methanol production rates were obtained at GHSV = 50,000 mL/g.h, achieving approximately 50 g/h for a catalytic load of 0.12 kg/m2. The optimal operating condition of the reactor block was suggested at GHSV = 25,000 mL/g.h and Γcat = 0.08 kg/m2, providing a balance between increased flow rate, sufficient catalytic surface area, and residence time.
From the flow distribution in the reactor block, a completely laminar flow was achieved only under lower flow rates, while higher rates led to the formation of recirculation zones, particularly notable in the conical region of the distributor. With increased catalytic loading, higher flow rates were required for a specific GHSV, resulting in larger recirculation zones. Despite the formation of vortices at certain operating parameters, the flow distribution through the microreactor units and the resulting methanol production rate remained almost unaffected. This phenomenon was linked to compensatory effects among channels with varying residence times, resulting in an overall yield comparable to an ideal distribution. The analysis of carbon conversion from each parallelized unit revealed a close approximation to the average conversion of the reactor block, with deviations typically between 0.4% and 0.6%. Higher deviations were observed under specific conditions, correlating with the non-uniformity coefficient of methanol production. However, despite these deviations, methanol production rates exhibited good uniformity among units, with deviations below 0.1%. Accordingly, within the evaluated operational range for methanol synthesis, the flow distributor demonstrated satisfactory performance, aligning with design considerations based on previous research.
Finally, the present article provided a comprehensive analysis of the fundamental interplay between kinetic effects, mass transfer phenomena, and reactor design in methanol synthesis by applying concepts of microreactor technology. The findings support the viability of MRT for methanol production, offering important insights for optimizing the performance and scale-up of this catalytic process.
Data availability statement
The original contributions presented in the study are included in the article/Supplementary Material, further inquiries can be directed to the corresponding author.
Author contributions
JS: conceptualization, formal analysis, investigation, methodology, project administration, software, writing–original draft, writing–review and editing, and validation. HS: writing–review and editing and formal analysis. MH: investigation, project administration, writing–review and editing, formal analysis, and funding acquisition.
Funding
The author(s) declare that financial support was received for the research, authorship, and/or publication of this article from the FAPEMIG Minas Gerais Research Foundation, Grant number: APQ-02144-17. CAPES - Finance Code 001. This study was financed in part by the Coordenação de Aperfeiçoamento de Pessoal de Nível Superior - Brasil (CAPES) - Finance Code 001.
Acknowledgments
The authors also would like to thank the financial support of FAPEMIG (Minas Gerais Research Foundation, Process APQ-02144-17).
Conflict of interest
The authors declare that the research was conducted in the absence of any commercial or financial relationships that could be construed as a potential conflict of interest.
Publisher’s note
All claims expressed in this article are solely those of the authors and do not necessarily represent those of their affiliated organizations, or those of the publisher, the editors, and the reviewers. Any product that may be evaluated in this article, or claim that may be made by its manufacturer, is not guaranteed or endorsed by the publisher.
Supplementary material
The Supplementary Material for this article can be found online at: https://www.frontiersin.org/articles/10.3389/fceng.2024.1440657/full#supplementary-material
References
Ali, K. A., Abdullah, A. Z., and Mohamed, A. R. (2015). Recent development in catalytic technologies for methanol synthesis from renewable sources: a critical review. Renew. Sustain. Energy Rev. 44, 508–518. doi:10.1016/j.rser.2015.01.010
Álvarez, A., Bansode, A., Urakawa, A., Bavykina, A. V., Wezendonk, T. A., Makkee, M., et al. (2017). Challenges in the greener production of formates/formic acid, methanol, and DME by heterogeneously catalyzed CO2 hydrogenation processes. Chem. Rev. 117 (14), 9804–9838. doi:10.1021/acs.chemrev.6b00816
Arzamendi, G., Diéguez, P. M., Montes, M., Centeno, M. A., Odriozola, J. A., and Gandía, L. M. (2009). Integration of methanol steam reforming and combustion in a microchannel reactor for H2 production: a CFD simulation study. Catal. Today 143 (1-2), 25–31. doi:10.1016/j.cattod.2008.09.034
Azhari, N. J., Erika, D., Mardiana, S., Ilmi, T., Gunawan, M. L., Makertihartha, I., et al. (2022). Methanol synthesis from CO2: a mechanistic overview. Results Eng. 16, 100711. doi:10.1016/j.rineng.2022.100711
Bakhtiary-Davijany, H., Hayer, F., Phan, X. K., Myrstad, R., Venvik, H. J., Pfeifer, P., et al. (2011). Characteristics of an integrated micro packed bed reactor-heat exchanger for methanol synthesis from syngas. Chem. Eng. J. 167 (2-3), 496–503. doi:10.1016/j.cej.2010.08.074
Bakhtiary-Davijany, H., Hayer, F., Phan, X. K., Myrstad, R., Venvik, H. J., Pfeifer, P., et al. (2020). Modelling and simulation of a single slit micro packed bed reactor for methanol synthesis. Catal. Today 343, 226–233. doi:10.1016/j.cattod.2019.05.026
Bansode, A., and Urakawa, A. (2014). Towards full one-pass conversion of carbon dioxide to methanol and methanol-derived products. Journal of Catalysis 309, 66–70. doi:10.1016/j.jcat.2013.09.005
Billo, R. E., Oliver, C. R., Charoenwat, R., Dennis, B. H., Wilson, P. A., Priest, J. W., et al. (2015). A cellular manufacturing process for a full-scale biodiesel microreactor. J. Manuf. Syst. 37, 409–416. doi:10.1016/j.jmsy.2014.07.004
Boger, T., Heibel, A. K., and Sorensen, C. M. (2004). Monolithic catalysts for the chemical industry. Industrial Eng. Chem. Res. 43 (16), 4602–4611. doi:10.1021/ie030730q
Brunetti, A., Migliori, M., Cozza, D., Catizzone, E., Giordano, G., and Barbieri, G. (2020). Methanol conversion to Dimethyl ether in Catalytic zeolite membrane reactors. ACS Sustain. Chem. Eng. 8, 10471–10479. doi:10.1021/acssuschemeng.0c02557
Bussche, K. M. V., and Froment, G. F. (1996). A steady-state kinetic model for methanol synthesis and the water gas shift reaction on a commercial Cu/ZnO/Al2O3Catalyst. J. Catal. 161 (1), 1–10. doi:10.1006/jcat.1996.0156
Celik, I. B., Ghia, U., Roache, P. J., et al. (2008). Procedure for estimation and reporting of uncertainty due to discretization in CFD applications. (2008). J. Fluids Eng. 130 (7), 078001. doi:10.1115/1.2960953
Centi, G., Giordano, G., Fejes, P., Katovic, A., Lazar, K., Nagy, J. B., et al. (2004). “Active and spectator iron species in Fe/MFI catalysts for benzene selective hydroxylation with N2O,” in Proceedings of the 14th International Zeolite Conference, Germany, August 2005, 2566–2573. doi:10.1016/s0167-2991(04)80525-1
Chen, X., Zhang, Z., Yi, D., and Hu, Z. (2015). Numerical studies on different two-dimensional micromixers basing on a fractal-like tree network. Microsyst. Technol. 23 (3), 755–763. doi:10.1007/s00542-015-2742-x
Chiou, J. P. (1982). The effect of nonuniform fluid flow distribution on the thermal performance of solar collector. Sol. Energy 29, 487–502. doi:10.1016/0038-092X(82)90057-3
Choi, Y., and Stenger, H. G. (2002). Fuel cell grade hydrogen from methanol on a commercial Cu/ZnO/Al2O3 catalyst. Appl. Catal. B Environ. 38 (4), 259–269. doi:10.1016/s0926-3373(02)00054-1
Cui, X., and Kær, S. K. (2020). A comparative study on three reactor types for methanol synthesis from syngas and CO2. Chem. Eng. J. 393, 124632. doi:10.1016/j.cej.2020.124632
de Oliveira, G. X., Lira, J. O. B., Riella, H. G., Soares, C., and Padoin, N. (2022). Modeling and simulation of reaction environment in photoredox catalysis:A critical review. Front. Chem. Eng. 3, 788653. doi:10.3389/fceng.2021.788653
Dong, X., Li, F., Zhao, N., Xiao, F., Wang, J., and Tan, Y. (2016). CO 2 hydrogenation to methanol over Cu/ZnO/ZrO 2 catalysts prepared by precipitation-reduction method. Appl. Catal. B Environ. 191, 8–17. doi:10.1016/j.apcatb.2016.03.014
Estela-Uribe, J. F. (2012). Application to mixtures of non-polar fluids of a three-parameter three-fluid corresponding states model based on reference equations of state. Fluid Phase Equilibria 313, 73–90. doi:10.1016/j.fluid.2011.09.032
Graaf, G. H., Sijtsema, P. J. J. M., Stamhuis, E. J., and Joosten, G. E. H. (1986). Chemical equilibria in methanol synthesis. Chem. Eng. Sci. 41 (11), 2883–2890. doi:10.1016/0009-2509(86)80019-7
Gu, T., and Balakotaiah, V. (2016). Impact of heat and mass dispersion and thermal effects on the scale-up of monolith reactors. Chem. Eng. J. 284, 513–535. doi:10.1016/j.cej.2015.09.005
Gundlapally, S. R., and Balakotaiah, V. (2013). Analysis of the effect of substrate material on the steady-state and transient performance of monolith reactors. Chem. Eng. Sci. 92, 198–210. doi:10.1016/j.ces.2013.01.051
Hafeez, S., Harkou, E., Al-Salem, S. M., Goula, M. A., Dimitratos, N., Charisiou, N. D., et al. (2022). Hydrogenation of carbon dioxide (CO2) to fuels in microreactors: a review of set-ups and value-added chemicals production. React. Chem. Eng. 7 (4), 795–812. doi:10.1039/d1re00479d
Hafeez, S., Manos, G., Al-Salem, S. M., Aristodemou, E., and Constantinou, A. (2018). Liquid fuel synthesis in microreactors. React. Chem. Eng. 3 (4), 414–432. doi:10.1039/c8re00040a
Irani, M., Alizadehdakhel, A., Pour, A. N., Hoseini, N., and Adinehnia, M. (2011). CFD modeling of hydrogen production using steam reforming of methane in monolith reactors: surface or volume-base reaction model? Int. J. Hydrogen Energy 36 (24), 15602–15610. doi:10.1016/j.ijhydene.2011.09.030
Jadhav, S. G., Vaidya, P. D., Bhanage, B. M., and Joshi, J. B. (2014). Catalytic carbon dioxide hydrogenation to methanol: a review of recent studies. Chem. Eng. Res. Des. 92 (11), 2557–2567. doi:10.1016/j.cherd.2014.03.005
Keil, F. J. (1999). Methanol-to-hydrocarbons: process technology. Microporous Mesoporous Mater. 29 (1-2), 49–66. doi:10.1016/s1387-1811(98)00320-5
Klier, K. (1982b). Catalytic synthesis of methanol from CO/H2: IV. The effects of carbon dioxide. J. Catal. 74 (2), 343–360. doi:10.1016/0021-9517(82)90040-9
Kohli, K., Sharma, B. K., and Panchal, C. B. (2022). Dimethyl carbonate: review of synthesis routes and catalysts used. Energies 15 (14), 5133. doi:10.3390/en15145133
Ledakowicz, S., Nowicki, L., Petera, J., Nizioł, J., Kowalik, P., and Gołębiowski, A. (2013). Kinetic characterisation of catalysts for methanol synthesis. Chem. Process Eng. 34 (4), 497–506. doi:10.2478/cpe-2013-0040
Lei, L., Wang, N., Zhang, X. M., Tai, Q., Tsai, D. P., and Chan, H. L. W. (2010). Optofluidic planar reactors for photocatalytic water treatment using solar energy. Biomicrofluidics 4 (4), 043004. doi:10.1063/1.3491471
Liu, G., Hagelin-Weaver, H., and Welt, B. (2023). A concise review of catalytic synthesis of methanol from synthesis gas. Waste 1, 228–248. doi:10.3390/waste1010015
Lopes, M. G. M., Santana, H. S., Andolphato, V. F., Russo, F. N., Silva, J. L., and Taranto, O. P. (2019). 3D printed micro-chemical plant for biodiesel synthesis in millireactors. Energy Convers. Manag. 184, 475–487. doi:10.1016/j.enconman.2019.01.090
Lopes, M. G. M., Santana, H. S., Andolphato, V. F., Silva, J. L., and Taranto, O. P. (2018). CFD analysis of flow distributor designs for numbering-up of biodiesel synthesis. Chem. Eng. Res. Des. 138, 458–471. doi:10.1016/j.cherd.2018.09.011
Martin, O., Martín, A. J., Mondelli, C., Mitchell, S., Segawa, T. F., Hauert, R., et al. (2016). Indium oxide as a superior catalyst for methanol synthesis by CO2 hydrogenation. Angew. Chem. Int. Ed. 55 (21), 6261–6265. doi:10.1002/anie.201600943
Mei, H., Li, C., and Liu, H. (2005). Simulation of heat transfer and hydrodynamics for metal structured packed bed. Catal. Today 105 (3-4), 689–696. doi:10.1016/j.cattod.2005.06.042
Moulijn, J. A., and Kapteijn, F. (2013). Monolithic reactors in catalysis: excellent control. Curr. Opin. Chem. Eng. 2 (3), 346–353. doi:10.1016/j.coche.2013.05.003
Nestler, F., Schütze, A. R., Ouda, M., Hadrich, M., Schaadt, A., Bajohr, S., et al. (2020). Kinetic modelling of methanol synthesis over commercial catalysts: a critical assessment. Chem. Eng. J. 124881, 124881. doi:10.1016/j.cej.2020.124881
Olah, G. A., Goeppert, A., and Prakash, G. K. S. (2009). Chemical recycling of carbon dioxide to methanol and dimethyl ether: from greenhouse gas to renewable, environmentally carbon neutral fuels and synthetic hydrocarbons. J. Org. Chem. 74 (2), 487–498. doi:10.1021/jo801260f
Palma, V., Miccio, M., Ricca, A., Meloni, E., and Ciambelli, P. (2014). Monolithic catalysts for methane steam reforming intensification: experimental and numerical investigations. Fuel 138, 80–90. doi:10.1016/j.fuel.2014.06.043
Park, N., Park, M.-J., Lee, Y.-J., Ha, K.-S., and Jun, K.-W. (2014). Kinetic modeling of methanol synthesis over commercial catalysts based on three-site adsorption. Fuel Process. Technol. 125, 139–147. doi:10.1016/j.fuproc.2014.03.041
Portha, J.-F., Parkhomenko, K., Kobl, K., Roger, A.-C., Arab, S., Commenge, J.-M., et al. (2017). Kinetics of methanol synthesis from carbon dioxide hydrogenation over copper–zinc oxide catalysts. Industrial Eng. Chem. Res. 56 (45), 13133–13145. doi:10.1021/acs.iecr.7b01323
Rebrov, E. V., Schouten, J. C., and de Croon, M. H. J. M. (2011). Single-phase fluid flow distribution and heat transfer in microstructured reactors. Chem. Eng. Sci. 66 (7), 1374–1393. doi:10.1016/j.ces.2010.05.044
Ricca, A., Palma, V., Martino, M., and Meloni, E. (2017). Innovative catalyst design for methane steam reforming intensification. Fuel 198, 175–182. doi:10.1016/j.fuel.2016.11.006
Rodriguez, J. A., Liu, P., Stacchiola, D. J., Senanayake, S. D., White, M. G., and Chen, J. G. (2015). Hydrogenation of CO2 to methanol: importance of metal–oxide and metal–carbide interfaces in the activation of CO2. ACS Catal. 5 (11), 6696–6706. doi:10.1021/acscatal.5b01755
Roode-Gutzmer, Q. I., Kaiser, D., and Bertau, M. (2019). Renewable methanol synthesis. ChemBioEng Rev. 6 (6), 209–236. doi:10.1002/cben.201900012
Roy, S., Bauer, T., Al-Dahhan, M., Lehner, P., and Turek, T. (2004). Monoliths as multiphase reactors: a review. AIChE J. 50 (11), 2918–2938. doi:10.1002/aic.10268
Ryu, J.-H., Lee, K.-Y., La, H., Kim, H.-J., Yang, J.-I., and Jung, H. (2007). Ni catalyst wash-coated on metal monolith with enhanced heat-transfer capability for steam reforming. J. Power Sources 171 (2), 499–505. doi:10.1016/j.jpowsour.2007.05.107
Sahibzada, M., Metcalfe, I. S., and Chadwick, D. (1998). Methanol synthesis from CO/CO2/H2over Cu/ZnO/Al2O3at differential and finite conversions. J. Catal. 174, 111–118. doi:10.1006/jcat.1998.1964
Santana, H. S., Haddad, V. A., Calvo, P. V. C., S. A. Palma, M., G. P. da Silva, A., Noriler, D., et al. (2022). Design, optimization and scale-up of a new micromixer design based on plate column for organic synthesis. Chem. Eng. J. 446, 137159. doi:10.1016/j.cej.2022.137159
Santana, H. S., Silva, J. L., da Silva, A. G. P., Rodrigues, A. C., Amaral, R. de L., Noriler, D., et al. (2021). Development of a new micromixer “elis” for fluid mixing and organic reactions in millidevices. Industrial Eng. Chem. Res. 60 (25), 9216–9230. doi:10.1021/acs.iecr.1c00770
Shah, K., and Besser, R. (2008). Understanding thermal integration issues and heat loss pathways in a planar microscale fuel processor: demonstration of an integrated silicon microreactor-based methanol steam reformer. Chem. Eng. J. 135, S46–S56. doi:10.1016/j.cej.2007.07.044
Sharma, A. K., Birgersson, E., and Vynnycky, M. (2015). Towards computationally-efficient modeling of transport phenomena in three-dimensional monolithic channels. Appl. Math. Comput. 254, 392–407. doi:10.1016/j.amc.2015.01.042
Silva, Jr. J. L., Celestino, M. S. C., Taranto, O. P., and Santana, H. S. (2024). Smart scale-up of micromixers for efficient continuous biodiesel synthesis: a numerical study for process intensification. Chem. Eng. Process. Process Intensif. 196, 109664. doi:10.1016/j.cep.2024.109664
Silva, Jr. J. L., Haddad, V. A., Taranto, O. P., and Santana, H. S. (2020). Design and analysis of new micromixers based on distillation column trays. Chem. Eng. Technol. 43, 1249–1259. doi:10.1002/ceat.201900668
Stocker, T. F., Qin, D., Gian-Kapsr, P., et al. (2013). Climate change 2013. Phys. Sci. Basis. Work. Group I Contribution Fifth Assess. Rep. Intergov. Panel Clim. Change - Abstr. decision-makers, Changements Clim. 2013. Les Elem. Sci. Contribution du groupe de travail I au cinquieme rapport d'evaluation du groupe d'experts intergouvernemental sur l'evolution du Clim. - Resume a l'intention des decideurs. France N. p., 2013. Web.
Su, Y., Kuijpers, K., Hessel, V., and Noël, T. (2016). A convenient numbering-up strategy for the scale-up of gas–liquid photoredox catalysis in flow. React. Chem. Eng. 1, 73–81. doi:10.1039/C5RE00021A
Tian, P., Wei, Y., Ye, M., and Liu, Z. (2015). Methanol to olefins (MTO): from fundamentals to commercialization. ACS Catal. 5 (3), 1922–1938. doi:10.1021/acscatal.5b00007
Uriz, I., Arzamendi, G., Diéguez, P. M., Echave, F. J., Sanz, O., Montes, M., et al. (2014). CFD analysis of the effects of the flow distribution and heat losses on the steam reforming of methanol in catalytic (Pd/ZnO) microreactors. Chem. Eng. J. 238, 37–44. doi:10.1016/j.cej.2013.05.097
Wang, G., Wang, F., Li, L., and Zhang, G. (2013). Experiment of catalyst activity distribution effect on methanol steam reforming performance in the packed bed plate-type reactor. Energy 51, 267–272. doi:10.1016/j.energy.2012.12.027
Wang, J., Sun, K., Jia, X., and Liu, C. (2020). CO2 hydrogenation to methanol over Rh/In2O3 catalyst. Catal. Today 365, 341–347. doi:10.1016/j.cattod.2020.05.020
Wang, T., Tang, X., Huang, X., Qian, W., Cui, Y., Hui, X., et al. (2014). Conversion of methanol to aromatics in fluidized bed reactor. Catal. Today 233, 8–13. doi:10.1016/j.cattod.2014.02.007
Wang, X., Zhang, H., Qin, H., Wu, K., Wang, K., Ma, J., et al. (2023). A DFT study of methanol synthesis from CO2 hydrogenation on Cu/ZnO catalyst. Fuel 346, 128381. doi:10.1016/j.fuel.2023.128381
Welty, J. R., Wicks, C. E., Qilson, R. E., and Rorrer, G. L. (2008). Fundamentals of momentum, heat, and mass transfer. 5th Edition. Hoboken, NJ, USA: John Wiley and Sons, Inc.
Xiang, H. W., and Deiters, U. K. (2008). A new generalized corresponding-states equation of state for the extension of the Lee–Kesler equation to fluids consisting of polar and larger nonpolar molecules. Chem. Eng. Sci. 63 (6), 1490–1496. doi:10.1016/j.ces.2007.11.029
Yang, Y., White, M. G., and Liu, P. (2011). Theoretical study of methanol synthesis from CO2 hydrogenation on metal-doped Cu(111) surfaces. J. Phys. Chem. C 116 (1), 248–256. doi:10.1021/jp208448c
Zhang, J., Wang, K., Teixeira, A. R., Jensen, K. F., and Luo, G. (2017). Design and scaling up of microchemical systems: a review. Annu. Rev. Chem. Biomol. Eng. 8 (1), 285–305. doi:10.1146/annurev-chembioeng-060816-101443
Keywords: microfluidics, process intensification, numbering-up, microreactor, methanol
Citation: Silva JLd Jr., Santana HS and Hodapp MJ (2024) Numerical evaluation of methanol synthesis in catalytic wall-coated microreactors: scale-up and performance analysis of planar and monolithic designs. Front. Chem. Eng. 6:1440657. doi: 10.3389/fceng.2024.1440657
Received: 29 May 2024; Accepted: 08 July 2024;
Published: 02 August 2024.
Edited by:
Evgeny Rebrov, University of Warwick, United KingdomReviewed by:
Sourav Chatterjee, University of Bath, United KingdomVitaly Ordomsky, UMR8181 Unité de Catalyse et de Chimie du Solide (UCCS), France
Copyright © 2024 Silva, Santana and Hodapp. This is an open-access article distributed under the terms of the Creative Commons Attribution License (CC BY). The use, distribution or reproduction in other forums is permitted, provided the original author(s) and the copyright owner(s) are credited and that the original publication in this journal is cited, in accordance with accepted academic practice. No use, distribution or reproduction is permitted which does not comply with these terms.
*Correspondence: João Lameu da Silva Jr., am9hby5sYW1ldUB1ZmFiYy5lZHUuYnI=