 Abdulaziz Mohammed Almegbl
 Faris Mohammad A. Munshi
 Anwar Khursheed
- Department of Civil Engineering, College of Engineering, King Saud University, Riyadh, Saudi Arabia
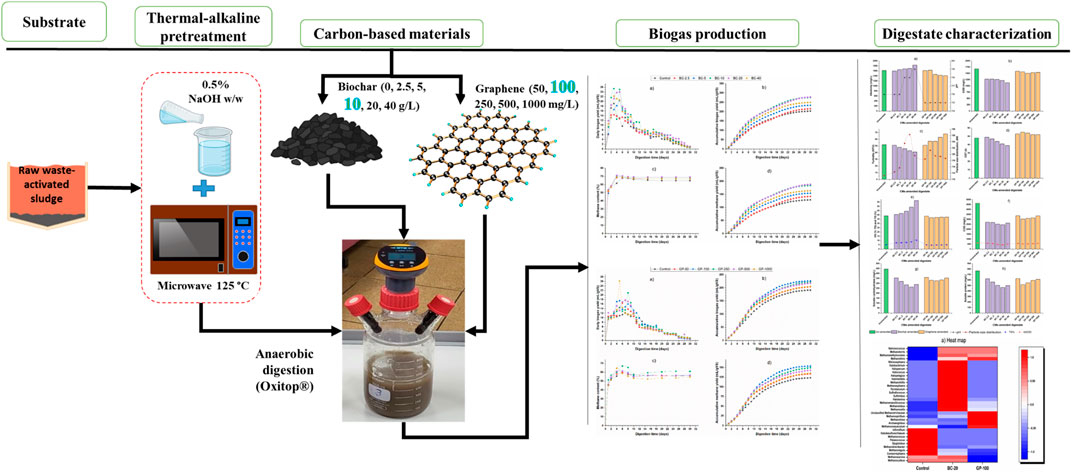
It is necessary to pretreat waste-activated sludge (WAS) to disintegrate the sludge matrix and amend its anaerobic digestion (AD) with carbon-based materials (CMs) to accelerate direct interspecies electron transfer (DIET) in order to realize the maximum biogas potential of abundant and habitat-threatening organic WAS. The AD of WAS pretreated thermo-chemically at 0.5% NaOH (g/g dry sludge) and 125 °C microwave irradiation was amended by biochar doses of 0–40 g/L and graphene doses of 50–1,000 mg/L in the batch operation mode. Hybrid pretreatment of WAS deteriorated dewaterability but solubilized 38% of total chemical oxygen demand (COD). AD amended with 20 g/L biochar and 100 mg/L graphene had the optimum accumulative methane yield of 183.6 and 153.8 mL/gVS, respectively, which correspond to 42.8% and 24.8% increases compared to an unamended control assay with maximum methane content of 70.3% and 71.9%, respectively. The digestate of biochar- and graphene-amended assays resulted in higher TS% and alkalinity, reduced sCOD, VFA, and turbidity, and increased particle size distribution compared to control. Biochar-amended digestate had improved dewaterability, while digestate of graphene-amended assays resulted in worse dewaterability than control. The t-test showed a significant difference between the biochar and graphene amended batch assays, while principal component analysis (PCA) indicated that biogas yield was closely correlated with pH. CM-amended batch assays demonstrated superb fitting with modified Gompertz, logistic, and first-order models with a coefficient of determination above 0.97. Microbial community abundance and diversity were affected by CMs amendment, resulting in increased acetoclastic methanogen growth and transformed methanogenic metabolic pathways. An extended pilot-scale study and techno-economic and life cycle assessments are required to investigate environmental impacts and feasibility.
Highlights
• AD amended with 20 g/L biochar had 42.8% higher methane yield than control.
• AD amended with 100 g/L graphene had 24.8% higher methane yield than control.
• Biochar-amended digestate had higher TS%, less sCOD, and improved dewaterability.
• Graphene-amended assays resulted in lower dewaterability than control.
• Methanothrix was 85.4% in optimum graphene, 73.1% in biochar, and 59.9% in control.
1 Introduction
Interest in sustainable and renewable energy via anaerobic digestion (AD) is increasing. Almost half of AD research available since 1980 was published from 2015 to 2020 (Ampese et al., 2022). In 2014, Germany fulfilled 4.7% of its electricity and 1% of its heat demand from biogas (Lin et al., 2017). India has announced that 5,000 biogas-generating plants will be installed by 2023–24, producing 15 million tons (MT) of biogas annually (Bandgar et al., 2021). Saudi Arabia aims to achieve approximately 50% of total electricity production from renewable energy by 2030 (Saudi green initiatives, 2023). Organic wastes such as agricultural wastes, municipal solid waste (MSW), and bio-solids from wastewater treatment plants (WWTPs) are sustainable feedstock for AD since they are rich in organic content, abundant, and intimidating habitats if not appropriately managed (Fu et al., 2021). Moreover, using waste instead of edible agricultural resources as feedstock for AD avoids pressure on food supply.
However, the inherent biogas potential of organic waste is not achieved using conventional AD, usually due to limitations in hydrolysis and disparity in the syntrophic relation at the acetogenesis–methanogenesis stages of AD (Wang et al., 2021). Hydrolysis is usually enhanced by pretreating feedstock prior to AD, while the syntrophic relation is boosted by supplementing conductive materials such as activated carbon (AC), biochar, graphite, carbon cloth, graphene, carbon nanotubes, magnetite, hematite, goethite, zerovalent iron (ZVI), and metal oxides (Yun et al., 2021).
Oxidation and reduction between syntrophic microorganisms in AD is based on interspecies electron transfer (IET) (Nguyen et al., 2021). However, typical IET is inefficient in increasing metabolism and hydrogen-consuming methanogens (Yang et al., 2017) since the electron shuttling is driven by diffusion in IIET (Nguyen et al., 2021). Therefore, recognized and rapid IET is accomplished by introducing abiotic conductive material to directly enhance IET (Wang et al., 2021). Materials used as abiotic direct IET (DIET) improve the growth of syntrophic microorganisms and expedite electron transfer since they are conductive and porous; subsequently, increased biogas yield and quality are achieved (Wang et al., 2021).
The alteration of IET from IIET and biotic DIET to abiotic DIET modifies the metabolic pathways—microorganism diversity, abundance, and associated enzymes (Baek et al., 2018). All carbon-based materials (CMs) are ineffective for all substrates in improving DIET (Lin et al., 2017). For example, carbon cloth and granular AC (GAC) are incompatible with glucose for enriching Geobacter but friendly with ethanol for enriching Geobacter and Methanothrix (Wang et al., 2021). Graphene is reported to have antimicrobial properties that may affect the growth of microorganisms (Baek et al., 2018). Moreover, carbon nanotubes are toxic to microorganisms due to the cytotoxic mechanism (Baek et al., 2018).
CMs have alkaline and alkaline earth metals such as K, Na, Mg, and CA. Hence, CMs add alkalinity and increase the buffering capacity of the AD process (Altamirano-Corona et al., 2021). They are widely applied since they have high electrical conductivity and chemical stability, are lightweight, biocompatible, and are cost-effective (Gahlot et al., 2020). They can improve digestate dewaterability, sludge volumes, and centrate quality (Nguyen et al., 2021). In addition, CMs are used for the removal and adsorption of soluble organics, gases, and nutrients and the recovery of near-failure AD induced by shock loads, ammonia stress, phenol, heavy metal, limonene, pH, and temperature variation (Altamirano-Corona et al., 2021; Nguyen et al., 2021) owing to their high internal surface area.
However, there is variation in the source, preparation method, pyrolysis temperatures, purity, surface area, shape, pore size, pH, ash content, organic function group, nutrient content, particle size, dose, price, and electron conductivity of different CMs (Kaur et al., 2020; Nguyen et al., 2021). Therefore, they may have different effects when used in AD. CMs such as pure graphene, biochar, and GAC can have an electrical conductivity above 1 million, 0.3, and 0.0005 S/m. However, the price and availability of CMs, and the offsetting of increased biogas production determine which CM is optimal for a specific feedstock in AD. Moreover, the complexity of the substrate, the culture used as the inoculum, AD processing parameters, and the desired output affect DIET stimulation.
In many studies, the DIET mechanism was investigated in syntrophic co-cultured environments and for simple substrates such as acetate, ethanol, propionate butyrate, and glucose (Lin et al., 2017; Guo et al., 2020; Xu et al., 2020). The supplementation of CMs in mixed-culture and complex substrate bioconversion, where biofilms are usually formed (Gahlot et al., 2020), is rarely studied. Therefore, this research investigates the enhancement of DIET in AD of a mixed-culture (inoculum from full-scale anaerobic digester), complex (waste-activated sludge) and pretreated (thermo-chemically) feedstock by adding CMs— low-priced biochar and high-priced graphene.
2 Methodology
2.1 Substrates and inoculum
The sludge sample was a dewatered waste-activated sludge of SBR (sequencing batch reactor) WWTP-treating municipal wastewater. The mixed culture was procured from a full-scale anaerobic digester operating at ambient temperature of about 25 °C treating bio-solids of municipal WWTP. The inoculum was acclimatized and degassed anerobically for a week at 35 °C ± 2 °C.
2.2 Thermal–chemical pretreatment of WAS
The alkali-assisted microwave pretreatment of waste-activated sludge was performed based on the optimal thermal–alkaline pretreatment where the sludge samples were subjected to different alkaline pretreatments of 0%–9% (gNaOH/g TS) and microwave pretreatment of 90 °C–175 °C. The highest biogas yield was achieved from 0.5% alkaline pretreatment and 125 °C microwave pretreatment (resulting from our previous unpublished work). Therefore, the optimum alkaline and microwave pretreatments were selected for hybrid pretreatment.
The dewatered waste-activated sludge was diluted with distilled water to a TS% of 8. Alkaline pretreatment of 0.5% (g NaOH/g dry sludge) was applied for 30 min at ambient temperature on 600 mL of the diluted sample. The alkaline pretreated sample was then subjected to microwave pretreatment at 720 W for 225 s, corresponding to an energy consumption of 4,921 kJ/kg dry sludge to increase the temperature to 125 °C.
2.3 Conductive materials and Brunauer–Emmett–Teller (BET) analysis
2.3.1 Biochar
Biochar of hardwood was procured from Greenfield Eco Solution, India. The biochar was ground with a kitchen grinder to a size of 1–8 mm. The total solid and volatile solid content of the biochar was determined using a standard method. The specific surface area, average pore diameter, and total pore volume were determined using volumetric gas adsorption through Nova Station B (Anton Paar QuantaTec Inc., United States) (Table 1).

Table 1. Physical–chemical characterization of carbon-based materials.
2.3.2 Graphene
Graphene was prepared by exfoliating graphite using H2SO4 and HNO3, thermal shock at 1,050 °C, and foliation using ultra-sonication as per Chen et al. (2004). In brief, dried graphite was immersed in a mixture of concentrated H2SO4 and HNO3 (4:1 v/v) for 16 h. Next, it was washed to a pH of 6 and dried overnight. Later, it was exposed to thermal shock at 1,050 °C for 15 s in a muffle furnace. After that, it was immersed in a mixture of ethanol and distilled water (65:35 v/v) for 12 h. Afterward, the sample was subject to 100 W ultrasonic irradiation for 10 h. Finally, it was filtered and dried at 80 °C for further use.
2.4 Biochemical methane potentials (BMPs)
Biochemical methane potential (BMP) assays were established in two phases: biochar-amended and graphene-amended. A total of seven sets, including control and blank, were performed for biochar-amended BMP assays. They were denoted “BC-2.5”, “BC-5”, “BC-10”, “BC-20”, “BC-40”, “control”, and “blank”. “BC” indicates the amendment of thermo-chemically pretreated sludge with biochar, while the numerals indicate the biochar concentration in g/L in the respective digester. Similarly, seven sets, including control and blank, were performed for graphene-amended BMP assays. They were denoted “GP-50”, “GP-100”, “GP-250”, “GP-500”, “GP-1000”, “control”, and “blank”. “GP” denotes the amendment of the pretreated WAS with graphene, while the numerals designate the graphene concentration in mg/L in the respective digester. Biochar doses ranging from 0 to 50 g/L (Eskicioglu et al., 2007; Chang et al., 2011; Shi et al., 2015) and graphene doses ranging from 0 to 2 g/L (Wang et al., 2021) are reported in the literature. Based on the optimum values of CMs in the literature, we selected the dose for biochar (0–40 g/L) and graphene (0–1,000 mg/L). Control digesters were without any CM amendment and included only the inoculum and pretreated substrate to compare biogas yield with CM-amended digesters. Blank digesters contained only the inoculum to detect its biogas yield and deduct it from other digesters for biogas yield estimation in terms of per gVS of the substrate.
The digesters (Oxitop®, Germany) used for BMP assays had 1,000 mL total and 600 mL working volumes (Figure 1A). They were made of glass with screwed pressure-measuring heads (Oxitop®-C) (Figure 1B) to measure the biogas pressure at regular intervals. To absorb CO2 and measure the pressure produced only by CH4, potassium hydroxide (KOH 30% v/v) was injected through a septum nozzle into a rubber stopper in the reactor (Figure 1C). Biogas composition was analyzed every alternative day until day 10 and, later, every fifth day of the BMP assays. The reactors were agitated at 80 rounds per minute (rpm) using an inductive stirring system in the Oxitop® incubator at 35 °C ± 2 °C. Pressure recordings were transferred to a computer for analysis using the Oxitop® OC 110 controller (Figure 1D). The initial pH was adjusted to 7.2 ± 0.2 if necessary with 1 N NaOH or 1 N H2SO4. Macro- and micro-nutrients and KHCO3 were added to the digester to enhance the buffering capacity. All the batch assays were performed in triplicate.
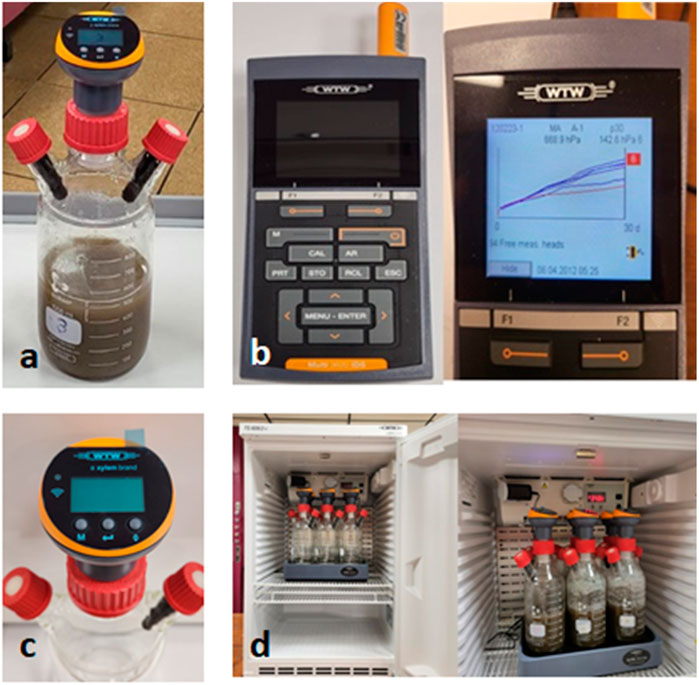
Figure 1. (A) Oxitop® sample bottle with measuring head, septum nozzle, and rubber stopper; (B) Oxitop® controller; (C) Oxitop® measuring head; (D) Oxitop® incubator and shaker.
The batch assays’ hydraulic retention time (HRT) was 30 days because the biogas yield for 3 consecutive days was less than 1% of the total accumulated biogas. The pressure of daily produced biogas was substituted in the ideal gas equation (Eq. 1) with standard pressure and temperature to estimate the daily volume of biogas produced.
where
2.5 Analytical methods
Physical–chemical analysis of raw dewatered, pretreated, and digested sludge was performed. Total solids (TS%), volatile solids (VS%), chemical oxygen demand (COD), and pH were analyzed as per standard methods (APHA, 1998). For soluble COD (sCOD), the sample was filtered using a 0.45-µm glass fiber filter paper. Readily biodegradable COD (rbCOD) was obtained after the sample filtered for sCOD was coagulated and flocculated by aluminum sulfate following the protocol suggested by Wentzel et al. (2001) and Khursheed et al. (2018). For total COD (tCOD) and carbohydrate (tCH) analysis, dried sludge was digested with concentrated H2SO4 as per the digestion method suggested by Charnier et al. (2017). The anthrone method was followed for tCH (Dreywood, 1946). For tCH, absorbencies were measured at 630 nm using a Hach DR3000 portable spectrophotometer (Hach, United States). The sample was centrifuged, and the supernatant was used to analyze the alkalinity using the standard method. For VFA analysis, the titration method of DiLallo and Albertson (1961) was followed. In brief, the supernatant was acidified to pH 3.2. It was then heated gently for 5 min to remove CO2 and later titrated by NaOH to pH 4 and 7. NaOH consumed in this pH range was used to estimate the VFA.
The dewaterability of raw, pretreated, and digested sludge was determined using a capillary suction device (Triton Electronic-304B, United Kingdom) to compare the effects of pretreatment, CM amendments, and AD. The turbidity of the samples was determined using 43,900 (Hach, United States) after the solids of the samples were left to settle. Total and soluble protein content was measured following Lowry et al. (1951). The analysis used folin–phenol reagent and standard BSA (bovine serum albumin). The average particle size distribution of the sludge samples was determined using Litesizer 500 (Anton Paar, United States) with a measurement range of 0.3–10000 nm. The average particle size distribution was reported in terms of its d90, where 90% of the particles are below a specific size.
2.6 Microbial genome sequencing, abundance, and diversity analysis
Digestate samples of the three reactors—control, BC-20, and GP-100—were analyzed for the metagenome. DNA was extracted following the protocol provided with the Xploregen kit. Polymerase chain reaction (PCR) amplification was performed via archaea-specific primers Arch 344F and Arch 915R (5′ACGGGGCTGCAGCAGGGGCGA 3’/5′GTGCTCCCCCGCCAATTCCT 3′). Quality control checks on raw sequence data from high-throughput sequencing pipelines were investigated using MULTIQC (V1.9) and FASTQC (V0.1.1.2). Alpha diversity and significance were presented by the Chao1 method. The analysis was accomplished using the statistical method of T-test/ANOVA. Taxonomic profiles of microorganisms at phylum, class, order, family, and genus levels were created to compare their abundance and diversity. A heat map of the microorganism for the different digestate samples at the genus level was constructed using unit variance scaling on sequence abundance. Both rows (taxonomy at genus level) and columns (digestate samples) were clustered using correlation distance and average linkage.
2.7 Statistical and kinetics analysis
The correlation between the different doses of CM amendment and anaerobic digestion was demonstrated by principal component analysis (PCA) using Minitab 17. PCA is a statistical procedure that reduces dimensions while preserving vital information. The t-test was performed to compare the means between the biochar-amended and graphene-amended BMPs regarding biogas production. The experimental biogas production of optimum CM-amended BMPs was compared with the modified Gompertz (MG) and logistic (LO) models as per Eqs. 2 and 3, respectively. The MG and LO models are nonlinear and follow a sigmoidal trend growth curve based on the growth of bacteria. They fit steady-state anaerobic digesters well (Paritosh et al., 2018). Moreover, the first-order (FO) model (Eq. 4) was used to estimate the kinetic constant. The constant describes the biodegradation rate in anaerobic digesters. The solver extension of Microsoft Excel was used to estimate the kinetics.
Where.
3 Results and discussion
3.1 Characterization of raw and pretreated WAS and inoculum
The physical–chemical analysis of the dilute raw and pretreated WAS and the inoculum is shown in Table 2. The sCOD and rbCOD of the raw sludge were 4,690 and 216 mg/L, respectively. However, thermo-chemical pretreatment at 0.5% NaOH (g/g dry sludge) and 125 °C microwave irradiation increased the concentrations to 29,254 and 3,254 mg/L, corresponding to 6.24- and 15.1-fold increases, respectively.
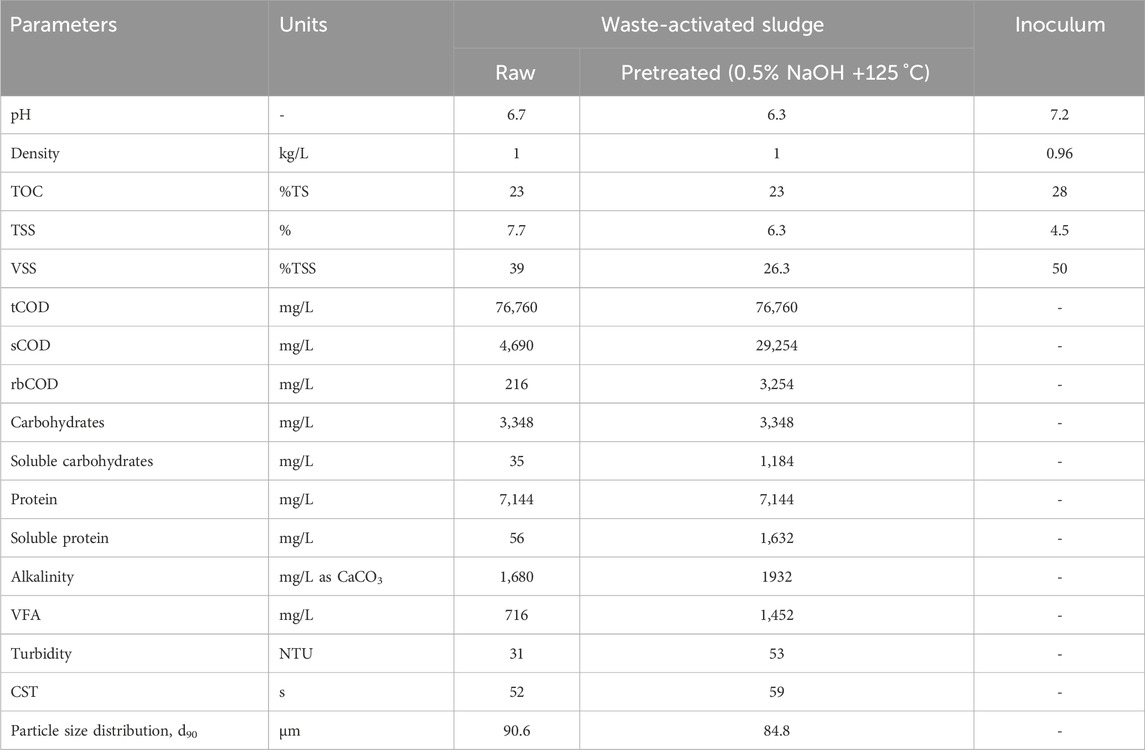
Table 2. Physical–chemical characterization of diluted WAS.
The pretreatment increased the soluble carbohydrate and protein content 33.83- and 29.14-fold, respectively. The carbohydrate and protein content increased due to the disintegration of the sludge matrix and cell wall, releasing the trapped organic matter of the sludge matrix and cells. The alkalinity of the pretreated sludge increased 15% while the VFA increased 103%. Similarly, the disintegration by thermo-chemical pretreatment increased turbidity from 31 to 53 NTU (increased by 71%) and CST from 52 s to 59 s (increased by 13.5%). However, the average particle size at d90 decreased from 90.6 to 84.8 µm, corresponding to a 6.5% decrease. The turbidity increase was due to the increase in the fine and colloidal portions of the sludge particles; hence, the average particle size distribution dropped.
3.2 Biogas production in biochar-amended BMP assays
The anaerobic digestion of biochar-amended BMP assays was performed for 30 days. The daily biogas volumes of different biochar-amended BMP assays are shown in Figure 2A. The daily biogas volume peaked from days 2–6. The highest value is recorded for BC-10 (25.4 mL/gVS), followed by BC-20 (24 mL/gVS). However, the accumulative biogas of BC-20 is slightly higher (278.5 mL/gVS) than BC-10 (275.5 mL/gVS). The increase in accumulative biogas production is negligible; hence, BC-10 is the optimum dose of biochar for AD of thermal–chemical pretreated WAS. Moreover, a lower dose of biochar requires less working volume and is more cost-effective. In addition, a higher dose of CMs increases the TS% of the digestate and, hence, its volume for dewatering, transport, and disposal if CMs are not retained in the digester. For example, adding 20 g/L CMs can make the digestate double in volume (Nguyen et al., 2021).
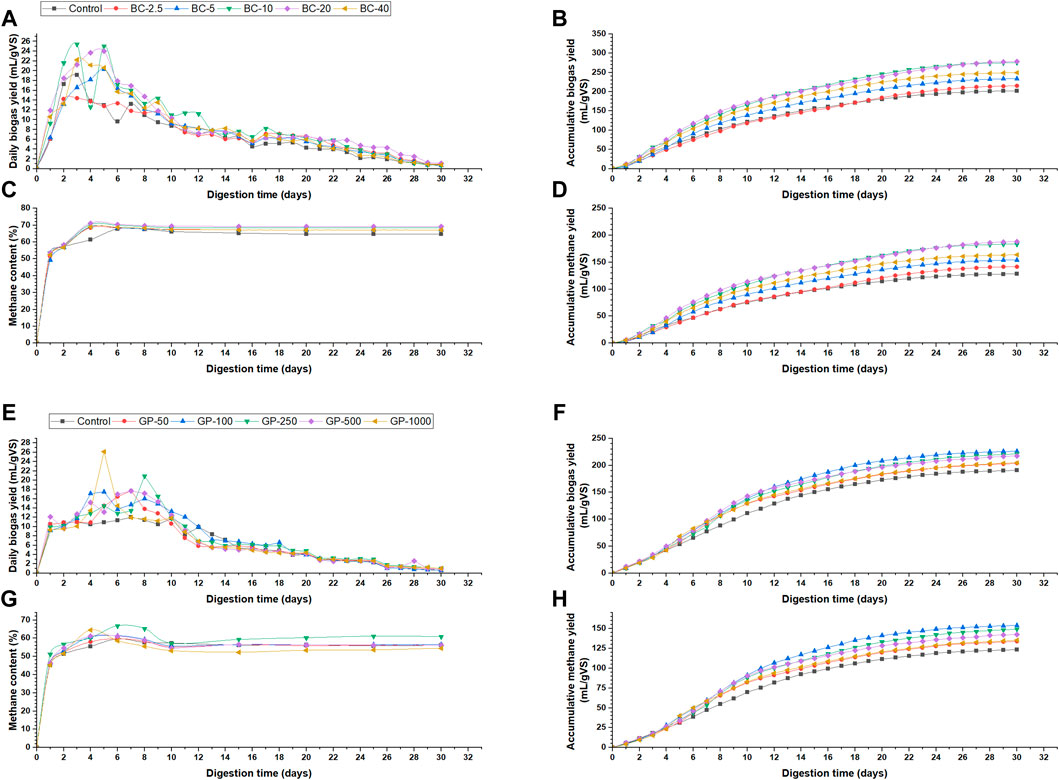
Figure 2. Biogas production in biochar-amended BMP assays: (A) Daily biogas yield, (B) Accumulative biogas yield, (C) Methane content, (D) Accumulative methane yield; Biogas production in graphene-amended BMP assays: (A) Daily biogas yield, (B) Accumulative biogas yield, (C) Methane content, (D) Accumulative methane yield.
Figure 2C shows the methane content of the biochar-amended BMP assays. BMP assay of the control digester having only thermal-chemically pretreated WAS had a maximum methane content of 67.7% on day 6 but later reduced to a steady state of 64.7%. All the biochar-amended BMPs showed higher methane content, ranging from 49.2% to 71.1%, with BC-20 having the highest. The highest methane content of BC-10 was 70.3%, while it was 71.1% for BC-20. This implies that higher doses of CMs enhance methane content. The increase in methane content might be due to increased formation of acetic and butyric acids preferred by methanogens (Kaur et al., 2020).
The accumulative methane yield estimation for biochar-amended BMP assays is shown in Figure 2D. BC-20 had the highest methane yield of 188.1 mL/gVS, followed by BC-10 (183.6 mL/gVS). The increase of accumulative methane yield for BC-2.5, BC-5, BC-10, BC-20, and BC-40 are 10.2%, 19.9%, 42.8%, 46.26%, and 27.33%, respectively, compared to thermal–chemical pretreated control, while the increases are 198.9%, 225.2%, 287.3%, 296.7%, and 245.4%, respectively, compared to the untreated WAS sample. The increases of accumulative biogas yield for BC-2.5, BC-5, BC-10, BC-20, and BC-40 are 6.3%, 15.5%, 36.1, 37.6%, and 23.2%, respectively, compared to thermal–chemical pretreated control, while the increases are 133.9%, 154.2%, 199.5%, 202.7%, and 171.1%, respectively, compared to the untreated WAS sample. The values show that the increase in methane is more significant than that in biogas production, demonstrating that CMs enhance the methane content.
3.3 Biogas production in graphene-amended BMP assays
The biogas production of graphene-amended BMP assays is illustrated in Figure 2. Figure 2E shows the daily biogas production. The peak biogas production period was from days 4 to 8. GP-1000 had the highest daily biogas production of (26.1 mL/gVS) followed by GP-250 (20.9 mL/gVS), while GP-100 had the highest accumulative biogas of (226.1 mL/gVS) followed by GP-250 (221.3 mL/gVS) (Figure 2F). Therefore, based on the highest biogas yield, 100 mg/L graphene is the optimum condition for AD of thermal-chemically pretreated WAS. However, compared to the optimum biochar-amended BMP assay dose (BC-10), the GP-100 produces 17.9% and 16.2% less biogas and methane. The decreased biogas production of graphene-amended BMP assays compared to biochar-amended BMP assays could be due to their characterization. The surface area of biochar was 29.6 m2/g, having a 68% increased surface area over graphene (17.55 m2/g). The higher surface area allows more cell attachment and increased DIET mechanism to enhance biogas production. Moreover, the biochar is alkaline and, hence, has the potential to increase the buffering capacity of the digester, while the prepared graphene had an approximate pH of 6. In addition, the antimicrobial properties of graphene might have affected cell growth (Baek et al., 2018). Therefore, graphene’s high conductivity could not offset those hindrances enough to produce higher biogas than biochar-amended BMP assays. Nevertheless, graphene-amended BMP assays—GP-50, GP-100, GP-250, GP-500, and GP-1000—had 6.6%, 18.5%, 15.9%, 13.8%, and 7.3% increased biogas production, respectively, compared to thermal-chemically pretreated control BMP assay. The increases correspond to 121.2%, 145.8%, 140.6%, 136%, and 122.6% increased biogas production compared to untreated WAS assay. Therefore, the graphene was not as compatible with AD of thermal-chemically pretreated WAS as biochar.
Figure 2G shows the methane content of graphene-amended BMP assays. The maximum methane content was acquired by GP-100 (71.9%). The methane content decreased by increasing the graphene dose. In thermal–chemical pretreated control, the maximum methane content was 69.9%, while in untreated control, it was 67.9%. Graphene amendment further increased the methane content from 70.3 (BC-10) to 71.9% (GP-100) when comparing the optimum doses of the biochar and graphene. Figure 2H illustrates the accumulative methane yield of graphene-amended BMP assays. GP-100 had the highest accumulative methane yield of 153.8 mL/gVS, followed by GP-250 (149.1 mL/gVS). The increases in accumulative methane yield were 8.6%, 24.8%, 21%, 15.7%, and 9.7% in GP-50, GP-100, GP-250, GP-500, and GP-1000, respectively, compared to thermal-chemically pretreated control. The data show that methane yield enhancement was higher than biogas yield, validating the improvement of methane content using CMs.
3.4 Digestate characteristics of the CMs-amended BMP assays
Thermal-alkaline pretreatment reduced the pH of WAS to 6.3. However, biochar addition increased pH up to 7 back due to the alkaline nature of the biochar. The pH was adjusted to 7.2 ± 0.2 at the start of the BMP assays. At the end of the AD, the digestate of all assays had a pH of 7.6 to 7.9, with BC-40 the highest due to the relatively high dose of biochar (Figure 3A). However, the pH of all graphene-amended BMP assays was about 7.5. The comparatively lower pH could be due to the absence of alkali metals in the composition of graphene. Moreover, the exploitation of graphene was performed by concentrated acids, which may not have been removed during washing.
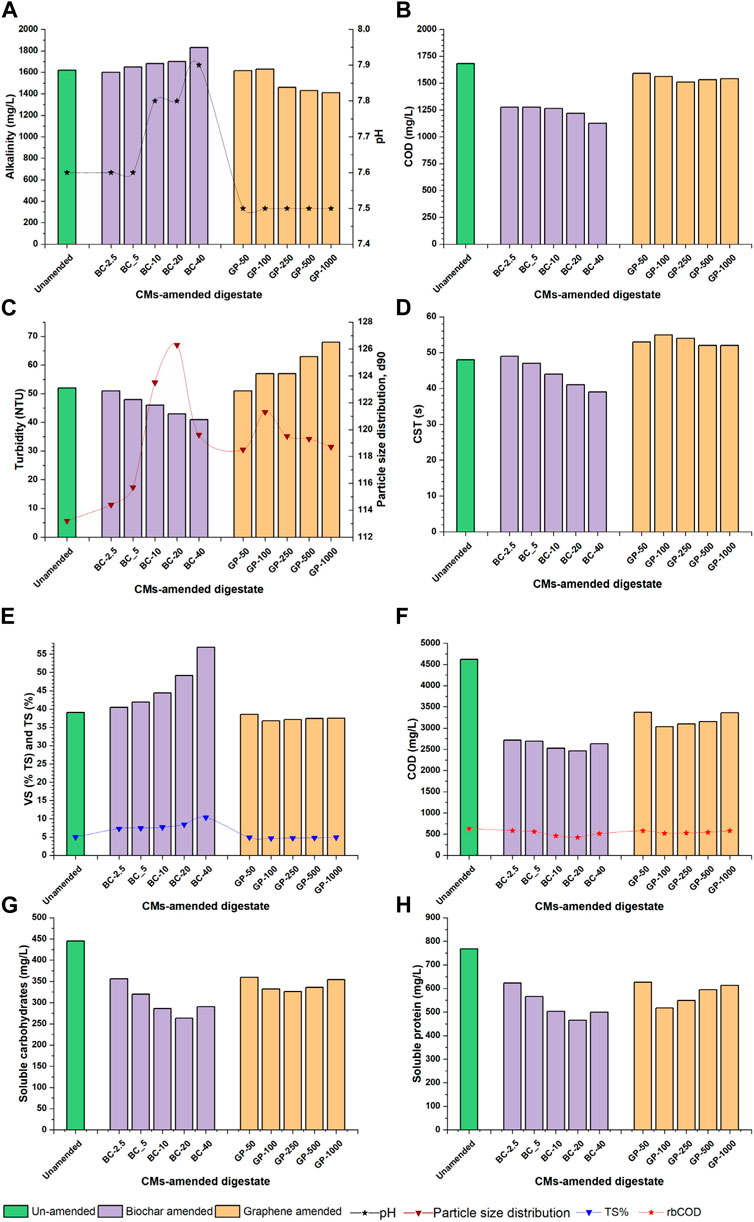
Figure 3. Digestate characteristics of CM-amended BMP assays: (A) alkalinity and pH; (B) VFA; (C) turbidity and particle size distribution; (D) CST; (E) VS% and TS%; (F) sCOD and rbCOD; (G) soluble carbohydrates; (H) soluble protein.
Alkalinity and VFA were influenced by pH due to CM amendment. Higher biochar doses increased the total alkalinity of digestate from 1,620 mg/L (control) to 1830 mg/L (BC-40). In contrast, alkalinity reduced to 1,410 mg/L (GP-1000) while increasing the dose of graphene but still not at the deficient level (Figure 3A). VFA concentration of biochar- and graphene-amended digestate was lower than in control (1,680 mg/L) due to bio-conversion to biogas and absorption by the CMs. However, the digestate of graphene-amended BMP assays had higher VFA concentrations than biochar-amended BMP assays ranging from 1,540 to 1,590 mg/L (Figure 3B).
The turbidity of the digestate decreased from 52 NTU (control) to 41 NTU in biochar-amended BMP assays (Figure 3C). The decrease is attributed to the bio-conversion of colloids and tiny particles to biogas by the anaerobes. Moreover, the turbidity may have been reduced while adding the inoculum because the inoculum particles are mainly composed of aggregated microorganisms. In addition, some turbidity could have faded because of the absorption by CMs. However, the turbidity was slightly higher in the digestate of graphene-amended BMP assays (Figure 3C). The increase is likely due to the graphene’s relatively impermeable and plain structure which avoids the absorption of tiny particles. The particle size distribution increased in the digestate of biochar-amended BMP assays at a higher rate compared to graphene-amended BMP assays while increasing the dose of CMs. The average particle size increase may be due to the aggregation of microorganisms, absorption by the CMs, and bio-conversion to biogas in both CM-amended BMP assays (Figure 3C).
The capillary suction time of the digestate in biochar-amended BMP assays improved compared to the digestate of the control BMP assay. The CST decreased from 48 s in control to 39 s in BC-40 (Figure 3D). This improvement is due to alkali in biochar facilitating the migration of bond water to free water by increasing osmotic pressure between the sludge flocs and suspended liquid (Nguyen et al., 2021). In contrast, the CST slightly increased to 55 s in the digestate of graphene-amended BMP assays (Figure 3D).
The VS% of the digestate in the control BMP assay was 39.03%. The VS% increased from 40.49% to 56.88% in the biochar-amended BMP assays as the biochar dose increased from 2.5 g/L to 40 g/L (Figure 3E). The increase is due to the higher fraction of biochar in the digestate. Moreover, the higher VS content is due to inoculum and new biomass formation. Thermal-alkaline pretreated WAS had about 26.3% VS. However, when mixed with the inoculum and biochar, the VS% of the mixture increased to 58.61% (TS base). In the biochar-amended BMP assay, AD biodegraded up to 30% of the VS initially the pretreated WAS had, in the biochar-amended BMP assays. In contrast, the VS% in the digestate of graphene-amended BMP assays rose from 36.8 to 38.57 (Figure 3E). The comparatively lower VS content in graphene-amended BMP assays is due to the microscale dose of graphene. Moreover, the TS% of the biochar-amended BMP assay increased from 8% (control) to 12% (BC-40) owing to the supplementation of biochar up to 40 g/L. The TS% decreased to 7.24%–10.36% after AD. In contrast, in the graphene-amended BMP assay, the initial TS% of anaerobic reactors was 5.55%, and there was a negligible increase of TS% owing to a minor dose of graphene. The TS% of the graphene-amended BMP assays reduced 4.67%–4.91% after AD, indicating a maximum of 16% TS removal (Figure 3E).
Thermal-alkaline pretreated WAS had a soluble COD of 29.3 g/L. After mixing with inoculum, water, and its AD, the sCOD of the final digestate in the control assay was 4,500 mg/L. The digestate of biochar-amended BMP assays had 2,465–2,715 mg/L sCOD, while graphene-amended BMP assays had 3,095–3,375 mg/L sCOD (Figure 3F). The comparatively low sCOD in biochar-amended BMP assays is due to the bio-conversion of sCOD to biogas at a higher rate than in graphene-amended BMP assays. However, there was no noticeable fluctuation of rbCOD between the two CM-amended BMP assays ranging 425–580 mg/L (Figure 3F).
Moreover, the carbohydrate and protein soluble content in the CM-amended BMP assays was less than in the control (445 and 768 mg/L, respectively). The soluble content of carbohydrates and protein was negatively correlated to biogas yield in the respective BMP assays. The sCH ranged from 263 to 356 mg/L in the digestate of biochar-amended BMP assays, with BC-20 having the lowest concentration (Figure 3G). The soluble protein of the digestate in the biochar-amended group ranged from 465 to 623 mg/L (Figure 3H). However, the solubility of carbohydrates and protein in the graphene-amended group was slightly higher than the biochar-amended group due to the comparatively deficient biogas production (Figures 3G,H).
3.5 Pretreatment effects on microbial interaction and diversity
The guanine–cytosine content (GC-content) of control, BC-20, and GP-100 was 63%, 61%, and 61%, respectively. The read counts in millions were 0.4, 0.4 and 0.2, respectively. Many factors, including supplementation of accelerants such as biochar and graphene, can affect the microorganism concurrently involved in the four steps of AD. An analysis of the archaeal community to determine microbial abundance and diversity can help clarify the effects of CM amendment. Increased methane yield and composition are closely correlated to methanogenic archaea community structure (Wang et al., 2021). Taxonomic profiling at different levels of phylum, class, order, family, and genus for the digestate of control and CM-amended digestate are demonstrated in Figure 4.
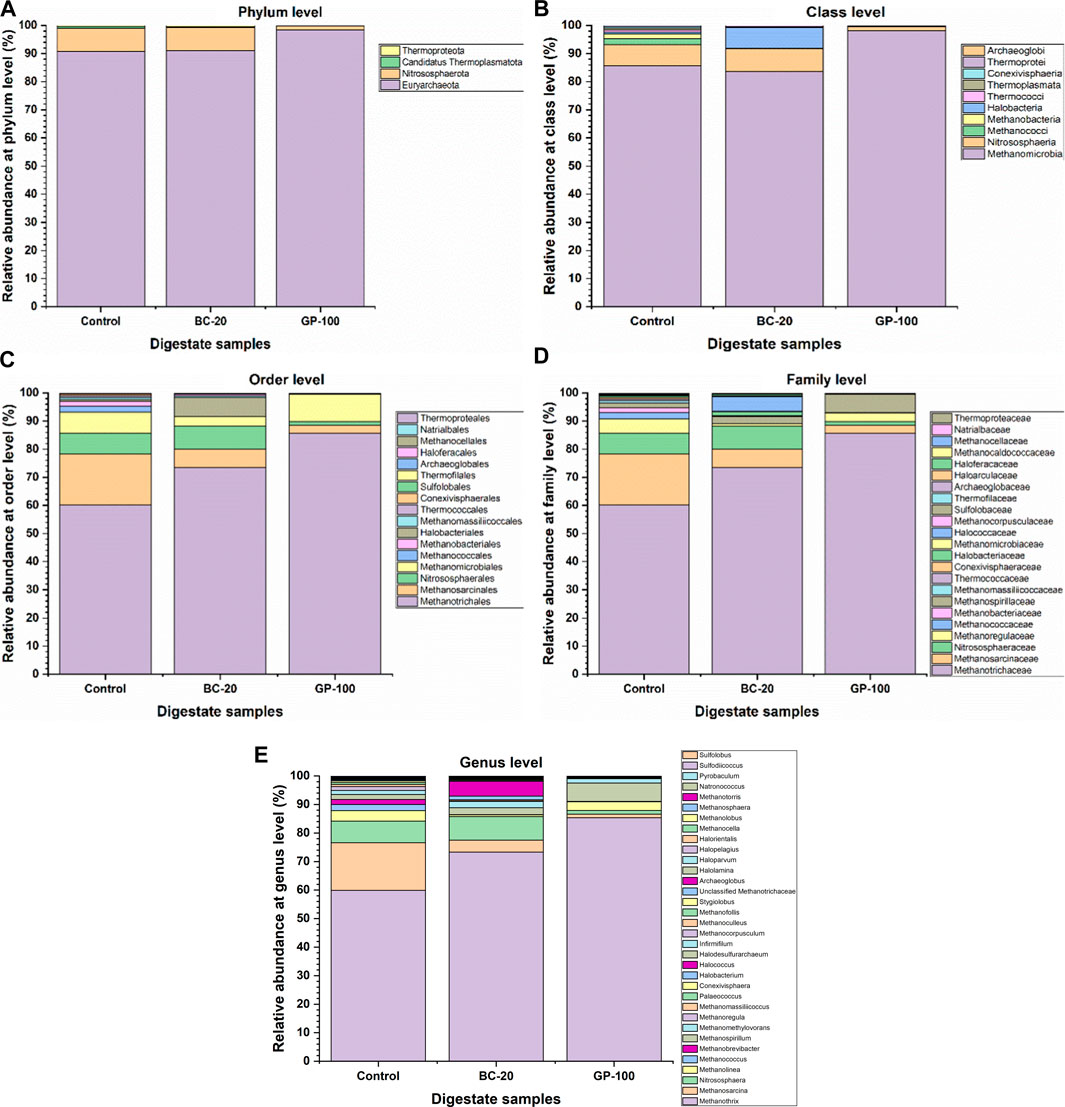
Figure 4. Taxonomic profiling of control, biochar-amended, and graphene-amended digestate at different levels: (A) phylum, (B) class, (C) order, (D) family, and (E) genus.
The archaeal phylum Euryarchaeota was dominant in all digestate samples, ranging from 90.9% at control to 98.5% at GP-100, followed by Nitrososphaerota (Figure 4A). Methanomicrobia, a class of Euryarchaeota, was dominant in GP-100 (98.2%). The relative abundance of Methanomicrobia in control and BC-20 samples was almost similar at 85.6% and 83.5%, respectively (Figure 4B). However, the difference at the order level for Methanotrichales was high between the samples (Figure 4C). The relative abundance of Methanotrichales—strictly, acetoclastic anaerobes—was 60.1% in control, and it increased to 73.4% and 85.6% in BC-20 and GP-100, respectively. However, Methanosarcinales, another acetoclastic methanogen at the order level, decreased with the CM amendment. In control, the relative abundance of Methanosarcinales was 18.1% while, in BC-20 and GP-100, it was 6.7% and 2.8%, respectively. This implies that acetate-converting Methanotrichales increased while Methanosarcinales reduced due to the CM amendment. The alteration could be attributed to the chemical properties of the CMs. At the family level, Methanotrichaceae—strictly, acetoclastic anaerobes—was dominant in all samples, with the highest abundance of 85.7% in GP-100 (Figure 4D).
At the genus level, Methanothrix (59.9%), Methanosarcina (16.7%), and Nitrososphaera (7.6%) were the dominant anaerobes in control. In BC-20, Methanothrix (73.1%), Nitrososphaera (8.2%), and Halococcus (5.2%) were the dominant microorganisms at the genus level. In GP-100, Methanothrix (85.4%), Methanospirillum (6.4%), and Methanolinea (3.1%) were the dominant cells, comprising 95% of the microbial community (Figure 4E). Methanothrix is an acetoclastic methanogen, while Methanosarcina is strictly methylotrophic, although some of its species can use all three metabolic pathways—CO2 and H2, acetate and methylated compounds (Prondzinsky et al., 2023). Nitrososphaera, an ammonia-oxidizing genus, had almost the same relative abundance in control and BC-20. Halococcus, an extreme halophilic archaea, was detected in BC-20, which could be due to the alkali composition of biochar. Methanospirillum, a CO2- and formate- (some of its species) reducing methanogenic archaea, was the second dominant genus in GP-100, followed by Methanolinea, a hydrogenotrophic methanogenic archaea. The top-ten microbial community enrichment at the genus level for all digestate samples are shown in Figure 5, while the heat map at the genus level is illustrated in Figure 6A. Moreover, the microbial diversity via the Chao1 method showed high diversity in CM amended samples (Figure 6B, C). The methanogenic analysis revealed that CM amendment improved the abundance and diversity of the microbial community to transform the metabolic pathways for increased bio-methane production and content.
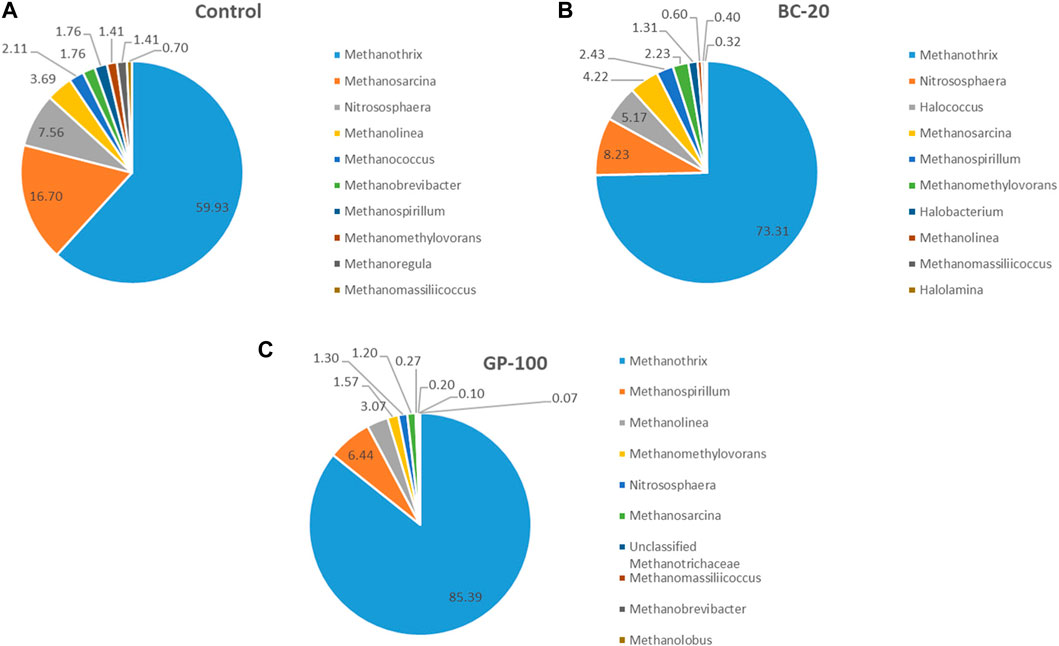
Figure 5. Top-ten microbial community enrichment at the genus level for (A) control, (B) biochar- and (C) graphene amendment.
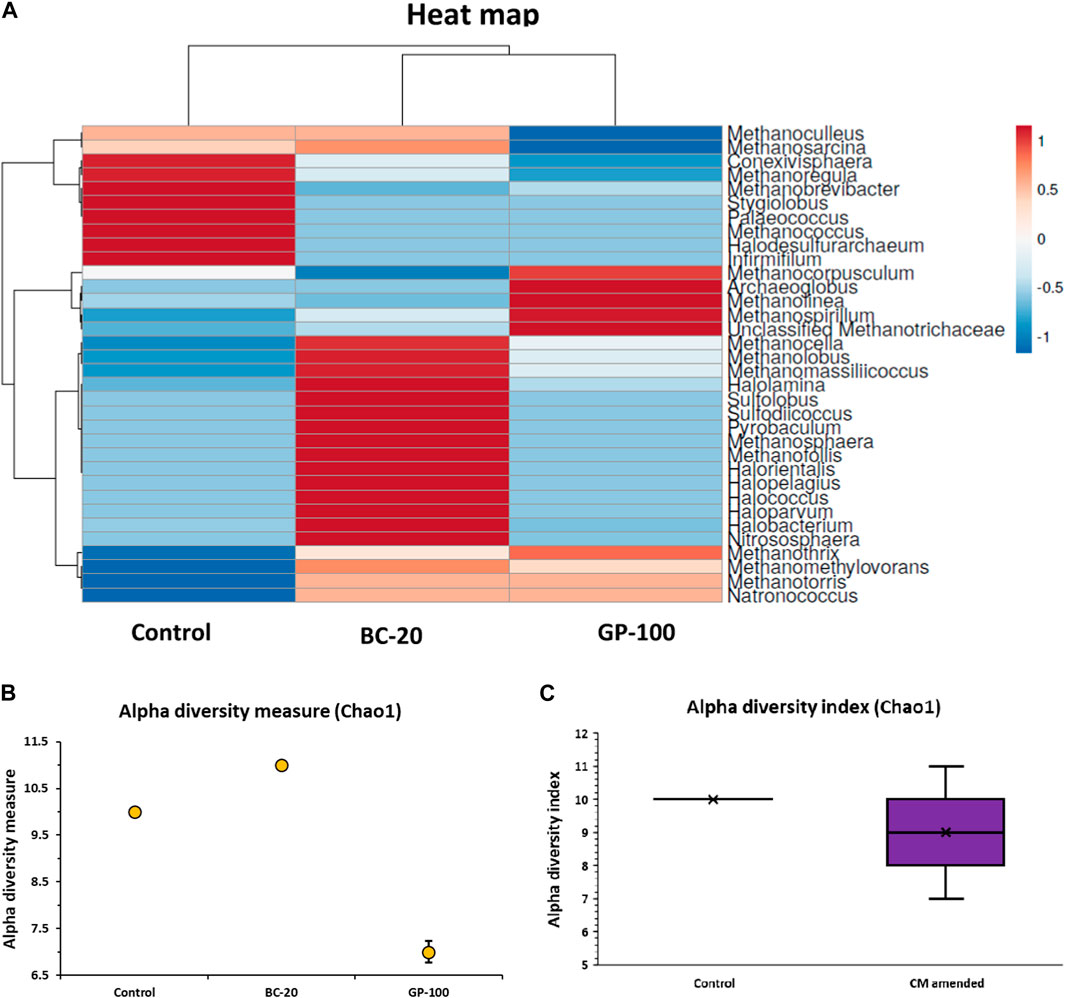
Figure 6. (A) Heat map of control and CM-amended samples at genus level. (B) Alpha diversity measure. (C) Alpha diversity index.
Carbon-based materials for DIET are produced from different biomasses converted thermo-chemically. Although CMs are attained from renewable sources, a more sustainable strategy is to convert wastes, such as bio-solids from municipal wastewater treatment plants, to CMs. Moreover, the conductive materials for DIET in AD should be non-hazardous, chemically stable, cheap, recyclable, non-reactive, porous, conductive, microorganism-friendly, and provide a large surface area (Gahlot et al., 2020). Therefore, a pilot scale of the AD for extended time should be studied for an insight into longer time effects.
3.6 Statistical analysis
The digestate characterization of biochar- and graphene-amended BMP assays were analyzed via principal component analysis (PCA) to determine their correlation with the biochar and graphene doses and biogas production. PCA was applied to decrease the dimensions of the data to components 1 and 2 to summarize and visualize the correlation comfortably because the first component (72.8%) and the second component (14.3%) collectively explain 87.1% of the variance in the data (Figure 7). The loading plot indicates the contribution of each parameter to the two major components. COD, carbohydrate, protein solubility and VFA concentration have considerable positive loading on the first component, while pH has a substantial negative loading on the second component. The angle between the parameters in the loading plot indicates their correlation (Kim et al., 2022). The smaller angle between the biogas yield and pH determines their close correlation. The correlation of the biogas is in the order of pH, biochar dose, particle size distribution, VS%, alkalinity, etc. In addition, biochar and graphene doses have very close correlations with VS% and VFA concentration, respectively (Figure 7). Student’s t-test (paired two samples for means) was performed using Microsoft Excel to recognize the difference between the mean of biochar-amended and graphene-amended BMPs in biogas production. The result indicated that the difference between the two groups is significant—p = 0.03 < 0.05.
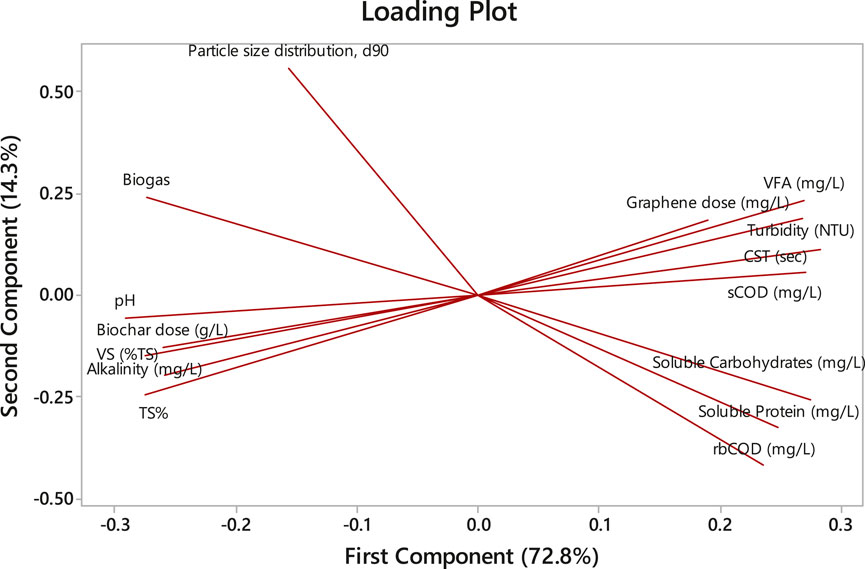
Figure 7. Principle component analysis of digestate characteristics with CM doses and biogas production and loading plot.
The experimental data of the biochar- and graphene-amended BMP assays were compared with the modified Gompertz, logistic, and first-order models to determine how well the AD process for the CM-amended BMP assays was performed. MG and LO are well-established models for steady anaerobic digestion of simple, complex, and co-digested substrates. Based on the experimental data, the models also estimated the lag phase (β) and maximum daily biogas production (Ym) of the AD process. A first-order model was employed to estimate the degradation constant in the two CM-amended BMP assays.
Pm estimates of MG and LO models were very close to the experimental data, especially the estimated values by the MG model for BC-40 and GP-100 BMP assays (Table 3). However, the FO model estimates for Pm were higher than the experimental data. The maximum daily biogas yield estimates by the MG and LO models were almost identical and deviated from the experimental data by 10.88%–48%. The lag phase estimation ranged from 0 to 1.38 days by MG and LO models, with the MG model estimating lower values than the LO (Table 3). The MG model estimated lag phase below 0.28 days for biochar-amended and up to 1.07 days for graphene-amended BMP assays. The LO model estimated a lag phase between 0 and 0.41 days for biochar-amended and 0.88 and 1.38 days for graphene-amended BMP assays. Therefore, graphene-amended assays had a higher lag phase than biochar-amended BMP assays. The lag phase for BC-10 and BC-20 was estimated at 0 days by both the MG and LO models, which could be due to the appropriate buffering capacity, pH, availability of rbCOD, and use of an acclimatized and active inoculum.
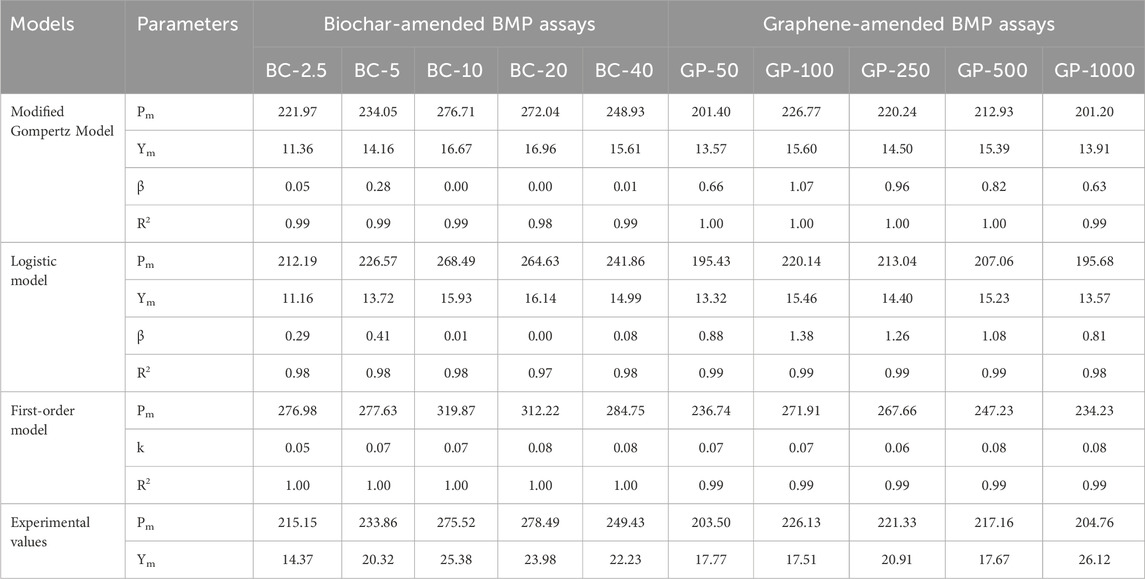
Table 3. Kinetic estimation of biochar- and graphene-amended BMP assays using modified Gompertz, logistic, and first-order models.
The kinetic constant ranging from 0.05 to 0.08. BMP assays amended with higher doses of CMs (BC-20, BC-40, GP-500, and GP-1000) had the highest kinetic constant of 0.08. Higher doses of CMs improved the DIET mechanism and hence the degradation. The coefficients of determination were above 0.97 for the three models, indicating a very good fit of the experimental data with the models in the order of the FO, MG, and LO models. The FO model had a coefficient of determination of 1 for biochar-amended assays, while the MG model had a value of 1 for graphene-amended assays. The graph fitting of the biochar- and graphene-amended BMP assays with the models are shown in Figures 8A and B, respectively.
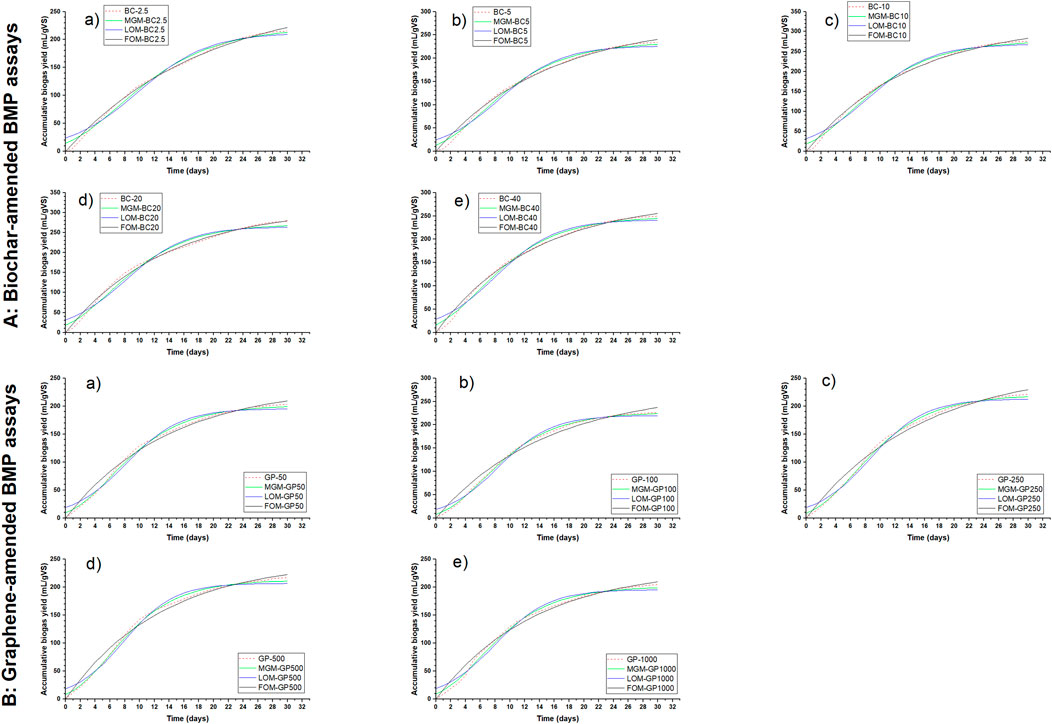
Figure 8. Graph fitting of (A) biochar-amended: a) BC-2.5, b) BC-5, c) BC-10, d) BC-20, and e) BC-40, and (B) graphene-amended: a) GP-50, b) GP-100, c) GP-250, d) GP-500, and e) GP-1000 BMP assays with modified Gompertz, logistic, and first-order models.
4 Conclusion
Thermal-chemically pretreated (0.5% NaOH w/w and microwave at 125 °C) waste-activated sludge was supplemented with biochar (0–40 g/L) and graphene (0–1,000 mg/L) to enhance DIET in batch AD. AD amended with 20 g/L biochar and 100 mg/L graphene had the optimal accumulative methane yields of 183.6 and 153.8 mL/gVS, respectively, corresponding to a 42.8% and 24.8% increase compared to the unamended control assay. Digestate of biochar- and graphene-amended assays resulted in higher TS% and alkalinity, reduced sCOD, VFA, and turbidity, and increased particle size distribution compared to control. Biochar-amended digestate had improved dewaterability, while digestate of graphene-amended assays resulted in inferior dewaterability compared to control. CM amendment improved microbial community by increasing acetoclastic methanogen growth and transforming the methanogenic metabolic pathways. At the genus level, Methanothrix abundance was 59.9%, 73.1%, and 85.4% of the microbial community in the digestate of control, BC-20, and GP-100, respectively. The difference between the biochar and graphene amended batch assays was significant, and biogas yield was closely correlated to the pH. CM-amended batch assays demonstrated superb fitting with modified Gompertz, logistic, and first-order models. A pilot-scale study and techno-economic and life cycle assessments are required to investigate environmental impacts and feasibility.
Data availability statement
The datasets presented in this study can be found in online repositories. The names of the repository/repositories and accession number(s) can be found in the article/Supplementary Material.
Author contributions
AA: conceptualization, data curation, formal analysis, methodology, validation, writing–original draft, and writing–review and editing. FM: supervision, writing–review and editing. ak: supervision, and writing–review and editing.
Funding
The author(s) declare that no financial support was received for the research, authorship, and/or publication of this article.
Acknowledgments
The authors extend their appreciation to the Deanship of College of Engineering and Department of Civil Engineering at King Saud University, Riyadh for facilitating this doctoral thesis work of the first author.
Conflict of interest
The authors declare that the research was conducted in the absence of any commercial or financial relationships that could be construed as a potential conflict of interest.
The reviewer MSM declared a shared affiliation with the author AK to the handling editor at the time of review.
Publisher’s note
All claims expressed in this article are solely those of the authors and do not necessarily represent those of their affiliated organizations, or those of the publisher, the editors, and the reviewers. Any product that may be evaluated in this article, or claim that may be made by its manufacturer, is not guaranteed or endorsed by the publisher.
References
Altamirano-Corona, M. F., Anaya-Reza, O., and Durán-Moreno, A. (2021). Biostimulation of food waste anaerobic digestion supplemented with granular activated carbon, biochar and magnetite: a comparative analysis. Biomass Bioenergy 149, 106105. doi:10.1016/j.biombioe.2021.106105
Ampese, L. C., Sganzerla, W. G., Ziero, H. D. D., Mudhoo, A., Martins, G., and Forster-Carneiro, T. (2022). Research progress, trends, and updates on anaerobic digestion technology: a bibliometric analysis. J. Clean. Prod. 331, 130004. doi:10.1016/j.jclepro.2021.130004
APHA (1998) Standard methods for the examination of water and wastewater. Washington, DC: American Public Health Association APHA.
Baek, G., Kim, J., Kim, J., and Lee, C. (2018). Role and potential of direct interspecies electron transfer in anaerobic digestion. Energies 11 (1), 107. doi:10.3390/en11010107
Bandgar, P. S., Jain, S., and Panwar, N. L. (2021). Current status, opportunities and challenges in anaerobic digestion in Indian context: an overview. Bioresour. Technol. Rep. 16, 100830. doi:10.1016/j.biteb.2021.100830
Chang, C. J., Tyagi, V. K., and Lo, S. L. (2011). Effects of microwave and alkali induced pretreatment on sludge solubilization and subsequent aerobic digestion. Bioresour. Technol. 102 (17), 7633–7640. doi:10.1016/j.biortech.2011.05.031
Charnier, C., Latrille, E., Jimenez, J., Lemoine, M., Boulet, J. C., Miroux, J., et al. (2017). Fast characterization of solid organic waste content with near infrared spectroscopy in anaerobic digestion. Waste Manag. 59, 140–148. doi:10.1016/j.wasman.2016.10.029
Chen, G., Weng, W., Wu, D., Wu, C., Lu, J., Wang, P., et al. (2004). Preparation and characterization of graphite nanosheets from ultrasonic powdering technique. Carbon 42 (4), 753–759. doi:10.1016/j.carbon.2003.12.074
DiLallo, R., and Albertson, O. E. (1961). Volatile acids by direct titration. J. Water Pollut. Control Fed., 356–365.
Dreywood, R. (1946). Qualitative test for carbohydrate material. Industrial Eng. Chem. Anal. Ed. 18 (8), 499. doi:10.1021/i560156a015
Eskicioglu, C., Droste, R. L., and Kennedy, K. J. (2007). Performance of anaerobic waste activated sludge digesters after microwave pretreatment. Water Environ. Res. 79 (11), 2265–2273. doi:10.2175/106143007x176004
Fu, Q., Wang, D., Li, X., Yang, Q., Xu, Q., Ni, B. J., et al. (2021). Towards hydrogen production from waste activated sludge: principles, challenges and perspectives. Renew. Sustain. Energy Rev. 135, 110283. doi:10.1016/j.rser.2020.110283
Gahlot, P., Ahmed, B., Tiwari, S. B., Aryal, N., Khursheed, A., Kazmi, A. A., et al. (2020). Conductive material engineered direct interspecies electron transfer (DIET) in anaerobic digestion: mechanism and application. Environ. Technol. innovation 20, 101056. doi:10.1016/j.eti.2020.101056
Guo, B., Zhang, Y., Zhang, L., Zhou, Y., and Liu, Y. (2020). RNA-based spatial community analysis revealed intra-reactor variation and expanded collection of direct interspecies electron transfer microorganisms in anaerobic digestion. Bioresour. Technol. 298, 122534. doi:10.1016/j.biortech.2019.122534
Kaur, G., Johnravindar, D., and Wong, J. W. (2020). Enhanced volatile fatty acid degradation and methane production efficiency by biochar addition in food waste-sludge co-digestion: a step towards increased organic loading efficiency in co-digestion. Bioresour. Technol. 308, 123250. doi:10.1016/j.biortech.2020.123250
Khursheed, A., Gaur, R. Z., Sharma, M. K., Tyagi, V. K., Khan, A. A., and Kazmi, A. A. (2018). Dependence of enhanced biological nitrogen removal on carbon to nitrogen and rbCOD to sbCOD ratios during sewage treatment in sequencing batch reactor. J. Clean. Prod. 171, 1244–1254. doi:10.1016/j.jclepro.2017.10.055
Kim, M., Chul, P., Kim, W., and Cui, F. (2022). Application of data smoothing and principal component analysis to develop a parameter ranking system for the anaerobic digestion process. Chemosphere 299, 134444. doi:10.1016/j.chemosphere.2022.134444
Lin, R., Cheng, J., Zhang, J., Zhou, J., Cen, K., and Murphy, J. D. (2017). Boosting biomethane yield and production rate with graphene: the potential of direct interspecies electron transfer in anaerobic digestion. Bioresour. Technol. 239, 345–352. doi:10.1016/j.biortech.2017.05.017
Lowry, O. H., Rosebrough, N. J., Farr, A. L., and Randall, R. J. (1951). Protein measurement with the Folin phenol reagent. J. Biol. Chem. 193 (1), 265–275. doi:10.1016/s0021-9258(19)52451-6
Nguyen, L. N., Vu, M. T., Johir, M. A. H., Pernice, M., Ngo, H. H., Zdarta, J., et al. (2021). Promotion of direct interspecies electron transfer and potential impact of conductive materials in anaerobic digestion and its downstream processing-a critical review. Bioresour. Technol. 341, 125847. doi:10.1016/j.biortech.2021.125847
Paritosh, K., Mathur, S., Pareek, N., and Vivekanand, V. (2018). Feasibility study of waste (d) potential: co-digestion of organic wastes, synergistic effect and kinetics of biogas production. Int. J. Environ. Sci. Technol. 15, 1009–1018. doi:10.1007/s13762-017-1453-5
Prondzinsky, P., Toyoda, S., and McGlynn, S. E. (2023). The methanogen core and pangenome: conservation and variability across biology's growth temperature extremes. DNA Res. 30 (1), dsac048. doi:10.1093/dnares/dsac048
Saudi green initiatives (2023). Saudi green initiatives. Available at: https://www.greeninitiatives.gov.sa/knowledge-hub/saudi-arabia-announces-300-increase-in-installed-renewables-capacity-439-million-trees-planted-since-launch-of-saudi-green-initiative (Accessed March, 2024).
Shi, X., Deng, L., Sun, F., Liang, J., and Deng, X. (2015). Key factors governing alkaline pretreatment of waste activated sludge. Chin. J. Chem. Eng. 23 (5), 842–846. doi:10.1016/j.cjche.2014.09.049
Wang, Z., Wang, T., Si, B., Watson, J., and Zhang, Y. (2021). Accelerating anaerobic digestion for methane production: potential role of direct interspecies electron transfer. Renew. Sustain. Energy Rev. 145, 111069. doi:10.1016/j.rser.2021.111069
Wentzel, M. C., Mbewe, A., Lakay, M. T., and Ekama, G. A. (2001). Evaluation of a modified flocculation filtration method to determine wastewater readily biodegradable COD. Chem. TECHNOLOGY-BEDFORDVIEW-, 21–23.
Xu, S., Zhang, W., Zuo, L., Qiao, Z., and He, P. (2020). Comparative facilitation of activated carbon and goethite on methanogenesis from volatile fatty acids. Bioresour. Technol. 302, 122801. doi:10.1016/j.biortech.2020.122801
Yang, Y., Zhang, Y., Li, Z., Zhao, Z., Quan, X., and Zhao, Z. (2017). Adding granular activated carbon into anaerobic sludge digestion to promote methane production and sludge decomposition. J. Clean. Prod. 149, 1101–1108. doi:10.1016/j.jclepro.2017.02.156
Keywords: waste-activated sludge, anaerobic digestion, biochar, graphene, microbial genome sequencing
Citation: Almegbl AM, Munshi FMA and Khursheed A (2024) Biogas enhancement in the anaerobic digestion of thermo-chemically pretreated sludge by stimulating direct interspecies electron transfer by biochar and graphene. Front. Chem. Eng. 6:1419770. doi: 10.3389/fceng.2024.1419770
Received: 18 April 2024; Accepted: 06 May 2024;
Published: 18 June 2024.
Edited by:
Antoni Sánchez, Autonomous University of Barcelona, SpainCopyright © 2024 Almegbl, Munshi and Khursheed. This is an open-access article distributed under the terms of the Creative Commons Attribution License (CC BY). The use, distribution or reproduction in other forums is permitted, provided the original author(s) and the copyright owner(s) are credited and that the original publication in this journal is cited, in accordance with accepted academic practice. No use, distribution or reproduction is permitted which does not comply with these terms.
*Correspondence: Anwar Khursheed, YWFobWFkNEBrc3UuZWR1LnNh