- 1Division of Research and Graduate Studies, Tecnológico Nacional de México/I.T., Los Mochis, Sinaloa, Mexico
- 2Department of Chemical and Biochemical Engineering, Tecnológico Nacional de México/I.T., Los Mochis, Sinaloa, Mexico
- 3Department of Electrical and Electronic Engineering, Tecnológico Nacional de México/I.T., Los Mochis, Sinaloa, Mexico
- 4Departament of Math and Basic Science, Tecnológico Nacional de México/I.T., Los Mochis, Sinaloa, Mexico
There is currently great interest in photocatalytic degradation technologies of pollutants in industrial effluents. This is due to the need to reduce the environmental pollution generated by the textile industry’s high demand of clothing for fast fashion; in addition to severe environmental problems, this also generates social problems. Since the catalysts of this type of processes are usually nanoparticles of metal oxides such as zinc and titanium, it is necessary to promote research into the synthesis and evaluation of photocatalysts. Therefore, this article describes three free basic access tools for the academic analysis of nanoparticles, from experimental design to representation, using the study of kinetics and particle size analysis. After pre-selecting easily accessible software, it was found that RStudio, J-Image, and Vesta are very useful programs for the analysis of nanoparticles in the respective areas of statistical processing, image analysis, and three-dimensional representation.
Introduction
Research into micro- and nanoparticles of metal oxides has increased rapidly in recent years (Ciambelli et al., 2020). In the synthesis and evaluation of photocatalytic capacity, numerous methods have been proposed for the synthesis of these important catalysts, including but not limited to solvothermal synthesis, sol-gel, green synthesis, and chemical vapor deposition (Garcia-Contreras et al., 2016).
With each process used, different particle sizes, photocatalytic capabilities, and energy consumptions are obtained (Nunes et al., 2019), opening a large field for experimentation in laboratories and molecular simulation. Variations in pressure, temperature, acidity, reaction time, precursors, and types of method are responsible for the various characteristics obtained (Gadea et al., 2018).
Therefore, it is common practice to vary the conditions for obtaining various micro or nanoparticles for their subsequent evaluation, which typically consists of determining particle size, crystal structure, and kinetic constant (Ono et al., 2012).
The method of experimental design is typically based on software, although the software license used in many universities generates a significant cost for the research project; in less ideal cases, software is misused to evade the payment of licenses and thus compromises research ethics.
There are several techniques for analyzing particle size and characterization, including X-ray diffraction and scanning electron microscopy; the first is a useful tool for structural analysis, and the second is useful for the visualization and better conceptualization of the product obtained. Once data and images have been obtained, manual processing can be performed, counting particles of a certain characteristic, and then statistical processing; however, the development of artificial intelligence, as well as computer image processing, has facilitated the automation of the process using currently free software such as Image-J.
On the other hand, the representation and three-dimensional analysis of crystal structures is important because it allows a theoretical understanding of several important properties of the crystals that form the nanoparticles, such as the bond distances, angles, and orientation of the crystal lattice.
The importance of free software goes beyond the reduction of costs in research processes: it allows greater transparency in the results obtained and encourages international collaboration in the generation of knowledge, reducing ethical issues that arise when there are specific interests on the part of commercial software development companies. This does not mean that license software is not suitable: it simply means that there is a reliable alternative to these.
Research into the micro- and nanoparticles of metal oxides has significantly grown in recent years (Ciambelli et al., 2020). One prominent area of investigation focuses on the synthesis and evaluation of their photocatalytic capacity. Various methods of synthesis, including solvothermal synthesis, sol-gel, green synthesis, and chemical vapor deposition, have been proposed for producing these crucial catalysts (Garcia-Contreras et al., 2016).
These different synthesis processes yield particles with distinct characteristics, such as particle size, photocatalytic capability, and energy consumption (Nunes et al., 2019). Consequently, a vast experimental landscape has emerged in laboratories and in molecular simulations. The manipulation of factors like pressure, temperature, acidity, reaction time, precursors, and the choice of method has led to the acquisition of various characteristics (Gadea et al., 2018).
One key aspect that plays a vital role throughout the different stages of such research is the utilization of software tools. The need for software arises in several phases, including experimental design (Peer, 2023), data analysis (Gomez-Flores et al., 2023), and visualization (Ono et al., 2012). Efficient software solutions not only streamline these processes but also enhance the accuracy and reproducibility of the research outcomes.
In the realm of open-access software, three essential tools have gained significant prominence for the analysis of photocatalytic particles: RStudio, ImageJ, and Vesta. RStudio, an integrated development environment (IDE) for the R programming language, offers a comprehensive suite of statistical and graphical techniques. Researchers can leverage its capabilities to design experiments, conduct data analysis, and generate visual representations of the results (Siegel and Wagner, 2022; Shedlock and Stumpo, 2022).
ImageJ, another powerful open-source software tool, is widely used for image processing and analysis. Its extensive range of plugins and algorithms enables researchers to extract valuable information from microscopy and imaging data. In the context of particle analysis, ImageJ facilitates particle counting, size measurement, and other morphological assessments (Fritz et al., 2022; Frei and Kruis, 2020).
Vesta, an analysis and visualization software application, plays a crucial role in representing and analyzing crystal structures (Zheng et al., 2021). With its three-dimensional analytical capabilities, researchers can explore bond distances, angles, and the orientation of the crystal lattice, with the possibility of simulating the nanoparticle’s structure (Banerjee et al., 2022). Such insights contribute to a deeper understanding of the properties and behavior of nanoparticles.
The reliance on open-access software offers numerous advantages. First, it significantly reduces the financial burden associated with licensed software, making research more accessible and affordable. Second, open-source software promotes transparency and reproducibility as the code and algorithms are openly available for scrutiny. This fosters collaboration and knowledge sharing within the scientific community, thus facilitating advances in the field.
Therefore, as research in the field of micro- and nanoparticles of metal oxides continues to expand, the role of software tools becomes increasingly vital. The use of open-source software such as RStudio, ImageJ, and Vesta addresses the need for efficient and accessible solutions throughout different stages of the research process. By leveraging these software tools, researchers can enhance experimental design, data analysis, and visualization, thus contributing to the progress and advancement of this exciting field of study.
Recommended tools
In the following sections, we will provide detailed descriptions of three recommended tools for data processing related to the analysis of micro and nanoparticles. These tools are not only valuable for the analysis of metal oxides but also for any synthesis and experimental evaluation process.
RStudio
R® software and its graphical environment, RStudio®, stand out as some of the most powerful tools for statistical analysis. This software offers an extensive collection of built-in statistical functions, providing researchers with a wide range of analytical capabilities. Moreover, R® enables the importation of numerous specialized libraries, allowing users to leverage a vast array of additional functionalities. Furthermore, researchers have the flexibility to program their own custom functions for tailored analysis within the R® environment (Kruschke).
Although RStudio may initially require some user familiarization, it offers a user-friendly interface and intuitive logic that simplifies the process of learning the syntax and swiftly processing results. Once users begin to explore RStudio, they can quickly grasp its functionalities and effectively utilize its vast range of statistical functions and libraries. The software’s intuitive nature facilitates a seamless transition for researchers, making it a valuable tool for statistical analysis.
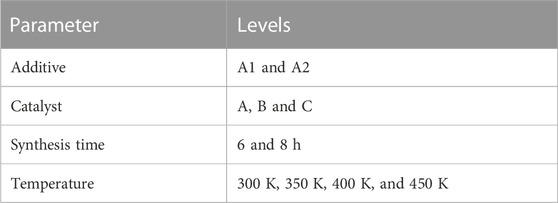
To illustrate the user-friendly nature of this program, a simple example is shown. The experimental design for a solvothermal synthesis involving three catalyst types, two synthesis times, and four temperature levels—outlined in Table 1—can be efficiently coded and visualized in just a few lines of code.
The code using the base program, as well as a library, in which case the experiment is coded, is presented in Table 2.
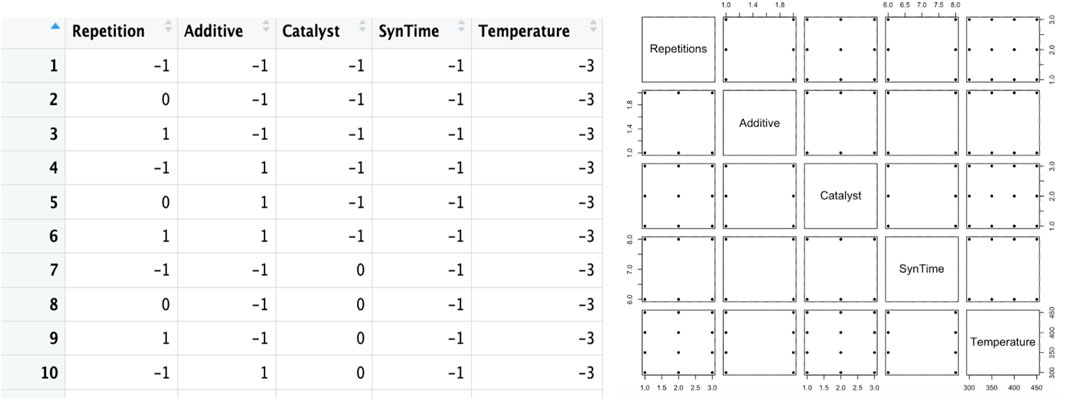
Figure 1 shows the first 10 elements of the design and its binary plot.
As a second example, the data analysis of particle size versus additive, catalyst type, synthesis time, and temperature is presented using a neural network.
The following table shows the code for data capture, basic plotting, and both artificial neural network and linear regression analysis.
Figure 2 shows a very basic example of a graph in RStudio, which has four input neurons, two hidden layers, and a single output neuron.
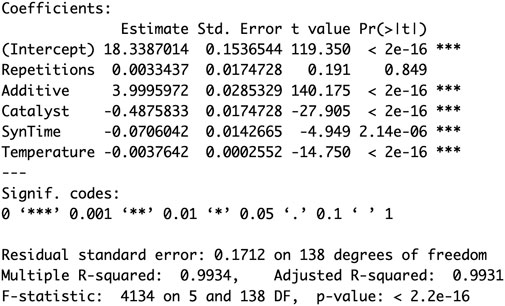
Figure 3 shows a summary of the linear regression, which confirms first-order behavior by Pearson’s coefficient of 99.34%.
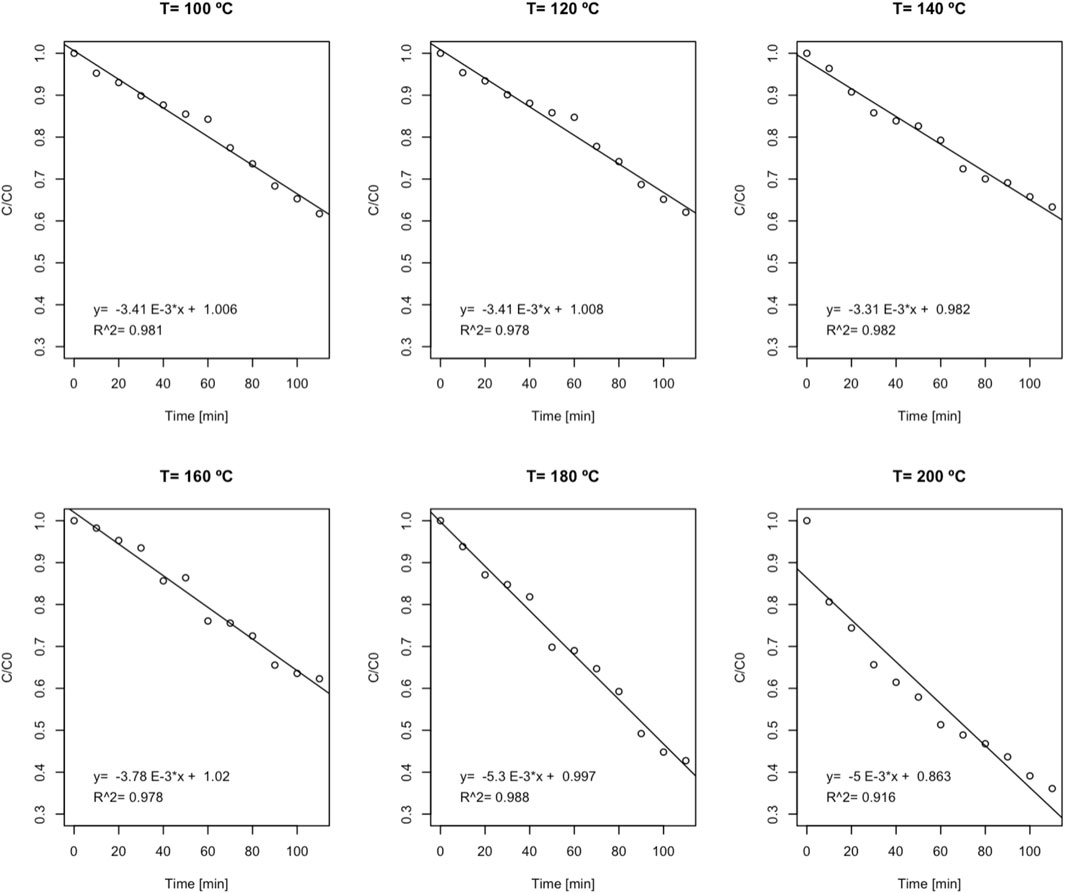
The software application has countless applications, which can help generate graphs that facilitate the analysis of the kinetics of the decomposition reaction of contaminants. This is exemplified in Figure 4, which summarizes the behavior of zero-order kinetics for particles synthesized at different temperatures, clearly showing that those synthesized at temperatures above 180°C do not conform to these kinetics; consequently, they possess photocatalytic activity.
The software package has many applications; however, it is not the purpose of this article to perform an exhaustive review but to show the benefits of the program.
ImageJ
ImageJ is a software application developed by the US Institute of Health which allows the processing of images of not only microparticles but also of images in general, having great application in the analysis of microorganisms, metallurgical analysis, and even space photography (Crawford and Mortensen, 2009).
As far as nanoparticle analysis is concerned, ImageJ finds great acceptance in the measurement of individual particles, as well as in the generation of histograms of this parameter for a region in general.
The operation of this software is intuitive, and, in the following paragraphs, some images of its application are shown.
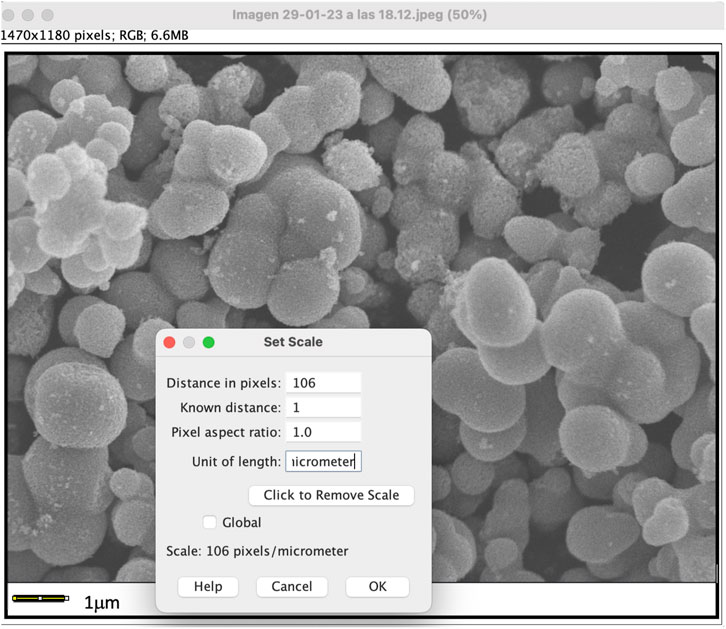
Figure 5 shows the stage at which the measurement scale is set, the distance at which this graphic scale is selected, and the selection of “Analyze” and “Set-Scale”.
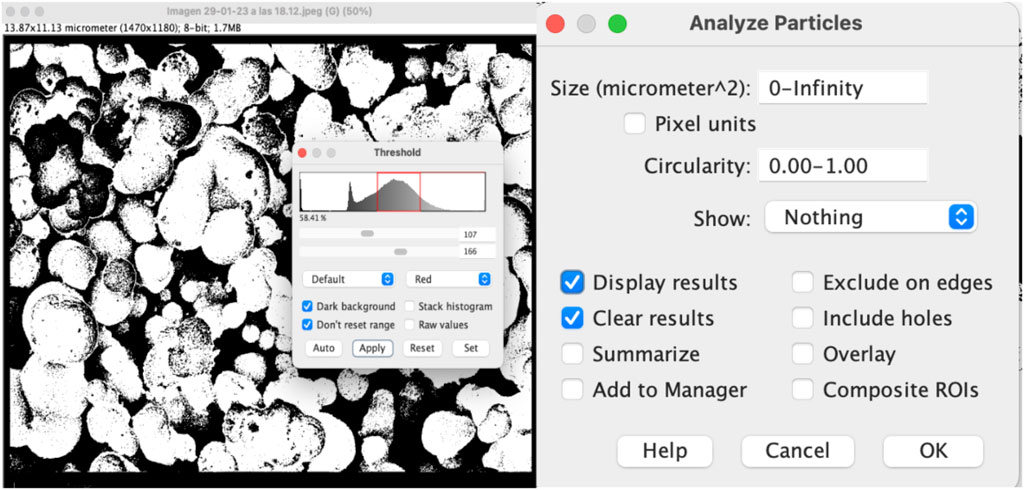
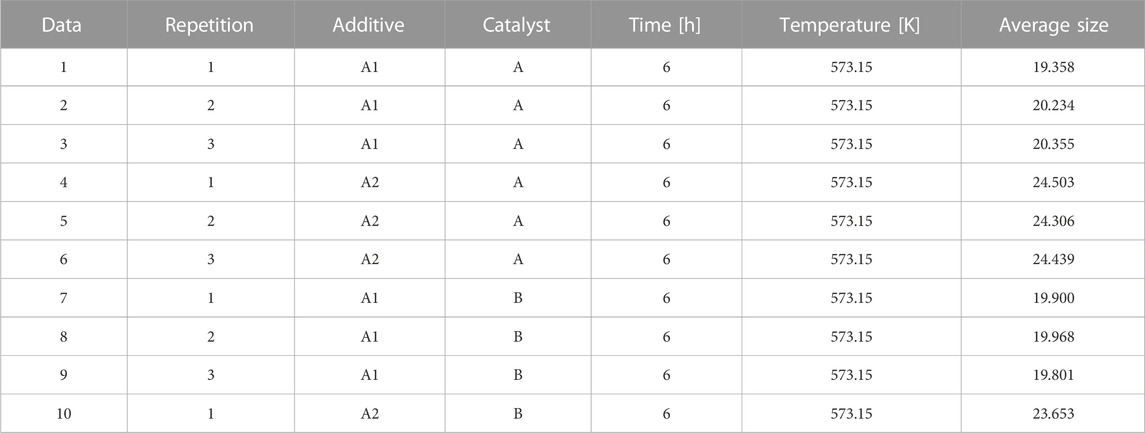
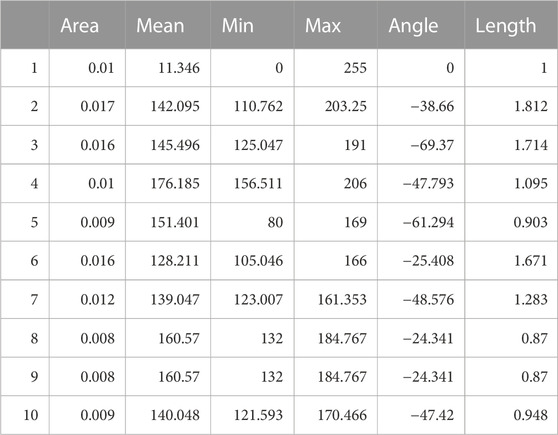
One of the advantages of this software is that it allows image transformations, such as changing it to 8 and 16 bits, vertical and horizontal rotation, and establishing detection thresholds. Figure 6 shows a 16-bit transformation, threshold setting, and particle size analysis screen, while Table 3 shows the results of the first 10 measurements.
As can be seen, this free access software is also very useful in particle size analysis and has many more applications.
Vesta
The Vesta software application was developed by JP-Minerals and is extremely practical for visualizing the structure of crystals that make up micro- and nanoparticles (Dubbeldam et al., 2019).
Open data can be queried on the Crystallography Open Database page for later viewing in Vesta and can also be obtained from image analysis and checked in this software.
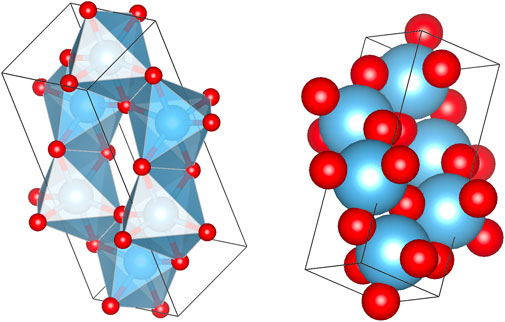
Figure 7 shows the three-dimensional representation of titanium oxide crystal lattices.
Vesta, an essential software tool for the analysis of crystal structures, is widely recommended for several compelling reasons. Although its visualization capabilities are noteworthy, Vesta offers a range of other powerful features that contribute to its broad recommendation for the field.
One of the key strengths of Vesta lies in its ability to provide accurate and detailed representations of crystal structures in three dimensions. By visualizing bond distances, angles, and the orientation of crystal lattices, researchers gain valuable insights into the properties and behavior of nanoparticles (Tripathi et al., 2021). This deep understanding of crystal structures allows for theoretical analysis and assists the interpretation of experimental results.
Moreover, this software provides advanced analysis tools that go beyond visualization. Researchers can perform crystallographic calculations such as symmetry analysis, coordination environments, and structural fingerprinting (Tripathi et al., 2021). These capabilities enable a comprehensive exploration and characterization of crystal structures and thus facilitate the investigation of crucial properties and phenomena.
The extensive range of features and functionalities offered by Vesta, combined with its user-friendly interface, has made it a widely recommended software tool in the scientific community. Researchers can rely on Vesta to not only visualize crystal structures effectively but also conduct in-depth analysis and derive meaningful insights from their data.
Conclusion
The reliability and accessibility of software play a crucial role in scientific and research advancements. Therefore, it is imperative to promote software tools that not only enjoy high prestige within the scientific community but are also freely available for use.
The universality of the three programs discussed in this paper is notable as they are compatible with operating systems such as Windows, Linux, and MacOS. This compatibility ensures that researchers and practitioners across different platforms can benefit from their functionalities.
Familiarity with the functionalities offered by RStudio, ImageJ, and Vesta is essential for students pursuing engineering careers, as well as for teachers and researchers involved in knowledge generation projects. From initial conceptualization to the subsequent analysis phase, these software tools provide indispensable support, empowering users to efficiently process and analyze data.
By promoting the utilization of these open-access software tools, we can foster collaboration, transparency, and international cooperation in research endeavors. The availability of reliable and free software solutions enables researchers to overcome financial barriers and facilitates the dissemination of knowledge, contributing to the advancement of scientific understanding.
In conclusion, in recognizing the importance of software in scientific endeavors, it is imperative to embrace and utilize renowned, freely accessible tools like RStudio, ImageJ, and Vesta. These tools empower researchers, educators, and students alike, enabling them to navigate the entire research process with enhanced efficiency and reliability (Tables 4, 5).
Author contributions
All authors listed have made a substantial, direct, and intellectual contribution to the work and approved it for publication.
Funding
The authors of the article wish to express their gratitude to the Tecnológico Nacional de México for the support to the projects “Study of the photocatalytic capacity of TiO2 microparticles, synthesized by the hydrothermal method with variation in the process temperature” (14516.22-P) and “Use of exoskeletons of marine species to obtain hydroxyapatite” (17748.23-P) in the Calls 2022 and 2023: Scientific Research Projects, Technological Development, and Innovation.
Conflict of interest
The authors declare that the research was conducted in the absence of any commercial or financial relationships that could be construed as a potential conflict of interest.
Publisher’s note
All claims expressed in this article are solely those of the authors and do not necessarily represent those of their affiliated organizations, or those of the publisher, the editors, and the reviewers. Any product that may be evaluated in this article, or claim that may be made by its manufacturer, is not guaranteed or endorsed by the publisher.
References
Banerjee, P., Roy, C., Santos, A. J., De, S. K., Morales, F. M., and Bhattacharyya, y. S. (2022). Unravelling the atomically resolved 3D shape of {111}, {010}, and {001} faceted small anatase nanoparticles. Mat. Today Nano 17, 100153. doi:10.1016/J.MTNANO.2021.100153
Ciambelli, P., La Guardia, G., and Vitale, L. (2020). Nanotechnology for green materials and processes. Stud. Surf. Sci. Catal. 179, 97–116. doi:10.1016/B978-0-444-64337-7.00007-0
Crawford, E. C., and Mortensen, J. K. (2009). An ImageJ plugin for the rapid morphological characterization of separated particles and an initial application to placer gold analysis. Comput. Geosci. 35 (2), 347–359. doi:10.1016/J.CAGEO.2007.11.012
Dubbeldam, D., Vreede, J., Vlugt, T. J., and Calero, y. S. (2019). Highlights of (bio-)chemical tools and visualization software for computational science. Curr. Opin. Chem. Eng. 23, 1–13. doi:10.1016/J.COCHE.2019.02.001
Frei, M., and Kruis, F. E. (2020). Image-based size analysis of agglomerated and partially sintered particles via convolutional neural networks. Powder Technol. 360, 324–336. doi:10.1016/J.POWTEC.2019.10.020
Fritz, M., Körsten, S., Chen, X., Yang, G., Lv, Y., Liu, M., Wehner, S., and Fischer, C. B., (2022). High-resolution particle size and shape analysis of the first Samarium nanoparticles biosynthesized from aqueous solutions via cyanobacteria Anabaena cylindrica. NanoImpact 26, 100398. doi:10.1016/J.IMPACT.2022.100398
Gadea, G., Morata, A., and Tarancon, y. A. (2018). Semiconductor nanowires for thermoelectric generation. Semicond. Semimetals 98, 321–407. doi:10.1016/BS.SEMSEM.2018.01.001
Garcia-Contreras, R., Scougall-Vilchis, R. J., Contreras-Bulnes, R., Sugimoto, M., Nakajima, H., and Sakagami, y. H. (2016). Effect of titanium dioxide nanoparticle on proliferation, drug-sensitivity, inflammation, and metabolomic profiling of human oral cells. Nanobiomaterials Dent. Appl. Nanobiomaterials 11, 49–77. doi:10.1016/B978-0-323-42867-5.00003-5
Gomez-Flores, A., Bradford, S. A., Cai, L., Urík, M., and Kim, y. H. (2023). Prediction of attachment efficiency using machine learning on a comprehensive database and its validation. Water Res. 229, 119429. doi:10.1016/J.WATRES.2022.119429
Kruschke, J. K. (2015). The R programming language. Doing Bayesian Data Anal. Chapter 3, 33–70. doi:10.1016/B978-0-12-405888-0.00003-9
Nunes, D., Pimentel, A., Santos, L., Barquinha, P., Pereira, L., and Fortunato, E., (2019). Synthesis, design, and morphology of metal oxide nanostructures. Mater. Oxide Nanostructures, Elsevier, Amsterdam, Netherlands, 21–57. doi:10.1016/B978-0-12-811512-1.00002-3
Ono, Y., Rachi, T., Okuda, T., Yokouchi, M., Kamimoto, Y., Nakajima, A., and Okada, K., (2012). Kinetics study for photodegradation of methylene blue dye by titanium dioxide powder prepared by selective leaching method. J. Phys. Chem. Solids 73 (2), 343–349. doi:10.1016/J.JPCS.2011.10.012
Peer, R. Rampado y. D. (2023). Design of experiments in the optimization of nanoparticle-based drug delivery systems. J. Control. Release 358, 398–419. doi:10.1016/J.JCONREL.2023.05.001
Shedlock, C. J., and Stumpo, K. A. (2022). Data parsing in mass spectrometry imaging using R studio and cardinal: A tutorial. J. Mass Spectrom. Adv. Clin. Lab. 23, 58–70. doi:10.1016/J.JMSACL.2021.12.007
Siegel, A. F., and Wagner, M. R. (2022). Statistical (machine) learning: Using complex models with large data sets. Pract. Bus. Stat., 571–599. doi:10.1016/B978-0-12-820025-4.00019-1
Tripathi, J., Chandrawat, G. S., Singh, J., Tripathi, S., and Sharma, y. A., Correlation among local structure, magnetic, structural and electronic properties in polyol synthesized iron sulfide (FeS2) nanoparticles”, J. Alloys Compd., vol. 861, p. 157977, 2021, doi:10.1016/J.JALLCOM.2020.157977
Keywords: photocatalyst, titanium, statistics, drawing, analysis, process, production, catalysis
Citation: Mendoza-Acosta A, Torres-Romero S, Orozco M, Cota M, Basurto RL and Galaviz LL (2023) Three basic open access software tools for academic analysis of photocatalytic particles. Front. Chem. Eng. 5:1153795. doi: 10.3389/fceng.2023.1153795
Received: 30 January 2023; Accepted: 19 June 2023;
Published: 20 July 2023.
Edited by:
Abdul Rahman Mohamed, University of Science Malaysia (USM), MalaysiaReviewed by:
Xiayi (Eric) Hu, Xiangtan University, ChinaCopyright © 2023 Mendoza-Acosta, Torres-Romero, Orozco, Cota, Basurto and Galaviz. This is an open-access article distributed under the terms of the Creative Commons Attribution License (CC BY). The use, distribution or reproduction in other forums is permitted, provided the original author(s) and the copyright owner(s) are credited and that the original publication in this journal is cited, in accordance with accepted academic practice. No use, distribution or reproduction is permitted which does not comply with these terms.
*Correspondence: Alexander Mendoza-Acosta, YWxleGFuZGVyLm1hQG1vY2hpcy50ZWNubS5teA==
 Alexander Mendoza-Acosta
 Suleyka Torres-Romero
 Martín Orozco3