- Process Systems Engineering, Department of Separation Science, School of Engineering Science, LUT University, Lappeenranta, Finland
CO2 absorption into aqueous potassium glycinate in a polypropylene membrane contactor was modelled using two alternative models: a 1D model and a 1D-2D model considering axial diffusion in the liquid phase. Models were fitted to experimental data using various fitting parameters, which were compared. Experiments were carried out under industrially relevant conditions characterized by CO2-loaded absorbent entering the contactor and high degree of reactant conversion over the contactor. The experiments and models were developed to specifically investigate the effect of changes in solution CO2 loading at contactor inlet. This is a key issue rarely reported in the literature, especially for amino acid salt solutions. Unexpectedly, the 1D model was found to explain the experimental results more accurately compared to the more complex 1D-2D model. This was the case for the base models, using only the membrane mass transfer coefficient as a fitting parameter, and the final models introducing secondary fitting parameters. The 1D model was found to show the best experimental fit following fitting of the equilibrium constant used in prediction of the enhancement factor. The 1D-2D model showed the best fit following correction of potassium glycinate diffusivity as a function of solution CO2 loading. The 1D approach was found to result in a computationally effective model with good fit to the present experimental data. This model provides a good basis for further development and could be considered for use in contactor design and optimization studies. It is suggested that various model simplifications led to inability of the 1D-2D model to accurately predict the experimental results.
1 Introduction
Carbon dioxide capture processes are considered key technology facilitating the decarbonization of the energy sector and emission-heavy chemical industries. Such processes aim to capture CO2 directly at the emission source followed by long-term storage of CO2 into various geological features (Bui et al., 2018), or by conversion of CO2 into valuable fuel or chemical products (Ampelli et al., 2015). Alternatively, CO2 can be captured directly from the atmosphere, making capture location-independent, but resulting in increased energy demand and costs due to the lower initial CO2 concentration (Goeppert et al., 2012).
Various types of processes have been developed for the capture of CO2 at emission sources (Boot-Handford et al., 2014). The selection of optimal technology most importantly depends on the CO2 concentration and conditions of the CO2-containing stream to be treated. The technologies can be roughly divided to those more suitable for pre-combustion capture, i.e., capture from high-CO2 concentration (<15%) and high-pressure (>25 bar) streams, and those applicable in post-combustion capture, characterized by low CO2 concentration (<15%) and low total pressure (∼1 atm), representing conditions typical to power plant flue gases (Feron et al., 2019). For the latter application, absorption of CO2 into aqueous amine solutions is considered the benchmark technology (Feron et al., 2020).
Membrane contactors have been investigated as alternative gas-liquid contacting equipment for absorption-based post-combustion capture processes (Zhao et al., 2016). Over conventionally used packed columns, the advantages of using membrane contactors include increased operational flexibility enabled by physical separation of the gas and liquid phases by the membrane, decreased equipment size due to higher specific gas-liquid contact area per unit volume, and simple scale-up due to the modular nature of membrane contactors. Unlike membrane gas separation processes, the membrane contactors are non-selective, with selective absorption of CO2 facilitated by chemical interaction between CO2 and the solvent.
To ensure membrane stability and to minimize the additional mass transfer resistance due to the membrane, the compatibility between the membrane material and the type of solvent is vital. A major challenge is the wetting of polymeric membranes by amine solutions, dictating the use of advanced membrane materials, or the use of alternative solutions with lesser wetting tendency (Mosadegh-Sedghi et al., 2014). A promising approach is the use of aqueous amino acid salt-based absorbents, as such solutions typically do not wet low-cost polymeric membranes due to their high surface tension compared to amine solutions (Kumar et al., 2002). Other than improved compatibility with membrane contactors, the relevant properties of amino acid salt solutions, including CO2 absorption rates and capacities, are generally comparable to those of amine solutions (Hu et al., 2018).
The present paper discusses the modelling of CO2 absorption into the aqueous amino acid salt potassium glycinate. A variety of models of varying complexity have been developed for aqueous amine solutions, mostly monoethanolamine (Chabanon et al., 2013; Gebremariam, 2017; Rivero et al., 2020). In summary, relatively simple models are developed in the 1D-domain based on isothermal assumption, empirical mass transfer correlations and use of the enhancement factor to predict the effect of reaction on the mass transfer rate (Rode et al., 2012; Albarracin Zaidiza et al., 2014). Characteristics of more complex models include the consideration of the axial direction in the liquid (and gas) phase, inclusion of heat effects, detailed calculation of reaction rates and prediction of physical properties, incorporation of rigorous chemical and phase equilibrium calculations, and also multi-component mass transfer including water and/or amine transfer (Rongwong et al., 2013; Hoff and Svendsen, 2014; Albarracin Zaidiza et al., 2016; Gebremariam, 2017).
Such models are more scarcely available for amino acid salt solutions such as potassium glycinate (Eslami et al., 2011; Masoumi et al., 2016; Ghasem, 2020). Compared to the previous work, the novel approach of the present study is to focus on the prediction of CO2 transfer rate as a result of changes in the lean solvent CO2 loading, i.e., the CO2 content in the solution entering the membrane contactor. At the same time, experiments were designed to approach industrial operating conditions characterized by high reactant conversion over the contactor. The lean loading is considered an important operating parameter as it directly influences the CO2 absorption rate and capacity of the solvent. It is also tied to the overall optimization of the capture process which consists of absorption and solvent regeneration, as regeneration of the solvent to lower loading increases the process energy consumption (Abu-Zahra et al., 2007). With some exceptions (Albarracin Zaidiza et al., 2015), model-based analyses on the effect of lean loading have not been reported even for conventional amine solvents, much less amino acid salt solutions. The present paper aims to address this by means of model development combined with experimental validation.
2 Materials and methods
2.1 Experimental
CO2 absorption experiments were carried out using 1 M aqueous potassium glycinate as the absorbing solution. The solution was prepared by neutralization of glycine (Sigma-Aldrich, >99%) with equimolar amount of potassium hydroxide (Sigma-Aldrich, >85%) dissolved in purified water. Concentration was verified (within 1% of nominal concentration) by potentiometric titration using 1 M hydrochloric acid. Feed gas consisted of nitrogen (>99.5%) mixed with 10 vol% of CO2 (AGA, >99.99%).
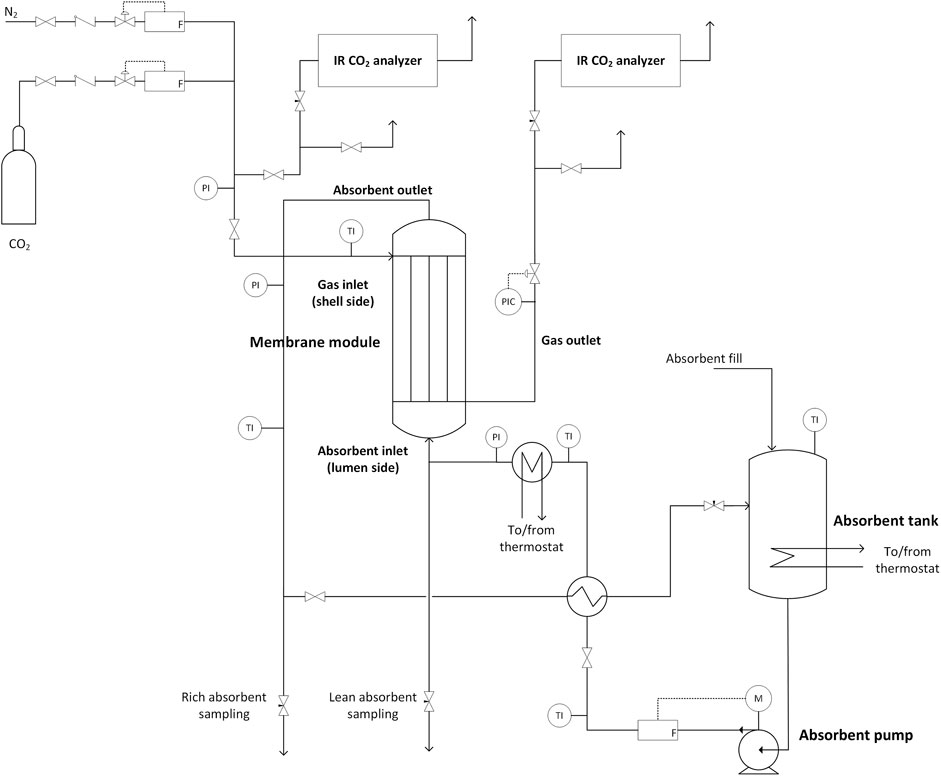
The experimental setup consisted of the membrane contactor (3 M Liqui-Cel 2.5 × 8 Extra-Flow) as the absorber, a buffer vessel for the absorbing solution, a magnetic drive gear pump (Pulsafeeder Eclipse E12) for solvent circulation, and equipment for controlling the solvent temperature prior to entering the absorber. A flowsheet of the unit is given in Figure 1, and details of the membrane contactor are given in Table 1. The flow configuration in the contactor was set up with liquid flowing on the lumen side (inside membrane fibers) and gas on the shell side. Liquid flow rate was controlled using a volume flow meter (Litre Meter LMX.48) and verified gravimetrically. Solution temperature was controlled by a heating coil installed within the solution vessel, and a plate heat exchanger (Alfa Laval, 0.2 m2) installed prior to the membrane contactor. Both were connected to circulating water heater/coolers (Lauda).
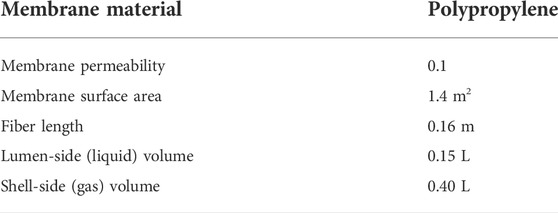
TABLE 1. Membrane contactor properties. Fiber details are omitted as this information is not publicly available from the supplier.
Inlet gas flows were controlled using mass flow controllers (Bronkhorst EL-FLOW Select). The CO2 concentration in the inlet and outlet gas was measured using infrared analyzers (Vaisala GMP251 probe and Indigo 201 transmitter). Gas pressure was controlled at contactor outlet using a back-pressure controller (Bronkhorst EL-PRESS). Liquid pressure was measured by pressure transducers and controlled using a manual needle valve. The pressure at gas outlet was automatically maintained 0.1 bar below the liquid inlet pressure. The control and measurement system was implemented using LabView (2015) software and a data acquisition system (NI cDAQ-9189). The control action and data collection frequency were 2000 and 10 Hz, respectively.
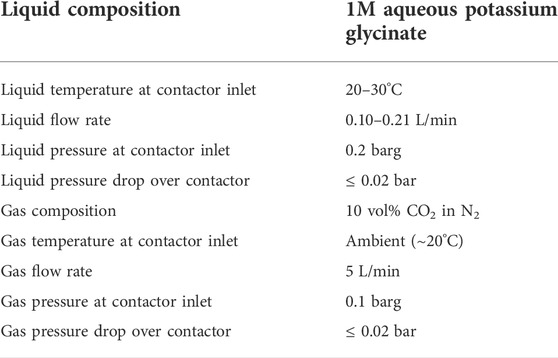
The absorption experiments were carried out in batch mode. The system was filled with a batch (4 L) of unloaded solution, which was then circulated for the duration of the experiment, continuously increasing the CO2 loading. Other experimental variables (liquid flow rate and temperature) and parameters (gas flow rate and composition, liquid and gas pressure) were controlled and maintained as close to constant as possible during each run. The operating conditions during the experiments are summarized in Table 2. The values given represent nominal or setpoint values. The actual measured values during each experimental run are found in Supplementary Tables A1–A3.
By continuous measurement of CO2 concentration in the outlet gas, combined with calculation of CO2 loading from periodically collected liquid samples (lean and rich solution), the CO2 recovery (Eq. 1) could be correlated with the lean loading during each experiment. The liquid CO2 loading was calculated based on a previously developed correlation with the solution density. The basis of this correlation is the volumetric measurement of CO2 released upon titration with 1 M HCl to neutral pH. The temperatures of lean and rich solution were also measured, and the average of these was taken to represent the temperature at each data point.
Where
2.2 Modelling
Two separate models were developed and validated using the experimental data. Both models are rating-type models aiming to predict the performance of the membrane contactor, using contactor sizing and absorbent and inlet gas composition, flow rates, and operating conditions as model inputs. Development of such models would facilitate sizing of the membrane contactor absorber unit, and combined with a solvent regeneration model, the overall optimization of the capture process in terms of energy consumption and overall cost.
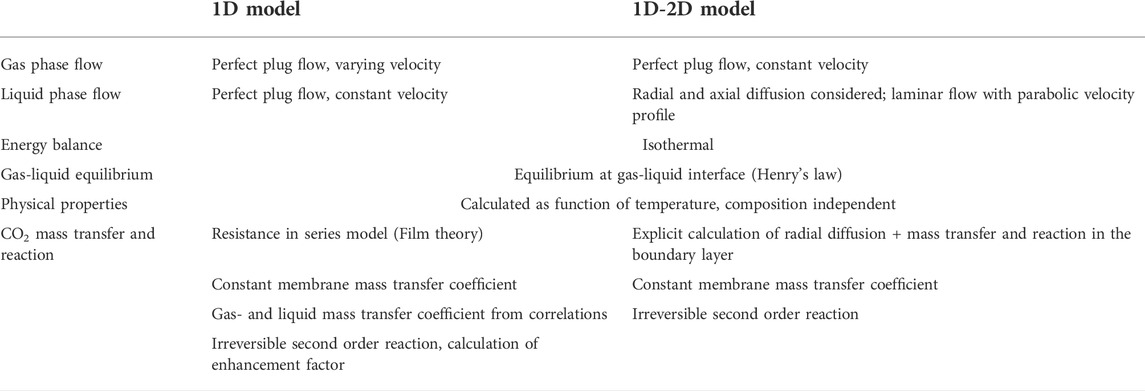
The models developed include a simplified 1D model and a 1D-2D model accounting for the convection-diffusion phenomena in the liquid phase. The latter model was created in order to investigate whether the added complexity and detail compared to the 1D model would yield more accurate prediction of the experimental data. The main assumptions taken in development of both models are described in Table 3. Ultimately, the objective of this work was to develop practical and computationally effective models to facilitate design and optimization studies. Detailed and fundamental physical and chemical characterization of the absorption process was thus not targeted. Thus, the 1D-2D model is also based on a relatively simple, empirical approach compared to more rigorous models described in the literature (Rongwong et al., 2013; Hoff and Svendsen, 2014; Albarracin Zaidiza et al., 2016; Gebremariam, 2017). All modelling was carried out using MATLAB software (R2019a).
When attempting to predict experimental results using the developed absorption models, all model inputs were set exactly as reported for the corresponding experiment and data point, as given in Supplementary Tables A1–A3.
2.2.1 Reaction and physical properties
Within both 1D and 1D-2D models, physical and chemical properties of 1M potassium glycinate and CO2 are calculated using experimental correlations as given in Table 4. The models consider a second order irreversible reaction between CO2 and the amino acid salt (Kumar et al., 2002):

TABLE 4. Physical property and reaction rate correlations or values used in 1D and 1D-2D absorption models. PG: potassium glycinate.
2.2.2 Gas-liquid equilibrium
The gas-liquid equilibrium of CO2 in 1 M potassium glycinate is modelled using the Henry’s law. The Henry’s law constant was calculated following (Portugal et al., 2009). First, the Henry constant for CO2 in water is calculated (Versteeg and Van Swaaij, 1988):
Where
The constant
Where
Where
Where
2.2.3 1D model
To take into account the evolution of mass transfer phenomena along the axial coordinate of the contactor, the 1D model developed in this study considers three separate mass transfer domains, i.e., CO2 transfer from the bulk phase to the gas-membrane interface, CO2 transfer through the membrane to the membrane-liquid interface and CO2 absorption in the liquid phase enhanced by the occurring chemical reaction between CO2 and potassium glycinate. The effective local mass transfer coefficient,
Where
Apart from neglecting axial and radial dispersion in the liquid and gas phases, the 1D model also assumes isothermal conditions, thermodynamic equilibrium at the gas-liquid interface and constant membrane mass transfer coefficient. In accordance with the experimental work performed in this study, in the gas phase, the model considers only CO2 and N2 species. It is also worth mentioning that N2 does also pass the membrane, but its mass transfer flux is negligible compared to CO2.
Therefore, CO2 mass balance in the gas phase is described with the following equation (Rode et al., 2012):
Where
The changes in the potassium glycinate concentration due to the chemical reaction in the liquid phase are considered through the following stoichiometric constraint:
Where
The changes in the volumetric gas flowrate due to the CO2 absorption are considered with the following global mass balance expression for the inert component:
Where
The gas phase pressure drop is determined with the Kozeny equation:
Where
To determine the effect of the potassium glycinate diffusion on the CO2 absorption, Hatta number,
Where
Where
This way, if the CO2 capture is not limited by reactant diffusion, the value of the enhancement factor
In case of the intermediate situation, i.e., partial diffusion limitation of potassium glycinate, the enhancement factor is evaluated with the equation developed by DeCoursey (1974):
To solve the obtained system of equations, the following boundary conditions were applied:
To solve the boundary value problem and determine CO2 concentration at the outlet,
2.2.4 1D-2D model
In contrast to the 1D model, the developed 1D-2D model takes account of the radial diffusion phenomena in the liquid phase and explicitly simulates the reaction between potassium glycinate and dissolved CO2. Therefore, for the liquid phase, the general form of the differential mass balance equation is considered, and no enhancement factor is required. This provides an opportunity to explicitly resolve diffusion in the radial direction together with mass transfer and reaction in the boundary layer. A grid independence study was conducted to ensure sufficient grid density and address the potential inaccuracies due to the sharp changes in the radial concentration profiles. More details on the grid independence study are provided in Supplementary Appendix C1.
Considering the negligible mass transfer resistance in the gas phase, the 1D assumption for this domain is consistent. This assumption is further corroborated by the physical properties of the membrane contactor–the wider shell side incites more turbulent flow in the gas phase, while the small inner diameter of a fiber leads to laminar liquid flow in the liquid phase. Therefore, axial convection and radial diffusion are modeled for the liquid phase, while constant velocity and perfect plug flow is assumed for the gas phase. Furthermore, the model also assumes isothermal conditions, thermodynamic equilibrium at the gas-liquid interface and constant membrane mass transfer coefficient.
While CO2 transfer phenomena occurring in the gas phase are modeled in the same way as in the 1D model, mass conservation equations for CO2 and potassium glycinate in the liquid phase are expressed in the following way:
Where
The transmembrane flux of CO2 is considered as a part of the boundary conditions applied in the radial direction:
Where
The rate of reaction between CO2 and potassium glycinate is determined with the following equation:
Accounting for the laminar flow of the liquid inside the hollow fibers, the parabolic velocity profile is assumed:
Where
The obtained system of differential equations was solved in MATLAB with the same boundary conditions applied in the axial direction (Eq. 20). Numerical method of lines was applied to discretize the obtained system of partial differential equations into a system of ordinary differential equations. More specifically, the first order radial derivatives were approximated with the fourth order finite difference approximation (dss004 algorithm as in (Schiesser, 2016), while the second order approximation (dss042 algorithm as in (Schiesser and Griffiths, 2009) was applied to the second order radial derivatives. Accounting for the sharp concentration fronts in close vicinity to the gas-liquid interface, a very fine discretization was applied to ensure numerical stability of the solution. More specifically, the liquid phase domain was discretized into 1,000 compartments in both radial and axial directions. As highlighted by the results of the grid independence study (Supplementary Appendix), no changes in the model’s accuracy were observed with a more refined discretization. The obtained system of ordinary differential equations is solved with a stiff, variable-step solver ode15s (Wouwer et al., 2014). Similar to the 1D model, the boundary value problem was solved iteratively via shooting method.
2.2.5 Parameter fitting
Both the 1D and 1D-2D models were fitted to the experimental data by means of empirical parameter fitting. Parameter fitting was carried out in MATLAB (R2019a) using the “fmincon” constrained non-linear equation solver to minimize the objective function. The objective function consisted of the summed error squared between the experimental and model results over all experimental runs. The parameter estimation procedure was found computationally effective with the 1D model (<5 min per estimation case) but slow (hours per case) and somewhat difficult to converge with the 1D-2D model. During the estimation, initial values and bounds for variables were manually refined in a trial-and-error fashion to assist quick solution. The presence of local optimums was not explicitly checked but no signs of multiple minima for the objective function were observed during the described estimation procedure.
The membrane mass transfer coefficient was used as the primary fitting parameter. This approach has been suggested as the accurate prediction of the membrane mass transfer coefficient is difficult and would require very detailed knowledge of the membrane pore size distribution and geometry that is generally not available (Chabanon et al., 2013).
In addition to the membrane mass transfer coefficient
Where
Correction of potassium glycinate diffusivity in solution was also considered. This was done via empirical correlation of the apparent diffusivity with the loading. It should be noted that the apparent diffusivity constitutes the overall or mean diffusivity of free potassium glycinate and ionic reaction products. The latter are not included in the present simplified models but are considered in rigorous models implementing chemical speciation and equilibrium calculations. In case of amines such as monoethanolamine, the diffusivity of the reaction products is known to be lower compared to free amine (Hoff, 2003). Thus, it is feasible to consider a decrease in the apparent diffusivity with increasing amine conversion. In the present work, various forms of correlation were tested, and the exponential correlation of the following form was found to yield the best model fit:
Where
3 Results
The results of this study consist of the resulting fits of 1D and 1D-2D model to the experimental data using various fitting parameters, and analysis of contactor performance using the fitted models.
3.1 1D model
3.1.1 Parameter fitting
Figure 2 presents the 1D model fits to experimental data using alternative fitting parameters as described in Section 2.2.5. For each experimental run and at each data point, model parameters were set to match corresponding experimental data (Supplementary Tables A1–A3). In the base model, only the membrane mass transfer coefficient is fitted. Other fits consider second fitting parameters in addition to the membrane mass transfer coefficient. The introduction of secondary parameters was found to improve the model fit by increasing the predicted effect of CO2 loading on the CO2 recovery, i.e., making the curves shown in Figure 2 steeper. The difference between the various models is most prominent in prediction of results from the third experiment, at 30°C and 0.21 L min−1.
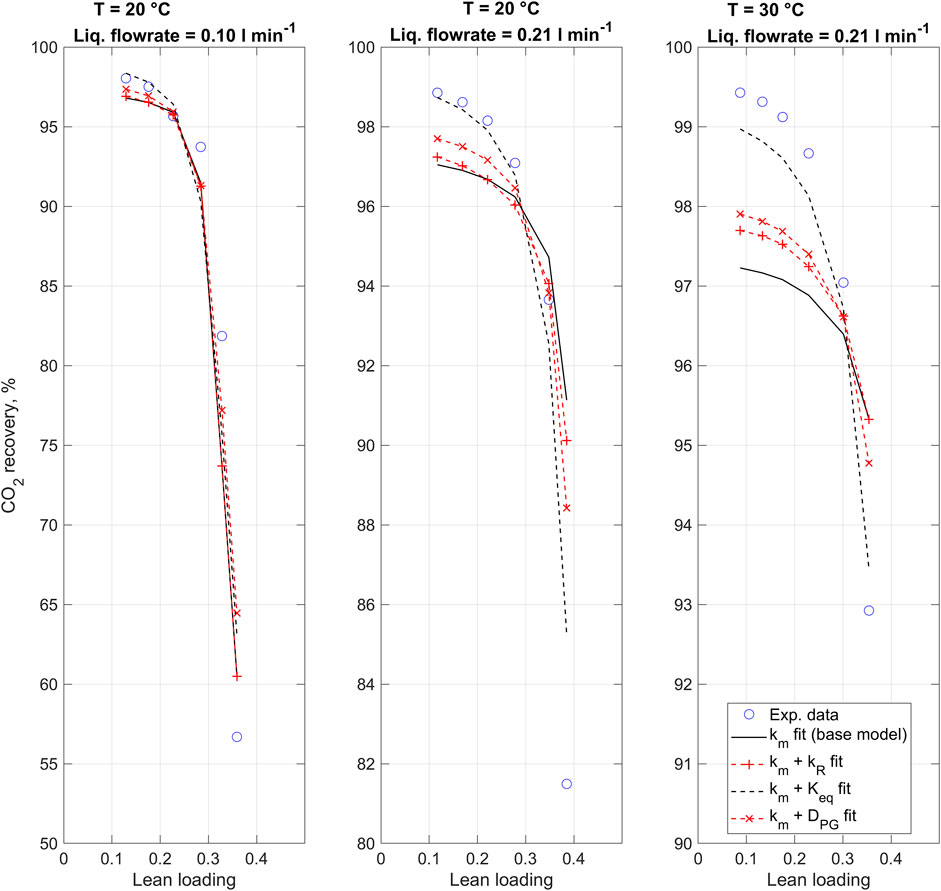
FIGURE 2. 1D CO2 absorption model fitted to experimental data using alternative fitting parameters. Note the different y-axes.
Table 5 compares the resulting 1D model fits with the alternative fitting parameters. In terms of coefficient of determination (R2), the best fit to experimental data was found with the combination of the membrane mass transfer coefficient and the equilibrium constant
3.1.2 Contactor performance and profiles
CO2 absorption in the membrane contactor was investigated using the 1D model with Keq fitted. Figure 3 presents the normalized concentrations of CO2 in the gas phase and potassium glycinate in the liquid phase over the contactor length. The model results are shown for replicated experimental cases, using the corresponding experimental conditions as model inputs in each case. Detailed operating conditions for the corresponding runs are given in Supplementary Tables A1–A3. The left-hand plot shows predicted concentrations during a single run at varied lean loading, and the right-hand plot compares the results of different runs at nearly identical lean loading.
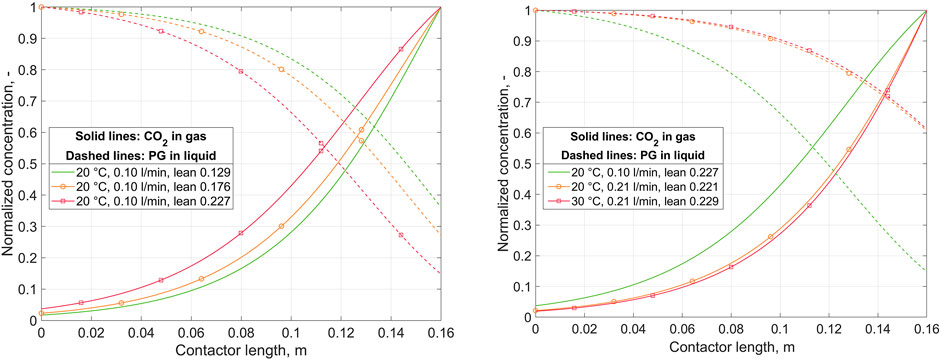
FIGURE 3. Normalized concentration of CO2 in gas and potassium glycinate (PG) in liquid over the contactor length, as predicted by the 1D absorption model. Left: variation of lean loading at constant liquid flow rate and temperature. Right: variation of liquid flow rate and temperature at (nearly) constant lean loading. Liquid inlet at z = 0, gas inlet at z = 0.16.
Figure 4 presents the variation in volumetric CO2 flux transferred from gas to liquid over the contactor length. The volumetric flux corresponds to the CO2 flux per overall contactor volume. The results are shown for replicated experimental cases. Detailed operating conditions for the corresponding runs are given in Supplementary Tables A1–A3. The left-hand plot shows predicted concentrations during a single run at varied lean loading, and the right-hand plot compares the results of different runs at nearly identical lean loading.
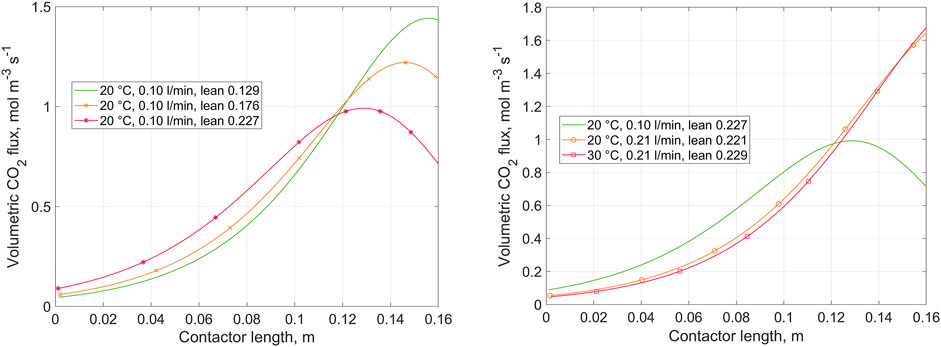
FIGURE 4. Volumetric CO2 flux from gas to liquid over the contactor length, as predicted by the 1D absorption model. Left: variation of lean loading at constant liquid flow rate and temperature. Right: variation of liquid flow rate and temperature at (nearly) constant lean loading. Gas inlet at z = 0, liquid inlet at z = 0.16.
Figure 5 presents the variation in calculated enhancement factor for chemical absorption over the contactor length. Enhancement factor was calculated following Eqs 13–16. The equilibrium constant
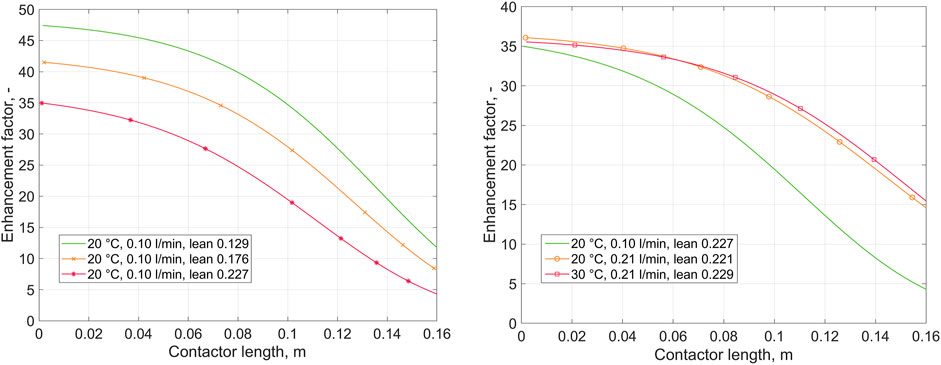
FIGURE 5. Calculated enhancement factor over the contactor length, as predicted by the 1D absorption model. Left: variation of lean loading at constant liquid flow rate and temperature. Right: variation of liquid flow rate and temperature at (nearly) constant lean loading. Gas inlet at z = 0, liquid inlet at z = 0.16.
3.2 1D-2D model
3.2.1 Parameter fitting
Figure 6 compares the experimentally determined CO2 recovery values and corresponding results obtained with the 1D-2D model. For each experimental run and at each data point, model parameters were set to match corresponding experimental data (Supplementary Tables A1–A3). It can be noted that the 1D-2D model exhibits poor accuracy in description of the experimental results if membrane mass transfer coefficient is used as the only adjustable parameter. Introduction of secondary fitting parameters results in a considerable improvement in the agreement between experimental and simulation results. Table 6 compares the resulting 1D-2D model fits with the alternative fitting parameters. Correction of the potassium glycinate diffusivity resulted in the most improved accuracy. Even with the resulting model, the fit remains poor for the third experiment carried out at 30°C and 0.21 L min−1.
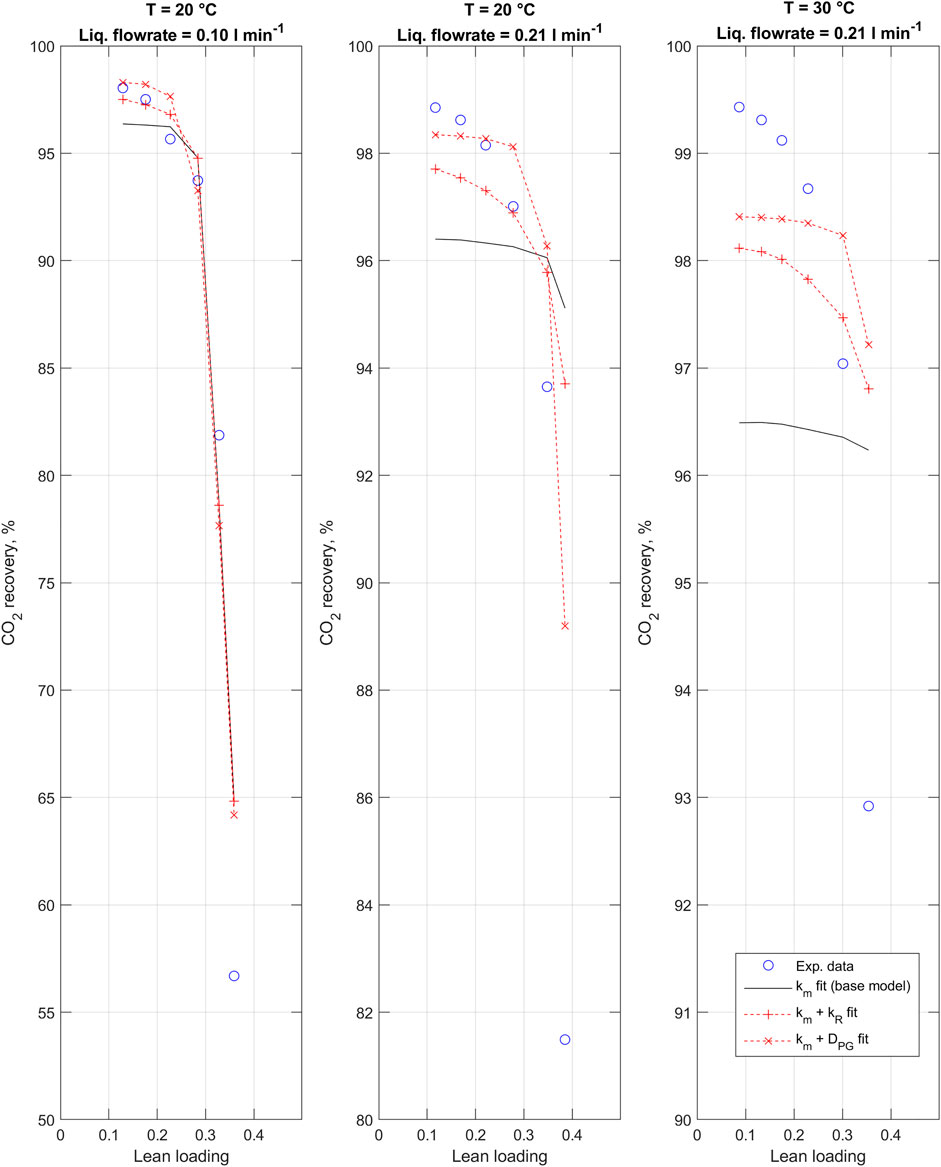
FIGURE 6. 1D-2D CO2 absorption model fitted to experimental data using alternative fitting parameters. Note the different y-axes.
3.2.2 Concentration profiles
Since the 1D-2D model explicitly simulates concentrations of CO2 and potassium glycinate in the liquid phase, it enables visualization of the actual concentration profiles of these species inside the fiber. This way, for the purpose of improved understanding of the CO2 capture process, Figures 7, 8 illustrate concentration profiles of potassium glycinate and dissolved CO2, respectively.
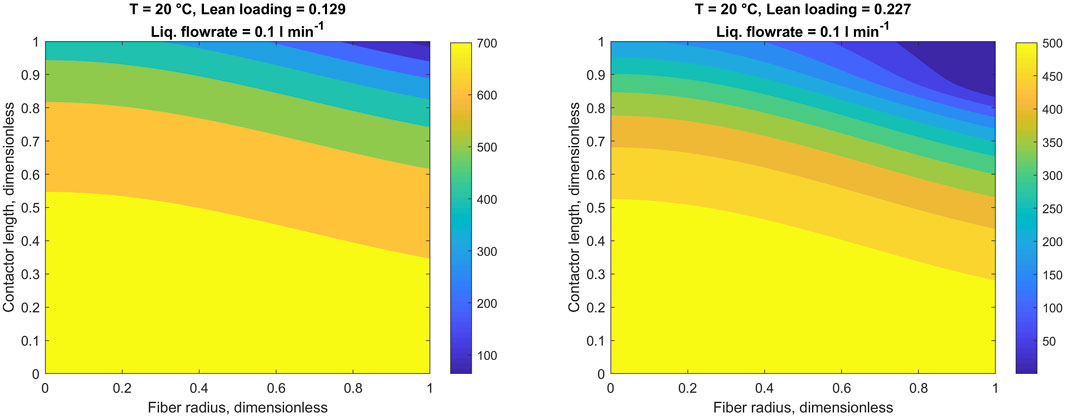
FIGURE 7. Potassium glycinate concentration profiles in the liquid phase. Heatmaps denote potassium glycinate concentration in mol m−3. Fiber wall at r = 1.
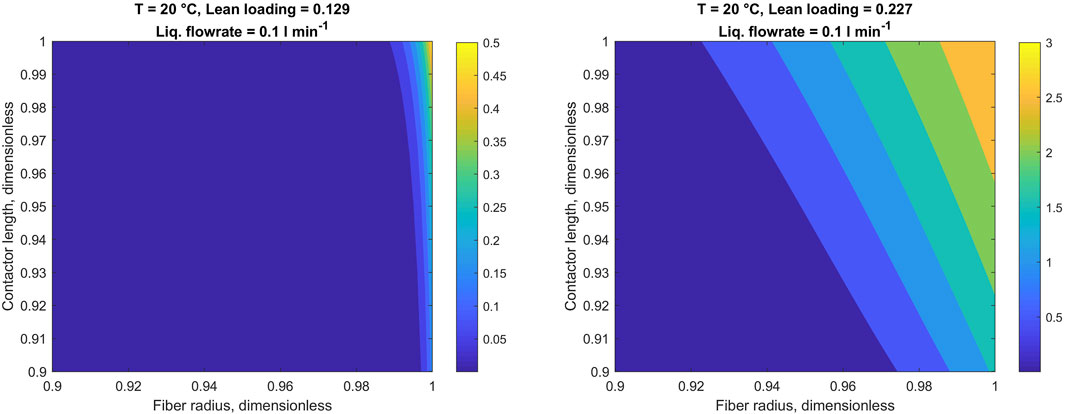
FIGURE 8. CO2 concentration profiles in the liquid phase. Heatmaps denote CO2 concentration in mol m−3. Fiber wall at r = 1. Note limited x- and y-axis.
It is worth mentioning that due to reaction between potassium glycinate and CO2 concentration of dissolved CO2 is almost negligible for the most part. Relatively high concentrations of dissolved CO2 can be observed only at the gas inlet point, where potassium glycinate solution is comparatively low. Therefore, to illustrate the dissolved CO2 concentration, Figure 8 is focused on the region located in the close vicinity to liquid-membrane interface near the gas inlet. To highlight the changes in the CO2 concentration at the gas-liquid interface with variation in solution CO2 loading, Figure 9 gives the same profiles in average concentration over the fiber length.
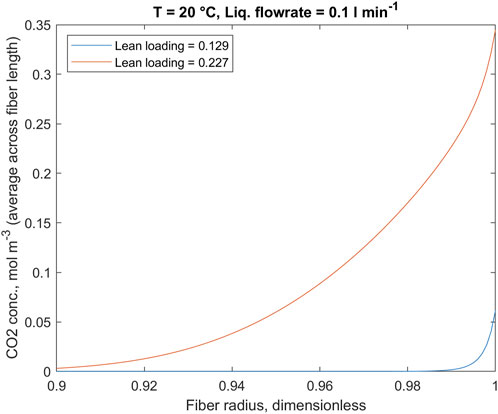
FIGURE 9. Liquid-phase CO2 concentration along the fiber radius; the values are average over the fiber length. Fiber wall at r = 1. Note limited x-axis.
4 Discussion
Discussion of results presented above is divided into two sections. First, fitting of model parameters and resulting fits to experimental data are explained and potential model limitations identified. Next, the contactor modelling results obtained with the best-fit models are analyzed.
4.1 Model development and parameter fitting
Empirical parameter fitting was carried out to improve the fit of models to the experimental data. The membrane mass transfer coefficient was selected as the primary fitting parameter. This approach has been suggested as the accurate estimation of the mass transfer coefficient would require the characterization of gas diffusivities and membrane properties at such detail that is difficult to realize in practice (Chabanon et al., 2013). Furthermore, the membrane mass transfer coefficient is strongly affected by partial wetting of the membrane via much reduced diffusivity of CO2 in liquid-filled as opposed to gas-filled pores (Mosadegh-Sedghi et al., 2014). It is noted that the primary motivation of utilizing amino acid salt-based absorbents (such as potassium glycinate) instead of more common amine solutions is the much reduced membrane wetting tendency due to higher surface tension of the ionic salt solutions (Kumar et al., 2002).
With such parameter fitting, the membrane mass transfer coefficient is reduced to a lumped parameter that adjusts the model predictions not only via membrane properties, but also corrects for various effects including changes in operating conditions (flow rates, temperature, pressure), phenomena not captured by the model due to various simplifications, and also experimental error. For this reason, direct comparison of mass transfer coefficient values between different experimental and modelling studies may not be very meaningful. However, the values obtained here (approximately 2 × 10⁻⁴ m s−1) are consistent with experimental studies with polypropylene contactors (Franco et al., 2008; Lin et al., 2009). Furthermore, the obtained values are nearly identical between the 1D and 1D-2D models. This gives us some confidence in the ability of both models to capture the major mass transfer effects taking place in the contactor.
On the other hand, the fit of both models to experimental data remains unsatisfactory with only the membrane mass transfer coefficient fitted (1D model: Figure 2; 1D-2D: Figure 6). In summary, the model fits are found relatively good at low CO2 loading, but deteriorate as the loading increases. Thus, the base models are not able to sufficiently predict the effect of CO2 loading. Somewhat surprisingly, the simpler 1D model is found to give better predictions over the loading range investigated. Potential explanations for this are discussed below. Due to the insufficient model fits, the inclusion of second fitting parameters in addition to the membrane mass transfer coefficient was considered. These parameters were selected to adjust either the reaction rate between CO2 and potassium glycinate, or potassium glycinate diffusivity in the liquid phase, having identified these as key phenomena affecting the overall absorption rate.
One of the key differences between the two models is the approach used to estimate the effect of reaction between CO2 and potassium glycinate on CO2 absorption. In the 1D model, this is done via estimation of the enhancement factor by means of literature correlations. Two distinct reaction regimes are identified: when reaction is limited by intrinsic rate of reaction, the enhancement factor is given by the Hatta number (Eq. 13); and when reaction is limited by reactant diffusion, the corresponding infinite enhancement factor is calculated (Eq. 14). In the present model, an edited version of the infinite enhancement factor is used to potentially improve the prediction at high reactant conversion (Hoff and Svendsen, 2014). This formulation is also suitable for reversible reactions via introduction of the apparent equilibrium constant
The reaction rate constant and the apparent equilibrium constant
In the 1D-2D model, the reaction rate is explicitly calculated using the second order rate equation (Eq. 22). This approach should in principle yield more accurate results as the reaction rate depends on the actual reactant concentrations and is not implicitly calculated via correlations for the enhancement factor. However, the accuracy of reaction rate calculations may suffer from the simplification to consider only “apparent” concentrations of free potassium glycinate and molecular CO2 instead of including the actual ionic reactants and products in solution. The rigorous approach would be to calculate the chemical equilibrium between the solution species and then calculate both the reaction rate and the mass transfer driving force based on these concentrations (Hoff, 2003). Also, instead of the simple second order relation used here, more complex reaction rate equations could be used following calculation of all species concentrations. Reversible reaction could also be considered to potentially improve the predictions at higher loading. It is noted that in the 1D approach, reversibility is implicitly considered in calculation of the infinite enhancement factor via the fitted equilibrium constant.
It is noted that the Astarita formulation (Astarita et al., 1983), based on shared extent of reaction between the individual equilibrium reactions within the system, has been employed as a computationally effective method to introduce chemical species calculations for amine systems. It would be interesting to use this approach for amino acid salts, as this has apparently not been done in the literature. Alternative approaches have, however, been developed to calculate the chemical speciation in aqueous amino acid salt-CO2 systems (Portugal et al., 2009; Mondal et al., 2015).
Alternatively, fitting a correlation to correct the potassium glycinate diffusivity as a function of CO2 loading was tested for both models. The exponential form of this correlation is purely empirical and was obtained after testing various formulations. This correction improves the fit for both models. It is suggested that the improvement in the 1D case is again due to the limiting effect of diffusion on the reaction rate under the investigated conditions. Thus, this is essentially an indirect correction of the reaction rate, which is now decreased at increasing CO2 loading. In the 1D model, the liquid and gas mass transfer coefficients are not directly affected by the potassium glycinate diffusivity (Supplementary Appendix B1).
In the 1D-2D model, the diffusion of potassium glycinate in the liquid is explicitly modelled. In the absence of chemical species calculations, the added diffusivity correlation results in an apparent diffusivity value that should be understood to represent the “average” for both free potassium glycinate and the ionic reaction products. In the case of amine solutions, the diffusivity of products is known to be lower compared to free amine (Hoff, 2003). Assuming the same holds for potassium glycinate solutions, this would provide a physically consistent basis for correction the apparent diffusivity as a function of CO2 loading. The 1D-2D model fit is significantly improved with introduction of this correction but remains poor compared to the 1D model.
In summary, the 1D approach appears much more promising of the two models considered in this study. This model is both significantly faster to compute and yields more accurate predictions when compared to the present experimental data. In the literature, 1D models are generally found suitable for design and optimization studies while not providing the same accuracy as more rigorous 2D models (Chabanon et al., 2013; Hoff and Svendsen, 2014; Albarracin Zaidiza et al., 2016). The present 1D model should be further developed and tested with a more comprehensive set of experimental data under a wider range of operating conditions. To further approach the industrial operating conditions, investigations should be carried out at higher amino acid salt concentration and at higher absorption temperature. For better prediction over a wider temperature range, adiabatic instead of isothermal modelling should likely be carried out as the temperature changes over the contactor due to heat of absorption can be significant (Albarracin Zaidiza et al., 2015).
The 1D-2D model developed here would require significant improvement to justify its use over the simpler model. It appears that the various simplifications taken result in a model that fails to capture the relevant effects taking place under the investigated operating conditions. Besides the isothermal assumption and omitting chemical speciation, a number of potential limitations can be identified. These include more rigorous phase equilibrium calculations (e.g., using equations of state), more detailed calculations of physical properties as function of both temperature and composition, and multicomponent mass transfer. As amino acid salts are non-volatile, the latter would probably consider the evaporation and transfer of water and possibly resulting complications such as membrane wetting by condensation.
4.2 Fitted model results
The contactor performance was investigated using both the 1D and 1D-2D models. For both models, the fitting parameters resulting in the best fit to experimental data (Tables 5, 6) were selected, representing the final version of each model developed within this study.
The concentration, CO2 flux, and enhancement factor profiles generated using the 1D model were presented (Figures 3–5) to show the effects of the major operating parameters: CO2 loading, liquid flow rate, and temperature. Within the studied range of operating conditions, the concentration and flux profiles lead to the following conclusions: the CO2 flux is increased with increasing liquid flow rate, decreased with increasing loading, and not significantly affected by the temperature. Decreasing the liquid flow rate results in a decrease in the liquid mass transfer coefficient (Supplementary Appendix B1). More importantly, reduction of the liquid flow rate, while keeping the gas flow rate constant, results in a more significant increase in CO2 loading over the contactor. For reference, the modelled rich loading at 0.10 L min−1 is 0.46, and that at 0.21 L min−1 (both at 20 and 30°C) is 0.33. At higher loading, free glycinate is more significantly depleted, which leads to a decrease in the reaction rate, as indicated by the enhancement factor. The same is seen when comparing the data obtained at varying lean loading but constant flow rate at 0.21 L min−1. In this case, from low to high lean loading, the modelled rich loading is 0.37, 0.41, 0.46, respectively.
Effects of changing the liquid temperature are not as straightforward to characterize. On the other hand, increase in temperature increases both the reaction rate and diffusivity. However, it also affects the vapor-liquid equilibrium, with the absorption capacity of the solvent decreased with increasing temperature. In the present case, the various effects seem to offset as the difference between CO2 recovery (both experimental and calculated) at 20°C or 30°C is minor. Looking at Figure 2, the recovery at 30°C seems to be higher at the higher end of the CO2 loading range (above 0.3). Above, it was suggested that at high loading, reaction (and absorption) become increasingly limited by reactant diffusion. It could be that the diffusion limitation is somewhat reduced at the higher temperature due to increased potassium glycinate diffusivity. It is noted that careful conclusion about the effect of temperature should be made from this work due to limited number of experiments carried out in narrow temperature range, and the isothermal assumption made in model development.
To illustrate the more detailed results obtained from the 1D-2D model, the two-dimensional concentration profiles of potassium glycinate and CO2 in the liquid phase are presented in Figures 7, 8, respectively. Owing to the parabolic velocity profile in the liquid phase, the changes in both concentration profiles bear a parabola-like shape. As CO2 comes through the liquid-membrane interface, the rate of decrease in potassium glycinate concentration is the highest in close vicinity to the membrane. In contrast, the potassium glycinate concentration in the center of the fiber remains comparatively unaffected in light of the relatively slow diffusion in the liquid phase. However, as the reaction proceeds and potassium glycinate is being consumed, its concentration gradually decreases across the entire fiber width. This is particularly evident in case of high lean loading of the potassium glycinate concentration (Figure 7, right).
At the same time, the concentration profile of dissolved CO2 follows the reversed pattern. More specifically, higher CO2 concentrations in the liquid phase are caused by low potassium glycinate concentrations. This is explicable considering that dissolved CO2 species are consumed in the reaction with potassium glycinate. As the reaction perishes due to the low potassium glycinate concentration, more CO2 gets dissolved into the liquid phase. This trend is particularly noticeable when comparing Figures 7, 8. The changes in CO2 concentration profile at the gas-liquid interface, located at fiber wall, are highlighted in Figure 9. The very sharp profile at low loading is broadened when the reaction rate slows down with increasing loading. This decrease in the concentration gradient is consistent with the decrease in enhancement factor as found with the 1D model.
5 Conclusion
CO2 absorption into aqueous potassium glycinate in a polypropylene membrane contactor was modelled using two alternative models: a 1D model and a 1D-2D model considering axial diffusion in the liquid phase. While the latter represents a slightly more rigorous approach, both models are empirical in nature and simplified compared to more detailed models presented in the literature for various absorbent systems, mostly aqueous amines. Both models were fitted to experimental data, with experiments carried out under the industrially relevant conditions characterized by CO2-loaded absorbent entering the contactor, and high degree of reactant conversion over the contactor. In addition, experiments were developed to specifically investigate the effect of changes in solution CO2 loading on the CO2 absorption rate, a key issue that seems to be rarely reported in the literature, especially for amino acid salt solutions.
Somewhat surprisingly, the 1D model was found to explain the experimental results more accurately compared to the more complex 1D-2D model. This was the case for the base models, using only the membrane mass transfer coefficient as a fitting parameter, and the final models with secondary fitting parameters introduced. The 1D model was found to show the best experimental fit following fitting of the apparent equilibrium constant, introduced to improve the enhancement factor prediction for reversible reactions at high reactant conversion. The 1D-2D model showed the best fit with empirical correction of potassium glycinate diffusivity as a function of solution CO2 loading. It is suggested that the various simplifications taken lead to inability of the 1D-2D to accurately predict the experimental results. On the other hand, the 1D model provides a computationally effective model with good fit to the present experimental data. This model warrants further development and testing against further experiments carried out under a wider range of operational conditions.
Data availability statement
The original contributions presented in the study are included in the article/Supplementary Material, further inquiries can be directed to the corresponding author.
Author contributions
HN: ideation and planning, experimental work, model development and calculations, manuscript preparation. PM: model development and calculations, manuscript preparation. AL: model development, manuscript editing. TK: manuscript editing, supervision.
Funding
Funding for the research was provided from the P2XEnable project which is primarily funded by Business Finland.
Acknowledgments
The contributions from Vesa Ruuskanen and Lauri Järvinen from LUT School of Energy Systems are acknowledged.
Conflict of interest
The authors declare that the research was conducted in the absence of any commercial or financial relationships that could be construed as a potential conflict of interest.
Publisher’s note
All claims expressed in this article are solely those of the authors and do not necessarily represent those of their affiliated organizations, or those of the publisher, the editors and the reviewers. Any product that may be evaluated in this article, or claim that may be made by its manufacturer, is not guaranteed or endorsed by the publisher.
Supplementary material
The Supplementary Material for this article can be found online at: https://www.frontiersin.org/articles/10.3389/fceng.2022.982891/full#supplementary-material
References
Abu-Zahra, M. R. M., Schneiders, L. H. J., Niederer, J. P. M., Feron, P. H. M., and Versteeg, G. F. (2007). CO2 capture from power plants. Int. J. Greenh. Gas Control 1, 37–46. doi:10.1016/S1750-5836(06)00007-7
Albarracin Zaidiza, D., Belaissaoui, B., Rode, S., Neveux, T., Makhloufi, C., Castel, C., et al. (2015). Adiabatic modelling of CO2 capture by amine solvents using membrane contactors. J. Membr. Sci. 493, 106–119. doi:10.1016/j.memsci.2015.06.015
Albarracin Zaidiza, D., Billaud, J., Belaissaoui, B., Rode, S., Roizard, D., and Favre, E. (2014). Modeling of CO2 post-combustion capture using membrane contactors, comparison between one- and two-dimensional approaches. J. Membr. Sci. 455, 64–74. doi:10.1016/j.memsci.2013.12.012
Albarracin Zaidiza, D., Wilson, S. G., Belaissaoui, B., Rode, S., Castel, C., Roizard, D., et al. (2016). Rigorous modelling of adiabatic multicomponent CO2 post-combustion capture using hollow fibre membrane contactors. Chem. Eng. Sci. 145, 45–58. doi:10.1016/j.ces.2016.01.053
Ampelli, C., Perathoner, S., and Centi, G. (2015). CO2 utilization: An enabling element to move to a resource-and energy-efficient chemical and fuel production. Phil. Trans. R. Soc. A 373, 20140177. doi:10.1098/rsta.2014.0177
Astarita, G., Savage, D. W., and Bisio, A. (1983). Gas treating with chemical solvents. John Wiley & Sons.
Boot-Handford, M. E., Abanades, J. C., Anthony, E. J., Blunt, M. J., Brandani, S., Mac Dowell, N., et al. (2014). Carbon capture and storage update. Energy Environ. Sci. 7, 130–189. doi:10.1039/c3ee42350f
Bui, M., Adjiman, C. S., Bardow, A., Anthony, E. J., Boston, A., Brown, S., et al. (2018). Carbon capture and storage (CCS): The way forward. Energy Environ. Sci. 11, 1062–1176. doi:10.1039/c7ee02342a
Chabanon, E., Roizard, D., and Favre, E. (2013). Modeling strategies of membrane contactors for post-combustion carbon capture: A critical comparative study. Chem. Eng. Sci. 87, 393–407. doi:10.1016/j.ces.2012.09.011
DeCoursey, W. J. (1974). Absorption with chemical reaction: Development of a new relation for the danckwerts model. Chem. Eng. Sci. 29, 1867–1872. doi:10.1016/0009-2509(74)85003-7
Eslami, S., Mousavi, S. M., Danesh, S., and Banazadeh, H. (2011). Modeling and simulation of CO2 removal from power plant flue gas by PG solution in a hollow fiber membrane contactor. Adv. Eng. Softw. 42, 612–620. doi:10.1016/j.advengsoft.2011.05.002
Feron, P., Cousins, A., Jiang, K., Zhai, R., Shwe Hla, S., Thiruvenkatachari, R., et al. (2019). Towards zero emissions from fossil fuel power stations. Int. J. Greenh. Gas Control 87, 188–202. doi:10.1016/j.ijggc.2019.05.018
Feron, P. H. M., Cousins, A., Jiang, K., Zhai, R., and Garcia, M. (2020). An update of the benchmark post-combustion CO2-capture technology. Fuel 273, 117776. doi:10.1016/j.fuel.2020.117776
Franco, J., DeMontigny, D., Kentish, S., Perera, J., and Stevens, G. (2008). A study of the mass transfer of CO2 through different membrane materials in the membrane gas absorption process. Sep. Sci. Technol. 43, 225–244. doi:10.1080/01496390701791554
Gebremariam, S. K. (2017). Norwegian University of Science and Technology. PhD thesis. Trondheim, Norway.
Ghasem, N. (2020). Modeling and simulation of the simultaneous absorption/stripping of CO2 with potassium glycinate solution in membrane contactor. Membr. (Basel) 10, 72. doi:10.3390/membranes10040072
Goeppert, A., Czaun, M., Surya Prakash, G. K., and Olah, G. A. (2012). Air as the renewable carbon source of the future: An overview of CO 2 capture from the atmosphere. Energy Environ. Sci. 5, 7833–7853. doi:10.1039/c2ee21586a
Hamborg, E. S., Van Swaaij, W. P. M., and Versteeg, G. F. (2008). Diffusivities in aqueous solutions of the potassium salt of amino acids. J. Chem. Eng. Data 53, 1141–1145. doi:10.1021/je700736x
Hoff, K. A. (2003). Modeling and experimental study of carbon dioxide absorption in a membrane contactor.
Hoff, K. A., and Svendsen, H. F. (2014). Membrane contactors for CO2 absorption - application, modeling and mass transfer effects. Chem. Eng. Sci. 116, 331–341. doi:10.1016/j.ces.2014.05.001
Hu, G., Smith, K. H., Wu, Y., Mumford, K. A., Kentish, S. E., and Stevens, G. W. (2018). Carbon dioxide capture by solvent absorption using amino acids: A review. Chin. J. Chem. Eng. 26, 2229–2237. doi:10.1016/j.cjche.2018.08.003
Kiusalaas, J. (2010). Numerical methods in engineering with MATLAB. New York: Cambridge University Press.
Kumar, P. S., Hogendoorn, J. A., Feron, P. H. M., and Versteeg, G. F. (2002). New absorption liquids for the removal of CO2 from dilute gas streams using membrane contactors. Chem. Eng. Sci. 57, 1639–1651. doi:10.1016/S0009-2509(02)00041-6
Lin, S. H., Hsieh, C. F., Li, M. H., and Tung, K. L. (2009). Determination of mass transfer resistance during absorption of carbon dioxide by mixed absorbents in PVDF and PP membrane contactor. Desalination 249, 647–653. doi:10.1016/j.desal.2008.08.019
Masoumi, S., Rahimpour, M. R., and Mehdipour, M. (2016). Removal of carbon dioxide by aqueous amino acid salts using hollow fiber membrane contactors. J. CO2 Util. 16, 42–49. doi:10.1016/j.jcou.2016.05.008
Mondal, B. K., Bandyopadhyay, S. S., and Samanta, A. N. (2015). VLE of CO2 in aqueous sodium glycinate solution - new data and modeling using Kent-Eisenberg model. Int. J. Greenh. Gas Control 36, 153–160. doi:10.1016/j.ijggc.2015.02.010
Mosadegh-Sedghi, S., Rodrigue, D., Brisson, J., and Iliuta, M. C. (2014). Wetting phenomenon in membrane contactors - causes and prevention. J. Membr. Sci. 452, 332–353. doi:10.1016/j.memsci.2013.09.055
Portugal, A. F., Derks, P. W. J., Versteeg, G. F., Magalhães, F. D., and Mendes, A. (2007). Characterization of potassium glycinate for carbon dioxide absorption purposes. Chem. Eng. Sci. 62, 6534–6547. doi:10.1016/j.ces.2007.07.068
Portugal, A. F., Sousa, J. M., Magalhães, F. D., and Mendes, A. (2009). Solubility of carbon dioxide in aqueous solutions of amino acid salts. Chem. Eng. Sci. 64, 1993–2002. doi:10.1016/j.ces.2009.01.036
Rivero, J. R., Panagakos, G., Lieber, A., and Hornbostel, K. (2020). Hollow fiber membrane contactors for post-combustion carbon capture: A review of modeling approaches. Membr. (Basel) 10, 382. doi:10.3390/membranes10120382
Rode, S., Nguyen, P. T., Roizard, D., Bounaceur, R., Castel, C., and Favre, E. (2012). Evaluating the intensification potential of membrane contactors for gas absorption in a chemical solvent: A generic one-dimensional methodology and its application to CO 2 absorption in monoethanolamine. J. Membr. Sci. 389, 1–16. doi:10.1016/j.memsci.2011.09.042
Rongwong, W., Assabumrungrat, S., and Jiraratananon, R. (2013). Rate based modeling for CO2 absorption using monoethanolamine solution in a hollow fiber membrane contactor. J. Membr. Sci. 429, 396–408. doi:10.1016/j.memsci.2012.11.050
Schiesser, W., and Griffiths, G. (2009). A compendium on partial differential equation models. New York: Cambridge University Press.
Schiesser, W. (2016). Method of lines PDE analysis in biomedical science and engineering. John Wiley & Sons.
Versteeg, G. F., and Van Swaaij, W. P. M. (1988). Solubility and diffusivity of acid gases (carbon dioxide, nitrous oxide) in aqueous alkanolamine solutions. J. Chem. Eng. Data 33, 29–34. doi:10.1021/je00051a011
Wouwer, A. V., Saucez, P., and Vilas, C. (2014). Simulation of ODE/PDE models with MATLAB®, OCTAVE and SCILAB: Scientific and engineering applications. Springer. doi:10.1007/978-3-319-06790-2
Zhao, S., Feron, P. H. M., Deng, L., Favre, E., Chabanon, E., Yan, S., et al. (2016). Status and progress of membrane contactors in post-combustion carbon capture: A state-of-the-art review of new developments. J. Membr. Sci. 511, 180–206. doi:10.1016/j.memsci.2016.03.051
Nomenclature
Abbreviations
Keywords: CO2 capture, CO2 absorption, membrane contactor, amino acid salt, potassium glycinate, modelling
Citation: Nieminen H, Maksimov P, Laari A and Koiranen T (2022) Modelling the effect of CO2 loading of aqueous potassium glycinate on CO2 absorption in a membrane contactor. Front. Chem. Eng. 4:982891. doi: 10.3389/fceng.2022.982891
Received: 30 June 2022; Accepted: 04 August 2022;
Published: 31 August 2022.
Edited by:
Eric Favre, Université de Lorraine, FranceReviewed by:
Kok Keong Lau, University of Technology Petronas, MalaysiaAlexander William Dowling, University of Notre Dame, United States
Copyright © 2022 Nieminen, Maksimov, Laari and Koiranen. This is an open-access article distributed under the terms of the Creative Commons Attribution License (CC BY). The use, distribution or reproduction in other forums is permitted, provided the original author(s) and the copyright owner(s) are credited and that the original publication in this journal is cited, in accordance with accepted academic practice. No use, distribution or reproduction is permitted which does not comply with these terms.
*Correspondence: Harri Nieminen, aGFycmkubmllbWluZW5AbHV0LmZp
 Harri Nieminen
 Pavel Maksimov
 Arto Laari
 Tuomas Koiranen