 John McGinty
 Vaclav Svoboda1
 Pol MacFhionnghaile
 Jan Sefcik
95% of researchers rate our articles as excellent or good
Learn more about the work of our research integrity team to safeguard the quality of each article we publish.
Find out more
ORIGINAL RESEARCH article
Front. Chem. Eng. , 10 August 2022
Sec. Microfluidic Engineering and Process Intensification
Volume 4 - 2022 | https://doi.org/10.3389/fceng.2022.896329
This article is part of the Research Topic Membrane Engineering and Process Intensification View all 5 articles
Organic salt crystallisation is of great importance to the pharmaceutical industry as many pharmaceutical products are marketed as salts with salt formation being an essential step in drug development. The model compound used in this work is the polymorphic organic salt ethylenediammonium 3,5-dinitrobenzoate (EDNB) which is the 2:1 salt of 3,5-dinitrobenzoic acid with ethylenediamine. Crystallisation of the two EDNB polymorphs, the stable monoclinic form and the metastable triclinic form, was performed in both semi-batch and continuous processes using continuous mixing approaches. It was demonstrated that continuous mixing approaches, using various types of continuous mixers (co-axial, Ehrfeld, X-mixer) can be used to crystallise the EDNB salt with consistent yield and particle size distribution while achieving control over polymorphic form. The experiments were designed with use of a solution speciation model which provided process understanding and insight to guide development of salt crystallisation processes.
Organic salt crystallisation is of great importance to the pharmaceutical industry as many pharmaceutical products are marketed as salts. Salt formation is a popular technique as it modifies and optimises physiochemical properties. Important properties including solubility, dissolution rate and stability can be improved by using a range of pharmaceutically acceptable counter-ions (Stahl and Wermuth, 2011). In fact, it is possible to form a wide range of salts from an active acidic or basic compound and therefore salt screening and selection are typically carried out in order to discover which salt has the best overall properties for the intended application (Berge et al., 1977; Bastin et al., 2000). Despite the importance of organic salt crystallisation there is a lack of literature describing appropriate design principles which is in stark contrast with the crystallisation of single component molecules.
Currently, the predominant method of performing salt crystallisation in the pharmaceutical industry is to use stirred tank reactors (STRs) operated in batch mode. In the pharmaceutical industry there are long development timelines and uncertain project outcomes to commercial products so batch technology is often used by default due to its flexibility. Moreover, even for products which are commercialised, only relatively small volumes are produced which traditionally favours the use of batch rather than continuous operations (Leuenberger, 2001; Plumb, 2005). Despite their widespread use there are several challenges with batch STRs. The major challenge is that of scale up and technology transfer which is especially true for mixing-controlled processes, such as antisolvent, reactive crystallisation and multicomponent crystallisation (MacFhionnghaile et al., 2017; Svoboda et al., 2017; Raza et al., 2018; McGinty et al., 2020; Ramakers et al., 2020), such as salt formation. It is usually challenging to scale up mixing-controlled processes from the laboratory to the plant scale due to variability in critical quality attributes of the particulate product arising due to mixing. An additional challenge of batch processing is the variation in compositional and temperature control over the entire vessel.
The challenges of poor scalability, limited control of the critical quality attributes and poor yield may be addressed by switching from batch to continuous crystallisation (McGinty, 2020). Continuous crystallisation offers the advantages of reduced waste and energy consumption (due to increased yields and smaller equipment) in addition to greater process control (by using PAT at steady state) and reduced costs (combined effect of other advantages) (Plumb, 2005; Brown et al., 2018). Due to the prevalence of stirred tank reactors in the pharmaceutical industry, the most straightforward continuous setup may be a single stage or cascade of mixed-suspension, mixed-product-removal crystallisers (MSMPRs) (Neugebauer et al., 2018; Dunn et al., 2019). Another possible continuous setup is the tubular plug flow crystalliser (PFC) which exhibits improved mass and heat transfer rates due to the higher area/volume ratio of the slurry (specific surface area). Several studies have shown how tubular PFCs have been utilised to control crystal size and solid form (Briggs et al., 2015; McGlone et al., 2015). Crystallisation processes relying on mixing induced supersaturation, such as antisolvent and reactive crystallisation, including salt formation, need to be developed with close attention to design and scale up of the mixing process itself. Mixing of miscible liquid streams lends itself to continuous approaches which can ensure reproducibility and scalability and have been used in a wide range of crystallisation processes (MacFhionnghaile et al., 2017; Svoboda et al., 2017; Raza et al., 2018; McGinty et al., 2020; Ramakers et al., 2020).
In this study, semi-batch and continuous crystallisation processes were performed with the use of continuous mixing approaches. Various types of continuous mixers were utilised, providing consistent and scalable mixing decoupled for flow conditions in crystallisation vessels. A previously developed solution speciation model (McGinty, 2017) was used to design the crystallisation experiments and provide greater insight into the salt crystallisation process. The solution speciation model allows for pH and composition to be calculated simply from knowing the overall solution composition, dissociation constants and salt solubility products.
3,5-Dinitrobenzoic acid (99%), ethylenediamine (≥99.5%), and sulphuric acid (98%) were supplied by Sigma Aldrich. Sodium hydroxide (98%) was supplied by Fisher Scientific. Deionised water was produced using an in-house Millipore Milli-Q system.
The system being studied in this work is the crystallisation of the polymorphic organic salt ethylenediammonium 3,5-dinitrobenzoate (EDNB). EDNB is the 2:1 salt of 3,5-dinitrobenzoic acid (3,5-DNBA) with ethylenediamine where 3,5-DNBA is a weak acid and ethylenediamine is a weak base (Nethaji et al., 1992; Lynch et al., 1994). Figure 1 shows the molecular structure of the 2:1 EDNB salt.

FIGURE 1. Molecular structure of ethylenediamine 3,5-dinitrobenzoate (EDNB).
The two polymorphs of EDNB are recorded in the Cambridge Crystallographic Database: a monoclinic form (VUJXIH01; P21/c) and a triclinic form (VUJXIH; P1) (Davey and Jones, 2008; Groom et al., 2016). The crystal structure diagrams of both polymorphs have been reported in literature (Jones et al., 2005).
3,5-DNBA is a monoprotic acid with a single dissociation constant,
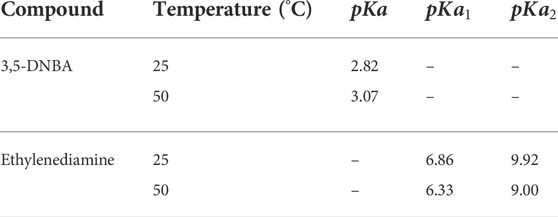
TABLE 1. Summary of literature dissociation constants for 3,5-DNBA and ethylenediamine (Kortum et al., 1961; Gupta and Soni, 1965; Hyde, 2000).
Knowledge of the
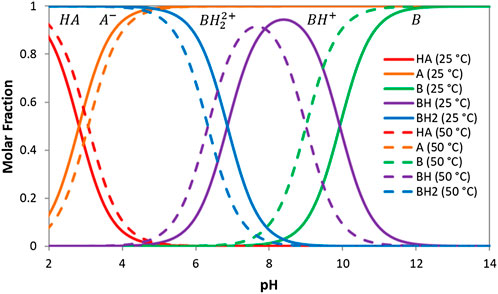
FIGURE 2. Speciation profiles for 3,5-dinitrobenzoic acid and ethylenediamine at 25 and 50°C. HA and A are the protonated and deprotonated 3,5-dinitrobenzoic acid respectively. BH2, BH and B are the double protonated, single protonated and deprotonated ethylenediamine respectively.
In this system, the materials of interest are EDNB monoclinic and EDNB triclinic and their solubilities are determined by Eq. 1. The activity coefficient for the monovalent ions is represented by
The solubility product (
The solubility product is estimated by fitting experimental EDNB salt solubility measurements using Eq. 1. A summary of the solubility products taken from literature and used in this work are shown in Table 2.
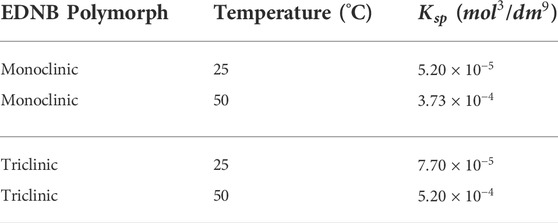
TABLE 2. Summary of literature data for the solubility products (Jones et al., 2005; Davey and Jones, 2008).
Inserting the estimated
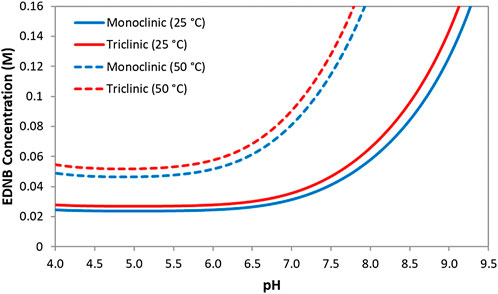
FIGURE 3. Ideal pH-solubility profiles for EDNB monoclinic and EDNB triclinic at 25 and 50°C.
The supersaturation was calculated as the natural log of the ratio of the concentration product of the EDNB ions under the process conditions and the equilibrium solubility product.
3,5-DNBA and ethylenediamine were dissolved in an aqueous sodium hydroxide (NaOH) solution to create a basic solution where both 3,5-DNBA and the EDNB salt were undersaturated. The molar concentrations of 3,5-DNBA, ethylenediamine and NaOH in the basic solution were 0.3, 0.15 and 0.174 M respectively. An aqueous sulphuric acid solution was prepared by diluting concentrated sulphuric acid (H2SO4) to the desired concentration of 0.45 M. A diagram of the co-axial mixer with dimensions is shown in Figure 4.
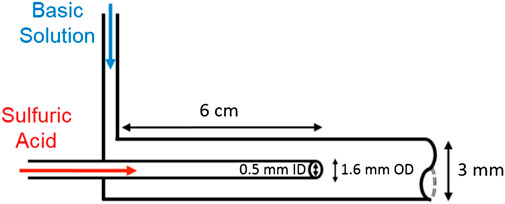
FIGURE 4. Co-axial mixer diagram with dimensions indicated.
The H2SO4 solution was pumped through the inner PEEK (polyether ether ketone) capillary while the basic solution was pumped through the outer glass tube. The capillary has internal and outer diameters of 0.51 and 1.59 mm respectively. The outer glass tube has an internal diameter of 3 mm. The capillary stream entered into the outer tube stream 6 cm from the T-junction. The feed solutions were pumped using Bronkhorst Mini CORI-FLOW system coupled with gear pumps allowing for accurate control of mass flow rates. The resulting slurry from the mixer was sampled 0.7 m from the mixing point after steady state was reached. Collected slurry samples were held for under an hour and filtered using a Buchner funnel with a 0.45 μm filter paper and dried overnight at 40°C. There was no agitation during the holding period. A camera was used to visually monitor the glass tube throughout the crystallisation process to determine if there was any fouling. The temperature of both streams was measured in each experiment and it did not deviate from 25°C by more than 2°C. The total mass flow rate through the co-axial mixer ranged from 130 g/min to 280 g/min at a basic solution:H2SO4 mass flow ratio of either 6:1 or 12:1. The residence time in the glass tube immediately after the mixer ranged from 1 to 3 s. The length of the experiments ranged from 5 to 15 min.
The solutions were prepared as described for the co-axial mixer experiments in 2.3.1. An image of the Ehrfeld modular microreactor system is shown in Figure 5.
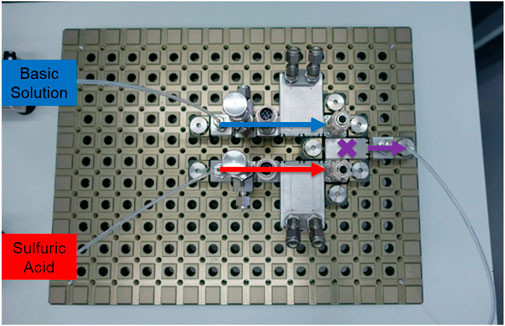
FIGURE 5. Ehrfeld modular microreactor system with Valve Mixer 30 module.
The Ehrfeld modular microreactor system was equipped with the Valve Mixer 30 module. The internal microstructure and non-return valve inside the mixer module is designed to minimise back flow as well as blockages due to particle formation. The feed solutions were pumped using Bronkhorst Mini CORI-FLOW system coupled with gear pumps allowing for accurate control of mass flow rates. The slurry was sampled and isolated as described in 2.3.1. There was no agitation during the holding period. The temperature of both streams was measured in each experiment and it never deviated from 25°C by more than 2°C. The total mass flow rate through the Ehrfeld system was 140 g/min with a basic solution:H2SO4 mass flow ratio of 6:1. The residence time in the tube immediately after the mixer was approximately 1 s. The length of the experiment was 10 min.
3,5-DNBA and ethylenediamine were dissolved in an aqueous sodium hydroxide (NaOH) solution to create a basic solution where both 3,5-DNBA and the EDNB salt were undersaturated. The molar concentrations of 3,5-DNBA, ethylenediamine and NaOH in the basic solution were 0.24, 0.12 and 0.126 M respectively. An aqueous sulphuric acid solution was prepared by diluting concentrated sulphuric acid (H2SO4) to the desired concentration of either 0.132 or 0.17 M. A diagram of the full continuous process including the X mixer and MSMPR cascade with dimensions is shown in Figure 6.
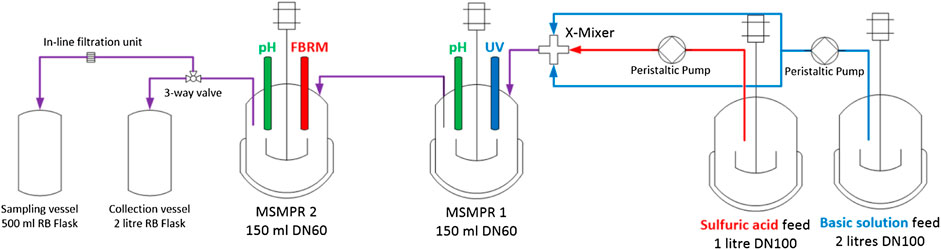
FIGURE 6. X-mixer and MSMPR cascade with dimensions indicated.
The basic solution was pumped from a glass feed vessel through a symmetrical Y splitter to split it in half before it recombined in the X mixer while the H2SO4 solution was pumped from a feed vessel through the centre of the X mixer. The Y splitter was tested to ensure that the correct flow was coming out of each side. This approach means that the two solutions start mixing in the centre of the X mixer and the resultant mixture flows to the MSMPR cascade. The MSMPR cascade consisted of two glass STRs which each had a volume of 150 ml and an internal diameter of 60 mm. The basic solution feed vessel had a volume of 2 L and an internal diameter of 100 mm whereas the H2SO4 solution feed vessel had a volume of 1 L and an internal diameter of 100 mm. The X and Y mixers had smooth bores and an internal diameter of 3.18 mm throughout. The feed solutions were pumped through the X mixer to MSMPR one using peristaltic pumps which were calibrated before the experiment. With the use of vacuum transfer the slurry in MSMPR one is moved to MSMPR two and then either to the collection vessel or the sampling vessel. The collection vessel was a 2 L glass round bottom flask and the sampling vessel was a 500 ml glass round bottom flask. A pH and UV probe were inserted into MSMPR one while a pH and FBRM probe were inserted into MSMPR 2. The pH probes allow for the crystallisation process to be monitored with the UV probe measuring the 3,5-DNBA concentration in MSMPR one and the FBRM probe measuring particle size distribution in MSMPR 2. An in-line filtration unit (with a 0.45 μm filter paper) was in place between MSMPR two and the sampling vessel in order to separate the liquid and solid phases upon sampling. This allowed for both the liquid and solid phases to be analysed after the experiment. These in-line samples were taken periodically throughout the experiment. In addition to the in-line samples, slurry samples were collected from each MSMPR at the end of the experiment and filtered immediately in a Buchner funnel with a 0.45 μm filter paper. All the filtered solid samples were dried overnight under a vacuum. The temperature was measured in each feed vessel and MSMPR. The temperature did not deviate from 25°C by more than 2°C. The total mass flow rate through the system was either 200 or 400 g/min while the basic solution:H2SO4 mass flow ratio was always 3:1. The residence time in the MSMPR cascade after the mixer was either 45 or 90 s depending on the flow rate. The length of the experiments ranged from 5 to 10 min.
3,5-DNBA and ethylenediamine were dissolved in an aqueous sodium hydroxide (NaOH) solution to create a basic solution where both 3,5-DNBA and the EDNB salt were undersaturated. The molar concentrations of 3,5-DNBA, ethylenediamine and NaOH in the basic solution were 0.362, 0.181 and 0.19 M respectively. An aqueous sulphuric acid solution was prepared by diluting concentrated sulphuric acid (H2SO4) to the desired concentration of 0.128 M. A diagram of the semi-batch process including the X mixer and STR with dimensions is shown in Figure 7.
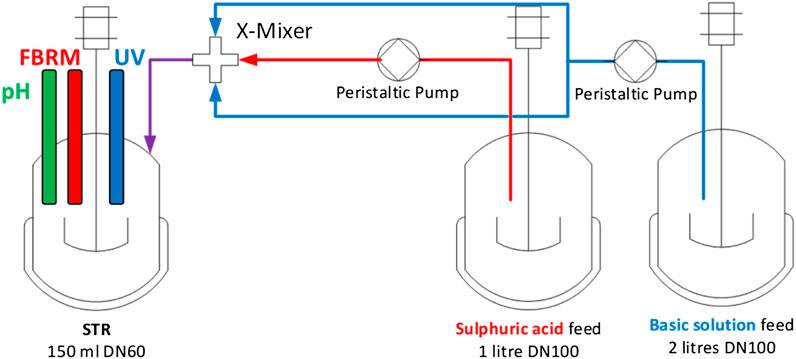
FIGURE 7. Semi-batch process with dimensions indicated.
The basic solution was pumped from a glass feed vessel through a Y splitter to split it in half before it recombined in the X mixer while the H2SO4 solution was pumped from a feed vessel through the centre of the X mixer. The Y splitter was tested to ensure that the correct flow was coming out of each side. This approach means that the two streams start mixing in the centre of the X mixer and the resultant mixture flows to the STR. The glass STR had a volume of 150 ml and an internal diameter of 60 mm. The basic solution feed vessel had a volume of 2 L and an internal diameter of 100 mm whereas the H2SO4 solution feed vessel had a volume of 1 L and an internal diameter of 100 mm. The X and Y mixers had smooth bores and an internal diameter of 3.18 mm throughout. The feed solutions were pumped through the X mixer to the STR using peristaltic pumps which were calibrated before the experiment. pH, UV and FBRM probes were inserted into the STR. The pH probe allowed for the crystallisation process to be monitored while the UV probe measured the 3,5-DNBA concentration and the FBRM probe measured the particle size (chord length) distribution. Slurry samples were collected from the STR at the various points in the experiment and filtered immediately in a Buchner funnel with a 0.45 μm filter paper. All the filtered solid samples were dried overnight under a vacuum. The temperature was measured in each feed vessel and the STR. The solutions in the feed vessels were always between 55 and 60°C while in the STR the solution temperature was always between 50 and 52°C. This mixture flowed into the STR at a total flow rate of 400 g/min until the 150 ml STR was filled. The mass flow ratio was 3:1 basic solution:H2SO4. Once the vessel was filled, the solution was held until nucleation of EDNB monoclinic occurred and the PAT signals became constant. A sample was taken from the vessel at this point. After sampling, the cooling was initiated at a cooling rate of 1°C/min until the slurry reached 25°C. Cooling was employed for the purpose of increasing crystallisation yield. After cooling the slurry was held until all the PAT signals became constant once more. Another sample was taken from the vessel at this point.
The dry powder samples were analysed by the Bruker Tensor II FTIR to determine the solid form. The IR spectra were collected for each dry powder sample and compared with the reference spectra for 3,5-DNBA, EDNB monoclinic and EDNB triclinic. Spectra were acquired averaging eight scans of the IR region from 4000 to 400 cm−1, with a resolution of 4 cm−1. Before each sample spectrum was collected, the background spectrum was collected. The background spectrum was collected in the air at room temperature. No samples were ground before analysis.
The dry powder samples were analysed by the Malvern Morphologi G3 to obtain the particle size and aspect ratio distributions. The procedure involved placing the solid sample into the integrated powder dispersion unit and using a low energy dispersion method (0.5 bar) to form a circle of flat separate particles on the glass plate. A low energy was used in order to break up agglomerates but not break the individual particles. The instrument then scanned the powder sample while capturing images with the use of ×5 magnification, as this ensured the full range of particle sizes were in focus. For all of the particles captured, the full range of size and shape properties were determined by the integrated image analysis software.
The experimental conditions used in the continuous mixer experiments are shown in Table 3. All of these experiments were performed at 25°C, and the composition of the initial solution was the same. The conditions were varied to observe the effect of pH, supersaturation and flow rate on EDNB polymorphism and particle size. Using the previously developed solution speciation model (McGinty, 2017) allows for calculation of the initial basic solution composition, sulphuric acid concentration, and basic solution: sulphuric acid flow ratio required to reach the target pH and supersaturation. Without the model, experimental trial and error would have been required to obtain the desired crystallisation conditions. Furthermore, the model can be used to calculate pH and composition as a function of crystallisation yield during crystallisation. As pH is changing during crystallisation, the theoretical equilibrium yield is not possible to predict without the speciation model.
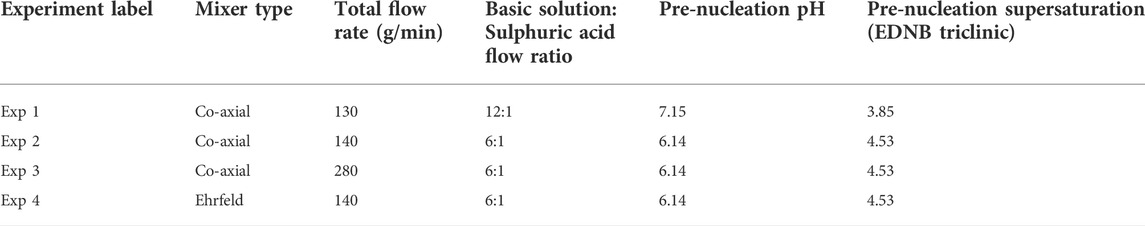
TABLE 3. Experimental conditions used in the continuous mixer experiments.
In these experiments the pH and concentration data were measured for the initial basic solution and the final slurry sample. In addition, the pH and concentration data for the fully mixed solution (before crystallisation begins) were calculated from the solution speciation model. The three points corresponding to the initial salt solution, the fully mixed solutions and the final slurry for each experiment were plotted on the EDNB phase diagram to show the crystallisation processes. The crystallisation processes for all of the continuous mixer experiments are shown in Figure 8. The variation in endpoints is due to the target mixed composition (2:1 acid/base ratio) being near the inflection point of the titration curve so it is easy for the process to finish at either side of the inflection point.
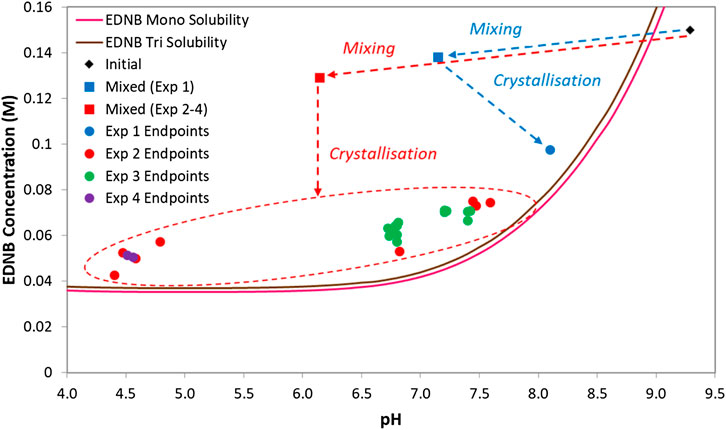
FIGURE 8. Crystallisation processes for all of the continuous mixer experiments. Experiments 1-3 utilised the co-axial mixer while experiment 4 utilised the Ehrfeld modular microreactor system with valve mixer.
The IR spectra of the dry powder samples confirmed that EDNB triclinic was crystallised in every continuous mixer experiment which was expected as all of the experiments were performed at 25°C. For each sample, for each continuous mixer experiment, the dry powder was analysed with the Morphologi G3 in order to obtain the particle size and shape distributions. The volume weighted circle equivalent diameter distributions for the final samples from each experiment can be seen in Figure 9. The results show that experiment 1, where the lower supersaturation was utilised, produced smaller particles due to there being less material available to crystallise from solution (approximately 30% crystallised from solution compared to the approximately 50–60% seen where the higher supersaturation was used). The particles produced from experiments 2-4 all had a very similar PSD which suggests that mixer type and total flow rate don’t have a significant effect in this range of conditions.
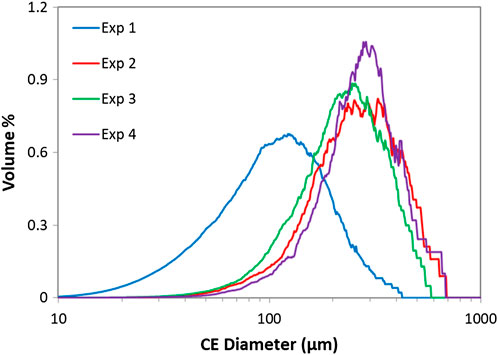
FIGURE 9. Volume weighted circle equivalent diameter distributions from Morphologi G3 for continuous mixer experiments.
The experimental conditions used in the X-mixer and MSMPR cascade experiments are shown in Table 4. All of these experiments were performed at 25°C, and the basic solution:H2SO4 flow ratio was always 3:1. The conditions were varied to observe the effect of pH, supersaturation and total flow rate on EDNB polymorphism and particle size. As with the continuous mixer experiments, the solution speciation model (McGinty, 2017) allowed for the selection of experimental conditions without the need for experimental trial and error.
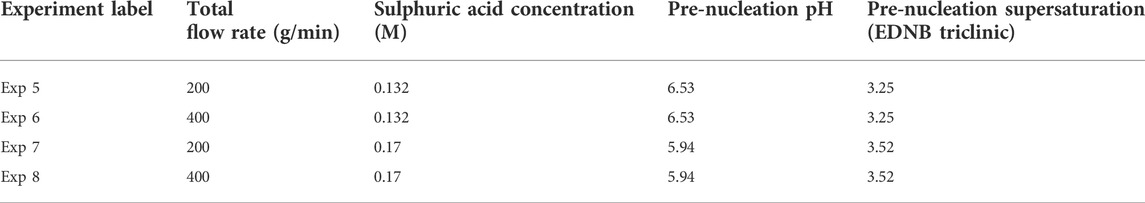
TABLE 4. Experimental conditions used in the X-mixer and MSMPR cascade experiments.
In these experiments the pH and concentration data were measured for the initial basic solution and the slurry sample taken at the end of the continuous process. In addition, the pH and concentration data for the fully mixed solution (before crystallisation begins) were calculated from the solution speciation model. The three points for each experiment were plotted on the EDNB phase diagram to show the crystallisation processes. The crystallisation processes for these experiments are shown in Figure 10. There is little variation at this set of conditions.
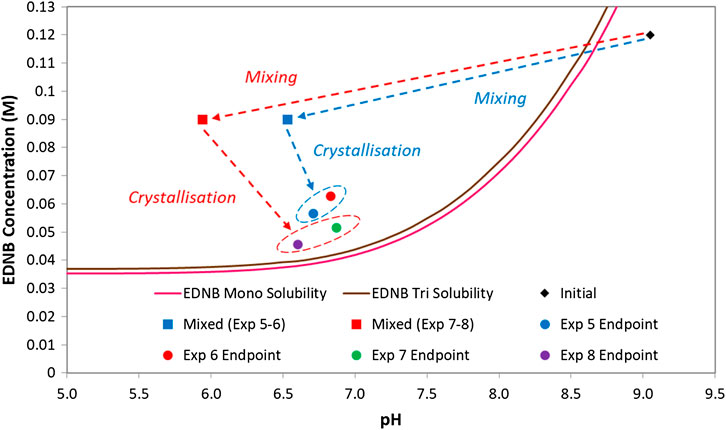
FIGURE 10. Crystallisation processes for all of the X-mixer and MSMPR cascade experiments.
The IR spectra of the dry powder samples confirmed that EDNB triclinic was crystallised in every X-mixer and MSMPR cascade experiment which was expected as all of the experiments were performed at 25°C. For each sample, for each full continuous process, the dry powder was analysed with the Morphologi G3 in order to obtain the particle size and shape distributions. The volume weighted circle equivalent diameter distributions for the final samples from each experiment can be seen in Figure 11. The results show that experiment 5, where the lowest sulphuric acid concentration and lowest total flow rate are combined, produced larger particles than in the other experiments which is most likely due to the combination of lower supersaturation and lower shear rate resulting in a reduced nucleation rate (Liu and Rasmuson, 2013; Forsyth et al., 2015; Forsyth et al., 2016). The particles produced from experiments 6-8 all had a very similar PSD where this combination of low sulphuric acid concentration and low total flow rate was not used.
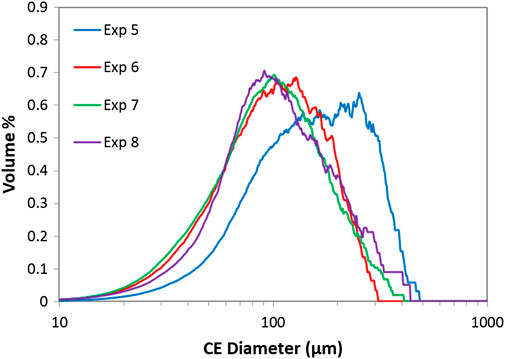
FIGURE 11. Volume weighted circle equivalent diameter distributions from Morphologi G3 for the X-mixer and MSMPR cascade experiments.
Representative microscope images from the X-mixer and MSMPR cascade experiments are shown in Figure 12. The rectangular plates confirm that EDNB triclinic was crystallised.
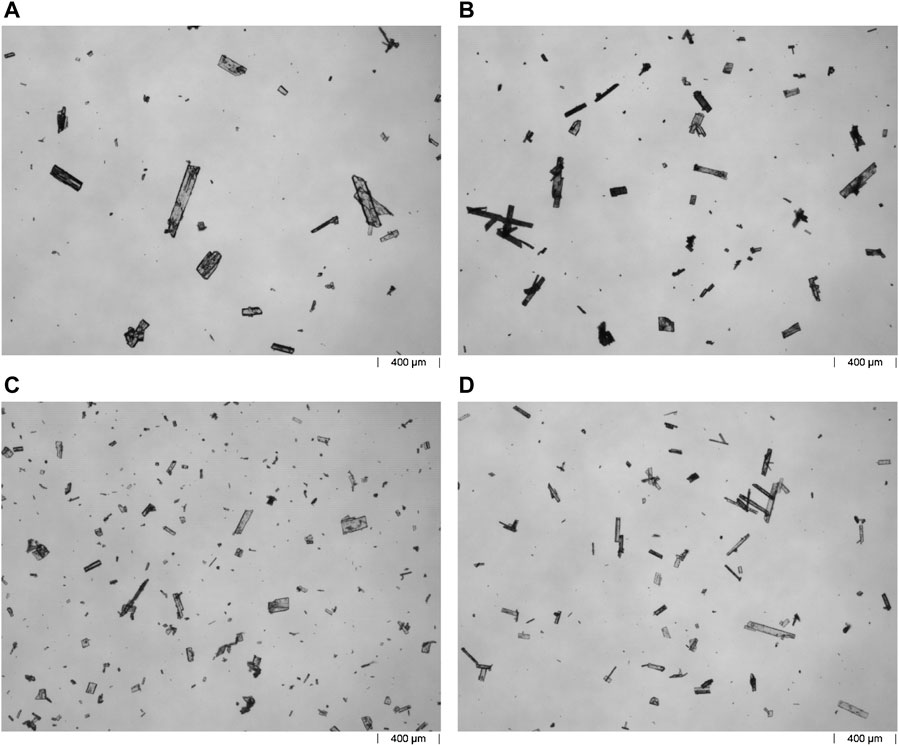
FIGURE 12. Representative microscope images of the crystals from experiments 5–8 are shown in (A–D), respectively.
The semi-batch crystallisation process consisted of three parts. The first part is the continuous mixing process when sulphuric acid is being continuously mixed with the basic solution before crystallisation commences. The second part is the crystallisation pathway which covers the nucleation period. The third part is the crystallisation pathway which covers the growth process during and after the cooling period.
In this experiment the pH and concentration data were measured for the initial solution, the slurry sample after nucleation and the slurry sample after cooling. In addition, the pH and concentration data for the fully mixed solution (before crystallisation begins) was calculated from the solution speciation model. The four points were plotted on the EDNB phase diagram to describe the semi-batch crystallisation process and this is shown in Figure 13. The pre-nucleation supersaturation (with respect to EDNB monoclinic) was 2.43.
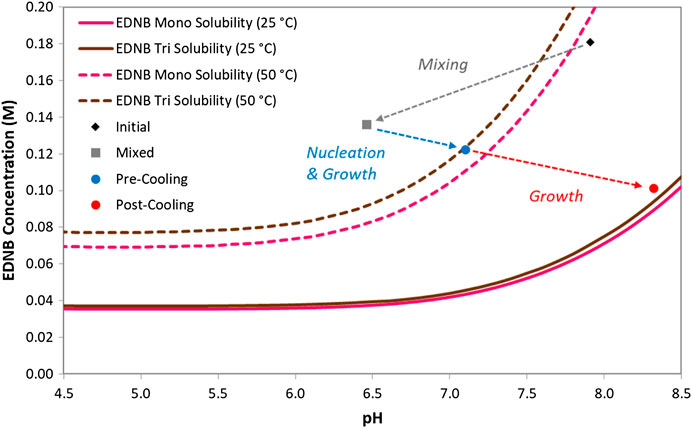
FIGURE 13. Crystallisation process for the continuously pre-mixed semi-batch experiment with cooling.
As the crystallisation process progressed the pH increased and the EDNB concentration decreased as expected. The IR spectra of the dry powder samples demonstrated that EDNB monoclinic was nucleated directly and was also the only polymorph present in the final slurry at the end of the experiment. This demonstrates that a combination of high pH and temperature while utilising continuous mixing can be used to produce the stable EDNB monoclinic polymorph.
For each sample, the dry powder was analysed with the Morphologi G3 in order to obtain the particle size and shape distributions. The volume weighted circle equivalent diameter distributions for each sample can be seen in Figure 14. It can be seen from the results that particle size increases as a result of cooling which suggests that crystallisation proceeded primarily through the growth of already present EDNB monoclinic crystals.
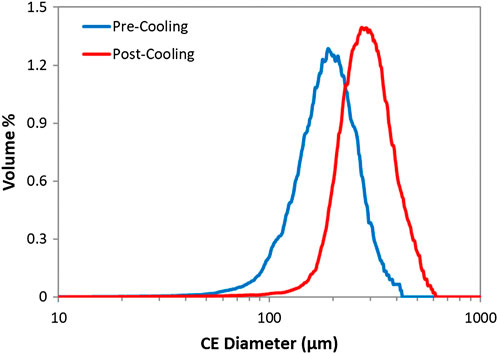
FIGURE 14. Volume weighted circle equivalent diameter distributions from Morphologi G3 for the continuously pre-mixed semi-batch experiment with cooling.
The microscope images (Figure 15) show that only the prismatic crystals of EDNB monoclinic are present rather than the rectangular plates associated with EDNB triclinic. This data, in addition to the IR spectra, confirms that only EDNB monoclinic was present throughout this experiment.
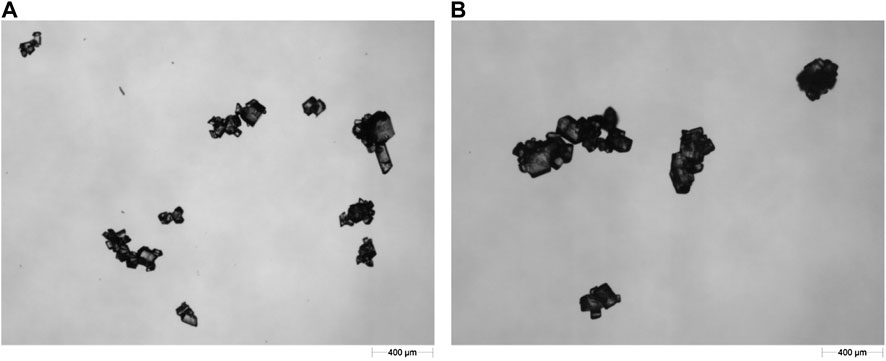
FIGURE 15. Representative microscope images of the samples from the points of (A) pre-cooling and (B) post-cooling in the continuously pre-mixed semi-batch experiment.
Several continuous mixing processes have been utilised to selectively crystallise the desired organic salt polymorph with consistent size. Using the previously developed solution speciation model allowed for calculation of the feed stream compositions and flow ratios required to reach the target pH and supersaturation. Without the model, experimental trial and error would have been required to obtain the desired crystallisation conditions. Fully continuous processes have been implemented at 25°C to produce the metastable EDNB triclinic polymorph. A continuous mixing approach was combined with a semi-batch process to consistently produce the stable EDNB monoclinic polymorph at 50°C. These approaches demonstrate the ability to create crystal seed suspensions that can be used for additional growth or shape control further downstream. This decoupling of mixing and nucleation from growth allows greater control over the full crystallisation process of organic salt polymorphs.
We were able to control the supersaturation through the use of the model and the shear rate through the use of continuous mixers to produce seeds of a consistent polymorph and particle size for a polymorphic organic salt. This approach has the potential to give improved control of particle properties over current batch salt crystallisation approaches.
The raw data supporting the conclusion of this article will be made available by the authors, without undue reservation.
JM and JS contributed to conception and design of the study. JM performed the modelling and experimental work. JM wrote the first draft of the manuscript. VS, PM, and JS wrote sections of the manuscript. All authors contributed to manuscript revision, read, and approved the submitted version.
We would like to acknowledge funding from EPSRC Centre for Innovative Manufacturing in Continuous Manufacturing and Crystallisation (Grant reference: EP/I033459/1) and EPSRC Continuous Manufacturing and Advanced Crystallisation Future Manufacturing Research Hub (Grant reference: EP/P006965/1).
HW was employed by the company AstraZeneca.
The remaining authors declare that the research was conducted in the absence of any commercial or financial relationships that could be construed as a potential conflict of interest.
All claims expressed in this article are solely those of the authors and do not necessarily represent those of their affiliated organizations, or those of the publisher, the editors and the reviewers. Any product that may be evaluated in this article, or claim that may be made by its manufacturer, is not guaranteed or endorsed by the publisher.
Bastin, R. J., Bowker, M. J., and Slater, B. J. (2000). Salt selection and optimisation procedures for pharmaceutical new chemical entities. Org. Process Res. Dev. 4 (5), 427–435. doi:10.1021/op000018u
Berge, S. M., Bighley, L. D., and Monkhouse, D. C. (1977). Pharmaceutical salts. J. Pharm. Sci. 66 (1), 1–19. doi:10.1002/jps.2600660104
Briggs, N. E. B., Schacht, U., Raval, V., McGlone, T., Sefcik, J., and Florence, A. J. (2015). Seeded crystallization of beta-L-glutamic acid in a continuous oscillatory baffled crystallizer. Org. Process Res. Dev. 19 (12), 1903–1911. doi:10.1021/acs.oprd.5b00206
Brown, C. J., McGlone, T., Yerdelen, S., Srirambhatla, V., Mabbott, F., Gurung, R., et al. (2018). Enabling precision manufacturing of active pharmaceutical ingredients: Workflow for seeded cooling continuous crystallisations. Mol. Syst. Des. Eng. 3 (3), 518–549. doi:10.1039/c7me00096k
Davey, R. J., and Jones, H. P. (2008). The crystallisation and stability of a polymorphic salt, ethylene diammonium dinitrobenzoate. New J. Chem. 32 (10), 1686. doi:10.1039/b803583k
Dunn, A. S., Svoboda, V., Sefcik, J., and ter Horst, J. H. (2019). Resolution control in a continuous preferential crystallization process. Org. Process Res. Dev. 23 (9), 2031–2041. doi:10.1021/acs.oprd.9b00275
Forsyth, C., Burns, I. S., Mulheran, P. A., and Sefcik, J. (2016). Scaling of Glycine nucleation kinetics with shear rate and glass liquid interfacial area. Cryst. Growth & Des. 16 (1), 136–144. doi:10.1021/acs.cgd.5b01042
Forsyth, C., Mulheran, P. A., Haw, M. D., Burns, I. S., and Sefcik, J. (2015). Influence of controlled fluid shear on nucleation rates in Glycine aqueous solutions. Cryst. Growth & Des. 15 (1), 94–102. doi:10.1021/cg5008878
Groom, C. R., Bruno, I. J., Lightfoot, M. P., and Ward, S. C. (2016). The Cambridge structural Database. Acta Crystallogr. B Struct. Sci. Cryst. Eng. Mat. 72, 171–179. doi:10.1107/s2052520616003954
Gupta, S. L., and Soni, R. N. (1965). Spectrophotometric determination of the thermodynamic ionisation constant of 3,5-dinitrobenzoic acid in water from 10° to 50° and related thermodynamic quantities. J. Indian Chem. Soc. 42 (6), 377–380.
Jones, H. P., Davey, R. J., and Cox, B. G. (2005). Crystallization of a salt of a weak organic acid and base: Solubility relations, supersaturation control and polymorphic behavior. J. Phys. Chem. B 109 (11), 5273–5278. doi:10.1021/jp045000q
Kortum, G., Vogel, W., and Andrussow, K.. (1961). Dissociation constants of organic acids in aqueous solution. London: Butterworths. 1: p. 190–536.
Leuenberger, H. (2001). New trends in the production of pharmaceutical granules: Batch versus continuous processing. Eur. J. Pharm. Biopharm. 52 (3), 289–296. doi:10.1016/s0939-6411(01)00199-0
Liu, J., and Rasmuson, A. C. (2013). Influence of agitation and fluid shear on primary nucleation in solution. Cryst. Growth & Des. 13 (10), 4385–4394. doi:10.1021/cg4007636
Lynch, D. E., Smith, G., Byriel, K. A., and Kennard, C. H. L. (1994). 3, 5-Dimethoxybenzoic acid and the second polymorph of the 2:1 adduct of 3, 5-dinitrobenzoic acid with ethylenediamine. Acta Crystallogr. C 50, 1259–1262. doi:10.1107/s0108270193012259
MacFhionnghaile, P., Svoboda, V., McGinty, J., Nordon, A., and Sefcik, J. (2017). Crystallization diagram for antisolvent crystallization of lactose: Using design of experiments to investigate continuous mixing-induced supersaturation. Cryst. Growth & Des. 17 (5), 2611–2621. doi:10.1021/acs.cgd.7b00136
McGinty, J. (2017). Batch to continuous organic salt crystallisation: Model based design. PhD thesis. Glasgow: University of Strathclyde. doi:10.48730/c3wn-cy88
McGinty, J. (2020). “Chapter 1 nucleation and crystal growth in continuous crystallization,” in The handbook of continuous crystallization (London: The Royal Society of Chemistry), 1–50.
McGinty, J., Chong, M. W. S., Manson, A., Brown, C. J., Nordon, A., and Sefcik, J. (2020). Effect of process conditions on particle size and shape in continuous antisolvent crystallisation of lovastatin. Crystals 10 (10), 925. doi:10.3390/cryst10100925
McGlone, T., Briggs, N. E. B., Clark, C. A., Brown, C. J., Sefcik, J., and Florence, A. J. (2015). Oscillatory flow reactors (OFRs) for continuous manufacturing and crystallization. Org. Process Res. Dev. 19 (9), 1186–1202. doi:10.1021/acs.oprd.5b00225
Nethaji, M., Pattabhi, V., Chhabra, N., and Poonia, N. S. (1992). Structure of ethylenediammonium 3, 5-dinitrobenzoate. Acta Crystallogr. C 48, 2207–2209. doi:10.1107/s0108270192004190
Neugebauer, P., Cardona, J., Besenhard, M. O., Peter, A., Gruber-Woelfler, H., Tachtatzis, C., et al. (2018). Crystal shape modification via cycles of growth and dissolution in a tubular crystallizer. Cryst. Growth & Des. 18 (8), 4403–4415. doi:10.1021/acs.cgd.8b00371
Plumb, K. (2005). Continuous processing in the pharmaceutical industry. Chem. Eng. Res. Des. 83 (A6), 730–738. doi:10.1205/cherd.04359
Ramakers, L. A. I., McGinty, J., Beckmann, W., Levilain, G., Lee, M., Wheatcroft, H., et al. (2020). Investigation of metastable zones and induction times in Glycine crystallization across three different antisolvents. Cryst. Growth & Des. 20 (8), 4935–4944. doi:10.1021/acs.cgd.9b01493
Raza, S. A., Schacht, U., Svoboda, V., Edwards, D. P., Florence, A. J., Pulham, C. R., et al. (2018). Rapid continuous antisolvent crystallization of multicomponent systems. Cryst. Growth & Des. 18 (1), 210–218. doi:10.1021/acs.cgd.7b01105
Stahl, P. H., and Wermuth, C. G. (2011). Pharmaceutical salts: Properties, selection and use. in International Union of Pure and Applied Chemistry (IUPAC). 2nd Revised Edition, 388. Wiley VCH.
Svoboda, V., MacFhionnghaile, P., McGinty, J., Connor, L. E., Oswald, I. D. H., and Sefcik, J. (2017). Continuous cocrystallization of benzoic acid and isonicotinamide by mixing-induced supersaturation: Exploring opportunities between reactive and antisolvent crystallization concepts. Cryst. Growth & Des. 17 (4), 1902–1909. doi:10.1021/acs.cgd.6b01866
Keywords: organic salt, reactive crystallisation, Polymorphism, continuous crystallisation, particle engineering
Citation: McGinty J, Svoboda V, MacFhionnghaile P, Wheatcroft H, Price CJ and Sefcik J (2022) Continuous crystallisation of organic salt polymorphs. Front. Chem. Eng. 4:896329. doi: 10.3389/fceng.2022.896329
Received: 14 March 2022; Accepted: 05 July 2022;
Published: 10 August 2022.
Edited by:
Brahim Benyahia, Loughborough University, United KingdomReviewed by:
Karen Robertson, University of Nottingham, United KingdomCopyright © 2022 McGinty, Svoboda, MacFhionnghaile, Wheatcroft, Price and Sefcik. This is an open-access article distributed under the terms of the Creative Commons Attribution License (CC BY). The use, distribution or reproduction in other forums is permitted, provided the original author(s) and the copyright owner(s) are credited and that the original publication in this journal is cited, in accordance with accepted academic practice. No use, distribution or reproduction is permitted which does not comply with these terms.
*Correspondence: Jan Sefcik, amFuLnNlZmNpa0BzdHJhdGguYWMudWs=
Disclaimer: All claims expressed in this article are solely those of the authors and do not necessarily represent those of their affiliated organizations, or those of the publisher, the editors and the reviewers. Any product that may be evaluated in this article or claim that may be made by its manufacturer is not guaranteed or endorsed by the publisher.
Research integrity at Frontiers
Learn more about the work of our research integrity team to safeguard the quality of each article we publish.