
94% of researchers rate our articles as excellent or good
Learn more about the work of our research integrity team to safeguard the quality of each article we publish.
Find out more
ORIGINAL RESEARCH article
Front. Chem. Eng., 27 April 2022
Sec. Computational Methods in Chemical Engineering
Volume 4 - 2022 | https://doi.org/10.3389/fceng.2022.853749
This article is part of the Research TopicIntegration and Optimization in the Chemical Process IndustryView all 7 articles
 Daniel Flórez-Orrego1,2*
 Cyro Albuquerque3
 Julio A. M. Da Silva4
 Ronaldo Freire1Silvio De Oliveira Junior1
Due to restricted weight and space budget on floating production, storage and offloading units (FPSO), the offshore utility systems have been limited to low-efficiency energy technologies. Moreover, owing to time-varying energy demands of the FPSOs, the existing cogeneration systems incur oversizing issues and mostly operate at offdesign conditions during the lifespan. This situation increases the fuel consumption and accentuates the environmental impact of the offshore oil and gas sector. Accordingly, a power hub emerges as an interesting alternative to the conventional utility system, featuring more efficient and environmentally friendly energy solutions. Nevertheless, power hubs are not free from challenges, typically related to the incremental costs of additional power generation and transmission equipment and costly carbon abatement units. Thus, uncertain natural gas price, carbon taxation, and delay in entry of operation between productive platforms should be thoroughly considered in anticipation of the impact of volatile market prices and more stringent environmental regulations on the operational results of the assets. In this work, a comparative incremental assessment between the existing cogeneration system and four alternative power hub setups is performed to shed light on the potential benefits of adopting the centralized offshore power stations. Among those benefits are augmented revenues with gas exportation, optimal sizing and load dispatch process, and reduced number of idle power units, oftentimes required only for attending the peak demand that occurs in a short interval of the whole lifespan of the hub. As a result, it is found that by increasing the delay in entry of operation, the opportunity cost arisen from the money depreciation and the variation of the gas price over time substantially hampers the economic feasibility, showing a trade-off between the best thermodynamic performance, the lowest environmental burden, and the most profitable operating conditions.
Offshore oil and gas production is a key economic activity in Brazil, where 96% of the petroleum extracted proceeds from maritime fields and contributes 13% to the gross domestic product (ANP, 2019). Nevertheless, the long-term economic viability of the sector is threatened by its current technological gaps and the imminence of more stringent carbon emission policies. Indeed, the petroleum primary separation processes on FPSOs demand a large amount of utilities in the form of power and heat, typically supplied by low-efficiency energy systems, such as simple cycle gas turbines (SCGT) and waste heat recovery units (WHRU). Since those technologies rely on the consumption of non-renewable energy resources, this industry becomes responsible for a large amount of atmospheric emissions (ANP, 2017). The limited weight and space budgets in existing FPSOs have hampered the efforts to integrate more advanced utility systems, which are reportedly able to increase the overall cogeneration efficiency (Beck et al., 2011). In addition, variable flow rate and composition of the fluids extracted entail variable energy demands over time, which leads the conventional cogeneration system to operate at offdesign conditions during most of the productive lifespan. Thus, if a resourceful solution to these limitations could be achieved, it may help not only to cut down fuel consumption and mitigate the environmental impact, but also to reveal business opportunities, such as commercial prospects for enhanced oil recovery (EOR) and implementation of carbon markets (Ellsworth and Picinich, 2011; Sweatman, 2012).
In order to tackle these problems, different alternatives have been proposed, ranging from the electrification from shore (Myklebust et al., 2017) to the conception of a power hub composed of more efficient combined cycles (Vidoza et al., 2019). Some studies proposed a power hub without carbon capture aiming to centralize the electricity generation for a number of FPSOs (Vidoza et al., 2018). As a result, relatively high power generation efficiencies (53%) and an appreciable reduction of CO2 emissions (19%) are achieved for a scheme that implements two levels of steam pressure, three gas turbines and only one heat recovery steam generator (HRSG). However, the footprint of the proposed configuration has not been estimated. Later, a techno-economic assessment concluded that, depending on the scenario of carbon taxation adopted, the power hubs may be not only thermodynamically advantageous, but also financially competitive, if compared to the conventional utility systems (Freire et al., 2020). Florez-Orrego et al., (2021) developed a systematic method for method for synthesizing the best configuration of power hub using an optimization subroutine in Python and based on the concept of sawtooth plot. The authors verified that the best configuration strongly depends on the profile of energy demands, the minimum generation capacity and the characteristics of the power generation systems. Unlike the present work, the previous research works have not considered carbon abatement technologies and have not studied the effect of the integration of post-combustion carbon capture and reinjection (CCS) systems on the overall energy balance of the offshore utility plants. Other studies (Beigvand et al., 2017) solved the energy hub economic dispatch (EHED) problem by considering a set of modular units, including transformers, power units, cooling and heating systems. Since the hub application occurs onshore, the limitations of the offshore cogeneration plants have not been considered. Riboldi et al., (2017) analyzed few combined cycles in offshore applications. This arrangement posed fewer challenges in terms of number of variables and combinatorial explosion. The authors did not implement an optimal dispatch distribution by disabling some generation technologies, thus, the flexibility of the system was limited.
Few studies analyzed of the performance of power hubs equipped with a CCS unit. Hetland et al., (2009) studied the integration of a CCS unit in the Sevan GTW concept (450 MW). Roussanaly et al., (2019) performed a techno-economic analysis of the offshore power generation along with CO2 capture (CEPONG concept) either to decarbonize the onshore electricity mix or to supply power to petroleum platforms. According to the authors, the second applications is financially more attractive, whereas the transmission of the electricity generated offshore is seemingly neither economically nor technically justifiable. Winden et al., (2014) compared an offshore power plant equipped with a CCS unit (OTPPC concept, 540 MW) to an onshore counterpart, envisioning the injection of CO2 captured in offshore and onshore industries. As a result, the authors endorsed the advantages of the power hub applications for improving the utility systems of the offshore platforms. Despite their relevance, those research works neither presented detailed economic analyses considering carbon taxations and variation of CCS unit cost, nor estimated the constrained space and weight allowances when the topsides of the power hub are installed on decommissioned offshore platforms. More recently, Flórez-Orrego et al. (2022) performed an optimization process of the dispatch and load distribution among a set of modular power units (MPUs) equipped with carbon capture systems, aiming to supply the time-varying power demands of four identical FPSOs. The incremental economic analysis has considered the variation of the specific cost of the carbon capture unit, the carbon tax and the interest rate. According to the authors, carbon taxes above 40 USD/tCO2 would be necessary in order to power hubs with CCS unit become competitive vis-à-vis the existing cogeneration systems in offshore platforms. Despite its relevance, the effect of other critical factors, such as the uncertainty of the natural gas price and opportunity cost, arisen from the delay in entry of operation between productive platforms, has not been assessed. In the present manuscript, the analysis of those critical factors have disclosed further conflicts between more efficient and more affordable alternatives aimed to supersede the existing cogeneration plants. In view of the lack of detailed literature dealing with the installation of carbon abatement technologies in power hubs for offshore applications; the present incremental economic analysis aims to evaluates the feasibility of the integration of advanced power stations with carbon capture, bearing in mind 1) the fluctuations of the fuel price and the energy demands, 2) the depreciation of money over time, 3) the carbon taxes and cost of a CCS unit, along with 4) the delay in entrance of operation (i.e., the opportunity cost). Differently from what has been done in previous studies, the solutions found in this work comply with the tight footprint and weight restrictions on a decommissioned and adapted FPSO, instead of adopting a new hub hull, which entails lower investment costs.
The characteristics of the productive FPSO and the existing utility system are briefly described. The control volume assumed for carrying out the comparative incremental assessment encompasses the utility system that serves four identical FPSOs (Figure 1A). Each FPSO can daily process up to 150 thousand barrels of oil and 6 million Nm3 of natural gas (Figure 1B). In addition, it can treat 20,000 m3 of produced water per day and store around 1.6 million barrels of oil, which are periodically transported by a shuttle tanker to the coast (PETROBRAS, 2011). In the processing plant of each FPSO, the petroleum mixture (gas, crude oil and water) is heated and separated using hot water (150°C) produced by recovering waste heat from the exhaust gases of four LM2500+ gas turbines. Large power consumers include the exportation and injection compression systems and water and oil pumping. Since the gaseous phase from the well may contain a significant amount of CO2, it is sent to a membrane separation unit (50 bar), where CO2 is partially removed. The separated CO2-rich stream is compressed to 500 bar and reinjected, while the hydrocarbon-rich stream can be exported, injected, used for gas-lift or partly consumed in the utilities plant. In Figure 1B, it is assumed that enough gas production allows for self-sustainable power generation between 3rd and 15th years (Gallo et al., 2017). In the remaining years, all the produced gas bypasses the membrane system and import of fuel gas is required. Since the performance of the topsides on a FPSO depends on the changing properties of the fluids extracted, an accurate characterization of the energy demands is not a straightforward task (see Figure 1C) (Freire et al., 2020). For this reason, the design of the utility systems used to drive the separation and compression processes occurring on a FPSO must involve very flexible modular power units (MPUs), able to handle variable electricity and heating demands. This situation suggests an opportunity to enhance the efficiency and mitigate the environmental impact of the offshore utility systems by using a power hub, like that shown in Figure 2. This power hub, composed of several combined cycles, aims to supply electricity to four identical FPSOs, while minimizes the offdesign operating condition and increases the overall efficiency of the cogeneration plant. For the sake of reliability, a set of N MPUs remain active and an additional module (+1) acts as redundancy, in the event of maintenance or unforeseen stops in the operation of any set (Welch and Pym, 2015). Evidently, a shift towards more environmentally friendly power technologies only comes at the expense of costlier installations. For this reason, an incremental comparative study, considering the carbon taxation and the opportunity cost is implemented to shed light on the effect of additional expenditures on the overall project feasibility.
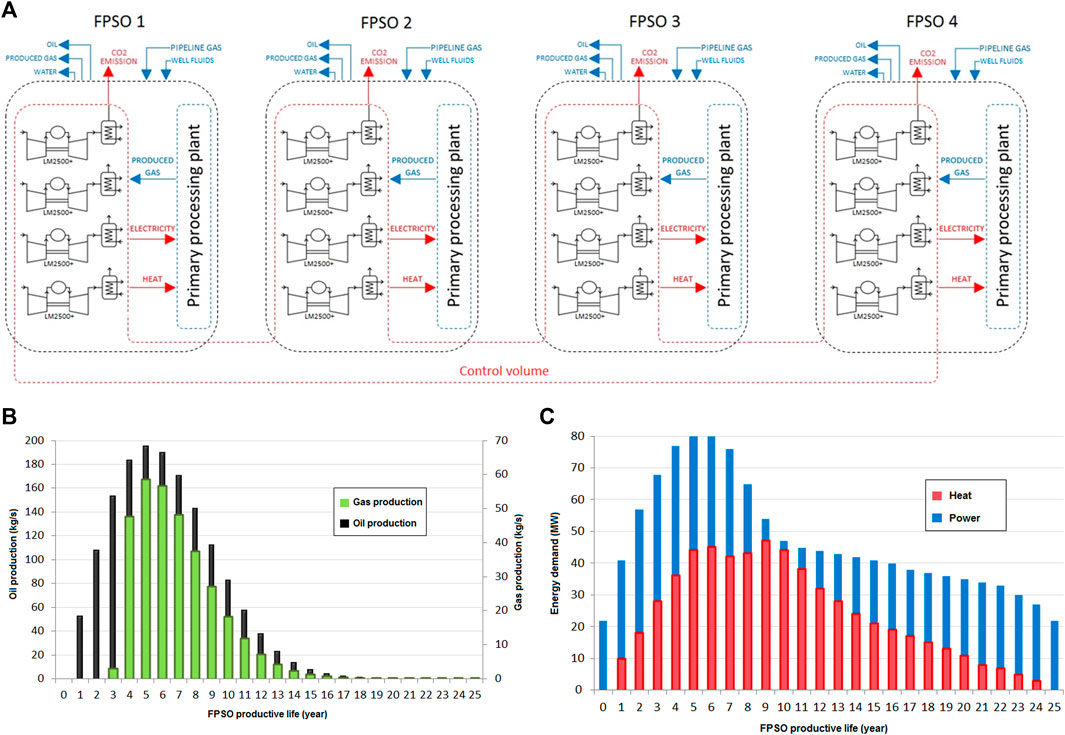
FIGURE 1. Standalone FPSOs: (A) Cogeneration and processing plants (Freire et al., 2020); profiles of (B) production and (C) energy demands of one FPSO. Based on data from Freire et al. (2020).
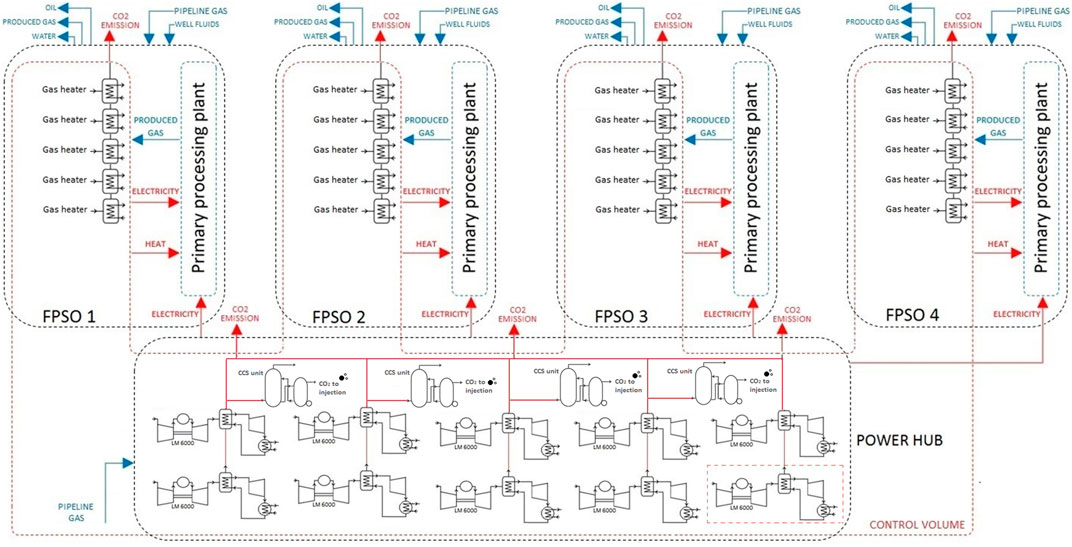
FIGURE 2. Power hub conceived for supplying the electricity to four productive FPSOs with identical energy demands.
Four scenarios of power hubs have been analyzed, built upon combined cycles with either one or two levels of pressure of steam injection, and without or with carbon capture and compression (CCS) units. Scenarios 1 and 2 rely on power hubs composed of N1+1 and N2+1 combined cycles equipped with CCS technology, respectively (see Figures 3A,B). Unlike the scenario 1, the scenario 2 considers two levels of pressure of steam generation. Meanwhile, scenarios 3 and 4 employ N3+1 and N4+1 MPUs, respectively, analogously to scenarios 1 and 2, except for the absence of carbon capture units (see Figures 3C,D). In the carbon capture process, the cooled flue gas is contacted in the absorption column with a selective solvent (MEA amine, 35% wt.) designed to remove up to 90% of the CO2. The hot rich amine enters the desorption column, wherein steam energy is consumed (3.5–4 MJ/kg CO2) to release the CO2 absorbed (Leung et al., 2014). The hot lean solvent is cooled and pumped back to restart the loop, while the CO2 desorbed is released overhead, then conditioned and compressed for reinjection purposes (500 bar). Post-combustion carbon capture applications (<7 mol% CO2) for gas power plants are still in development (Swaminathan, 2012) or demonstration (Larson, 2017) stages. In this work, the reference plant considered for the sizing of the post-combustion carbon capture unit is the SSE’s Peterhead gas power station (230 MW), with an estimated production of 3,300 tCO2/day (absorption column: diameter 11.8 m, height 53.3 m; desorption column: diameter 5.6 m, height 36.2 m) (L (2016). Peterhead C, 2016). Regardless of the internal energy demands of the power hub (e.g., CO2 desorption heat and compression and pumping power consumption), the net power demanded by the four productive FPSOs shall be entirely supplied by a suitable number of MPUs. In this regard, the optimal operation parameters for the heat recovery steam generation system, the supplementary firing system and the extraction-condensing steam turbine have been previously optimized using the concept of sawtooth plot that represents the solution to the optimal dispatch problem when no electricity export to shore is intended (Florez-Orrego et al., 2020a). Moreover, since the power hub becomes responsible for the power supply, the heating demand on each productive FPSO is guaranteed by five fired heaters (5 × 10 MW). Finally, the transmission system consists of transformers and submarine cables, which will be responsible for bringing the electricity generated in the power hub to each FPSO (Florez-Orrego et al., 2020b).
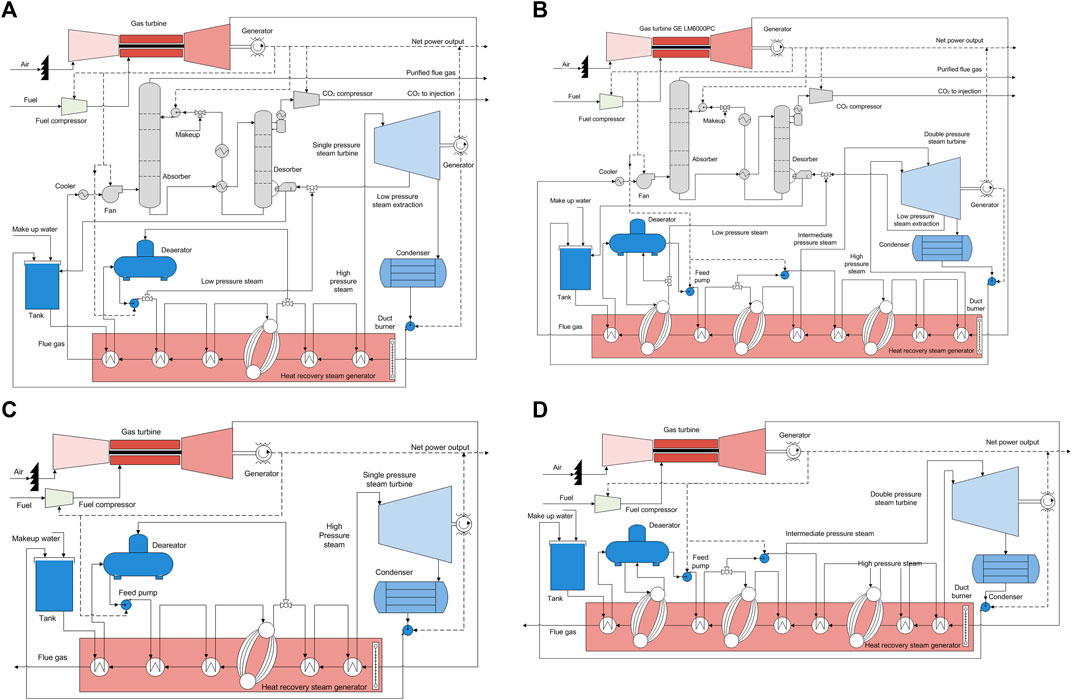
FIGURE 3. Structure and number of MPUs considered for each power hub scenario: (A) with CCS unit and single pressure steam injection to steam turbine (N1+1); (B) with CCS unit and double pressure steam injection to steam turbine (N2+1); (C) without CCS unit and single pressure steam injection to steam turbine (N3+1); (D) without CCS unit and double pressure steam injection to steam turbine (N4+1)
This study assesses the techno-economic viability of installing advanced offshore power stations equipped with or without a CCS unit on a decommissioned FPSO, considering different scenarios of carbon taxation. An incremental financial analysis is performed to shed light on the relative advantages and limitations of the proposed technologies, in comparison to the conventional utility system. Due to the conflicts between the thermodynamic, environmental and financial targets, a proper evaluation of the physical properties, mass and energy balances, as well as of the exergy, economic and environmental indicators is fundamental to achieve reliable and comparable results (Florez-Orrego et al., 2020a). The tools and methods used in this paper are described in the following section.
The thermodynamic properties of relevant streams, as well as the mass and energy balances of the power hub configurations, have been determined by using Thermoflow® software (Figure 4). GTPRO® suite of Thermoflow® has been used to design, size and economically asses the MPUs, based on its extensive libraries of commercially available equipment. A multi-objective genetic algorithm is executed using OptimTool toolbox of Matlab® software to determine the best configurations of MPUs (Flórez-Orrego et al., 2022). The targets are weighed according to desired decision criteria (area: 0.1, weight: 0.1, investment cost: 0.4 and efficiency: 0.4) in order to generate single objective-based solutions whose performance can be later analysed at offdesign operating conditions by using GTMASTER® and MACRO® suites of Thermoflow®.
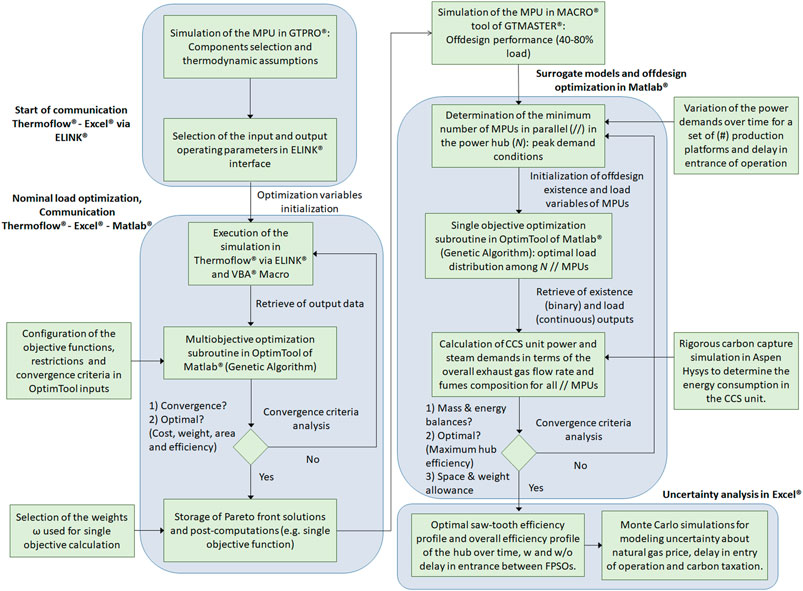
FIGURE 4. Flow diagram of the process synthesis and optimization of the power hubs based on the use of Thermoflow, Matlab, Excel and Aspen Hysys.
Based on the designs determined by GTPRO®, GTMASTER® and MACRO® help assessing the performance of the components of the utility systems when they operate at partial load. In this way, the efficiency can be correlated to the load of the MPUs on the power hub in order to create the surrogate models that are later implemented in the dispatch optimization problem in Matlab®. In this way, the saw-tooth efficiency plot for each power hub can be outlined, as described in previous works (Florez-Orrego et al., 2020a). On the other hand, the CO2 capture, compression and pumping systems have been simulated in Aspen® Hysys using Acid Gas® package (CO2 capture) and the Benedict-Webb-Rubin equation of state (EoS) with Starling modifications (CO2 compression and pumping), in order to determine the energy consumption and the capture performance. Those results have been used as input to the Thermoflow® carbon capture unit, which behaves as a black box model, since a direct connection between Aspen Hysys and Thermoflow® has not been achieved. Finally, based on Monte Carlo simulations, all the obtained solutions are analyzed in the light of the uncertainty of the natural gas price along the project lifespan, as well as the effect of the delay in entrance of operation, the carbon taxation and the depreciation of money with time, as it will be discussed in the next sections.
Due to the expected conflicting targets in the offshore power plant applications, the trade-offs between the best thermodynamic performance, the lowest environmental burden, and the most profitable power hub setups must be thoroughly weighed so that the best alternative is selected. To this end, different performance indicators are adopted. The exergy method was used to evaluate the thermodynamic performance of the proposed configurations of power hubs. The exergy of the natural gas used as fuel has been calculated using the correlations proposed by Szargut and coworkers (Szargut et al., 1988) and considering a typical composition of natural gas produced and purified in a FPSO located in the Brazilian pre-salt (76% methane, 10.63% ethane, 6.30% propane, 0.83% isobutane, 0.22% isopentane, 0.49% n-pentane, 0.64% nitrogen, 3.08% carbon dioxide) (Freire and Oliveira, 2019). The yearly exergy efficiency of the utility systems (
Based on the variation of the yearly exergy efficiency of the proposed hub layouts, the mean lifespan exergy efficiency (
Meanwhile, an incremental financial assessment aims to determine the marginal benefits obtained when more advanced utility systems supersede the conventional layout, even at the expense of higher initial investment costs. In this regard, the effect of the variation of relevant economic parameters on the total project cost is evaluated, namely the specific cost of the carbon capture unit (USD/kW), the carbon tax (USD/tCO2) and the interest rate (%). Two critical operating parameters, such as the uncertainty about the natural gas price and the delay in entry of operation between productive FPSOs, are also evaluated. These parameters have not been previously studied in the revised literature, but they may rapidly shift the project from a feasible operating zone to an unfeasible one. In fact, although a delay in entry of operation may substantially reduce the initial investment cost of the offshore utility systems in 40% by flattening the peak of the energy requirements (Florez-Orrego et al., 2020a), the incremental net revenues are also impaired with large delays due to the fluctuations of the fuel market price, the time-varying energy demands and the depreciation of money over time. Thus, the likelihood of loss, a financial performance indicator associated to the investment risk and defined as the probability of achieving negative incremental net present values, Eq. 2, is analyzed in the light of the opportunity costs of the natural gas not sold at the present value.
In Eq. 2 (R − C) is the net cash flow (i.e., revenues minus expenses), for each of the several (N) yearly periods (n), calculated for a certain configuration B, that is compared with a reference configuration A, whereas i is the average interest rate adopted. The capital expenditure of the power hub components is calculated via Thermoflow® software. Table 1 summarizes the variable and fixed operation & maintenance (O&M) costs adopted as a function of the power technology adopted (EIA, 2018; NREL Annual, 2020). The hull cost for the power hub is assumed as a representative cost for conversion (50 MUSD) (Stoichevski, 2015). An owner’s cost multiplying factor (fOC) of 1.6 is applied to the acquisition cost (AC) to reflect not only the purchase cost, but also the direct and indirect costs due to transportation (TC), installation (IC), startup (SC) and contingencies (Co) (Thermoflow, 2021). The total investment cost (TIC) can be calculated according to Eq. 3:
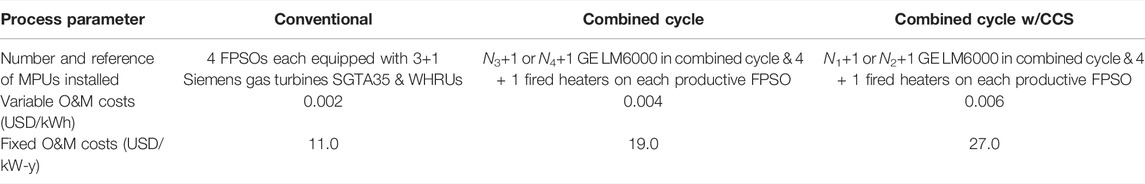
TABLE 1. Variable and fixed operation and maintenance (O&M) costs as a function of the power technology considered in the conventional and power hub-based utility systems.
The total capital investment is divided between the first (60%) and second (40%) years. A decommissioning cost of 5% of the overall CAPEX is assumed. Additionally, it is considered that each platform enters in operation with a delay of 0, 1, 2, 4 or 6 years, from the entry of the previous FPSO. Transmission costs estimates have been adapted from data of offshore wind farms, due to the lack of open information for the ultra-deep waters case (Lundberg, 2003).
Natural gas cost may drastically vary along the project lifespan. This fact, together with the fluctuation of the efficiency of the utility systems and the depreciation of money with time, only sheds more uncertainty to the financial feasibility and the attractiveness of the project. In order to simulate the effect of the uncertainty about the natural gas price on the economic performance of the proposed cogeneration systems, a series of Monte Carlo simulations are used to generate multiple profiles of natural gas price (see for instance Figure 5) for various the delays in entry of operation (1–6 years). To this end, it is assumed that natural gas price shows a normal distribution with a mean price of 5 USD per GJ and a standard deviation of 3 USD per GJ, which is representative for the market variation of the natural gas price during the last two decades (EIA, 2021). In each Monte Carlo iteration, Excel® random number function is used to generate different values between 0 and 1 associated to the natural gas cost probability for every year of the project lifespan. Those probability values are used to look up into the normal probability density function in order to determine the yearly random cost of natural gas at each year of the project lifespan. In this way, different profiles of natural gas cost can be generated, allowing to simulate the uncertainty about the natural gas price, instead of assuming a constant natural gas cost along that lifespan (Flórez-Orrego et al., 2022). Since this task is probabilistic in nature, the larger the amount of simulations conducted using random profiles, the higher the statistical probability of getting sufficient outliers to render the variance analysis meaningful. It has been verified that, as the number of iterations increased, the variance of the average output decreased (<5%).
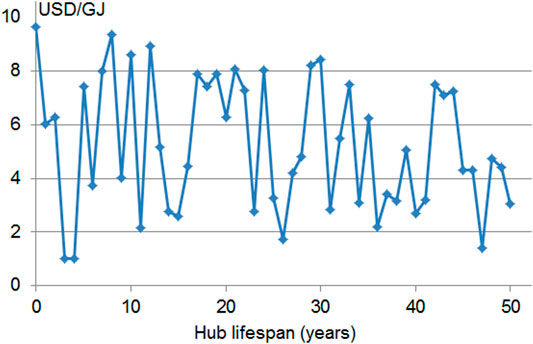
FIGURE 5. Random profile used for simulating the variation of the natural gas price over the project lifespan with a delay in entry of operation between FPSOs of 6 years. Different profiles can be generated based on the probability density function and other delays in entry of operation.
Next, considering each stochastic profile of the natural gas price over the time, the cash flows of both the conventional and the power hub-based setups are calculated, and the INPV defined by Eq. 2 is evaluated for each of the advanced configurations. To this end, different combinations of interest rate (5%, 10%, and 15%), specific cost of CCS unit (500, 1,000 and 1,500 USD/kW) (Markussen et al., 2003; Thambimuthu et al., 2005; Roussanaly et al., 2017a; Roussanaly et al., 2017b; Bui et al., 2018), and carbon taxation (0, 20, 40, 60, 80 and 100 USD/tCO2) have been considered (Markussen et al., 2003; Thambimuthu et al., 2005; Roussanaly et al., 2017a; Roussanaly et al., 2017b; Skalmeraas, 2017; Bui et al., 2018). Finally, further statistics on the results of the Monte Carlo simulations are performed in order to define whether the probability of the INPVs being lower than zero is higher than an acceptable value (i.e., if the ratio between the number of scenarios in which INPV <0 and the total number of simulated scenarios is higher than a given threshold). For the sake of clarity, a procedural example is described taking as reference the profile of natural gas price shown in Figure 5. This profile has been generated assuming the mentioned distribution of natural gas price and the random number generation function described above. It is specific for a delay in entrance of operation of 6 years between productive FPSOs; thus, other different profiles can be generated based on the same probability density function and other values of delay in entry of operation, since the latter factor influences the project lifespan. Based on the profile shown in Figure 5, the cash flow and the NPVs of the advanced configuration is calculated taking into account the maximum lifespan (defined by the delay in entrance in operation), the stochastic profile of the natural gas cost, the interest rate, the carbon tax and the cost of the CCS unit. These NPVs values are compared to the NPV of the conventional layout, which is calculated by assuming the same stochastic profile of the natural gas cost used for the advanced configurations. In this way, the incremental NPV can be calculated as the difference of both NPVs. Several iterations are performed fixing all the parameters, except for the profile of the natural gas price, which will depend on the new results of the random probability generator execution. After enough amount of iterations are attained (>7,000), the proportion of negative INPVs is determined and the analysis is repeated for a different set of interest rate, CCS unit cost and carbon taxation, so that new stochastic profiles of natural gas are generated and additional INPVs values are computed. Finally, the likelihood of financial loss of the advanced systems is compared and the results of the Monte Carlo simulation are graphically represented in contour plots.
In this section, the main results regarding the thermodynamic, environmental and economic performance of the proposed power hubs are discussed. Each power hub configuration is based on an arrangement of similar MPUs operating in parallel. Each MPU is composed of a LM6000 PC topping cycle and a specific design of bottoming cycle (Figures 3A–D). Table 2 shows the operating conditions of the bottoming cycles for each scenario, as well as the cost breakdown of the specialized equipment related to the power generation and control. The costs of the power hub hull, the submarine transmission cables and the fired water heaters installed in the FPSOs are summarized in Table 3. It must be pointed out that other aspects related to the compliance with the space and weight restrictions on the deck of the decommissioned and adapted FPSO have been verified and discussed in Florez-Orrego et al. (2020a). As expected, power hub configurations not equipped with a carbon capture and reinjection unit are lighter and less expensive, but only it only comes at the expense of a large amount of atmospheric emissions.
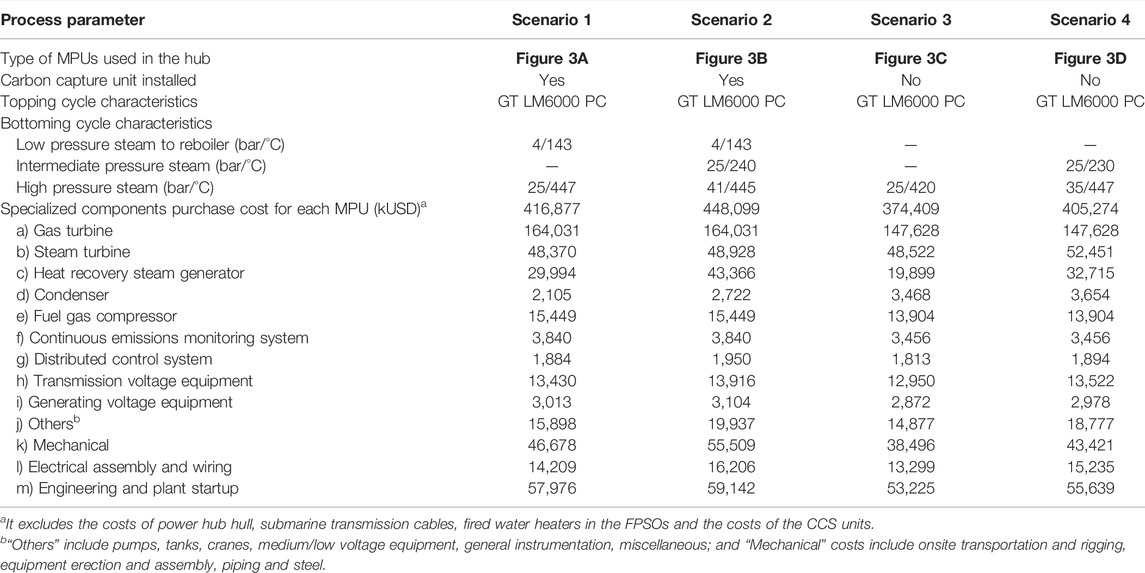
TABLE 2. Optimal design operating parameters and other economic characteristics of the MPUs with and without CCS unit corresponding to each studied scenario.
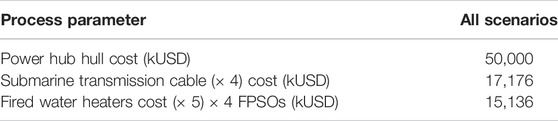
TABLE 3. Costs of power hub hull, submarine transmission cables and fired water heaters in the FPSOs.
The results for the minimum number of MPUs, overall owner’s cost, mean lifespan exergy efficiency, net cumulative CO2 emissions and yearly rate of CO2 emission of the various power hub configurations as a function of the delay in entry of operation between productive FPSOs are summarized in Table 4. Since the costs of the CCS unit depend on the capacity installed (in kW), the total project costs are shown for each specific CCS cost assumed (USD/kW), as a function of the delay in entrance of operation (0–6 years). According to Table 4, the minimum number of MPUs that requires to be installed can be appreciably reduced by increasing the delay in entrance of operation, since longer delays allow reducing the peak of power demand. The delay in entry of operation visibly impacts the overall owner’s costs, as it reduces the number of idle equipment required for attending the peak demand, which only occurs during a short interval of the hub lifespan. For instance, when this delay increases from 0 to 6 years, the required installed capacity reduces by 57.2% and, thus, the overall owner’s cost drops by 38%–42%. For the advanced utility systems without CCS unit (scenarios 3 and 4), as the delay increases beyond two years, the initial investment cost becomes even lower than that of the conventional configuration. Remarkably, despite the radical reduction of the initial investment cost with the delay in entrance of operation; for a given scenario, the mean lifespan efficiency remains invariable regardless of the value of the delay, due to the dispatch optimization performed based on the saw-tooth profile of each power hub (Florez-Orrego et al., 2020a; Flórez-Orrego et al., 2020). The mean exergy efficiencies over the lifespan of the utility systems based on power hubs with CCS units, namely, the scenarios 1 (35.6%) and 2 (37.0%), are 1–2 percentage points higher than that of the conventional cogeneration system (34.0%), even if they include a CCS technology. The utility systems corresponding to the scenarios 3 and 4 present comparable mean lifespan exergy efficiencies (43.1%–43.6%), and much higher (∼9 percentage points) than that of the conventional cogeneration plant in the offshore platforms.
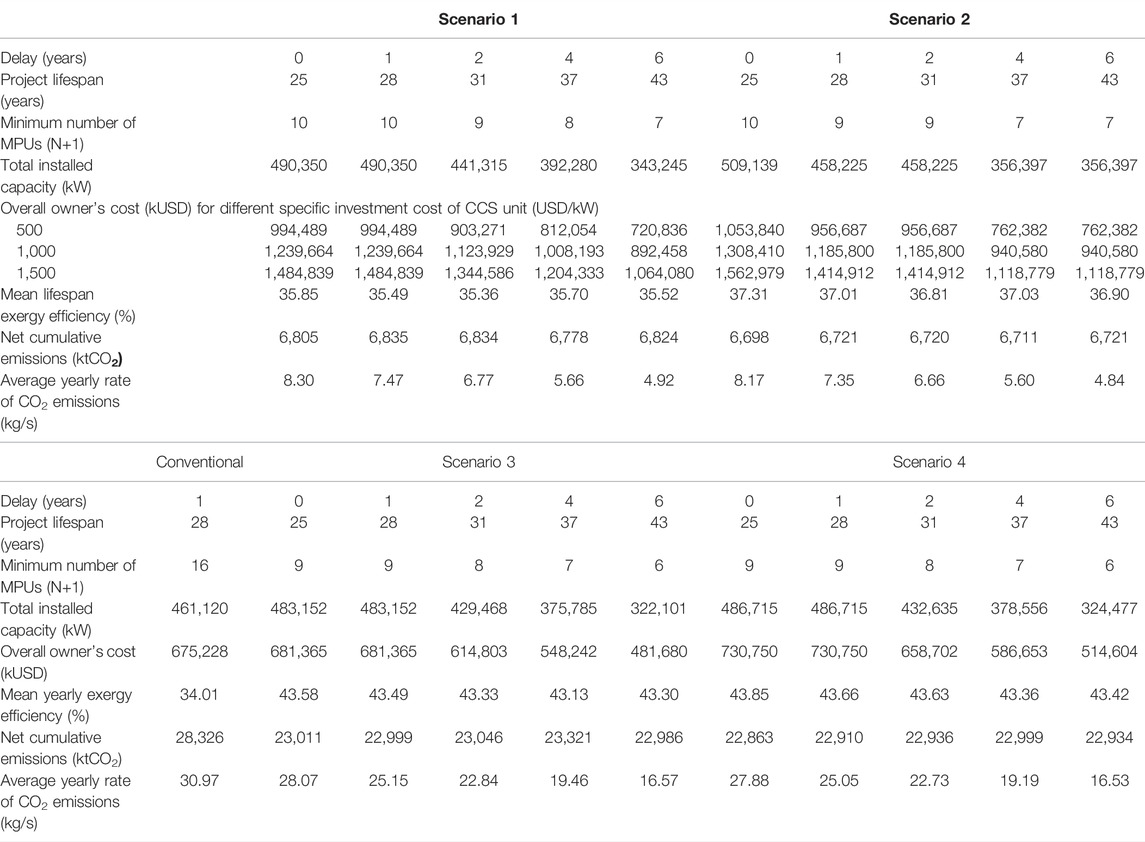
TABLE 4. Minimum number of MPUs, overall owner’s cost, mean lifespan exergy efficiency, net cumulative CO2 emissions and yearly rate of CO2 emission of the various power hub configurations as a function of the delay in entry of operation between productive FPSOs.
As for the cumulative CO2 emissions reported in Table 4, it is important to highlight that the less efficient scenarios 1 and 2 do not necessarily respond by the largest environmental impact, as long as the efficiency penalty is rather associated to the integration of a CCS unit. Moreover, like the exergy efficiency for each power hub scenario, the net cumulative CO2 emissions remain almost invariant regardless of the delay in entrance of operation adopted. The cumulative CO2 emissions of the power hub with CCS units (1 and 2) are three to four times lower than those of the conventional case or even the other counterparts without CCS unit (i.e., scenarios 3 and 4). Clearly, it only comes at the expense of doubling their investment costs. Yet, as it will be later discussed, this drastic cutdown in atmospheric emission contributes to increasing the financial feasibility of the environmentally friendly technologies adopted in the scenarios 1 and 2, especially when more stringent environmental regulations are envisaged, such as those including Pigovian taxes.
Figure 6 shows the evolution of the efficiency of the offshore utility systems for each scenario as a function of the delay in entry of operation. As it can be seen, except for the period of the highest heating demand, the power hub-based designs always present a higher efficiency along the project lifespan, which endorses the results of the mean lifespan exergy efficiency. The fact that the conventional utility system relies on four simple cycle gas turbines with large waste heat recovery units on each FPSO confers this arrangement advantages over the power hub setups during the period of peak of heating requirement. The reason is that the power hub concept displaced the power generation technologies to a centralized power station, delegating the heat supply on the FPSOs to a series of fired heaters, which do not operate in cogeneration mode. Some studies have demonstrated that installing an additional simple cycle gas turbine system on each FPSO, aside from the power generation systems in the hub, may help increasing the overall efficiency (Freire and Oliveira, 2019). It is also interesting that the profiles of the exergy efficiency displayed for the advanced utility systems become flatter as the delay in entrance of operation increases. This is also true for the profiles of yearly rate of CO2 emissions (Figure 7).
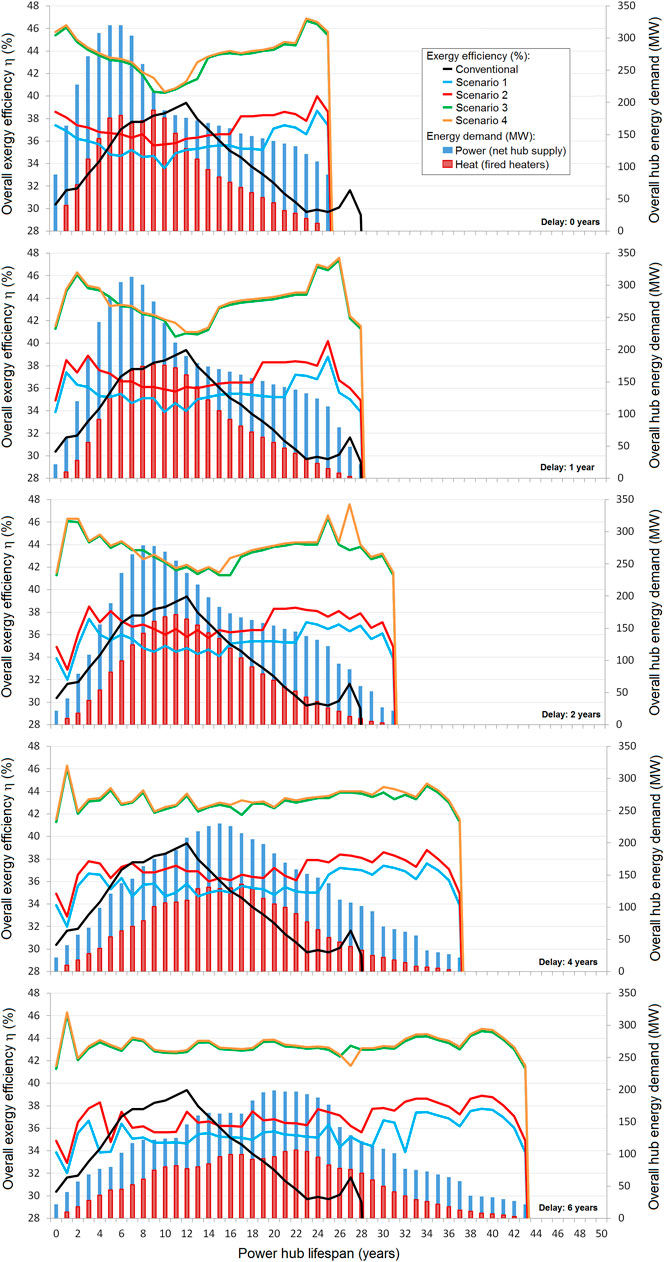
FIGURE 6. Yearly exergy efficiency of the utility systems as a function of the delay in entrance of operation. Overall hub energy demands are also shown.
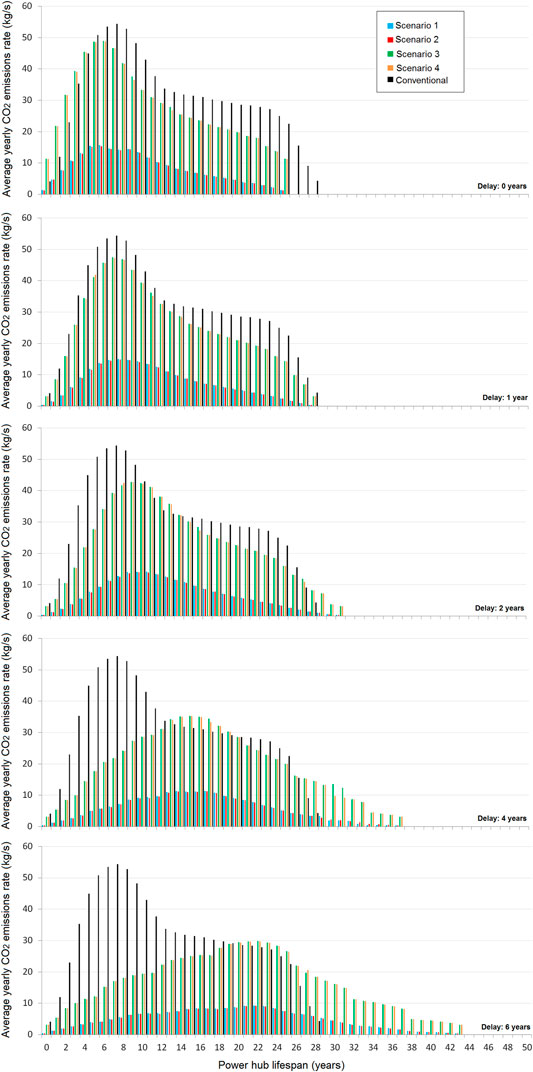
FIGURE 7. Variation of the yearly rate of CO2 emissions of the utility systems as a function of the delay in entrance of operation.
The advanced utility systems based on power hub concepts are expectedly bulkier and costlier, since they incorporate a larger number of complex power technologies. However, misleading conclusions may be drawn if those apparent disadvantages are not economically weighed in light of the growing awareness of the environmental impact of the offshore petroleum sector. Consequently, an incremental financial analysis is necessary to elucidate the actual benefits and challenges of employing power hubs. Some of those benefits include 1) augmented economic revenues from an increased natural gas export; 2) reduced carbon taxations with the integration of CCS units; and 3) relatively lower capital expenditure, due to the reduction of idle equipment using longer delays in entrance of operation. On the other hand, the likelihood of loss is aggravated owed to an opportunity cost arisen from money depreciation over time, uncertain natural gas price and the delay in extracting and selling the natural gas in present time. Other challenges such as high interest rates and costs of CCS units are related to risk perception and industrial maturity. Notwithstanding, according to the High-Level Commission on Carbon Prices and the Carbon Pricing Corridors initiative, a global CO2 price of 30–100 USD/tCO2 would be needed by 2030 in order to decarbonize the power sector (CDP, 2018; WBG, 2020). Thus, many firms are anticipating the potential impacts of more severe environmental regulations and envisaging business opportunities related with carbon abatement technologies, which may help carbon markets to thrive and boost the deployment of CCS units in offshore applications. For this reason, the following simulations assume that suitable carbon taxes (0–100 USD/tCO2) and mature post-combustion carbon capture systems (500–1,500 USD/kW) will be introduced at commercial scale.
According to Figure 8, the likelihood of loss only tends to zero for delays around one year. In fact, although longer delays might reduce the capital expenditure by flattening the peak of demand in comparison to the conventional case, they also incur penalties related to the rapid depreciation of money over time. This effect cannot be offset by the increased revenues, which leads to higher likelihood of loss in the project. Thus, the trade-off between investment costs and opportunity costs, arisen from delaying the selling of the natural gas, suggests that lower delays in entrance of operation are more favorable. High interest rates also hinder the financial feasibility of the power hubs proposed, although to a lesser extent. For scenario 4, i.e., without the integration of a CCS unit (see Figures 8G,H), a valley of zero likelihood of loss occurs at a delay in entry of operation of one year, regardless of the interest rate adopted. Meanwhile, the most affected configuration is the power hub based on the scenario 2, which rapidly becomes economically unfeasible as the interest rate climbs from 5 to 15% and carbon taxes fall below 40 USD/tCO2 (see Figures 8A–F). Moreover, since additional equipment is required for dealing with the peak of power demand when no delay is considered, adopting a delay of zero years most likely leads to less profitable scenarios than those in which a delay of at least one year is adopted (see Table 5).
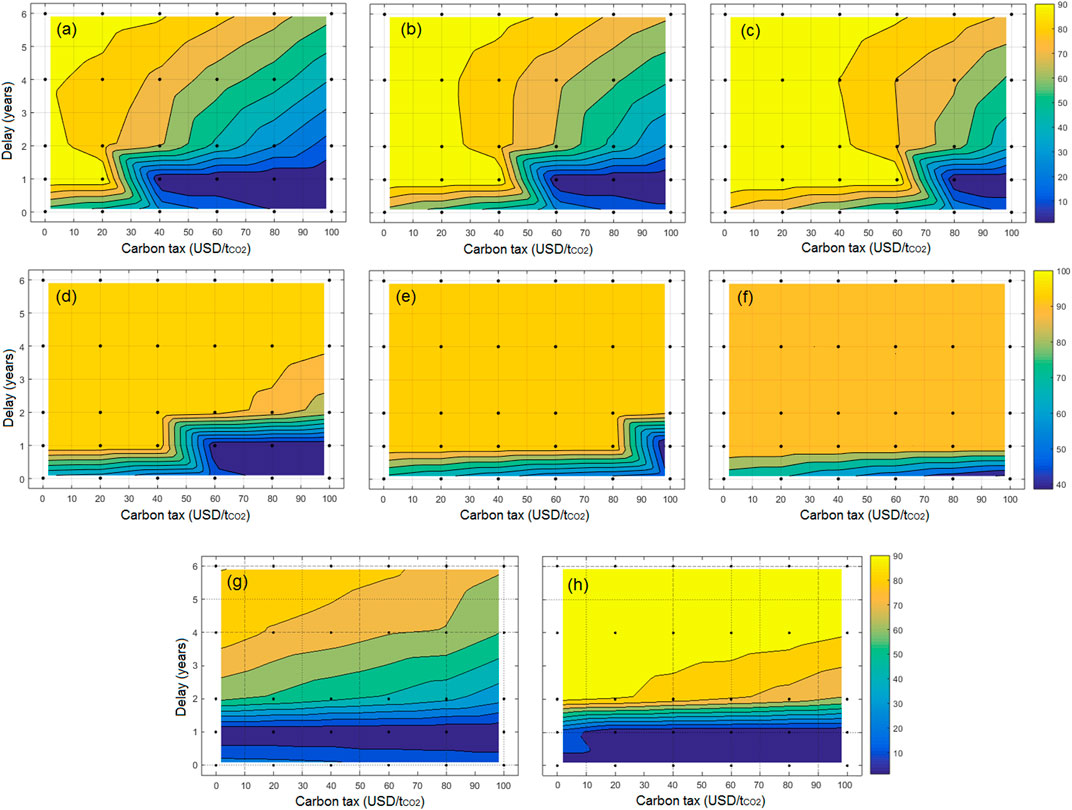
FIGURE 8. Plots of selected contours of the likelihood of loss (in %) of the utility systems as a function of the delay in entrance of operation and the carbon tax. For scenario 2 and i = 5%: (A) 500 USD/tCO2, (B) 1,000 USD/t CO2, (C) 1,500 USD/t CO2. For scenario 2 and i = 15%: (D) 500 USD/t CO2, (E) 1,000 USD/t CO2, (F) 1,500 USD/tCO2. For scenario 4 and (G) i = 5% or (H) i = 15%.
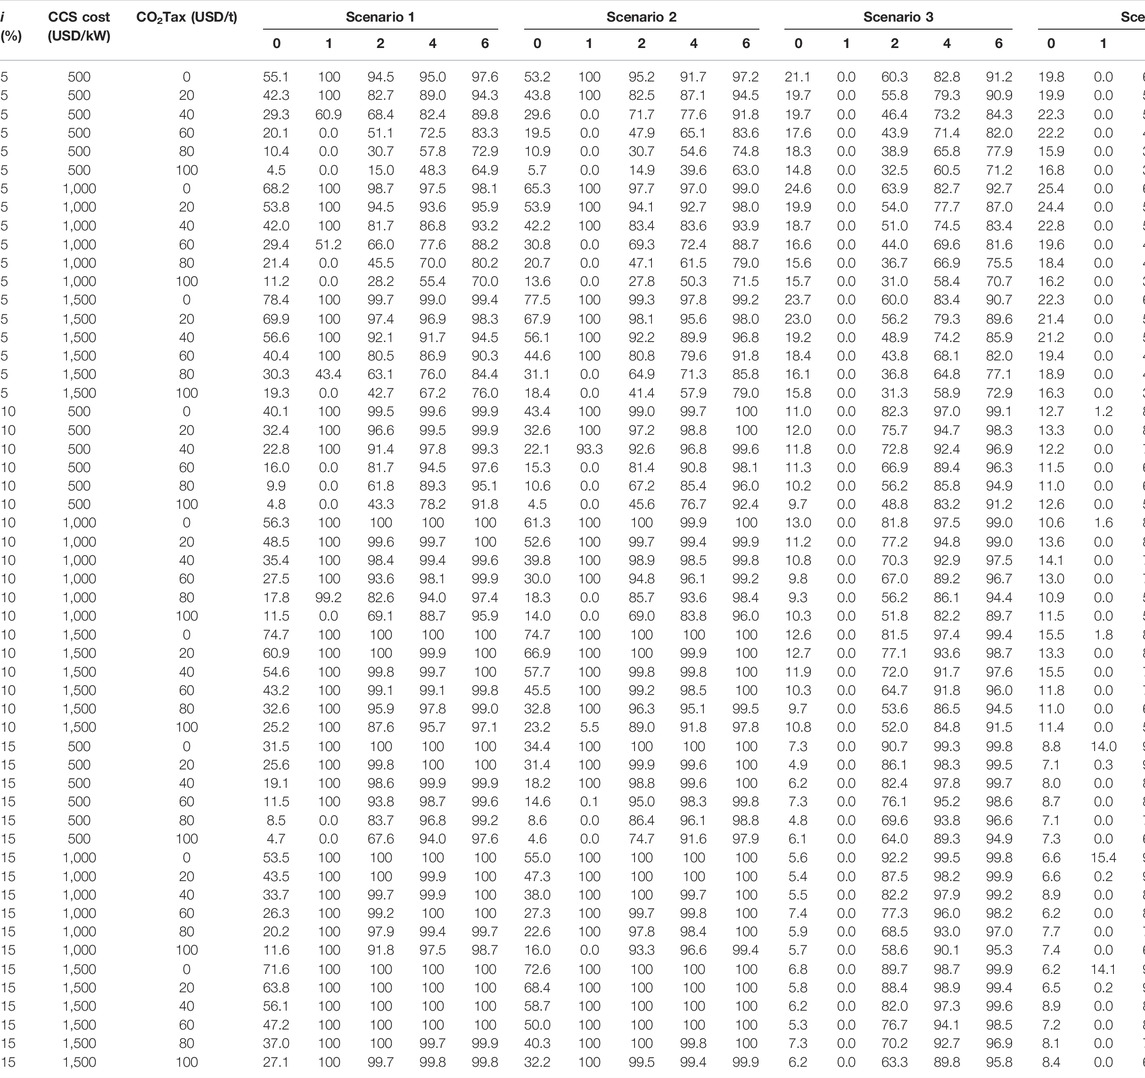
TABLE 5. Likelihood of loss (%) as a function of the delay in entrance of operation, the interest rate, the specific CCS unit cost and the CO2 tax.
Also from to Table 5, a very high CCS unit cost requires very low interest rates and high carbon taxes for scenarios 1 and 2 becoming profitable. In other words, when the interest rate and the specific cost of the CCS unit exceed 15% and 1,500 USD/kW, respectively, it is virtually unlikely finding a profitable scenario (i.e., likelihood of loss of 0%), except for extremely large carbon taxes (>100 USD/tCO2). However, comparing these two, the scenario 2 statistically holds the lowest likelihood of loss over a range of delay from 0 to 6 years and of carbon tax from 0 to 100 USD/tCO2. It can be explained by the higher efficiency of the double pressure steam network system, which partially offsets the efficiency penalty due to the introduction of the carbon abatement technology. Nevertheless, the integration of a steam network with two levels of pressure is not necessarily a warranty of relatively better financial performance. In effect, since scenarios 3 and 4 show similar exergy performance, the higher investment cost of the double pressure steam network adopted in scenario 4 leads to a higher likelihood of loss compared to the scenario 3. Anyhow, power hubs without CCS units seem to be profitable over a wider range of CO2 taxes and the likelihood of loss becomes lower than 30% for a delay from 2 years on, even for interest rates as high as 15%. A thoughtful inspection of the likelihood of loss for the power hubs based on scenarios 1 and 2 shows that this probability is higher at small CO2 taxes (<10 USD/tCO2) and delays in entrance of operation (<1 year), than for high carbon taxes (80–100 USD/tCO2) and middle to high delays (3–6 years), which emphasizes the non-linear relationship of the involved parameters. For instance, considering scenario 1, for a delay of entrance in operation of 6 years, interest rate of 5% and CCS unit cost of up to 1,500 USD/kW, the likelihood of loss can be reduced from 60.2% to 18.3% by solely increasing the carbon tax up to 180 USD/tCO2.
The adoption of internal carbon costs (shadow prices) for weighing the cost-benefits of integrating advanced power technologies have a strong impact on the project feasibility and may help assessing risk and business opportunities within firms, thus, supporting strategic decision-making linked to future capital investment (CPLC, 2017).
At the same time, the financial sector is becoming progressively vocal on climate action, as investors pressure increases due to the growing awareness of the impacts of industry operations and supply chains on the environmental and social welfare. See for instance, Financial Stability Board-Task Force on Climate-related Financial Disclosures (FSB-TCFD) (TCFD, 2020). Accordingly, many companies are gradually committing to net zero targets (CDP, 2018). In this regards, it is estimated that 45 billion USD have been raised in revenues with carbon pricing in 2019, corresponding to 22% of the global GHG emissions (12 GtCO2) (WBG, 2020). For this reason, the analysis of the impact of the climate change policies on the assets and operating revenues shown in this manuscript is a must-do in enterprises if they want to remain competitive in the coming period of energy transition. Jurisdictions may also choose to implement a tax or an emissions trading system (ETC), which could ramp up the price of carbon in the future to strengthen the influence of internal carbon pricing. For this reason, the future analyses will include scenarios in which an uncertain annual variation of the carbon taxation is considered, simulating the logic of a global carbon market (e.g., a speculative CO2 tax). This trend is in agreement with a growing number of business initiatives within firms, in which the internal carbon price is considered not only for planning purposes, but also for managing risk (Economist, 2013).
Limited weight load and space budget on existing FPSOs restrain electricity generation to low-efficiency energy systems and hampers the efforts to radically abate the environmental impact produced. In this regard, the power hub concept emerges as an interesting alternative to supply the power required by a set of four FPSOs using more efficient and affordable energy technologies, envisioning a hypothetical scenario of stronger regulatory system over oil and gas industry. Although power hubs may effectively increase the thermodynamic and environmental performance of the offshore utility systems, many challenges are still brought to companies that contemplate using those technologies, mostly due to the incremental costs associated. Accordingly, a comparative incremental analysis is performed to shed light on the potential benefits of the centralized power stations. Despite the advantages of the radical reductions in the initial investment, very long delays in entrance of operation could be not profitable for companies aiming to increase their net present revenues, as the opportunity cost related to the depreciation of money over time offsets the profitability gained with longer delays (>2 years). As for power hubs with CCS units, when the interest rate and the specific cost of the CCS unit attain values above 15% and 1,500 USD/kW, respectively, it is virtually unlikely finding a fully profitable scenario (i.e., 100% likelihood of loss), except for extremely large carbon taxes (>100 USD/tCO2). This conclusion holds even when the efficiency and the cumulative emissions remain invariable over the project lifespan for each power hub scenario. For a delay of entrance in operation of 6 years, an interest rate of 5% and a CCS unit cost of 1,500 USD/kW, the likelihood of loss of scenario 1 can be reduced from 60% up to 18% by solely increasing the carbon tax up to 180 USD/tCO2. Configurations of power hubs without CCS units seem to be more profitable for a wider range of CO2 tax, as the likelihood of loss is zero at one year of delay, regardless of the carbon tax, and even lower than 30% for 2 years of delay and interests rate about 15%.
The raw data supporting the conclusion of this article will be made available by the authors, without undue reservation.
DF-O: Conceptualization, methodology, formal analysis, and writing-original draft preparation. CA: Formal analysis, software, and writing-original draft preparation. JS: Methodology, formal analysis, and writing-original draft preparation. RF: Formal analysis, writing—review and editing. SJ: Project administration, writing—review and editing, supervision.
This work was supported by the National Agency of Petroleum, Natural Gas and Biofuels (ANP) and Petrobras, through Investment in Research, Development and Innovation Clause, contained in contracts for Exploration, Development and Production of Oil and Natural Gas (Contract No. 5850.0109226.18.9: “Offshore power generation in decommissioned FPSOs”).
The authors declare that the research was conducted in the absence of any commercial or financial relationships that could be construed as a potential conflict of interest.
All claims expressed in this article are solely those of the authors and do not necessarily represent those of their affiliated organizations, or those of the publisher, the editors and the reviewers. Any product that may be evaluated in this article, or claim that may be made by its manufacturer, is not guaranteed or endorsed by the publisher.
The first author also would like to thank the Colombian Administrative Department of Science, Technology and Innovation—Minciencias (COLCIENCIAS Grant 1.128.416.066-646/2014). The last author thanks the Brazilian National Research Council for Scientific and Technological Development, CNPq (grant 306484/2020-0).
Beck, B., Cunha, P., Ketzer, M., Machado, H., Rocha, P. S., Zancan, F., et al. (2011). The Current Status of CCS Development in Brazil. Energ. Proced. 4, 6148–6151. doi:10.1016/j.egypro.2011.02.623
Beigvand, S. D., Abdi, H., and La Scala, M. (2017). A General Model for Energy Hub Economic Dispatch. Appl. Energ. 190, 1090–1111. doi:10.1016/j.apenergy.2016.12.126
Bui, M., Adjiman, C. S., Bardow, A., Anthony, E. J., Boston, A., Brown, S., et al. (2018). Carbon Capture and Storage (CCS): the Way Forward. Energy Environ. Sci. 11 (5), 1062–1176. doi:10.1039/c7ee02342a
CDP (2018). Carbon Pricing Corridors: The Market View 2018.We Mean Business and Carbon Pricing Leadership Coalition.
EIA (2018). Generating Unit Annual Capital and Life Extension Costs Analysis, Final Report on Modeling Aging-Related Capital and O&M Costs - Project 13651-001, Doc. No. SL-014201. Washington, DC: Sargent and Lundy Consulting. May.
EIA (2021). Natural Gas - Henry Hub Natural Gas Spot Price 1997 - 2021. Available at: https://www.eia.gov/dnav/ng/hist/rngwhhdD.htm.
Ellsworth, B., and Picinich, J. (2011). “Petrobras to Begin Offshore CO2 Sequestration,” in Reuters Green Business News. (Thomson Reuters).
Flórez-Orrego, D., Albuquerque, C., da Silva, J. A. M., Freire, R. L. A., and de Oliveira Junior, S. (2021). Optimal Design of Power Hubs for Offshore Petroleum Platforms. Energy 235, 121353. doi:10.1016/j.energy.2021.121353
Flórez-Orrego, D., Freire, R. A., da Silva, J. A. M., Albuquerque Neto, C., and de Oliveira Junior, S. (2022). Centralized Power Generation with Carbon Capture on Decommissioned Offshore Petroleum Platforms. Energ. Convers. Manage. 252, 115110. doi:10.1016/j.enconman.2021.115110
Flórez-Orrego, D., Freire, R., Silva, J. A. M., Albuquerque, C., and Oliveira, (2020). “Optimal Design of Power Hubs for Offshore Petroleum Platforms Using a Systematic Framework,” in 6th International Conference on Contemporary Problems of Thermal Engineering, Krakow, Poland, 2020, September 21-24, 2020 (CPOTE).
Florez-Orrego, D., FreireSilva, R. J. A. M., Albuquerque, C., and Oliveira Junior, S. (2020). “Centralized Power Generation with Carbon Capture on Decommissioned Offshore Petroleum Platforms,” in 33th International Conference on Efficiency, Cost, Optimization, Simulation and Environmental Impact of Energy Systems, Osaka, Japan, 2020, June 29 - July 3 (ECOS).
Florez-Orrego, D., Lourenco, L., Lemes, F., Freire, R. L., Silva, J. A. M., Albuquerque Neto, C., et al. (2020). “Offshore Power Generation for FPSOs in Different Scenarios of Carbon Taxation, IBP0897_20,” in Rio Oil and Gas Expo Conference 2020, September 21 - 24, Rio de Janeiro, Brazil (Brazilian Petroleum, Gas and Biofuels Institute - IBP).
Freire, R., Florez-Orrego, D., Silva, J. A. M., Albuquerque, C., and Oliveira Junior, S. (2020). “Optimizing the Power Hub of Offshore Multi-Platform for Oil and Gas Production,” in 33th International Conference on Efficiency, Cost, Optimization, Simulation and Environmental Impact of Energy Systems, Osaka, Japan, 2020. June 29 - July 3 (ECOS).,
Freire, R. L. A., and Oliveira, S. (2019). “Technical and Economic Assessment of Power Hubs for Offhore Oil and Gas Application,” in 32th International Conference on Efficiency, Cost, Optimization, Simulation and Environmental Impact of Energy Systems, Wroclaw, Poland (ECOS), 1–8.
Gallo, W. L. R., Gallego, A. G., Acevedo, V. L., Dias, R., Ortiz, H. Y., and Valente, B. A. (2017). Exergy Analysis of the Compression Systems and its Prime Movers for a FPSO Unit. J. Nat. Gas Sci. Eng. 44, 287–298. doi:10.1016/j.jngse.2017.04.023
Hetland, J., Kvamsdal, H. M., Haugen, G., Major, F., Kårstad, V., and Tjellander, G. (2009). Integrating a Full Carbon Capture Scheme onto a 450MWe NGCC Electric Power Generation Hub for Offshore Operations: Presenting the Sevan GTW Concept. Appl. Energ. 86 (11), 2298–2307. doi:10.1016/j.apenergy.2009.03.019
Larson, A. (2017). “World’s Largest Post-Combustion Carbon Capture Project Completed,” in POWER (Houston, Texas: Power Magazine).
Leung, D. Y. C., Caramanna, G., and Maroto-Valer, M. M. (2014). An Overview of Current Status of Carbon Dioxide Capture and Storage Technologies. Renew. Sustain. Energ. Rev. 39, 426–443. doi:10.1016/j.rser.2014.07.093
Lundberg, S. (2003). Performance Comparison of Wind Park Configurations. Chalmers University of Technology.
Markussen, P., Austell, J., and Hustad, C. (2003). “A CO2-Infrastructure for Eor in the North Sea (Cens)Macroeconomic Implications for Host Countries,” in Greenhouse Gas Control Technologies - 6th International Conference. Editors J. Gale, and Y. Kaya (Oxford: Pergamon), 1077–1082. doi:10.1016/b978-008044276-1/50170-7
Myklebust, H., Eriksson, K., Westman, B., and Persson, G. (2017). “Valhall Power from Shore after Five Years of Operation,” in Petroleum and Chemical Industry Conference Europe (PCIC Europe). IEEE. doi:10.23919/pciceurope.2017.8015056
NREL Annual (2020). Technology Baseline (ATB) Data Download - Electricity Spreadsheet. Available at: https://atb.nrel.gov/electricity/2020/definitions.php.
PETROBRAS (2011). “One Project, One Destiny: Production,” in Revista Petrobras Year 17 (Rio de Janeiro: Petrobras). no. 164 January.
Riboldi, L., and Nord, O. L. (2017). Lifetime Assessment of Combined Cycles for Cogeneration of Power and Heat in Offshore Oil and Gas Installations. Energies 10 (6). doi:10.3390/en10060744
Roussanaly, S., Aasen, A., Anantharaman, R., Danielsen, B., Jakobsen, J., Heme-De-Lacotte, L., et al. (2019). Offshore Power Generation with Carbon Capture and Storage to Decarbonise mainland Electricity and Offshore Oil and Gas Installations: A Techno-Economic Analysis. Appl. Energ. 233-234, 478–494. doi:10.1016/j.apenergy.2018.10.020
Roussanaly, S., Anantharaman, R., Jordal, K., Giraldi, C., and Clapis, A. (2017). Spreadsheet for Evaluation of Cost of Retrofitting CO2 Capture from Refineries. SINTEFTrondheim.
Roussanaly, S., Anantharaman, R., Jordal, K., Giraldi, C., and Clapis, A. (2017). Understanding the Cost of Retrofitting CO2 Capture in an Integrated Oil Refinery - Cost Estimation and Economic Evaluation of CO2 Capture Options for Refineries - Report 2017:00222. Trondheim: SINTEF.
SHELL (2016). Peterhead CCS Project: FEED Summary Report for Full CCS Chain, Revision K03. Document No. PCCS-00-MM-AA-7180-00001 2016. UK: Shell.
Skalmeraas, O. (2017). Sleipner Carbon Capture and Storage Project. Available at: https://www.ice.org.uk/knowledge-and-resources/case-studies/sleipner-carbon-capture-storage-project.
Stoichevski, W. (2015). “The FPSO Cost Discussion,” in Maritime Reporter and Engineering News Magazine (New York: New Wave Media).
Swaminathan, S. (2012). “Post Combustion Carbon Capture Technology Development,” in International Training Programme on Clean Coal Technologies and Carbon Capture and Storage: Learning from the European CCT/CCS Experiences (Renfrew, Scotland: Doosan Power Systems Limited).
Szargut, J., Morris, D., and Steward, F. (1988). Exergy Analysis of thermal, Chemical, and Metallurgical Processes. New York: Hemisphere Publishing Corporation.
TCFD (2020). Task Force on Climate-Related Financial Disclosures. Available at: https://www.fsb-tcfd.org/.
Thambimuthu, K., Soltanieh, M., Abanades, J., Allam, R., Bolland, O., Davison, J., et al. (2005). “Capture of CO2,” in IPCC Special Report on Carbon Dioxide Capture and Storage - Working Group III of the Intergovernmental Panel on Climate Change WMO UNEP. Editors B. Metz, O. Davidson, H. Coninck, M. Loos, and L. Meyer (Cambridge University Press).
Thermoflow (2021). Thermoflow Software. Available at: https://www.thermoflow.com/
Vidoza, J. A., Andreasen, J. G., Haglind, F., dos Reis, M. M. L., and Gallo, W. (2019). Design and Optimization of Power Hubs for Brazilian Off-Shore Oil Production Units. Energy 176, 656–666. doi:10.1016/j.energy.2019.04.022
Vidoza, J., Andreasen, J. G., Haglind, F., Reis, M., and Gallo, W. (2018). “Design and Optimization of a Power Hub for Brazilian Off-Shore Oil Production Units,” in Proceedings of the 31st International Conference on Efficiency, Cost, Optimization, Simulation, and Environmental Impact of Energy Systems, Universidade do Minho: Guimarães, Portugal, 2018, Jun 17-21 (ECOS).
Welch, M., and Pym, A. (2015). Improving the Flexibility and Efficiency of Gas Turbine-Based Distributed Power Plants. Power Eng. 119 (9), 1.
Keywords: power hub, delay in entry, offdesign, CO2 taxation, opportunity cost
Citation: Flórez-Orrego D, Albuquerque C, Da Silva JAM, Freire R and De Oliveira Junior S (2022) Offshore Utility Systems for FPSOs: A Techno-Environomic Assessment Considering the Uncertainty About the Natural Gas Price. Front. Chem. Eng. 4:853749. doi: 10.3389/fceng.2022.853749
Received: 13 January 2022; Accepted: 30 March 2022;
Published: 27 April 2022.
Edited by:
José María Ponce-Ortega, Michoacana University of San Nicolás de Hidalgo, MexicoReviewed by:
Juan Barajas Fernández, Universidad Juárez Autónoma de Tabasco, MexicoCopyright © 2022 Flórez-Orrego, Albuquerque, Da Silva, Freire and De Oliveira Junior. This is an open-access article distributed under the terms of the Creative Commons Attribution License (CC BY). The use, distribution or reproduction in other forums is permitted, provided the original author(s) and the copyright owner(s) are credited and that the original publication in this journal is cited, in accordance with accepted academic practice. No use, distribution or reproduction is permitted which does not comply with these terms.
*Correspondence: Daniel Flórez-Orrego, ZGFuaWVsLmZsb3Jlem9ycmVnb0BlcGZsLmNo
Disclaimer: All claims expressed in this article are solely those of the authors and do not necessarily represent those of their affiliated organizations, or those of the publisher, the editors and the reviewers. Any product that may be evaluated in this article or claim that may be made by its manufacturer is not guaranteed or endorsed by the publisher.
Research integrity at Frontiers
Learn more about the work of our research integrity team to safeguard the quality of each article we publish.