
94% of researchers rate our articles as excellent or good
Learn more about the work of our research integrity team to safeguard the quality of each article we publish.
Find out more
ORIGINAL RESEARCH article
Front. Chem. Eng., 07 April 2022
Sec. Biochemical Engineering
Volume 4 - 2022 | https://doi.org/10.3389/fceng.2022.812140
 Lucas Kaspersetz1*
 Saskia Waldburger1
 M.-Therese Schermeyer1
 Sebastian L. Riedel1
 Sebastian Groß1,2
 Peter Neubauer1
 M.-Nicolas Cruz-Bournazou1,3
The development of biotechnological processes is challenging due to the diversity of process parameters. For efficient upstream development, parallel cultivation systems have proven to reduce costs and associated timelines successfully while offering excellent process control. However, the degree of automation of such small-scale systems is comparatively low, and necessary sample analysis requires manual steps. Although the subsequent analysis can be performed in a high-throughput manner, the integration of analytical devices remains challenging, especially when cultivation and analysis laboratories are spatially separated. Mobile robots offer a potential solution, but their implementation in research laboratories is not widely adopted. Our approach demonstrates the integration of a small-scale cultivation system into a liquid handling station for an automated cultivation and sample procedure. The samples are transported via a mobile robotic lab assistant and subsequently analyzed by a high-throughput analyzer. The process data are stored in a centralized database. The mobile robotic workflow guarantees a flexible solution for device integration and facilitates automation. Restrictions regarding spatial separation of devices are circumvented, enabling a modular platform throughout different laboratories. The presented cultivation platform is evaluated on the basis of industrially relevant E. coli BW25113 high cell density fed-batch cultivation. The necessary magnesium addition for reaching high cell densities in mineral salt medium is automated via a feedback operation loop between the analysis station located in the adjacent room and the cultivation system. The modular design demonstrates new opportunities for advanced control options and the suitability of the platform for accelerating bioprocess development. This study lays the foundation for a fully integrated facility, where the physical connection of laboratory equipment is achieved through the successful use of a mobile robotic lab assistant, and different cultivation scales can be coupled through the common data infrastructure.
The development of new biotechnological products is a laborious multi-stage process. The setup of a final large-scale process usually takes about 5–10 years (Neubauer et al., 2013). The development cycle usually follows a sequential workflow, where throughput and information content follow opposite directions (Bareither and Pollard, 2011; Hemmerich et al., 2018). To shorten these development cycles and reduce costs, high-throughput (HT) robotic facilities have become inevitable for early stage upstream bioprocess development. Miniaturized and parallelized experiments operated automatically in liquid handling stations (LHSs) ensure the necessary throughput and reduce experimental effort (Puskeiler et al., 2005; Knepper et al., 2014; Haby et al., 2019; Janzen et al., 2019). The smallest entities handled are microwell plates (MWPs), in a 96-well format with cultivation volumes in the range of 50–1,000 μl or below. The main disadvantages of screening in MWP format are that they do not resemble industrial conditions, especially when operated under batch conditions. Although fed-batch operation is possible (Panula-Perälä et al., 2008), limitations regarding scalability and process insights are still challenging (Bareither and Pollard, 2011). Therefore, many miniature bioreactor concepts, geometrically similar to large scale, have been developed and investigated throughout the last years. For more detailed reviews, see the works of Bareither and Pollard (2011) or Hemmerich et al. (2018). The systems presented in the aforementioned publications reproduce industrially relevant conditions better than simple MWPs but have several disadvantages, including low culture volumes leading to small sample volumes and insufficient process flexibility to investigate all relevant parameters and limitations in individual process control. Furthermore, major drawbacks are very limited feeding strategies and the inability to reach industrially relevant high cell densities (HCDs) (Bareither et al., 2013). In a glucose-limited fed-batch process, the continuous feed of a growth limiting substrate avoids the formation of acetate due to overflow metabolism (Pan et al., 1987; Xu et al., 1999; Bernal et al., 2016). Therefore, HCDs with concentrations of
Independent of their scale, cultivation systems have to be operated and controlled under optimal conditions. Therefore, automation tools must not be limited to the coupling of devices but must also provide interfaces for data-driven or model-based control strategies. Especially in the case of limited prior knowledge about the strain and the process, model-based tools have proven to be extremely helpful for optimal experimental design (Cruz Bournazou et al., 2017; Anane et al., 2019) and reduction of experimental effort. For a recent review on model-based tools and their applications in bioprocess engineering, see the work of Del Rio-Chanona et al. (2019) or Narayanan et al. (2020). To make use of the aforementioned frameworks for optimal process control and deriving process-specific parameters such as yields and growth rates, the acquisition of online, atline, and offline data is mandatory. Especially in HT scenarios, the frequency of sampling to determine the status of microbial cultures can be a major challenge (Janzen et al., 2019). Although a variety of online, inline, and atline probes for real-time process analytics exist and essential substrates or metabolites can be estimated in situ (Lee et al., 2004), methods such as Raman spectroscopy or near-infrared spectroscopy (Tamburini et al., 2014; Kögler et al., 2018) introduce additional complexity with regard to data handling, model calibration, and analysis (Mercier et al., 2014). A typical approach to overcome this issue is the implementation of enzymatic assays for atline determination of metabolites and substrates. However, additional equipment like a second LHS or a plate reader is necessary for sample processing and measurements (Nickel et al., 2017), whereas extensive hands-on time is required for the implementation and validation of the methods. In contrast to that, HT analyzers offer a variety of ready-made assay kits including standard calibration and validation procedures. Because of their large dimensions and the lack of bench space in research laboratories, the integration into LHSs becomes difficult (Holland and Davies, 2020), especially when cultivation and analytic laboratories are spatially separated. Laboratory automation in these settings remains demanding and usually left unsolved, leading to manual monotonous tasks for the scientist and/or data gaps have to be accepted. Elegant solutions are needed for linking HT upstream with sample analysis (Bareither and Pollard, 2011) while maintaining the degree of automation. Regarding modular setups for laboratory automation (Holland and Davies, 2020) and the connection of different unit operations up to integrated continuous biotechnological processes (Rathore et al., 2018), mobile and collaborative robots are a promising solution. Burger et al. (2020) used an intelligent mobile robot to automatically search for improved photocatalysts to realize hydrogen production from water. The robot operated autonomously over 8 days with a 1,000 times faster workflow compared to manual handling. Although this setup was used in a chemistry research environment, the concepts should also be applicable to biotechnological process development in HT laboratories. The cobot technology can be described as a system, which is no longer physically separated but rather integrated into the human’s physical work space (Kildal et al., 2018) mainly for improving efficiency, quality, and flexibility (Cassioli et al., 2021). Other possible tasks are related to ergonomics and safety (Kildal et al., 2018), where the cobot is mostly responsible for potentially hazardous or monotonous tasks in a time and energy efficient manner (Ajoudani et al., 2018). Mobile robotic lab assistants allow the integration of different laboratory equipment and different cultivation scales in a common automated platform. Large amounts of necessary process data from different scales can be generated in an automated environment for faster scale-up and reduced timelines (Neubauer et al., 2013, 2021). Thus, automated cultivation platforms, mobile robotic technologies, and HT analyzers offer potential for flexible and accelerated bioprocess development (Burger et al., 2020).
In this study, we present the integration of a small-scale multi-bioreactor system (
In this study, the BioXplorer 100 (H.E.L group, London, UK) for eight parallel cultivations in glass stirred tank reactors (STRs) with working volumes up to 150 mL was used. The cultivation system has two main components: 1) a heating and cooling block (PolyBlock, H.E.L group, London, UK) that holds the vessels and 2) the control unit. The system is equipped with pH sensors (AppliSens, Applikon Biotechnology B.V., Delft, Netherlands), dissolved oxygen (DO) sensors (AppliSens, Applikon Biotechnology B.V., Delft, Netherlands), three peristaltic pumps, and a mass flow controller for each vessel. The PolyBlock was integrated into a LHS (Tecan EVO 150, Tecan Group, Männedorf, Switzerland), whereas the control unit was placed on the left-hand side of the LHS. The LHS is equipped with a liquid handling arm with eight steel tips (LiHa). The Pt100 temperature probes for the left reactor column were bend
The mobile robotic lab assistant (Astechproject Ltd., Runcorn, UK) consisting of a driving platform MIR100, a robotic arm URE5 equipped with a two-finger gripper and three-dimensional (3D) camera was used for automated sample transport. The driving platform is equipped with two 3D cameras and two laser scanners for navigation and safety. The two-finger gripper can pick up MWPs in either portrait or landscape position. Two MWPs can be stored on deck and additional four plates at the back on a shelf of the platform. The laboratory map was taught including device positions for charging station and an additional waypoint. The cultivation system and the HT analyzer were labeled with a marker (ApriTag), and the corresponding positions for the MWP were taught from a right handed position. The corresponding functions for picking and placing a plate were set to linear movements (moveL) in PolyScope 3.2 (Universal Robots, Odense, Denmark). The movement velocity of the robot (0.8 m s−1) and the operating height were restricted due to safety reasons. All necessary functions for setting up and executing a workflow were controlled via a Standard in Laboratory Automation (SiLA2) interface.
The atline analysis was conducted by an HT analyzer (Cedex BioHT, Roche Diagnostics GmbH, Mannheim, Germany), equipped with a rack suitable for 96-MWP and an opening in the front lid (Figure 1C). The following test kits were calibrated and validated with the corresponding controls according to the manual prior to use: Glucose Bio HT, Acetate V2 Bio HT, Magnesium V2 Bio HT, and OD Bio HT (all Roche Diagnostics GmbH, Mannheim, Germany).
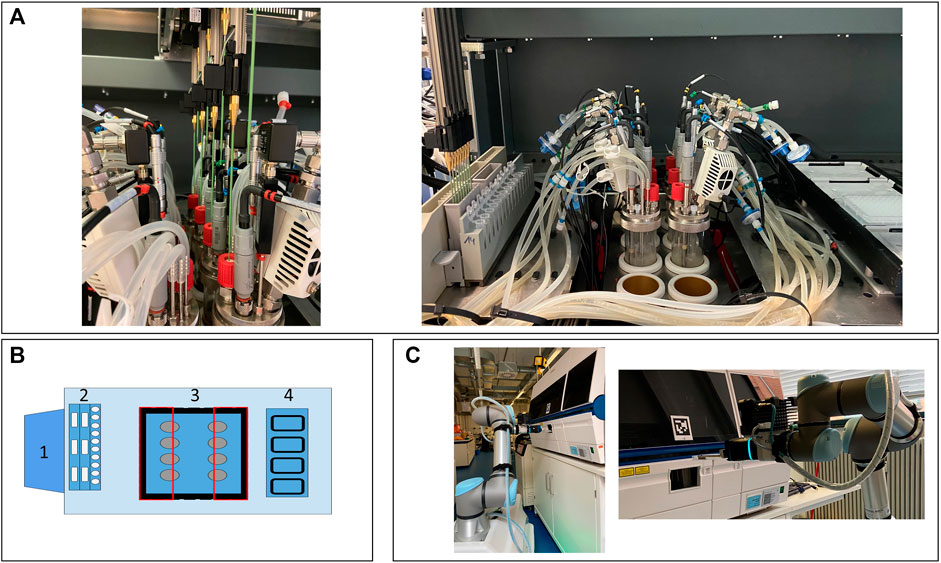
FIGURE 1. Presentation of the facility. The LHS with the integrated cultivation system (A). Schematic presentation of the integration and LHS deck layout (B). 1) Control station for the cultivation system; 2) wash station, troughs, and tube rack; 3) cutout (black), reactor block (blue), and restricted area for the LiHa (red rectangles); and 4) cooling rack for 96-MWP. Mobile robotic lab assistant placing the 96-MWP in the HT analyzer (C). LHS, Liquid handling station; LiHa, liquid handling arm; MWP, microwell plate; HT, high-throughput.
All experiments were carried out with E. coli BW25113 strain as biological triplicates. All chemicals were obtained from Roth (Carl Roth GmbH, Karlsruhe, Germany), Merck (Merck KgaA, Darmstadt, Germany), or VWR (VWR International, Radnor, PA, United States), if not stated otherwise. TY medium contained Bacto tryptone (16 g L−1; Becton Dickinson, Franklin Lakes, NJ, United States), Bacto yeast extract (10 g L−1; Biospringer, Maisons-Alfort, France), and NaCl (5 g L−1). The main medium consisted of mineral salt medium (MSM), containing the following: 2 g L−1 Na2SO4; 2.468 g L−1 (NH4)2SO4; 0.5 g L−1 NH4Cl; 14.6 g L−1 K2HPO4; 3.6 g L−1 NaH2PO4 × 2 H2O; 1 g L−1 (NH4)2-H-citrate; and 1 mL antifoam (Antifoam 204, Sigma-Aldrich, St. Louis, MO, United States). The medium was supplemented with trace element solution (2 mL−1) and MgSO4 solution (1 M). The trace element solution comprised the following: 0.5 g L−1 CaCl2 × 2 H2O; 0.18 g L−1 ZnSO4 × 7 H2O; 0.1 g L−1 MnSO4 × H2O; 20.1 g L−1 Na-EDTA; 16.7 g L−1 FeCl3 × 6 H2O; 0.16 g L−1 CuSO4 × 5 H2O; 0.18 g L−1 CoCl2 × 6 H2O; 0.087 Na2SeO3 g L−1 (Alfa Aesar, Haverhill, MA, USA); 0.12 g L−1, Na2MoO4 × 2 H2O; 0.725 g L−1, Ni(NO3)2 × 6 H2O. The feed solution contained glucose (600 g L−1) dissolved in MSM and supplemented with trace element solution 2 mL L−1. For the automated magnesium addition, 500 mM MgSO4 solution was used.
TY medium (15 mL) was directly inoculated with 100 μL of cryoculture and cultured in a 125-mL Ultra Yield flask (Thomson Instrument Company, Oceanside, CA, USA) sealed with an AirOtop enhanced flask seal (Thomson Instrument Company, Oceanside, CA, United States) for 7 h at 37°C and 220 rpm in an orbital shaker (25 mm amplitude, Adolf Kühner AG, Birsfelden, Switzerland). The second preculture was set to an OD600 of 0.25 and cultured in 50 mL of EnPresso B medium (Enpresso GmbH, Berlin, Germany) with Reagent A (9 U L−1) in 500-mL Ultra Yield flask sealed with an AirOtop enhanced flask seal under the same conditions. This allows for continuous glucose release over time and prevents overfeeding. After 12 h, appropriate volumes of the preculture were used to inoculate the main culture to an OD600 of 0.5.
Cultures were run in sixfold parallel glass STRs, each equipped with one Rushton type impeller at 37°C, and pH was controlled at 7.0 with 10% (v v−1) NH3(aq) via the WinISO control software (H.E.L group, London, UK) The main cultures were started as 90 mL of batch cultures with an initial glucose concentration of 10 g L−1. After the batch phase ended, a fed-batch was started with an exponential feeding rate μset = 0.2 h−1 or μ set = 0.15 h−1 for 6 or 13 h, respectively. Afterwards, the feed was set to constant until the end of the cultivation. The system was aerated with compressed air from 0.5 volume of air per operating volume per minute (vvm) during the batch phase up to 2 vvm during the fed-batch phase. In addition, stirring was increased from 1,000 rpm during the batch phase up to 1,500 rpm during the fed-batch phase, following preset values in WinISO. Manual adjustment to stirring or aeration was conducted if necessary.
Automated sampling was performed and scheduled by the LHS using the Freedom EVOware software (Tecan Group, Männedorf, Switzerland). For the sampling procedure, an adapted liquid class with an aspiration speed of 50 μL s−1, dispense speed of 150 μL s−1, and liquid density of 1 mg mL−1 was used. Upon each sampling event, the tips were washed and sterilized with ethanol. The left and the right column of the PolyBlock were sampled sub-sequentially, and each reactor was sampled through its septum. The sampling triggered the creation of a unique sampling ID for each bioreactor in the database, including the corresponding sampling method (atline or offline), timestamp, and sampling volume. For offline measurements, 1,000 μL per reactor were taken and 2 × 500 μL were dispensed in 1.5-mL reaction tubes. For atline sampling, 600 μL per reactor were taken. The atline sample volume was dispensed on a 96-MWP in three columns a 200 μL. Samples for atline analysis were inactivated directly with NaOH and stored on 96-well plates at 4°C (Nickel et al., 2017) on the deck of the LHS. The remaining sample volumes after atline analysis were frozen at −20°C. Glucose, acetate, magnesium, and OD583 were analyzed by the HT analyzer. Samples for offline CDW measurements were collected in 1.5-ml pre-weighed Eppendorf tubes. The tubes were centrifuged at 4°C, 10,000 rpm (Hitachi Koki Co. Ltd., Tokyo, Japan) for 10 min. The supernatant was discarded, and the pellet was dried at 85°C for 24 h, acclimated in a desiccator, and weighed. The CDW was calculated from the mass difference, and the collected values were written to the database. Measurements were conducted as duplicates.
The presented study illustrates the integration of a small-scale robotic cultivation system and a HT analyzer via implementing a mobile robotic lab assistant in the existing facility. As a case study E. coli BW25113 HCD cultivations were performed. Necessary magnesium addition steps to MSM during HCD cultivations were automated via a feedback operation loop.
For the physical device integration, adaptations regarding the stainless steel deck of the LHS were necessary. To ensure the necessary travel height for the steel tips of the liquid handling arm above the reactors, the LHS deck was removed, and a customized cutout was realized (Figure 1A). As demonstrated in Figure 1B, the area above the cutout was divided into two inaccessible areas, highlighted as two rectangles, allowing the LiHa only to move in a defined vertical line to reach the septum ports. Thus, collisions of the LiHa with one of the probes, the condensers, or any other tubing on the head plate can be prevented. These modifications enable automated sampling through the septum port of each reactor with a minimum culture volume of ca. 80 ml via the LiHa. As shown in Figure 1C, the HT analyzers front lid is equipped with a customized opening by the manufacturer. The opening allows the robot arm to access a 96-MWP rack without manually opening and closing the lid.
The data integration followed the concepts presented by Haby et al. (2019), which ensure that all experimental data for a run are stored centrally and accessible. A schematic representation of the device and data integration is depicted in Figure 2. The reading and writing procedures for process data, set points, and control actions were automated via Python scripts (Figure 2). The set points of the cultivation system can be either controlled via the control software WinISO or via the database. No proprietary data format is needed. A basic implementation for controlling temperature, pH, air flow rate, stirring, and feed pump rates was developed and can be easily connected to other interfaces. A Python-based graphical user interface (GUI) was developed, to facilitate the control of the data logging and set point writing. The GUI enables control of the cultivation system either via set points from the database or via the manufactures control software (WinISO). The automated sampling procedure conducted by the LHS was scheduled via the liquid handling script (Freedom EVOware). During each sampling event, an entry in the database is created featuring the sampling method (atline or offline) the sample volume, the timestamp and a unique sample ID. After the transfer of the samples from the cultivation system to the HT analyzer, those sample IDs were used as label names for the samples. Because the sampling procedure and the atline measurements have different timestamps, the measurements were matched to the actual timestamp of the sampling procedure. According to that, a Python script pulls the corresponding timestamps for each sample ID from the database and matches the measured values for glucose, acetate, OD583, and magnesium. Thereby, all online and atline process data are accessible in the database and can be deployed by other applications, e.g., feedback operation, model based control, or machine learning algorithms. As an example for such a feedback operation loop, magnesium addition (see Section 3.3.1) was automated. The feedback operation loop was implemented as a sub-method in a modular way. The setup can be easily adjusted for different control or trigger-based applications, e.g., automated induction. The control procedure was initiated by the LHS script and the magnesium controller calculated the corresponding volumes to be added, based on the set points and recent process data in the database. The necessary pipetting steps for each reactor were written to a worklist (gwl-list). The gwl-list contained the pipetting instructions, which was loaded and subsequently executed by the LiHa.
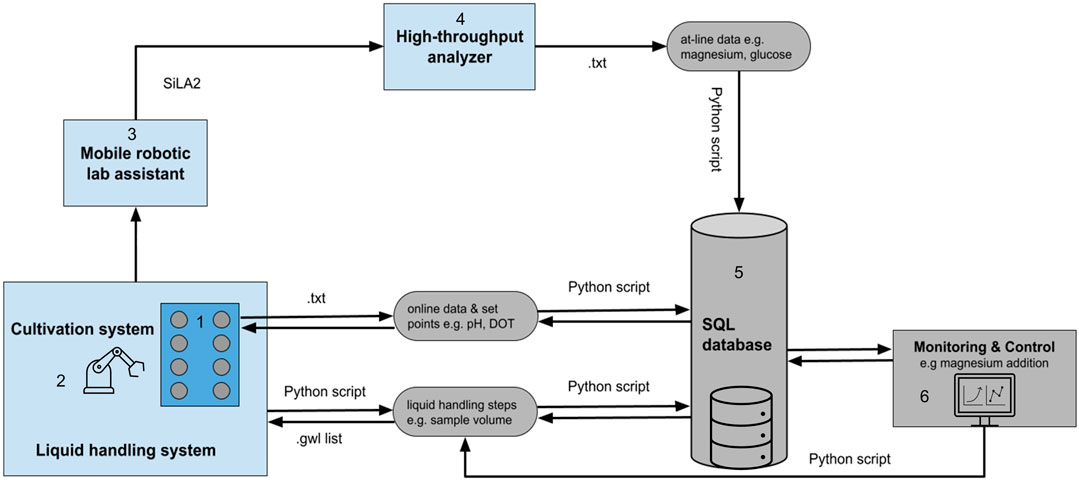
FIGURE 2. Schematic representation of the device (light blue) and data integration (light grey) in the facility. The facility is composed of a 1) cultivation system, 2) liquid handling station, 3) mobile robotic lab assistant, 4) high-throughput analyzer, 5) SQL database, and a 6) monitoring and control system. All process data are stored in the central database. The communication, data transfer, and control rely on different file formats, e.g., txt- and gwl-list. Necessary reading and control dependent writing of these files are automatically performed via Python scripts and database queries. The mobile robotic lab assistant is controlled via a SiLA2 server and client architecture. SQL, Structured Query Language; SiLA, Standard in Laboratory Automation.
The HT analyzer and the cultivation platform are spatially separated in two different rooms: the robotic cultivation laboratory and the analysis laboratory. The spatial separation inevitably leads to a reduction in the degree of automation, when sample transport is carried out manually. To overcome this issue and maintain a certain degree of automation, a mobile robotic lab assistant was integrated in the facility. The map, including overhand and device positions (Supplementary Figure S1B), was taught beforehand as described in Section 2.1.2. Different workflows were tested for transferring the 96-MWP containing the samples from the cultivation system to the HT analyzer. The main obstacles for an efficient workflow were identified, and the following points were addressed: 1) restrictions in laboratory space, 2) restrictions of the robotic arm, and 3) restrictions of integrated laboratory instruments.
The transport of the 96-MWP required the mobile robotic lab assistant to move from the cultivation laboratory to the analysis laboratory. In research laboratories, the available space for setting up equipment is often limited. The HT analyzer is located in the middle between two workbenches. To access the HT analyzer, the robot had to navigate through a narrow corridor between these workbenches. In combination with laboratory staff being around, the direct routing from the cultivation system to the HT analyzer was prone to fail. Instead of going directly from the cultivation system to the HT analyzer an additional stop, referred to as waypoint, was incorporated in the workflow. The waypoint area was kept free from other objects. Starting the routing through the narrow corridor from the waypoint prevented routing errors of the driving platform.
The robotic arm is equipped with a two-finger gripper and a mounted 3D camera (Supplementary Figure S1A). The 360°angle of the robotic arm allows to teach and approach devices from a left-handed or right-handed position. Because of the configuration of the robotic arm and the position of the joints, a left-handed or right-handed movement leads to different angles and joint positions of the robotic arm (Supplementary Figures S1C,D). Depending on the task that has to be performed left-handed or right-handed movements were restricted. In particular, left-handed arm movements have been difficult regarding restrictions of the laboratory devices. To circumvent collisions, picking and placing of 96-MWPs was carried out from a right-handed position. The HT analyzer is equipped with an opening at the front lid (Figure 1C). The opening allows the robotic arm to access the HT analyzer and place or pick the 96-MWP on the sample rack. Because of the narrow dimensions of the opening, it was necessary to avoid any side-ward movements of the robotic arm while placing or picking a 96-MWP. To guarantee straight robotic arm movements, the corresponding methods for placing and picking the 96-MWP were set to linear (see Section 2.1.2), and the approach distance was kept at 300 mm. The final workflow for the sample transfer is represented in Figure 3 and consisted of the following steps: 1) move 96-MWP from LHS to mobile robotic lab assistant, 2) place new 96-MWP from mobile robotic lab assistant’s back-shelf to LHS, 3) go to waypoint, 4) go to HT analyzer, 5) place 96-MWP on rack in HT analyzer, 6) remove 96-MWP from HT analyzer, 7) go to waypoint, and 8) stay idle.
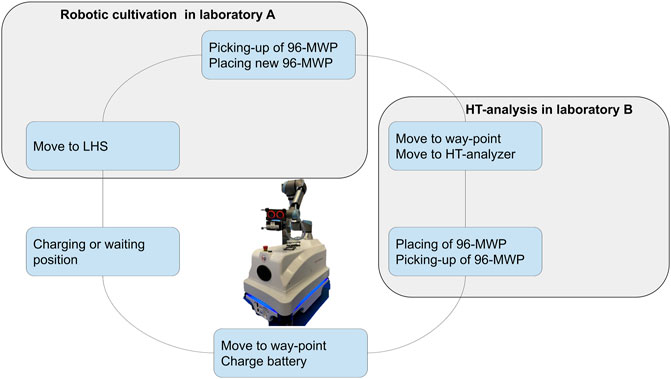
FIGURE 3. Illustration of the mobile robotic workflow. The mobile robotic lab assistant connects the cultivation platform in laboratory A with the high-throughput analyzer in laboratory B. The established workflow for the transportation of 96-microwell plates consisting of the following steps: 1) move 96-MWP plate from the LHS to mobile robotic lab assistant, 2) place new 96-microwell plate from mobile robotic lab assistant back-shelf to LHS, 3) go to waypoint, 4) go to HT analyzer, 5) place 96-MWP on rack in HT analyzer, 6) remove 96-MWP from HT analyzer, 7) go to waypoint, and 8) charge battery. MWP, microwell plate; HT, high-throughput; LHS, liquid handling station.
Industrial cultivations are usually performed in fed-batch mode to achieve HCDs, whereby the limited substrate, mostly glucose, is continuously fed at a defined rate. Thus, negative effects of overflow metabolism can be avoided and HCDs can be reached. The developed system was evaluated on the basis of its capability of performing an industrially relevant HCD cultivation. As a proof of concept, E. coli BW25113 cultivations were designed with the intention of reaching HCDs. Two feeding profiles were compared as biological triplicates. Both profiles followed an industrially relevant feeding regime starting with a batch phase followed by an exponential feed and constant feed and were designed to achieve CDW of approximately 50 g L−1 within 30 h of cultivation.
For adequate process monitoring and control, online and atline data were logged in the central database as described in Section 3.1. The online process data such as DOT, pH, stirrer speed, air flow, and cumulative volumes for base and feed addition are shown in the Supplementary Material (Supplementary Figure S2). The measurements for OD, glucose, acetate, CDW, and the feeding profile are shown in Figure 4. Throughout the cultivation, OD (Figures 4A,B), glucose (Figures 4C,D), and acetate (Figures 4E,F) were analyzed atline in the HT analyzer. The biological replicates with an exponential feeding rate of μset = 0.15 h−1 are referred to as reactors 1–3 (R1–R3), and biological triplicates with an exponential feeding rate of μset = 0.15 h−1 are referred to as reactors 4–6 (R4–R6). The reactors were inoculated to an OD600 of 0.5 in MSM with an initial glucose concentration of 10 g L−1. Throughout the batch phase of the cultivation, OD was measured (Figures 4A,B), allowing to monitor the growth atline. On the basis of that, a maximum specific growth rate of 0.57 ± 0.024 h−1 was determined (R1 excluded). During the batch phase, the glucose was depleted for each of the triplicates (Figures 4C,D). R5 showed a higher initial glucose concentration of 13.37 g L−1 compared to the other reactors (Figure 4D). During the batch phase, a typical increase in the acetate concentration, due to overflow metabolism, can be seen. The acetate concentration increased for R2–R6 up to values between 0.5 and 0.76 g L−1 (Figures 4E,F). An unexpectedly high acetate increase of up to 2.38 g L−1 was observed for R1. This increase was due to insufficient mixing caused by a technical failure of the stirrer. After the glucose was consumed and the corresponding peak in the DOT signal occurred between 5.6 and 6.3 h of cultivation, the fed-batch was started. The following acetate re-consumption during the initial fed-batch phase led to a decrease in the acetate concentration and is also shown in the pH peak. The exponential feeding rate was set to μset = 0.2 h−1 for 6 h and μset = 0.15 h−1 for 13 h for R1–R3 (Figure 4G) and R4–R6 (Figure 4H), respectively. Glucose limitation was maintained throughout the exponential feeding phase and overfeeding was avoided. However, after 22 h during the constant feeding phase, glucose and acetate concentrations increased for all reactors. R1 showed a maximum accumulation of glucose and acetate with 1.22 g L−1 (Figure 4C) and 0.371 g L−1 (Figure 4E), respectively. The constant feeding rate for R6 was reduced after ca. 27.5 h (Figure 4H) to avoid oxygen limitation. In addition to atline measurements, a sampling procedure for offline CDW measurements was automatically started during the feeding phase. Figures 4I,J show the offline CDW measurements for the biological triplicates. The biomass steadily increased during the feeding phase for R1–R3 (Figure 4I) and for R4–R6 (Figure 4J). A gap in the offline measurements between 17 and 26 h of cultivation was due to an intended sampling break during the night. After 26 h of cultivation, R4 showed a lower biomass of 36.2 g L−1 ± 1.8 g L−1 compared to R5 and R6. At the end of the cultivation, R4 stayed below the final 50 g L−1 with final biomass concentration of 43.9 g L−1 ± 5.8 g L−1. Besides R4 (Figure 4I), the desired CDW of 50 g L−1 was reached for both feeding profiles. From the data presented, it can be seen that the variance of the biological triplicates is comparatively small and that the error of the atline measurements is negligible.
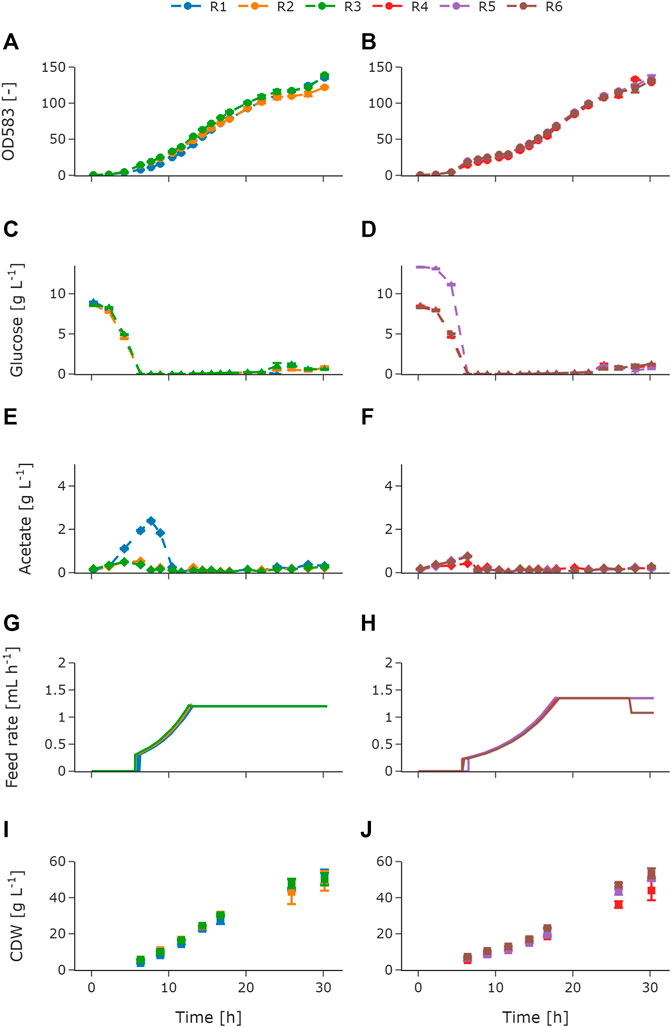
FIGURE 4. Measured atline and offline values of E. coli BW25113 fed-batch cultivations with two different feeding profiles as biological triplicates. OD583 for R1–R3 (A) and OD583 for R4–R6 (B), glucose for R1–R3 (C) and glucose for R4–R6 (D), acetate for R1–R3 (E) and acetate for R4–R6 (F), feed rate for R1–R3 (G) and feed rate for R4–R6 (H), and CDW for R1–R3 (I) and CDW for R4–R6 (J). For R1–R3, the exponential feed was set to μset = 0.2 h−1 for 6 h followed by a constant feed. For R4–R6 the exponential feed was set to μset = 0.15 h−1 for 13 h followed by a constant feed. The initial offset in the glucose concentration for R5 was due to a technical error, when priming the feed pumps. Therefore, additional glucose was added to the batch medium of R5. The increased acetate concentration for R1 was due to insufficient mixing caused by a technical failure of the stirrer. Error bars derived from replicates (n = 2). R, reactor; OD, optical density; CDW, cell dry weight.
Automation of parallel experiments requires additional control loops such as trigger-based events or feedback operation loops. In this study, magnesium addition was automated to demonstrate the capability of the system to perform feedback operation loops. The feedback operation loop was implemented on the basis of the Mg2+ concentration measurements from the HT analyzer. The implementation is described in Section 3.1. MSM requires the addition of magnesium ions to the batch medium. During the fed-batch phase, the feed solution can be supplemented (Riesenberg et al., 1991) or manual addition of magnesium solution is necessary. This is necessary due to the high phosphate concentration in media for HCD cultivations as Mg2+ can form insoluble precipitate with potassium and phosphate. The Mg2+ concentration set point for the control loop was 2 mM on the basis of the concentration in the batch medium and in accordance with the lower limit of the used test kit. Figure 5 depicts the measured Mg2+ concentrations (Figure 5A) and the added volumes (Figure 5B) during the cultivation for all reactors. The initially measured values were below 2 mM. Consequently, the control loop initiated the first magnesium addition cycle via the LHS already during the batch phase. As demonstrated in Figure 5B, the corresponding volumes were tracked for each reactor individually. Throughout the batch phase, magnesium was added automatically in every control cycle to all reactors. For the following exponential feeding phase, magnesium was also added in every control to reach the set point of 2 mM. When the feed was switched to constant after 6 h of exponential feed for R1, R2, and R3, the Mg2+ concentration reached the set point of 2 mM (Figure 5A). Therefore, no further magnesium was added to these reactors in the upcoming control cycles and the cumulative volume stayed the same (Figure 5B). The same behavior was observed 7 h later, when the constant feed for R4, R5, and R6 started. Toward the end of the cultivation, the Mg2+ concentration in the medium increased for all reactors (Figure 5A). Consequently, the feedback operation loop stayed inactive. The total amount of magnesium solution added varied between a minimum of 1.55 mL for R1 and maximum of 2.1 mL for R2 (Figure 5B).
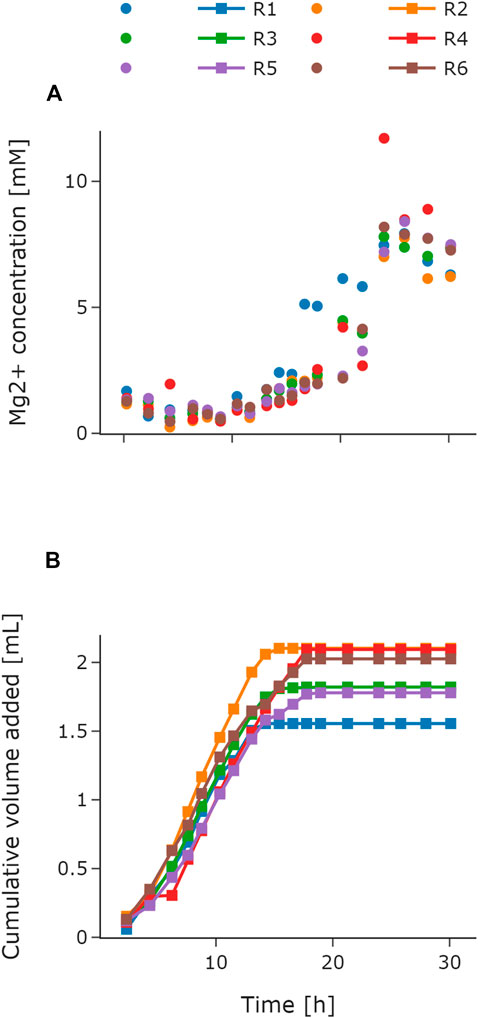
FIGURE 5. Automated feedback operation for magnesium addition. Atline measured Mg2+ concentrations throughout the cultivation for R1–R6 (A). Cumulative volume of the added magnesium solution for R1–R6 (B). The volume for each control cycle was calculated according to Section 3.3.1 with a set point of 2 mM. For R1–R3, the exponential feed was set to μset = 0.2 h−1 for 6 h followed by a constant feed. For R4–R6, the exponential feed was set to μset = 0.15 h−1 for 13 h followed by a constant feed. Mg2+, magnesium; R, reactor.
Automated cultivation platforms require the integration of different devices. The coupling of devices is restricted by large footprints and available laboratory space (Holland and Davies, 2020), limiting automated cultivation workflows. In this study, we addressed this challenge and integrated a robotic cultivation system and a spatially separated HT analyzer. The mobile robotic lab assistant coupled the devices via automated sample transfer. All process data were stored in a centralized database, and magnesium addition was automated via the feedback operation loop.
The integration of cultivation systems into LHS is a well-established approach for automated operation and sampling procedures and has been addressed before (Puskeiler et al., 2005; Haby et al., 2019; Janzen et al., 2019). Nevertheless, it lays the foundation for automated cultivation workflows and further automation steps. The presented robotic cultivation system enabled automated liquid handling procedures. Additional sampling ports or increased sampling volumes due to dead volumes were avoided. To gain process relevant insights, atline analytics were conducted on a HT analyzer. The HT analyzer offers a variety of pre-made assay kits with standard procedures for calibration and validation. No extra hands-on time for implementation and validation of the enzymatic assays was needed. Hence, the atline capabilities can be easily extended with reduced effort. The data handling was successfully automated via Python and allowed for flexible control of the cultivation system. The demand for transferring automation tools from microbioreactor systems to laboratory-scale cultivation systems has recently been addressed (Morschett et al., 2021). In this study, the data integration and the modular design of the feedback operation loop followed the principles of our existing HT bioprocess development facility (Haby et al., 2019). In addition to transferring automation tools, the connection to the centralized database sets the foundation for an integrated facility with different cultivation scales.
In comparison to existing robotic facilities (Puskeiler et al., 2005; Haby et al., 2019; Janzen et al., 2019; Morschett et al., 2021), we addressed the physical integration for atline analytics in a substantially different way. A mobile robotic lab assistant controlled via a SiLA2 interface connects the cultivation platform with a HT analyzer for automated sample transport with subsequent atline analysis. Restrictions regarding the robotic arm, the integrated laboratory devices and the available space in the laboratories were identified. The established workflow handled these restrictions and circumvented changes in the laboratory layout. As emphasized by Holland and Davies (2020), flexible automation tools are an important factor for research laboratories with varying experimental protocols. A modular design approach allows for flexible automation according to the current protocol. The demonstrated setup has specific advantages with regard to flexibility and modularization. The mobile robotic lab assistant successfully enabled the coupling of the cultivation platform to a HT analyzer in a different laboratory. Neither spatial separation of laboratory devices is a restriction in this setup nor are the analytics restricted to one dedicated device. The robotic workflow can be flexibly extended to integrate further equipment up to connecting different unit operations from upstream to downstream processing.
As highlighted by Bareither et al. (2013), industrial scale processes are usually performed as HCD fed-batch cultivations. However, HT cultivation platforms are either incapable or rarely challenged for HCDs (Faust et al., 2014). In this study, HCD cultivations were performed for accessing the feasibility of the developed system. The results demonstrate the successful execution of parallel HCD cultivations. A final CDW of ca. 50 g L−1 was reached with two different feeding profiles. R4 reached only a final CDW of 43.9 g L−1 ± 5.8 g L−1. This might be due to a handling error during the offline procedure as indicated by the large error bar. The atline OD measurements of the biological triplicates (Figure 4B) rather suggest a similar final biomass concentration. The gathered atline data showed low standard deviation emphasizing a robust operation of the system and allowed for good monitoring of the process. During the exponential feeding phase, no glucose accumulation was observed and overfeeding was avoided for both feeding rates, respectively. The slight accumulation of glucose toward the end of the cultivation is likely due to a decreasing glucose uptake rate as typically seen with decreasing specific growth rates toward the end of cultivations (Lin et al., 2001). The acetate concentration remained below 0.4 g L−1 throughout the feeding phase. This is comparable to other HCD cultivations where, specifically, the production of overflow metabolites was supposed to be avoided (Nakano et al., 1997; Schaepe et al., 2014). Hence, the proposed setup is suitable for operating, monitoring, and controlling HCD cultivations in an appropriate manner.
The established robotic workflow enabled the acquisition of atline measurements throughout the cultivation avoiding gaps in the data due to manual handling steps as exemplified by the offline CDW measurements (see Section 3.3). The consistently gathered atline data were used for further automation steps. A feedback operation loop for automated magnesium addition was successfully implemented and allowed for individual magnesium addition to each reactor. The feedback operation demonstrated in this study serves as a blueprint and is interchangeable for any other atline measurement and subsequent control procedure. As a central data infrastructure is given, model-based tools, e.g., adaptive feeding strategies (Hans et al., 2020) or model predictive control (Krausch et al., 2020), can be transferred and deployed. Thus, fundamental prerequisites toward a data-driven platform for accelerated bioprocess development are set.
Although the data infrastructure and the mobile robotic lab assistant allow for automated workflows, obstacles hindering a full autonomous operation remained unaddressed. The HT analyzer interface for automatically starting and stopping measurements is such an obstacle. For rapid and flexible integration of laboratory devices, standard protocols and unified data formats for plug and play operation are required (Bär et al., 2012). Such concepts provide a solution toward a fully automated workflow. Nevertheless, the conceptual design of the platform aligns well with described demands for accelerated (Bareither et al., 2013) and consistent bioprocess development (Neubauer et al., 2013) like modularization, integration of robotic technologies, fed-batch operation, or advanced control algorithms such as modeling tools.
In conclusion, the platform closes a gap between HT automated robotic screening facilities and individually controllable laboratory-scale reactors, transferring the automation tools to small-scale reactors with higher process flexibility, individual control, and continuous feeding. Through the operation under industrially relevant process conditions, risk for failure during development and scale-up can be reduced. The proposed setup including the implementation of a mobile robotic lab assistant into the overall workflow is well applicable to other laboratories, where spatial separation of devices or unit operations from upstream to downstream restricts automation. This study provides the basis for a fully automated facility that allows the integrated development of process steps of different scale and sequence. By linking the individual process steps, the acceleration of the entire bioprocess development pipeline can be achieved.
The raw data supporting the conclusion of this article will be made available by the authors, without undue reservation. The Python code for controlling the cultivation system remotely by other applications can be found in [HEL database connector] [https://git.tu-berlin.de/bvt-htbd/facility/hel_database_connector]. The Python code for the feedback operation loop can be found in [BioXplorer Tecan] [https://git.tu-berlin.de/bvt-htbd/facility/bioxplorer_tecan]. Access to the repositories can be granted upon request.
Conceptualization: LK, SG, MS, and MC-B; methodology: LK and SW; software: LK; validation: LK, SW, and SR; formal analysis: LK; investigation: LK, SG, MS; resources: LK and SW; data curation: LK; writing—original draft preparation: LK; writing—review and editing: SW, MS, SR, MC-B, PN, and SG; visualization: LK; supervision: MS, SR, and SG; project administration: MC-B; funding acquisition: PN. All authors have read and agreed to the published version of the manuscript.
This work was supported by the German Federal Ministry of Education and Research through the Program “International Future Labs for Artificial Intelligence” (Grant number 01DD20002A).
Author SG is employed by Wega Informatik GmbH. Author MC-B is employed by DataHow AG.
The remaining authors declare that the research was conducted in the absence of any commercial or financial relationships that could be construed as a potential conflict of interest.
All claims expressed in this article are solely those of the authors and do not necessarily represent those of their affiliated organizations or those of the publisher, the editors, and the reviewers. Any product that may be evaluated in this article, or claim that may be made by its manufacturer, is not guaranteed or endorsed by the publisher.
We would like to thank Simon Seidel and Annina Kemmer for their database connection modules. We would like to thank Niels Krausch and Fabian Schröder-Kleeberg for the introduction into the facility. We thank Roche CustomBiotech (Mannheim, Germany) for the supply of the Cedex Bio HT Analyzer. We acknowledge support by the Open Access Publication Funds of TU Berlin.
The Supplementary Material for this article can be found online at https://www.frontiersin.org/articles/10.3389/fceng.2022.812140/full#supplementary-material
Ajoudani, A., Zanchettin, A. M., Ivaldi, S., Albu-Schäffer, A., Kosuge, K., and Khatib, O. (2018). Progress and Prospects of the Human-Robot Collaboration. Auton. Robot. 42, 957–975. doi:10.1007/s10514-017-9677-2
Ali, S., Perez-Pardo, M. A., Aucamp, J. P., Craig, A., Bracewell, D. G., and Baganz, F. (2012). Characterization and feasibility of a miniaturized stirred tank bioreactor to perform e. coli high cell density fed-batch fermentations. Biotechnol. Prog. 28, 66–75. doi:10.1002/btpr.708
Anane, E., García, Á. C., Haby, B., Hans, S., Krausch, N., Krewinkel, M., et al. (2019). A Model‐based Framework for Parallel Scale‐down Fed‐batch Cultivations in Mini‐bioreactors for Accelerated Phenotyping. Biotechnol. Bioeng. 116, 2906–2918. doi:10.1002/bit.27116
Bär, H., Hochstrasser, R., and Papenfuß, B. (2012). SiLA. J. Lab. Autom. 17, 86–95. doi:10.1177/2211068211424550
Bareither, R., Bargh, N., Oakeshott, R., Watts, K., and Pollard, D. (2013). Automated Disposable Small Scale Reactor for High Throughput Bioprocess Development: a Proof of Concept Study. Biotechnol. Bioeng. 110, 3126–3138. doi:10.1002/bit.24978
Bareither, R., and Pollard, D. (2011). A Review of Advanced Small-Scale Parallel Bioreactor Technology for Accelerated Process Development: Current State and Future Need. Biotechnol. Prog. 27, 2–14. doi:10.1002/btpr.522
Bernal, V., Castaño-Cerezo, S., and Cánovas, M. (2016). Acetate Metabolism Regulation in escherichia Coli: Carbon Overflow, Pathogenicity, and beyond. Appl. Microbiol. Biotechnol. 100, 8985–9001. doi:10.1007/s00253-016-7832-x
Burger, B., Maffettone, P. M., Gusev, V. V., Aitchison, C. M., Bai, Y., Wang, X., et al. (2020). A mobile Robotic Chemist. Nature 583, 237–241. doi:10.1038/s41586-020-2442-2
Cassioli, F., Fronda, G., and Balconi, M. (2021). Human-Co-Bot Interaction and Neuroergonomics: Co-botic vs. Robotic Systems. Front. Robot. AI 8, 659319. doi:10.3389/frobt.2021.659319
Cruz Bournazou, M. N., Barz, T., Nickel, D. B., Lopez Cárdenas, D. C., Glauche, F., Knepper, A., et al. (2017). Online Optimal Experimental Re-design in Robotic Parallel Fed-Batch Cultivation Facilities. Biotechnol. Bioeng. 114, 610–619. doi:10.1002/bit.26192
Del Rio‐Chanona, E. A., Cong, X., Bradford, E., Zhang, D., and Jing, K. (2019). Review of Advanced Physical and Data‐driven Models for Dynamic Bioprocess Simulation: Case Study of Algae-Bacteria Consortium Wastewater Treatment. Biotechnol. Bioeng. 116, 342–353. doi:10.1002/bit.26881
Faust, G., Janzen, N. H., Bendig, C., Römer, L., Kaufmann, K., and Weuster-Botz, D. (2014). Feeding Strategies Enhance High Cell Density Cultivation and Protein Expression in Milliliter Scale Bioreactors. Biotechnol. J. 9, 1293–1303. doi:10.1002/biot.201400346
Haby, B., Hans, S., Anane, E., Sawatzki, A., Krausch, N., Neubauer, P., et al. (2019). Integrated Robotic Mini Bioreactor Platform for Automated, Parallel Microbial Cultivation with Online Data Handling and Process Control. SLAS TECHNOLOGY: Translating Life Sci. Innovation 24, 569–582. doi:10.1177/2472630319860775
Hans, S., Haby, B., Krausch, N., Barz, T., Neubauer, P., and Cruz-Bournazou, M. N. (2020). Automated Conditional Screening of Multiple escherichia Coli Strains in Parallel Adaptive Fed-Batch Cultivations. Bioengineering 7, 145. doi:10.3390/bioengineering7040145
Hemmerich, J., Noack, S., Wiechert, W., and Oldiges, M. (2018). Microbioreactor Systems for Accelerated Bioprocess Development. Biotechnol. J. 13, 1700141. doi:10.1002/biot.201700141
Holland, I., and Davies, J. A. (2020). Automation in the Life Science Research Laboratory. Front. Bioeng. Biotechnol. 8, 571777. doi:10.3389/fbioe.2020.571777
Janzen, N. H., Striedner, G., Jarmer, J., Voigtmann, M., Abad, S., and Reinisch, D. (2019). Implementation of a Fully Automated Microbial Cultivation Platform for Strain and Process Screening. Biotechnol. J. 14, 1800625. doi:10.1002/biot.201800625
Kildal, J., Tellaeche, A., Fernández, I., and Maurtua, I. (2018). Potential Users' Key Concerns and Expectations for the Adoption of Cobots. Proced. CIRP 72, 21–26. doi:10.1016/j.procir.2018.03.104
Knepper, A., Heiser, M., Glauche, F., and Neubauer, P. (2014). Robotic Platform for Parallelized Cultivation and Monitoring of Microbial Growth Parameters in Microwell Plates. J. Lab. Autom. 19, 593–601. doi:10.1177/2211068214547231
Kögler, M., Paul, A., Anane, E., Birkholz, M., Bunker, A., Viitala, T., et al. (2018). Comparison of Time‐gated Surface‐enhanced Raman Spectroscopy (TG‐SERS) and Classical SERS Based Monitoring of Escherichia coli Cultivation Samples. Biotechnol. Prog. 34, 1533–1542. doi:10.1002/btpr.2665
Korz, D. J., Rinas, U., Hellmuth, K., Sanders, E. A., and Deckwer, W.-D. (1995). Simple Fed-Batch Technique for High Cell Density Cultivation of escherichia Coli. J. Biotechnol. 39, 59–65. doi:10.1016/0168-1656(94)00143-Z
Krausch, N., Hans, S., Fiedler, F., Lucia, S., Neubauer, P., and Cruz Bournazou, M. N. (2020). “From Screening to Production: a Holistic Approach of High-Throughput Model-Based Screening for Recombinant Protein Production,” in Computer Aided Chemical Engineering. Vol. 48 of 30 European Symposium on Computer Aided Process Engineering. Editors S. Pierucci, F. Manenti, G. L. Bozzano, and D. Manca (Amsterdam, Netherlands: Elsevier), 1723–1728. doi:10.1016/B978-0-12-823377-1.50288-3
Kusterer, A., Puskeiler, R., John, G. T., and Weuster-Botz, D. (2005). Miniature Bioreactors for Automated High-Throughput Bioprocess Design (HTBD): Reproducibility of Parallel Fed-Batch Cultivations with escherichia Coli. Biotechnol. Appl. Biochem. 42, 227. doi:10.1042/BA20040197
Lee, H. L. T., Boccazzi, P., Gorret, N., Ram, R. J., and Sinskey, A. J. (2004). In Situ bioprocess Monitoring of escherichia Coli Bioreactions Using Raman Spectroscopy. Vibrational Spectrosc. 35, 131–137. doi:10.1016/j.vibspec.2003.12.015
Lee, S. Y. (1996). High Cell-Density Culture of escherichia Coli. Trends Biotechnol. 14, 98–105. doi:10.1016/0167-7799(96)80930-9
Lin, H. Y., Mathiszik, B., Xu, B., Enfors, S.-O., and Neubauer, P. (2001). Determination of the Maximum Specific Uptake Capacities for Glucose and Oxygen in Glucose-Limited Fed-Batch Cultivations ofEscherichia Coli. Biotechnol. Bioeng. 73, 347–357. doi:10.1002/bit.1068
Mercier, S. M., Diepenbroek, B., Wijffels, R. H., and Streefland, M. (2014). Multivariate PAT Solutions for Biopharmaceutical Cultivation: Current Progress and Limitations. Trends Biotechnol. 32, 329–336. doi:10.1016/j.tibtech.2014.03.008
Morschett, H., Tenhaef, N., Hemmerich, J., Herbst, L., Spiertz, M., Dogan, D., et al. (2021). Robotic Integration Enables Autonomous Operation of Laboratory Scale Stirred Tank Bioreactors with Model‐driven Process Analysis. Biotechnol. Bioeng. 118, 2759–2769. doi:10.1002/bit.27795
Nakano, K., Rischke, M., Sato, S., and Märkl, H. (1997). Influence of Acetic Acid on the Growth of escherichia Coli K12 during High-Cell-Density Cultivation in a Dialysis Reactor. Appl. Microbiol. Biotechnol. 48, 597–601. doi:10.1007/s002530051101
Narayanan, H., Luna, M. F., Stosch, M., Cruz Bournazou, M. N., Polotti, G., Morbidelli, M., et al. (2020). Bioprocessing in the Digital Age: The Role of Process Models. Biotechnol. J. 15, 1900172. doi:10.1002/biot.201900172
Neubauer, P., Anane, E., Junne, S., and Cruz Bournazou, M. N. (2020). “Potential of Integrating Model-Based Design of Experiments Approaches and Process Analytical Technologies for Bioprocess Scale-Down,” in Digital Twins: Applications to the Design and Optimization of Bioprocesses. Advances in Biochemical Engineering/Biotechnology. Editors C. Herwig, R. Pörtner, and J. Möller (Berlin, Germany: Springer International Publishing), 1–28. doi:10.1007/10_2020_154
Neubauer, P., Cruz, N., Glauche, F., Junne, S., Knepper, A., and Raven, M. (2013). Consistent Development of Bioprocesses from Microliter Cultures to the Industrial Scale. Eng. Life Sci. 13, 224–238. doi:10.1002/elsc.201200021
Nickel, D. B., Cruz-Bournazou, M. N., Wilms, T., Neubauer, P., and Knepper, A. (2017). Online Bioprocess Data Generation, Analysis, and Optimization for Parallel Fed-Batch Fermentations in Milliliter Scale. Eng. Life Sci. 17, 1195–1201. doi:10.1002/elsc.201600035
Pan, J. G., Rhee, J. S., and Lebeault, J. M. (1987). Physiological Constraints in Increasing Biomass Concentration ofEscherichia Coli B in Fed-Batch Culture. Biotechnol. Lett. 9, 89–94. doi:10.1007/BF01032744
Panula-Perälä, J., Šiurkus, J., Vasala, A., Wilmanowski, R., Casteleijn, M. G., and Neubauer, P. (2008). Enzyme Controlled Glucose Auto-Delivery for High Cell Density Cultivations in Microplates and Shake Flasks. Microb. Cel Fact 7, 31. doi:10.1186/1475-2859-7-31
Rathore, A. S., Kateja, N., and Kumar, D. (2018). Process Integration and Control in Continuous Bioprocessing. Curr. Opin. Chem. Eng. 22, 18–25. doi:10.1016/j.coche.2018.08.005
Riesenberg, D., Schulz, V., Knorre, W. A., Pohl, H.-D., Korz, D., Sanders, E. A., et al. (1991). High Cell Density Cultivation of escherichia Coli at Controlled Specific Growth Rate. J. Biotechnol. 20, 17–27. doi:10.1016/0168-1656(91)90032-Q
Schaepe, S., Kuprijanov, A., Simutis, R., and Lübbert, A. (2014). Avoiding overfeeding in high cell density fed-batch cultures of e. coli during the production of heterologous proteins. J. Biotechnol. 192, 146–153. doi:10.1016/j.jbiotec.2014.09.002
Tamburini, E., Marchetti, M., and Pedrini, P. (2014). Monitoring Key Parameters in Bioprocesses Using Near-Infrared Technology. Sensors 14, 18941–18959. doi:10.3390/s141018941
Xu, B., Jahic, M., and Enfors, S.-O. (1999). Modeling of Overflow Metabolism in Batch and Fed-Batch Cultures of escherichia Coli. Biotechnol. Prog. 15, 81–90. doi:10.1021/bp9801087
CDW cell dry weight [g L−1]
DO dissolved oxygen
DOT dissolved oxygen tension
E. coli Escherichia coli
Freedom EVOware control software for liquid handling station
GUI graphical user interface
gwl-list worklist executed by the liquid handling station
HCD high cell density
HT high throughput
LHS liquid handling station
LiHa liquid handling arm
MSM mineral salt medium
MWP microwell plate
OD optical density
PolyBlock temperature control block for reactor vessels
R reactor
SiLA Standard in Laboratory Automation
STR stirred tank reactors
SQL structured query language
vvm volume of air per operating volume per minute
WinISO control software for cultivation system
μ specific growth rate [h−1].
Keywords: mobile robotic lab assistant, laboratory automation, high throughput, high cell density, bioprocess development, feedback operation
Citation: Kaspersetz L, Waldburger S, Schermeyer M-, Riedel SL, Groß S, Neubauer P and Cruz-Bournazou M- (2022) Automated Bioprocess Feedback Operation in a High-Throughput Facility via the Integration of a Mobile Robotic Lab Assistant. Front. Chem. Eng. 4:812140. doi: 10.3389/fceng.2022.812140
Received: 09 November 2021; Accepted: 23 February 2022;
Published: 07 April 2022.
Edited by:
Juan C. Cruz, University of Los Andes, ColombiaReviewed by:
Helena Junicke, Technical University of Denmark, DenmarkCopyright © 2022 Kaspersetz, Waldburger, Schermeyer, Riedel, Groß, Neubauer and Cruz-Bournazou. This is an open-access article distributed under the terms of the Creative Commons Attribution License (CC BY). The use, distribution or reproduction in other forums is permitted, provided the original author(s) and the copyright owner(s) are credited and that the original publication in this journal is cited, in accordance with accepted academic practice. No use, distribution or reproduction is permitted which does not comply with these terms.
*Correspondence: Lucas Kaspersetz, TC5LYXNwZXJzZXR6QHR1LWJlcmxpbi5kZQ==
Disclaimer: All claims expressed in this article are solely those of the authors and do not necessarily represent those of their affiliated organizations, or those of the publisher, the editors and the reviewers. Any product that may be evaluated in this article or claim that may be made by its manufacturer is not guaranteed or endorsed by the publisher.
Research integrity at Frontiers
Learn more about the work of our research integrity team to safeguard the quality of each article we publish.