
95% of researchers rate our articles as excellent or good
Learn more about the work of our research integrity team to safeguard the quality of each article we publish.
Find out more
ORIGINAL RESEARCH article
Front. Chem. Eng. , 19 October 2022
Sec. Biochemical Engineering
Volume 4 - 2022 | https://doi.org/10.3389/fceng.2022.1035348
This article is part of the Research Topic Saccharomyces cerevisiae as Model Organism for Biochemical Engineering and Bioprocesses View all 5 articles
When confronted with environmental stress, yeast cell reacts, among others, by modifying the expression of specific genes. In this study, gene expression was analyzed via RT-qPCR to quantify the oxidative stress of Saccharomyces pastorianus during yeast propagation as a reaction to different aeration levels. Target genes were identified, and a reference gene system was developed. Fermentation experiments were conducted in shaking flasks, applying different shaking speeds to generate various aeration efficiencies. The cells were sampled at different propagation stages and, additionally to the expression study, analyzed by flow cytometry after staining with dihydroethidium (DHE) to quantify reactive oxygen species (ROS) inside the cells. The results indicate that high oxygen fermentation conditions led to an increased expression of the catalase-A gene CTA1 during propagation. Furthermore, the determination of cell internal ROS shows increasing oxidative stress over the process in accordance with the RT-qPCR measurements.
Saccharomyces pastorianus is a facultative anaerobic organism that can alternate its metabolism between respiration and fermentation. Since the oxidative pathway yields more ATP, this yeast requires the presence of oxygen in the cultivation medium for optimal growth conditions (Alexander & Jeffries, 1990). During multistage metabolic processes, such as respiration, steroidogenesis, and β-oxidation of fatty acids, various partially reduced forms of molecular oxygen are formed as by-products (i.e., hydrogen peroxide, hydroxyl radicals, and superoxide anions) (Jamieson, 1995; Jamieson, 1998). These intermediates are called reactive oxygen species (ROS). ROS can react with various intracellular molecules and affect the whole organism by damaging DNA, lipid structures, and proteins, even triggering apoptosis. (Bayir, 2005; Dickinson & Schweizer, 2005; Perrone et al., 2008). Reactive oxidants can cause damage to DNA and nucleoproteins through base and sugar alterations, the introduction of abasic sites and strand breaks, and DNA-protein cross-links (Moradas-Ferreira et al., 1996). One of the main reactions forming ROS is the iron-catalyzed Haber-Weiss and Fenton reaction, with hydrogen peroxide as a key molecule and the highly reactive hydroxyl radical as a product that can directly interact with DNA (Frankenberg et al., 1993; Baynes & Dominiczak, 2019). High concentrations of hydrogen peroxide lead to lipid peroxidation and affect the structural integrity of membranes by increasing membrane fluidity and shortening fatty acyl chains (Steels et al., 1994). Increased membrane fluidity was shown to correlate with higher stress susceptibility (Ishmayana et al., 2017). ROS, and especially hydroxyl radical exposure, result in huge damage due to reactions with the alpha carbon and the amino acid side chains on the protein side. The radical reaction promotes chain reactions or cleavage of the protein backbone (Toledano et al., 2003). Most ROS are generated in the mitochondrial respiratory chain, where 85%–90% of the available oxygen is consumed (Halliwell & Gutteridge, 2005).
Consequently, aerobically growing brewer’s yeast is permanently exposed to reactive oxygen species (Lushchak & Gospodaryov, 2005). Given the omnipresent character of ROS, yeasts have developed protection for their cellular components against reactive oxidants (Jamieson, 1998). Under normal conditions, there is a balance between reactive oxidants, antioxidant buffering capacity, and defense mechanisms capable of maintaining homeostasis.
The two parts of the cellular reaction to oxidants are primary defense mechanisms that neutralize ROS, while secondary mechanisms repair oxidation damage. In the case of exceeding ROS levels compared to antioxidants, the cell experiences oxidative stress (Moradas-Ferreira et al., 1996). Next to by-products of oxidative phosphorylation, oxidative stress can directly be caused by the take-up of dissolved oxygen (DO) from the medium. Yeast cells deploy different defense mechanisms depending on ROS dose (Temple et al., 2005). Lower amounts of ROS cause adaptation, leading to more robust cells against further oxidative stress (Jamieson, 1992). Significant exposure induces the expression of antioxidants and delays the cell cycle, while even higher concentrations initiate apoptosis in parts of the culture or lead to necrosis (Lee et al., 1996; Perrone et al., 2008). To constantly maintain a low ROS concentration, yeast relies on enzymatic and nonenzymatic antioxidant defense mechanisms. The radical scavenger glutathione is a quintessential member of the nonenzymatic class of antioxidants. The redox-active sulphydryl group of glutathione reacts directly with oxidants and reduces them to less harmful molecules (Moradas-Ferreira et al., 1996). One significant enzymatic way to control the ROS level in the cell utilizes metal-dependent enzymes like catalases. Catalase is an iron-containing enzyme with a haem group in its active site. S. cerevisiae contains two catalases: cytosolic CTT1 and peroxisomal catalase CTA1. Catalase reduces hydrogen peroxide to water and oxygen using a dismutation mechanism (Toledano et al., 2003). Adequate aeration and low ROS concentrations must be balanced for good aerobic growth conditions. Thus, the oxygen supply for yeast propagation is crucial due to the versatile function of oxygen in yeast cell metabolism and its essential role in enhancing unsaturated fatty acids and ergosterol biosynthesis, both vital molecules for cell growth (Verbelen et al., 2009). S. pastorianus, a hybrid of S. cerevisiae and S. eubayanus, is one of the industrially most relevant yeasts (Monerawela & Bond, 2018). Despite this, knowledge about the organism is mainly derived from the apparent similarity to S. cerevisiae. For industrial brewing applications, yeast is cultivated in propagator vessels in preparation for the following beer fermentation. Cell counts increase 10-fold up to 100·106 cells during this aerobic process. This work aims to evaluate the response of S. pastorianus to ROS during brewer’s yeast propagation. The expression of catalases as the primary protection mechanism against hydrogen peroxide was monitored using RT-qPCR measurements. Furthermore, the ROS content was estimated using fluorescence dye as a reference method.
Fermentations were performed with S. pastorianus TUM 34/70 in 500 ml baffled shake flasks at 28°C. The initial filling volume was 40 ml of fresh wort in addition to 10 ml preculture, resulting in an initial cell count of 2.1·107 ± 8.7·106 cells. In the brewing industry, “extract” and “free amino nitrogen (FAN)” are terminologies for carbon and nitrogen sources available for the yeast. The wort used for this study had an extract content of 11.28 ± 0.11 °P, 197.6 ± 3.69 mg/L FAN, and a pH of 5.14 ± 0.036. The hopped wort was provided by an industrial brewery during knockout. Cultures were grown at 100 rpm, 150 rpm, 200 rpm, and 250 rpm shaking speeds for different aeration levels, resulting in kLa values ranging from 51 to 180 h−1. Samples were taken after 0 h, 4 h, 24 h, 48 h, and 72 h. Dissolved Oxygen (DO) in shake flasks was measured with a noninvasive optical sensor (SFR Vario, PreSens Precision Sensing GmbH, Regensburg). The kLa values were calculated using the kLa calculator from PreSens Precision Sensing GmbH, which is intended for combination with the shaker used (PreSens Precision Sensing GmbH, 2022).
Sampling was conducted according to literature (Dragosits et al., 2011). The Monarch Total RNA Miniprep Kit (New England Biolabs, Ipswich, United States) was used for RNA extraction. RNA purity and integrity were controlled by denaturing agarose gel electrophoresis and capillary electrophoresis (Bioanalyzer; Agilent Technologies). The denaturation of 5 µl RNA was carried out using a buffer consisting of 2 µl MOPS ×10 buffer (200 mM MOPS, 50 mM sodium acetate trihydrate, 10 mM EDTA Quantification), 10 µl Dimethylformamid at a temperature of 65°C for 10 min. The electrophoresis was performed at 70 V/cm in ×1 MOPS buffer. Additional quality control was evaluated using spectrophotometry (NanoDrop; Thermo Scientific). The visibility of clear 28S and 18S rRNA bands on the gel was used to indicate minor RNA degradation. Additionally, the RNA integrity number (RIN) was evaluated. cDNA synthesis was conducted according to New England Biolabs (New England Biolabs, Ipswich, United States) first-strand cDNA synthesis protocol (NEB#M0368).
Table 1 shows the primer set for the selected target gene CTA1. According to the literature, possible reference genes were selected from different metabolic pathways, as displayed in Table 2, to minimize possible coregulation [25, 28, 29]. The Saccharomyces genome was taken from the Saccharomyces genome database due to the hybrid genetic character of S. pastorianus (Cherry et al., 2012). Primers were designed using Clone Manager nine software (Sci Ed Software) and synthesized using TIB Molbiol Syntheselabor GmbH (Berlin). Primer efficiencies were determined using a 1:5 cDNA dilution series of five steps (Rasmussen, 2001). A no-template control (NTC) was also measured for each primer pair. All dilutions and NTCs were determined in triplicate. For known pseudogenes, primers were chosen according to the alignment results between genes and pseudogenes. In this direction, the primers were unique to the genes of interest. The secondary structure of the amplicons was analyzed with a Mfold using the criteria −3 < dG.

TABLE 1. The target primer set used for RT-qPCR amplification (Verbelen et al., 2009).
qPCR measurements were conducted in a final volume of 10-μl containing 1 μl of DNA template, 0.4 μl of each respective primer, 5 μl of SybrGreen (Biozym, Germany), and 3.2 μl of RNase-free water.
Gene expression was measured by real-time RT-qPCR, and the expression stabilities were evaluated by the M and V values based on the geNorm algorithm using the software qBase+ (Biogazelle, Gent, Belgium) (Vandesompele et al., 2002). The Cq values from RT-qPCR were imported into qBase Plus software (Biogazelle). Normalized relative quantities were calculated using the modified Pfaffl method with multiple reference genes (Hellemans et al., 2007).
A Cytoflex flow cytometer (Beckman Coulter GmbH, Krefeld) equipped with an argon-ion laser operating at 488 nm was used in the experiments. The cytometer was fitted with four sensors for front and side scatter detection of green (525 nm, channel 1), yellow (585 nm, channel 2), orange (610 nm, channel 3), and red (780 nm, channel 4) fluorescence. The cells harvested simultaneously for PCR analysis were washed three times in a Ringer solution, and the optical density was set to 0.1. The staining of the cells was conducted with dihydroethidium (DHE), according to Landolfo et al. (Landolfo et al., 2008). The fluorescence was detected at 610 nm, and at least 2·105 cells were analyzed in each experiment. Further data analysis and visualization were performed with MATLAB (The MathWorks, Natick, United States). The typical evaluation of flow cytometry data is the calculation of histograms with an event count over logarithmically scaled fluorescence. One significant disadvantage of this technique is the artificial categorization of continuous data. Here, the choice of intervals has a decisive influence on the representation and possible evaluation based on the histograms. A more elegant method is the use of so-called Kernel density estimates. These enable a continuous estimation of an unknown distribution of data points. Calculating the probability density function enables discretization of the data and a more accurate and independent display of the results by creating continuous data. The estimate calculation was based on Eq. 1 shown below, where n = sample size, h = bandwidth, and K = Kernel function. Usually, the first step would be to choose the best fitting Kernel function between Gauß-, rectangular-, triangular-, and Epanechikov-Kernel. In the case of flow cytometry, the vast amount of evaluated data points makes the difference in the resulting estimation negligible. In this study, the Epanechikov-Kernel (Eq. 2) was used. However, the bandwidth choice for the density function distribution calculation makes a significant difference. The larger the bandwidth, the smoother the function, and the poorly represented the actual distribution. Various methods exist for calculating the optimal bandwidth, whereby the method, according to the Eq. 3 by Silverman, is used here (Silverman, 2018). This method is a fast, sufficiently good approximation of the optimal bandwidth and depends on the standard deviation of the data sets and the interquartile range.
x = independent and identically distributed samples, IQR = interquartile range.
DO concentration during yeast propagation in shake flasks was measured using noninvasive optical online sensors. The resulting concentrations for all four tested shaking speeds are shown in Figure 1. During the first hour post-inoculation, the oxygen content of the medium increased rapidly. The maximum of each curve depends on the respective kLa, generated through different shaking speeds. As the duration of the process increases, so do the cell count and the associated oxygen uptake rate. The lower the speed of the shaker, the less the increased oxygen demand of the cultures can be met. A rapid decline to nearly zero was shown after 30 h, especially in the oxygen saturation at 100 rpm shaking speed. The oxygen saturation of the medium was coupled with the shaking speed of the flasks. Therefore, oxygen saturation provided a reasonable basis for the following experiments.
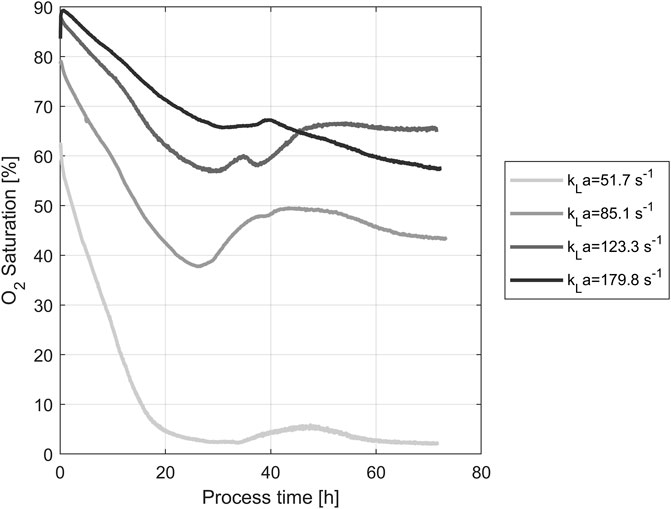
FIGURE 1. O2 Saturations in the medium during yeast propagation. The different shaking speeds correspond to the following kLa values: 100 rpm: 51.7 s−1, 150 rpm: 85.1 s−1, 200 rpm: 123.3 s−1, 250 rpm: 179.8 s−1.
The quality checks performed before gene expression analysis are shown in Figure 2. After extraction, RNA quality was tested using capillary gel electrophoresis (Figure 2A). The formation of two distinct bands (28S and 18S RNA) in the upper part of the gel indicated good RNA quality. Degradation of RNA would come with a significant band at the bottom of the gel and the absence or low intensity of the 28S and 18S bands. The capillary gel electrophoresis shows RIN values between 7.3 and 8.6, indicating reliable RNA quality and minor degradation (Schroeder et al., 2006). This quality is necessary for the following experiments. After testing the integrity of the RNA, all primers were tested by checking the specific primer bonding using agarose gel electrophoresis of the resulting amplicons. A representative gel of the primers tested is shown in Figure 2B. There was just one band indicating one size of amplicons per primer pair and a lack of bands for the NTC. As the last step, the amplicons were checked by melting curve analysis. The melting curve peaks are characteristic of a particular PCR product. The melting curve analysis served as a qualitative evaluation of the PCR product. The curve helps to compare and differentiate different PCR products concerning their melting behavior. All curves had a unimodal distribution proving specific primer binding to the target gene (Figure 2C) (Ririe et al., 1997).
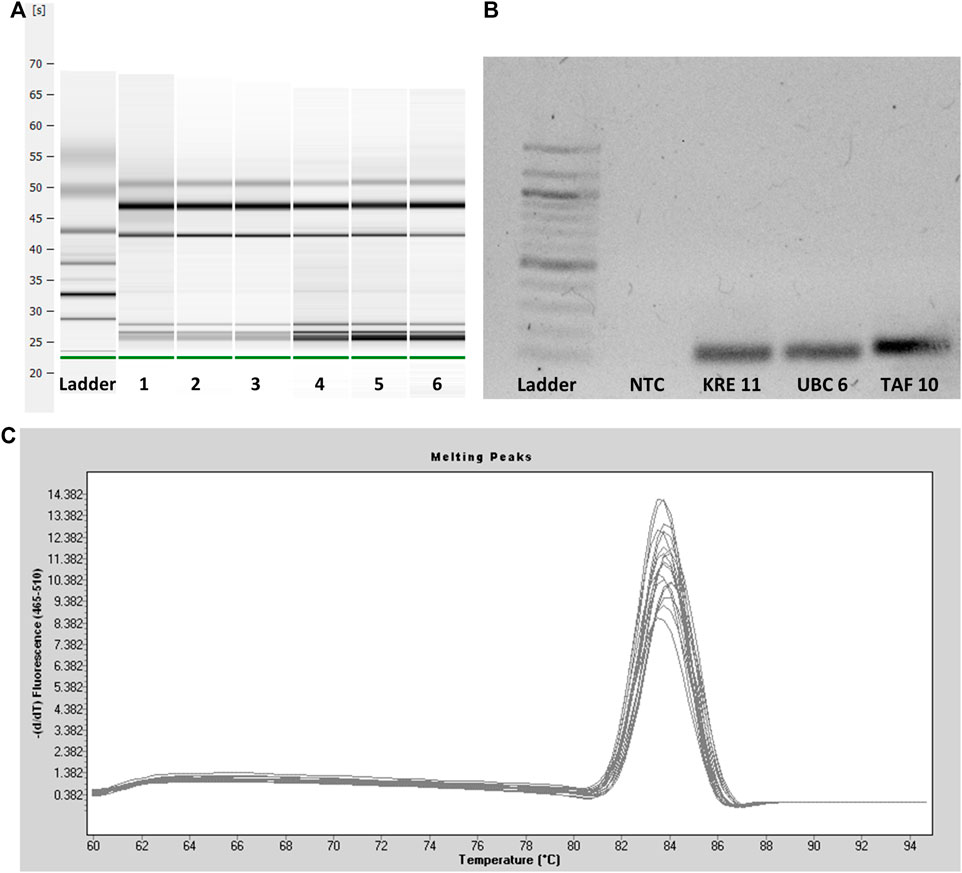
FIGURE 2. (A) Capillary gel electrophoresis of six representative RNA samples. The leftmost sample shows the ladder. Two distinct bands (28S and 18S RNA) indicate intact RNA samples and good RNA quality after extraction. (B) Agarose gel electrophoresis of three representative primers and one no-template control with a 100 bp ladder leftmost. One single DNA band indicates specific primer bonding and the suitability of the primers. (C) Melting curve analysis of the PCR amplicons.
The amplification efficiencies (E) for the eight candidate reference genes ranged from 1.75 to 2.36, and standard errors (SD) were between 0.027 and 0.170 (Table 3). Agarose gel electrophoresis of all reference gene amplicons showed one single band, and the additional melting curve analysis revealed the presence of a single peak, indicating the specificity of the primers used. No signal was detected in the negative controls for all eight reference genes.
The built-in geNorm algorithm of qBase Plus was used to calculate the M and V values and to evaluate the average expression stability of the reference genes. The M value is a measure used to determine the expression stability of control genes based on non-normalized expression levels. Unlike ideal reference genes, real genes are not consistently expressed under all experimental conditions. Variations in expression ratios indicate unstable expression of reference gene candidates. The M value defines the expression stability of all reference genes based on the geometric averaging of multiple logarithmically transformed reference genes and their standard deviations during pairwise variation. In this method, the lowest M value correlates with the highest stability. Since the reference selection is based on non-coregulated genes, stepwise exclusion of the most unstable gene results in two reference genes with the most stable expression. Stably expressed reference genes show M values lower than 0.5 for homogeneous samples. The last three tested reference gene candidates met these criteria (Vandesompele et al., 2002).
Normalization by multiple reference genes is required to increase measurement stability under different experimental conditions. The best reference gene combination always compromises accuracy and practical considerations. The pairwise variation is calculated between the two consecutive normalization factors NFn and NFn+1 to assess whether the inclusion of more genes is helpful for normalization. Reference genes are added until the (n+1)th gene has no significant effect on the recalculated normalization factor. The value of V3/4, displayed in Figure 3, is already under the threshold of 0.15 suggested by Vandesompele et al., below which the inclusion of additional reference genes is not required (Vandesompele et al., 2002). In the shown case, the inclusion of a fourth reference gene had no significant effect on normalization. Together with the M values shown in Figure 4, the resulting reference gene system for the following gene expression experiments consists of the genes KRE11, UBC6, and TAF10. Both quality criteria, the M value, and the V value, are below the minima suggested by literature (Vandesompele et al., 2002), rendering the developed reference gene system suitable for the following analysis.
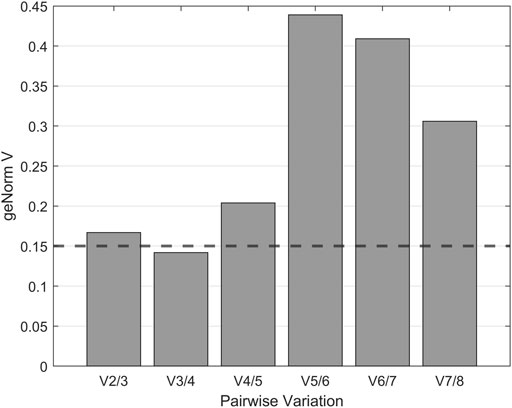
FIGURE 3. geNorm V analysis for optimal reference gene number determination. Pairwise variation was used to determine the minimum number of reference genes for normalization. According to Vandesompele et al. (2002) variations below the cut-off value of 0.15, displayed as a dashed horizontal line, indicate no significant contribution of an additional control gene to the normalization factor.
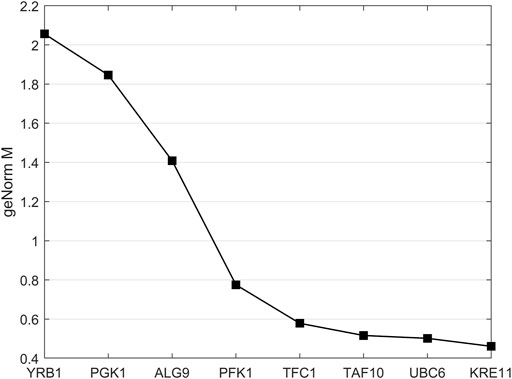
FIGURE 4. geNorm M analysis for analysis of reference gene stability. More stably expressed genes were positioned on the right side of the diagram and less stably expressed on the left side. Reference genes with mean stability values below 0.5 are considered to be stably expressed.
The results of the CTA1 gene expression analysis for four different kLa over the experimental time of 72 h relative to the developed reference gene system are shown in Figure 5: Relative expression of CTA1 gene during yeast propagation in shake flasks, including the 95% confidence interval. The data show increased expression of the CTA1 gene after 48 h. For the first 24 h, there was a low expression for all tested samples and shaking speeds. Since the preculture was treated the same way for every sample, the 0- and 4-h samples were expected to be analogous. The 48-h samples showed a two- to 3-fold increase in expression compared to the 0-h sample. After 72 h, the 100 rpm sample had an even higher expression. The CTA1 gene tested in this experiment was responsible for the catalase production of the cell. This metal-dependent enzyme is part of the primary defense mechanisms against ROS. Catalase reduces the hydrogen peroxide content in the cell by reducing it using the dismutase mechanism (Toledano et al., 2003). Hydrogen peroxide is a product of oxygen reduction built as a by-product of cellular respiration. It enables the formation of other radicals in cells and is an essential part of reactive oxygen species. Due to the relationship between catalase and ROS, CTA1 expression should directly correlate with oxidative stress in the cell. Overall, there seems to be a trend in increasing CTA1 expression after 48 h, although there was no significant difference between the samples under different experimental conditions.
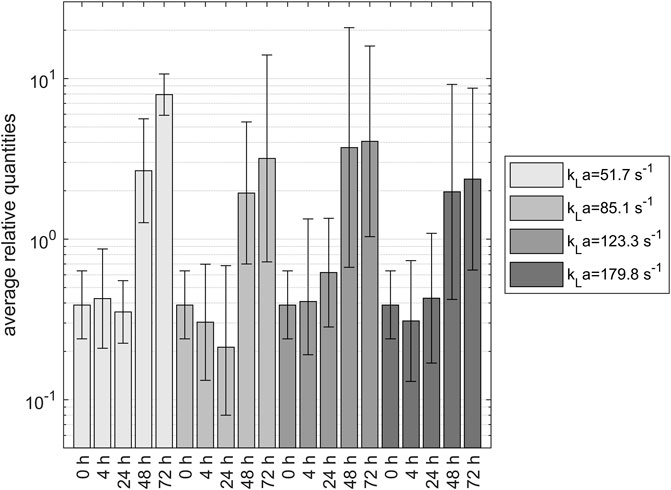
FIGURE 5. Relative expression of CTA1 gene during yeast propagation in shake flasks, including the 95% confidence interval. The data show increased expression of the CTA1 gene after 48 h.
Applying the equations described in 2.3 to the flow cytometry data results in the graphs shown in Figure 6. It shows the triplicate samples of the 200 rpm experiment over time. The 200 rpm samples were chosen because of their representative character for the other experiments that showed similar results. Dihydroethidium is oxidized in the cell by ROS superoxide and hydrogen peroxide. As a result, fluorescence can be measured at 610 nm. Fluorescence correlates directly with the amount of ROS in the cell. At the beginning of each experiment, the main portion of the investigated cells had a fluorescence below 104 procedure-defined units (p.d.u.). After 4 h, a trimodal distribution formed with peaks at 105 p.d.u. and approximately 5·106 p.d.u. After 24 h, there was a huge shift toward a fluorescence of 106. After 48 h, the fluorescence decreased again below 106. After 72 h, the fluorescence was still decreasing.
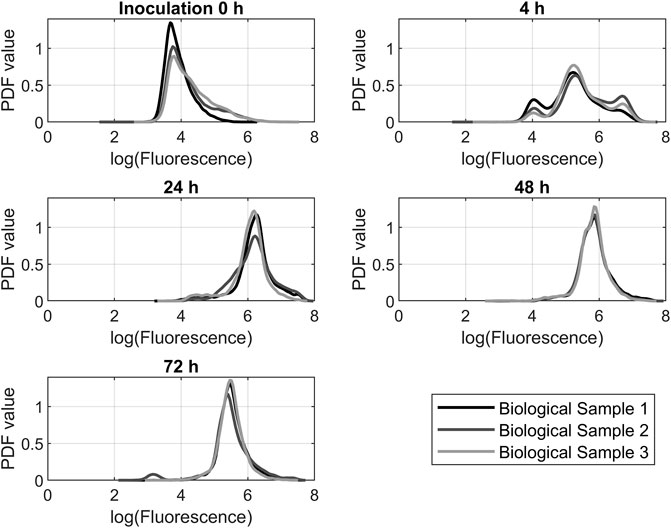
FIGURE 6. Probability density function (PDF) of dihydroethidium fluorescence data from flow cytometry measurements. The data from the 200 rpm propagations was representative of the other experiments.
The logarithmic fluorescence of DHE for the 24-h samples of all tested shaking speeds is shown in Figure 7. The displayed samples are representative selections. The first measurement after inoculation was added as a comparative value with the fluorescence of approximately 104 p.d.u. The prominent peaks of the resulting graphs are around a value of 106 p.d.u. The 150 rpm and 200 rpm graphs had a unimodal distribution. At 100 rpm and 250 rpm, there was a bimodal distribution. For 100 rpm and 250 rpm, the distribution has a portion of cells with a fluorescence of 104 p.d.u., which is the reference value of the 0-h sample. This suggests that this portion of the cells did not react with the dye and could be excluded from further analysis. In this case, the remaining.
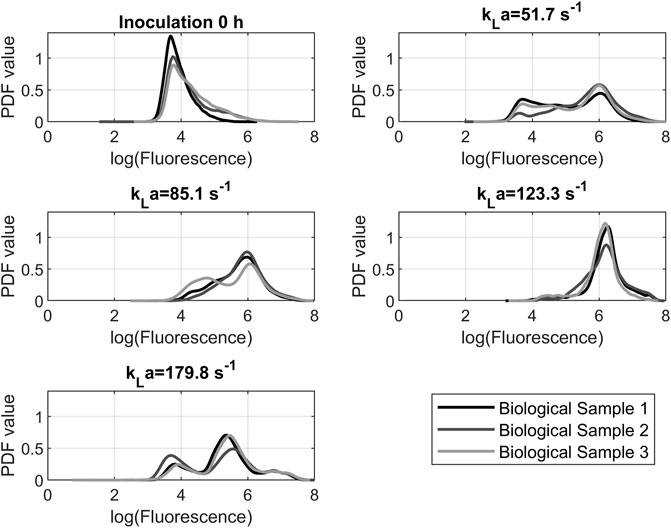
FIGURE 7. Probability density function of dihydroethidium fluorescence data from cytometry measurements after 24 h. The peak location indicates the probability that a cell will fluoresce at a certain level. The course of the graph indicates the distribution of fluorescence in the cell population.
Saccharomyces is one of the most important industrially used yeasts and therefore needs to be supplied in a sufficient quantity and vitality. One of the key factors to efficient yeast propagation is oxygen supply to avoid growth limitations. Brewer´s yeast S. pastorianus is a genetic hybrid of S. cerevisiae and S. eubayanus that shows high phenotypic and genomic similarities to S. cerevisiae and is highly relevant to industrial beer production. The presented study investigated the effect of aeration levels on oxidative stress response during the propagation of brewing yeast. For that purpose, a reference gene system for RT-qPCR analysis of S. pastorianus was developed: primers for an array of potential reference genes were screened for amplification efficiency and target expression stability under different aeration conditions. mRNA was successfully extracted from the cells and the subsequent quality check using capillary gel electrophoresis showed two distinct bands of 28S and 18S RNA and the absence of a strong lower band. The resulting bands indicate minor degradation of the extracted RNA. Additionally, capillary gel electrophoresis was utilized to determine the quality of the RNA. RIN values between 7.3 and 8.6 indicate suitable RNA quality for the following steps. Agarose gel electrophoresis was used to test specific primer bonding. The absence of multiple bands and a negative NTC prove the reliability of the synthesized cDNA. The unimodal form of the melting curves also indicates the specific primer bonding. The reference gene system was developed by using the geNorm algorithm. In a first step, all potential reference genes were sorted by stability calculating the geNorm M value. In a second step, the geNorm V value calculates the optimal number of reference genes. The three most stably expressed genes were successfully utilized as reference for the transcription analysis of the CTA1 target gene in yeast samples propagated in lager beer wort. The CTA1 gene, coding for the enzyme catalase, that plays a major role in ROS degradation, was used to indicate oxidative stress in S. pastorianus cells under different aeration conditions. Intracellular reactive oxygen species were measured using flow cytometry with dihydroethidium staining. The resulting fluorescence at 610 nm correlates directly with the amount of ROS in the cells. In conjunction with the CTA1 transcription analysis, this measurement enabled a time-resolved insight into the build-up of oxidative stress and the cellular stress response. Comparing the results from the expression analysis with the results of the ROS determination, the ROS build-up took 24 h. The expression of CTA1 as a reaction of the cell to the increasing ROS content increased after 48 h. The higher CTA1 expression might be a reason for the decreasing ROS content, since catalase catalyzed ROS degradation; the genes expression appears to follow the increasing ROS content of the cell in a delayed fashion. Cells cultivated under low aerobic conditions showed a similar fluorescence behavior as those cultivated under the higher aeration efficiencies. Contrary to intuitive assumptions, the ROS built up independently of the shaking speed for the investigated conditions. This phenomenon follows the results of the gene expression analysis. In these experiments, increased CTA1 expression was shown after 48 h. The expression, however, like the fluorescence values, was independent of the cultivation conditions. The presented data of gene expression analysis as an indicator for the cellular defence reaction of Saccharomyces yeast to higher aeration rates in combination with flow cytometry analysis as an indicator for the overall cell reaction can give useful information for later applications. An overall similar trend emerges between different samples propagated at different kLa values. This indicates that the aeration efficiency in the tested range does not provoke a cellular reaction. The tested oxygen supply conditions cover kLa values of industrial relevance; therefore, these results indicate the possible usage of higher oxygen concentrations in industrial yeast propagation. With this data, the study lays the foundation for further investigation and optimization of industrially relevant yeast propagation processes on a molecular level.
The original contributions presented in the study are included in the article/supplementary material, further inquiries can be directed to the corresponding authors.
AB. Data collection and drafted the article, Conception or design of the work KB. Conception or design of the work DG. Critical revision of the article TB. Final approval of the version to be published.
This Project (ZF4025035SK9) was part of the “ZIM” (Zentrales Innovationsprogramm Mittelstand) funding program and supported by the Federal Ministry for Economic Affairs and Climate Action (BMWK) on the basis of a decision by the German Bundestag.
The authors declare that the research was conducted in the absence of any commercial or financial relationships that could be construed as a potential conflict of interest.
All claims expressed in this article are solely those of the authors and do not necessarily represent those of their affiliated organizations, or those of the publisher, the editors and the reviewers. Any product that may be evaluated in this article, or claim that may be made by its manufacturer, is not guaranteed or endorsed by the publisher.
Alexander, M. A., and Jeffries, T. W. (1990). Respiratory efficiency and metabolite partitioning as regulatory phenomena in yeasts. Enzyme Microb. Technol. 12 (1), 2–19. doi:10.1016/0141-0229(90)90173-N
Bayir, H. (2005). Reactive oxygen species. Crit. Care Med. 33 (12 Suppl. l), S498–S501. doi:10.1097/01.CCM.0000186787.64500.12
Baynes, J. W., and Dominiczak, M. H. (2019). Medical biochemistry. 5th edition. Amsterdam, Netherlands: Elsevier. Available at: https://ebookcentral.proquest.com/lib/kxp/detail.action?docID=5493083.
Cherry, J. M., Hong, E. L., Amundsen, C., Balakrishnan, R., Binkley, G., Chan, E. T., et al. (2012). Saccharomyces Genome Database: The genomics resource of budding yeast. Nucleic Acids Res. 40, D700–D705. doi:10.1093/nar/gkr1029
Dragosits, M., Mattanovich, D., and Gasser, B. (2011). Induction and measurement of UPR and osmotic stress in the yeast Pichia pastoris. Methods Enzymol. 489, 165–188. doi:10.1016/B978-0-12-385116-1.00010-8
Frankenberg, D., Frankenberg-Schwager, M., and Harbich, R. (1993). Mechanisms of oxygen radiosensitization in irradiated yeast. I. Dna double-strand breakage. Int. J. Radiat. Biol. 64 (5), 511–521. doi:10.1080/09553009314551721
Halliwell, B., and Gutteridge, J. M. C. (2005). Free radicals in biology and medicine. Oxford, UK: Oxford science publications. Oxford Univ. Press, 3.
Hellemans, J., Mortier, G., Paepe, A. de, Speleman, F., and Vandesompele, J. (2007). Qbase relative quantification framework and software for management and automated analysis of real-time quantitative PCR data. Genome Biol. 8 (2), R19. doi:10.1186/gb-2007-8-2-r19
Ishmayana, S., Kennedy, U. J., and Learmonth, R. P. (2017). Further investigation of relationships between membrane fluidity and ethanol tolerance in Saccharomyces cerevisiae. World J. Microbiol. Biotechnol. 33 (12), 218. doi:10.1007/s11274-017-2380-9
Jamieson, D. J. (1998). Oxidative stress responses of the yeast Saccharomyces cerevisiae. Yeast 14 (16), 1511–1527. doi:10.1002/(SICI)1097-0061.14:16<1511::AID-YEA356>3.0.CO;2-S
Jamieson, D. J. (1992). Saccharomyces cerevisiae has distinct adaptive responses to both hydrogen peroxide and menadione. J. Bacteriol. 174 (20), 6678–6681. doi:10.1128/jb.174.20.6678-6681.1992
Jamieson, D. J. (1995). The effect of oxidative stress on Saccharomyces cerevisiae. Redox Rep. 1 (2), 89–95. doi:10.1080/13510002.1995.11746964
J. R. Dickinson, and M. Schweizer (Editors) (2005). The metabolism and molecular physiology of Saccharomyces cerevisiae. Second edition (Boca Raton, Florida: CRC Press). Available at: https://ebookcentral.proquest.com/lib/kxp/detail.action?docID=5850754.
Landolfo, S., Politi, H., Angelozzi, D., and Mannazzu, I. (2008). Ros accumulation and oxidative damage to cell structures in Saccharomyces cerevisiae wine strains during fermentation of high-sugar-containing medium. Biochimica Biophysica Acta - General Subj. 1780 (6), 892–898. doi:10.1016/j.bbagen.2008.03.008
Lee, J., Romeo, A., and Kosman, D. J. (1996). Transcriptional remodeling and G1 arrest in dioxygen stress in Saccharomyces cerevisiae. J. Biol. Chem. 271 (40), 24885–24893. doi:10.1074/jbc.271.40.24885
Lushchak, V. I., and Gospodaryov, D. V. (2005). Catalases protect cellular proteins from oxidative modification in. Cell Biol. Int. 29 (3), 187–192. doi:10.1016/j.cellbi.2004.11.001
Monerawela, C., and Bond, U. (2018). The hybrid genomes of Saccharomyces pastorianus: A current perspective. Yeast (Chichester, Engl. 35 (1), 39–50. doi:10.1002/yea.3250
Moradas-Ferreira, P., Costa, V., Piper, P., and Mager, W. (1996). The molecular defences against reactive oxygen species in yeast. Mol. Microbiol. 19 (4), 651–658. doi:10.1046/j.1365-2958.1996.403940.x
Perrone, G. G., Tan, S.-X., and Dawes, I. W. (2008). Reactive oxygen species and yeast apoptosis. Biochimica Biophysica Acta - Mol. Cell Res. 1783 (7), 1354–1368. doi:10.1016/j.bbamcr.2008.01.023
PreSens Precision Sensing GmbH, (2022). kla-calculator. Available at: https://www.presens.de/support-services/kla-calculator.
Rasmussen, R. (2001). “Quantification on the LightCycler,” in Rapid cycle real-time PCR. Editors S. Meuer, C. Wittwer, and K.-I. Nakagawara (Springer Berlin Heidelberg), 21–34. doi:10.1007/978-3-642-59524-0_3
Ririe, K. M., Rasmussen, R. P., and Wittwer, C. T. (1997). Product differentiation by analysis of DNA melting curves during the polymerase chain reaction. Anal. Biochem. 245 (2), 154–160. doi:10.1006/abio.1996.9916
Schroeder, A., Mueller, O., Stocker, S., Salowsky, R., Leiber, M., Gassmann, M., et al. (2006). The RIN: An RNA integrity number for assigning integrity values to RNA measurements. BMC Mol. Biol. 7, 3. doi:10.1186/1471-2199-7-3
Silverman, B. W. (2018). Density estimation for statistics and data analysis. Chapman Hall/CRC Monogr. Statistics Appl. Probab. 26 Routledge. Available at: https://ebookcentral.proquest.com/lib/kxp/detail.action?docID=5475481.
Steels, E. L., Learmonth, R. P., and Watson, K. (1994). Stress tolerance and membrane lipid unsaturation in Saccharomyces cerevisiae grown aerobically or anaerobically. Microbiology 140 (Pt 3), 569–576. doi:10.1099/00221287-140-3-569
Temple, M. D., Perrone, G. G., and Dawes, I. W. (2005). Complex cellular responses to reactive oxygen species. Trends Cell Biol. 15 (6), 319–326. doi:10.1016/j.tcb.2005.04.003
Toledano, M. B., Delaunay, A., Biteau, B., Spector, D., and Azevedo, D. (2003). “Oxidative stress responses in yeast,” in Topics in current genetics. Yeast stress responses. Editors S. Hohmann, and W. H. Mager (Springer Berlin Heidelberg), 1, 241–303. doi:10.1007/3-540-45611-2_6
Vandesompele, J., Preter, K. de, Pattyn, F., Poppe, B., Roy, N., Paepe, A. de, et al. (2002). Accurate normalization of real-time quantitative RT-PCR data by geometric averaging of multiple internal control genes. Genome Biol. 3, RESEARCH0034.1. doi:10.1186/gb-2002-3-7-research0034
Keywords: aeration, flow cytometry, oxidative stress, yeast propagation, reactive oxygen (ROS), qPCR, Saccharomyces
Citation: Beugholt A, Büchner K, Geier DU and Becker T (2022) Quantification of oxidative stress in Saccharomyces pastorianus propagation: Gene expression analysis using quantitative reverse transcription polymerase chain reaction and flow cytometry. Front. Chem. Eng. 4:1035348. doi: 10.3389/fceng.2022.1035348
Received: 02 September 2022; Accepted: 03 October 2022;
Published: 19 October 2022.
Edited by:
Vasudeo Zambare, University of Technology Malaysia, MalaysiaReviewed by:
Luis H. Reyes, University of Los Andes, Colombia, ColombiaCopyright © 2022 Beugholt, Büchner, Geier and Becker. This is an open-access article distributed under the terms of the Creative Commons Attribution License (CC BY). The use, distribution or reproduction in other forums is permitted, provided the original author(s) and the copyright owner(s) are credited and that the original publication in this journal is cited, in accordance with accepted academic practice. No use, distribution or reproduction is permitted which does not comply with these terms.
*Correspondence: Dominik Ulrich Geier, RG9taW5pay5nZWllckB0dW0uZGU=
Disclaimer: All claims expressed in this article are solely those of the authors and do not necessarily represent those of their affiliated organizations, or those of the publisher, the editors and the reviewers. Any product that may be evaluated in this article or claim that may be made by its manufacturer is not guaranteed or endorsed by the publisher.
Research integrity at Frontiers

Learn more about the work of our research integrity team to safeguard the quality of each article we publish.