 Barbara Thijs
 Lucas Hanssens
 Gino Heremans
95% of researchers rate our articles as excellent or good
Learn more about the work of our research integrity team to safeguard the quality of each article we publish.
Find out more
ORIGINAL RESEARCH article
Front. Chem. Eng. , 09 November 2022
Sec. Electrochemical Engineering
Volume 4 - 2022 | https://doi.org/10.3389/fceng.2022.1028811
This article is part of the Research Topic Up-Scaling Emerging Electrochemical Processes: Recent Lessons from Reactor Design, Characterization and Modelling View all 5 articles
A three compartment solar formic acid generator was built using a Sn on Cu foam cathode and NiFe anode. A bipolar combination of a Fumasep FAD-PET-75 and Nafion 117 membrane was mounted between anode and middle compartment, which was filled with Amberlyst 15H ion exchanger beads. A Fumasep FAD-PET-75 membrane separated the middle compartment from the cathode. The generator was powered with a photovoltaic panel and fed with gaseous CO2 and water. Diluted formic acid solution was produced by flowing water through the middle compartment. Common PV-EC devices are operated using aqueous electrolyte and produce aqueous formate. In our PV-EC device, formic acid is produced straight away, avoiding the need for downstream operations to convert formate to formic acid. The electrolyser was matched with solar photovoltaic cells achieving a coupling efficiency as high as 95%. Our device produces formic acid at a faradaic efficiency of ca. 31% and solar-to-formic acid efficiency of ca. 2%. By producing formic acid from CO2 and water without any need of additional chemicals this electrolyser concept is attractive for use at remote locations with abundant solar energy. Formic acid serves as a liquid renewable fuel or chemical building block.
Formic acid is a carboxylic acid with a global market of ca. 750,000 tonnes in 2020, growing annually by ca. 4.5%. (Global Formic Acid Market Report, 2022) Besides its traditional large-scale industrial production from CO from fossil carbon, new synthesis pathways are being developed to produce it from CO2 in the context of carbon capture and utilization (CCU). One of these pathways is electrolysis in which formic acid is produced from CO2 and H2O (CO2 + H2O → ½ O2 + HCOOH).
Electrolysis requires electrical power, which can be provided by the grid or directly from a renewable power source such as solar photovoltaics or wind turbines. The technological targets of electrolyser design are dependent on the situation. Grid-connection can ensure continuous operation. The technological targets of electrolyser design for this application are obtaining high current densities, high CO2 and electric power utilization efficiencies and long-term stability. Gas diffusion electrode (GDE)-type electrodes, (Higgins et al., 2019; Song et al., 2019), gas-trapping strategies, (García de Arquer et al., 2020; Khan et al., 2021a; Yue et al., 2021), nanostructured electrocatalysts (Li et al., 2018) and bipolar membrane designs (Pătru et al., 2019) are strategies to achieve these goals. As the grid becomes more and more dependent on solar and wind energy, grid-connected electrolysers can also be a tool to buffer peaks and valleys in the energy supply. Although batteries and hydrogen electrolysers are a more obvious choice for this grid buffering application, CO2 electrolysers have also been proposed (Centi et al., 2013; Lu and Jiao, 2016). CO2 reduction products like formic acid are generally more energy-dense, safer and easier to store than hydrogen and, different from batteries, they can be used as seasonal buffers. CO2 recovery and reuse in the reconversion of stored formic acid to electricity in a period of high electrical demand is essential to close the carbon cycle. Targets in formic acid electrolyser development for this grid buffering application include a high flexibility to accommodate a fluctuating power input. This is achieved by for example operating at ambient temperature and pressure and making the system modular. In another scenario, electrolysers can directly be coupled to a renewable power source such as solar PV panels (“PV-EC”). Energy losses by the Balance Of System are minimal and the current of the electrolyser can be matched to that of the solar PV cells, optimising in this way the solar-to-product efficiency like with solar hydrogen generators (Heremans et al., 2017). PV-EC devices are attractive for solar farms at remote locations. Formic acid is a candidate vector for transportation of the solar energy. Other candidates are hydrogen, ammonia, methane and methanol, each with their benefits and downsides (Thijs et al., 2021). Important benefits of formic acid are its transportability and high volumetric energy density compared to gaseous products. A complexity to consider is that CO2 needs to be supplied to the remote location or generated in situ through for example direct air carbon capture (DACC). While DACC is interesting as a way to reduce the atmospheric CO2 concentration, it requires a substantial amount of additional energy in the range of 1.4–2.8 kWh/kg CO2 [International Energy Agency (IEA), 2021]. Combining CO2 capture and reduction into one device could reduce this energy demand, but this technology is still in an early phase (Kar et al., 2019; Sullivan et al., 2021). When developing PV-EC devices, the target is obtaining a high solar-to-product efficiency. This implies that the electrolyser should have a high energy efficiency and should operate close to the maximum power point of the PV cells it is connected to. Two approaches can be followed for achieving efficient connection. A large area of PV cells can be coupled to a small electrolyser such that it operates at a high current density. Highly active electrodes and low ohmic losses are needed for this approach and measures need to be taken to ensure that CO2 is supplied to the active sites quickly. An alternative approach is to couple PV cells and an electrolyser of a similar size. Without solar concentration, PV cells deliver current densities in the range of a few mA/cm2. At these low current densities, CO2 supply to the cathode’s active sites does not pose an issue and ohmic losses are low, which benefits the energy efficiency. Because the electrolyser is then large in size, its components such as the electrodes should be low cost. Important for this application is also the quality of the formic acid product. With different electrolysers, the product ranges from dilute aqueous potassium formate to high-concentration formic acid. To store and transport energy, the latter formulation is preferred. Formic acid and formate electrolyser concepts are shown in Figure 1. In a formate electrolyser (Figures 1A,B), CO2 is converted at the cathode and a base, typically KOH, is converted at the anode. CO2 and KOH are consumed to produce oxygen gas and potassium formate. There is a fundamental disadvantage to this, which is that downstream operations such as electrodialysis are needed to convert formate to formic acid and recover KOH. This complication lowers the overall process efficiency. Formic acid electrolysers (Figures 1C,D) directly produce formic acid from CO2 and H2O. Three compartment electrolysers (Figure 1D) are currently one of the most advanced designs, performing exceptionally well in terms of activity, selectivity and stability. In literature, three compartment electrolysers have been described with partial current densities up to 450 mA/cm2 and stabilities of over 1,000 h, producing aqueous formic acid at a concentration exceeding 11 wt%. (Fan et al., 2020; Yang et al., 2020). They outperform designs like zero-gap electrolysers (Figure 1C) (Lee et al., 2015).
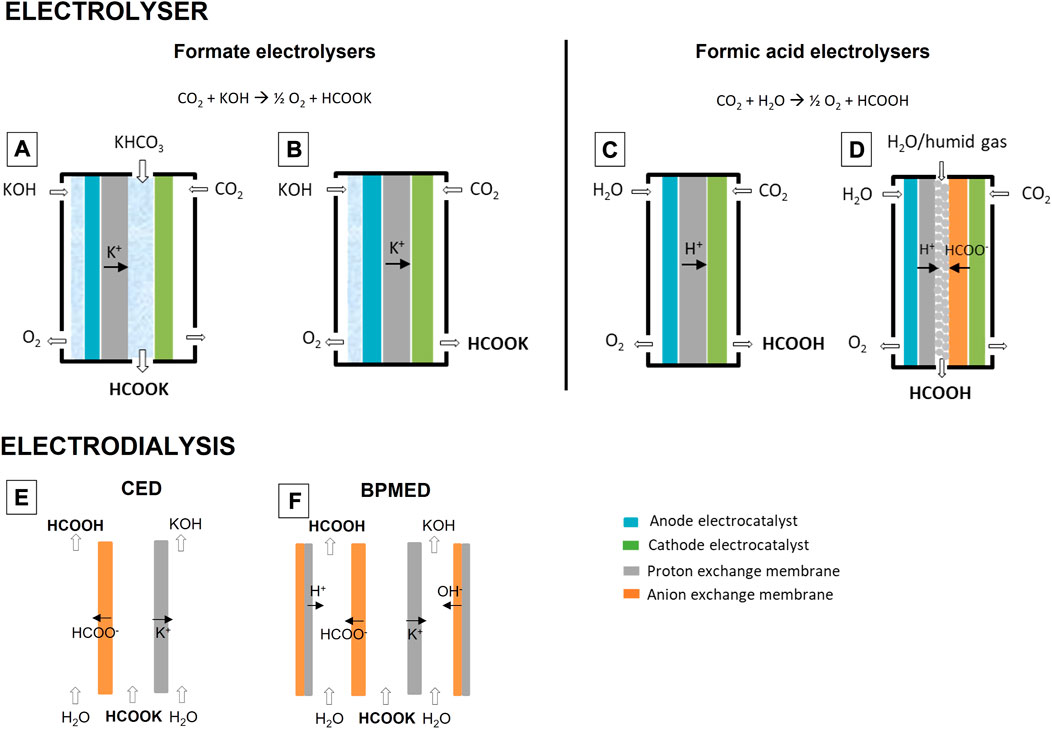
FIGURE 1. Electrolyser types to produce aqueous potassium formate (A,B) and formic acid (C,D). Two types of electrodialysis are also shown: conventional electrodialysis [“CED”, (E)] and bipolar membrane electrodialysis [“BPMED”, (F)].
Here we report on a PV-EC device consisting of a three compartment electrolyser coupled with c-Si PV cells of similar-size. State-of-the-art three compartment electrolyser design is combined with a low cost anode and cathode electrode and commercially available solid electrolytes. The performance of the electrolyser is analysed in conditions relevant to direct PV coupling and current matching is done, maximising the solar-to-formic acid efficiency. Based on an analysis of the different components of the cell overpotential suggestions are made for further improvements.
Electrochemical reduction of CO2 to formate/formic acid is catalysed by metals like Sn, Bi, Pd, and Pb and their performance is enhanced through alloying, nanostructuring, exposing specific crystal facets and modifying the oxidation state. (Lu et al., 2014; Qiao et al., 2014; Du et al., 2017; Kumawat and Sarkar, 2017; Lee et al., 2020) Sn catalysts are known to combine a decent stability with a high selectivity in a broad range of electric potentials. Among the candidate metals, Sn is also one of the cheapest.
A Sn on Cu cathode was synthesised by electroplating Sn onto a porous Cu foam substrate. A copper support was selected for its high electric conductivity of 56 MS/m and convenience for use at large sizes. Cu foam is also flexible and not prone to crack, which is a common issue with e.g., carbon paper substrates. It has also been shown that a Sn film on Cu performs as well if not better as compared to pure Sn, which is attributed to Cu influencing the surface oxidation state of Sn. (He et al., 2017; Morimoto et al., 2018) The constant current electrodeposition method used to deposit Sn onto Cu foam has been demonstrated by Wang et al. (2016) Characterisation with SEM-EDX reveals homogeneous, full coverage of the Cu foam with Sn particles (<10 µm) (Supplementary Figure S1). The electrode was evaluated in a three-electrode H-cell setup. The catholyte was 0.5 M KHCO3 purged with CO2 having a pH of 7.3. The selectivity of the electrochemical reduction reaction was determined with chronoamperometry at potentials in the range of −0.6 and −1.0 V versus RHE (Figure 2). In between each measurement, the catholyte was replaced with fresh CO2-saturated KHCO3. Product samples were taken after 30 min. The formate content was determined via ion chromatography. The overpotential for formate formation at a formate partial current density of 10 mA/cm2 was ca. 0.52 V (−0.7 V vs. RHE). At an overpotential of 0.70 V (−0.9 V vs. RHE), the Sn/Cu electrode had a formate selectivity of over 65% and formate partial current density of ca. 70 mA/cm2. Hydrogen gas was the dominant by-product (Supplementary Figure S2). Note that the current density was normalised to the geometric area of one side of the electrode, so this value for current density is high in comparison to literature sources that are often either normalised to the electrochemically active surface area or the real active surface area. (Zheng et al., 2020) The Cu foam itself had a faradaic efficiency for formate of below 17% in the potential range from −0.6 to −1.0 V vs. RHE (Figure 2), revealing that Sn added substantially to the selectivity. Comparison of the performance of our electrode with literature data (Supplementary Figure S3) revealed a moderate faradaic efficiency. For practical reasons we opted for a robust electrode to perform the demonstration. The cathode might be further improved by reducing the thickness of the Sn layer or by co-depositing Sn and Cu from a mixed CuCl2-SnCl2 solution. Zhao and Wang. (2016) observed a substantial influence of the thicknesses of the Sn film on Cu, and He et al. (2017) showed that a Cu0.2Sn0.8 alloy performs better than pure Sn.
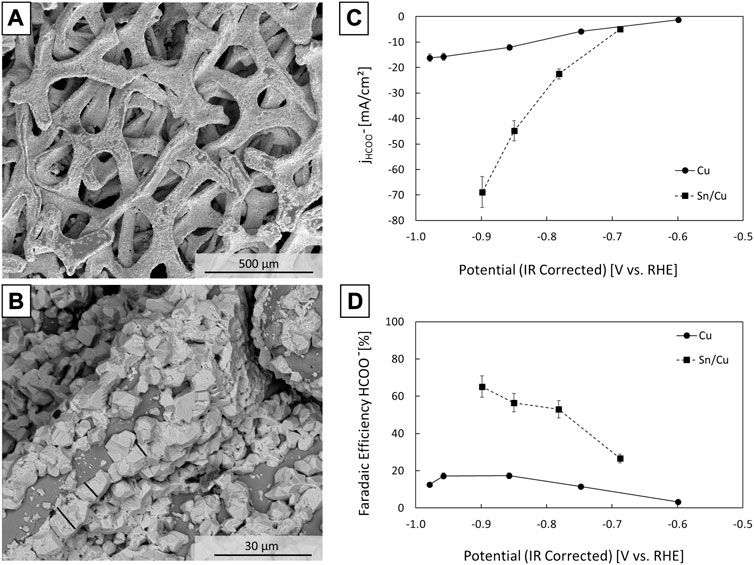
FIGURE 2. SEM images of the Sn/Cu cathode electrocatalyst (A,B), partial current densities (C) and formate faradaic efficiencies (D) against the IR corrected reduction potential in a H-cell setup with CO2 saturated 0.5 M KHCO3 catholyte. Formate was quantified via ion chromatography by sampling at the end of a 30 min measurement. The error bars correspond to the standard deviation on the ion chromatography measurements.
At the anode, two types of electrocatalysts were used: an IrO2/C nanoparticle catalyst and a NiFe catalyst. From the field of PEM electrolysis, it is known that IrO2 is one of the few oxygen evolution reaction (OER) catalysts with high activity and stability in acidic media. The IrO2/C catalyst was synthesised by dropcasting an electrocatalyst ink containing IrO2 nanoparticles, Nafion ionomer and isopropanol onto Toray carbon paper. The loading was ca. 2 mg IrO2/cm2. In a three-electrode setup with 0.5 M H2SO4 electrolyte saturated with O2, IrO2/C showed a high activity (Supplementary Figure S4). The overpotential for the OER was ca. 0.30 V at a current density of 10 mA/cm2. This is comparable to literature, reporting overpotentials of IrO2 nanoparticle catalysts at 10 mA/cm2 of 0.29–0.33 V (Li et al., 2022). NiFe was used as an Earth-abundant alternative to IrO2. The NiFe catalyst was synthesised by electroplating Ni and Fe from a Ni-Fe solution onto a porous Ni foam substrate, according to a procedure described in literature. (Solmaz and Kardaş, 2009; McCrory et al., 2015). In a three-electrode setup with 1 M KOH electrolyte saturated with O2 the overpotential for the OER was ca. 0.27 V at a current density of 10 mA/cm2 (Supplementary Figure S4). In liquid electrolyte, NiFe showed slightly higher activity than IrO2/C.
Literature sources of three compartment electrolysers use either an IrO2 (Yang et al., 2017; Xia et al., 2019; Fan et al., 2020; Yang et al., 2020) or Pt (Yang et al., 2017; Fan et al., 2020) anode and oxidise either H2SO4, (Xia et al., 2019), H2 (Fan et al., 2020) or H2O. (Yang et al., 2017; Yang et al., 2020). To our knowledge, there are no earlier reports of three compartment electrolysers where water is oxidised on an Earth abundant metal anode.
Three compartment electrochemical reactor cells were assembled using different materials. A scheme of a first setup with IrO2/C anode and Sn/Cu cathode is shown in Figure 3. In between, there are three solid electrolytes: a Nafion 117 proton exchange membrane at the anode, a Fumasep FAD-PET-75 anion exchange membrane at the cathode and ion exchange resin beads (Amberlyst 15H) in between. Humidified CO2 gas was conducted through the flow field of the cathode compartment. Liquid water was pumped through the anode and middle compartment. In a second setup with NiFe anode, the PEM was replaced with a bipolar membrane (BPM) combination of a Fumasep FAD-PET-75 membrane and Nafion 117 membrane (Figure 3). The anion exchange layer faced the anode, creating an alkaline environment in which the non-noble NiFe anode was stable.
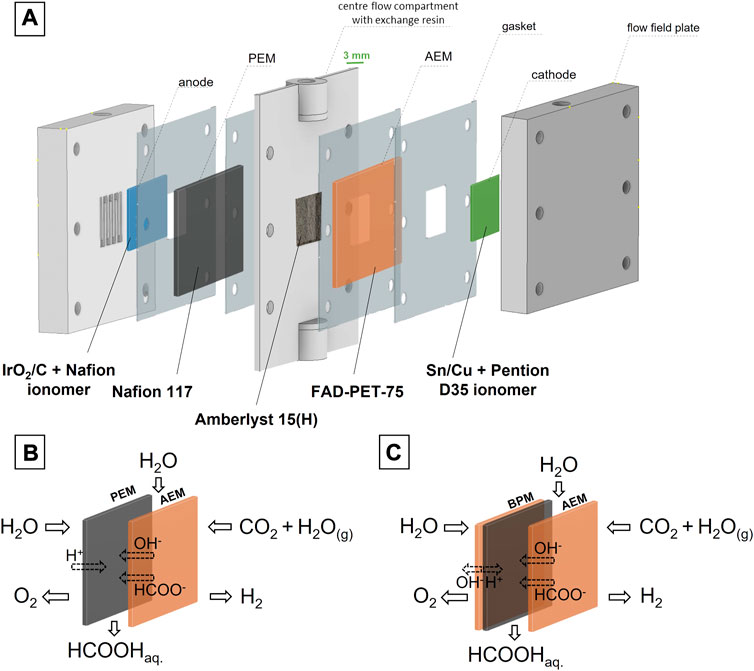
FIGURE 3. Configuration of the three compartment formic acid electrolyser (A) and membrane configuration for an electrolyser with IrO2/C anode (B) or NiFe anode (C), showing the mobility of the ions as well as the feedstock and main product streams.
The most innovative feature of a three compartment electrolyser is the use of ion exchange resin beads in the middle compartment. These beads are popular in chromatography, water purification, waste water treatment and heterogeneous catalysis, but seldom used in electrolysers. Xia et al. (2019) reported the use of a non-specified porous styrene-divinylbenzene sulfonated copolymer (Fan et al., 2020) and Kaczur et al. an amberlite IR-120 ion exchange resin. (Yang et al., 2017; Yang et al., 2020). A selection of candidate commercial ion exchanger beads were assessed for their conductivity. They were cation exchangers (Amberlyst 15H and Nafion NR-50H), anion exchangers (Amberlite IRA-402OH and IRN-78OH) and amphoteric (Dowex Retardion-11A8) ion exchangers. The conductivity versus the ion exchange capacity on a volumetric basis is displayed in Figure 4. As expected, the conductivity of the cation exchangers was significantly higher than that of the anion and amphoteric exchangers. Nafion NR-50H and Amberlyst 15H have nearly the same conductivity of ca. 23 mS/cm when saturated with liquid water. However, they have a very different bead size. Nafion NR-50H beads, with an average diameter of 3.7 mm when saturated with water (Supplementary Figure S5), were about ten times as large as Amberlyst-15H beads (ca. 300 µm). This has a strong influence on the contact area with the PEM and AEM. The smaller the beads, the more contact points between the beads and the membranes and among the beads themselves. This translates to a larger current density for smaller particles (Supplementary Figure S5). Reducing the bead size of Nafion NR-50H, for example by cryomilling, could improve its performance significantly. Here, we proceeded with Amberlyst 15H.
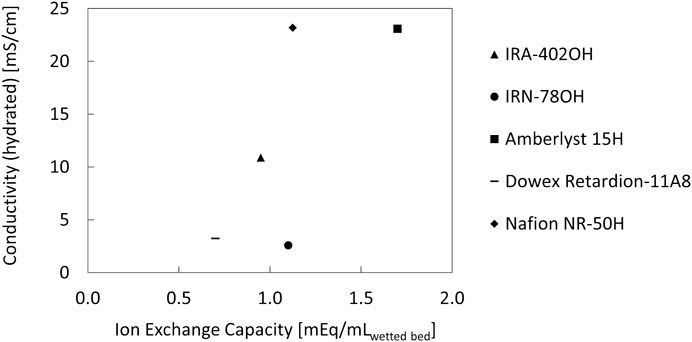
FIGURE 4. Conductivity of hydrated ion exchange resin beads, measured using electrochemical impedance spectroscopy.
The activity of the three compartment formic acid electrolyser was investigated using cyclic voltammetry. The polarization curve of an electrolyser with an IrO2/C anode and PEM are compared to that of an electrolyser with NiFe anode and BPM in Figure 5A. Owing to the presence of an additional anion exchange membrane layer in the latter case, the ionic resistance increased from 27.0 to 35.7 Ω.cm2. From the IR corrected polarization curves (Supplementary Figure S6), it was also deduced that an additional anodic overpotential of ca. 0.38 V was required at 10 mA/cm2. In liquid electrolytes where ionic contact is optimal, the activities of the NiFe anode and the IrO2 anode were very similar. NiFe was even slightly more active (Supplementary Figure S4). This means that by improving the ionic contact between the NiFe anode and anion exchange membrane, the activity of the electrolyser with NiFe anode would be similar to that with an IrO2 anode.
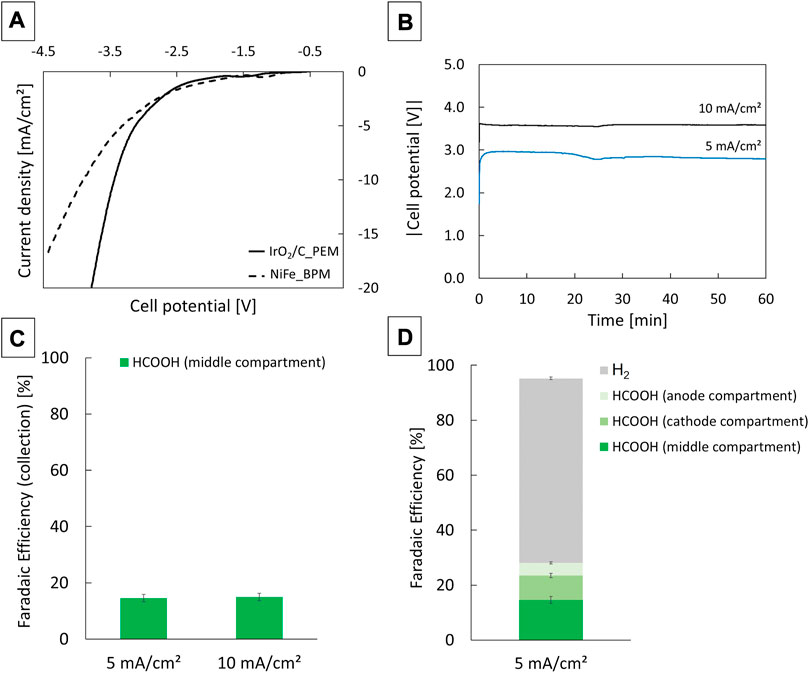
FIGURE 5. Polarization curves of a three compartment formic acid electrolyser with either IrO2/C and a PEM or NiFe and a BPM at the anode side. Water was oxidised at the anode, humid CO2 gas was reduced at the cathode. The scan rate was 5 mV/s (A). Cell potentials during chronopotentiometry measurements at 5 and 10 mA/cm2 (B). Collection faradaic efficiency of formic acid from the middle compartment of the electrolyser (C) and total faradaic efficiency towards formic acid and hydrogen gas (D). Formic acid was quantified via ion chromatography by sampling at the end of a 60 min measurement, hydrogen was quantified via gas chromatography. The error bars correspond to the standard deviation on the ion- and gas chromatography measurements.
The formic acid selectivity was determined with chronopotentiometry in the low current density range (5 and 10 mA/cm2) relevant to direct PV coupling for an electrolyser with IrO2/C anode (Figures 5B–D). It is assumed that changes in the anode materials have a limited effect on the product distribution on the cathode side of the reactor cell, so the selectivity measurements were not repeated for the NiFe anode. In the middle compartment of the reactor cell, the formation rate of formic acid amounted to about 14 and 28 μmol/cm2.h at 5 and 10 mA/cm2, respectively. This corresponds to a collection faradaic efficiency of ca. 17% (Figure 5C). Some formic acid also crosses over through the PEM and AEM to the anode and cathode side, respectively. This was observed by analysing the water stream at the anode and leading the humid CO2 stream at the cathode through a base trap. For the 5 mA/cm2 case, of the total amount of formic acid only about half was collected in the water stream of the middle compartment. The anode and cathode stream contained formic acid corresponding to a faradaic efficiency of 4.6% and 8.9%, respectively (Figure 5D). Taking all formic acid streams into account, the faradaic efficiency was about 31% at 5 mA/cm2. Most of the remaining current served hydrogen gas production (67%). Formic acid and hydrogen gas formation together account for about 98% of the total current (Figure 5D). A trace amount of methane was also detected but not quantified (Supplementary Figure S7). To sustain a current of 5 and 10 mA/cm2, the cell potential was about 2.9 V and 3.6 V, respectively. The voltage remained more or less stable during the 60 min measurement time at the two current densities (Figure 5B).
The solar-to-product efficiency is the ratio between the energy that is stored in the product and the solar energy input. Here, we adopt two metrics for efficiency: solar-to-chemical efficiency (ηSTC) and solar-to-formic acid efficiency (ηSTFA). The STC efficiency is the percentage of solar energy that is stored in chemical bonds. It takes into account all chemical products. The remaining energy is dissipated as heat. The STFA efficiency is the percentage of solar energy that is stored in the chemical bonds of formic acid. These efficiencies are calculated as follows:
In which FEi is the faradaic efficiency for product i; ∆Ei0 the thermodynamic minimal cell voltage required to produce product I; IOP the total operating current, Psun the solar power density and APV the active area of the solar PV cells. ∆E0 for liquid formic acid and hydrogen gas is 1.48 V and 1.23 V respectively. He et al. pointed out that for comparing efficiencies of solar CO2 electrolysers the current density should be normalised to the area of the PV cells. A small electrolyser powered with PV cells with a large area will have misleadingly large ηSTC values when improperly normalised to the area of the electrolyser. (He and Janáky, 2020). Here, the area of the PV cells is considered for the solar energy input. ηSTC and ηSTFA are maximised by maximising the current at the operating point, IOP. This is done by carefully matching the polarisation curve of the electrolyser with that of a series of solar cells. The operating point is the intersection point of the two curves. IOP is maximised if the operating point is close to the maximum power point of the solar module. This matching is quantified by the coupling efficiency:
With MPP the maximum power point of the solar cell and OP the operating point.
This matching is illustrated in Figure 6. Commercial c-Si solar PV cells were used and calibrated close to 1 Sun intensity. For an individual cell, the open circuit voltage was about 0.65 V and the short circuit current 39 mA/cm2 (Supplementary Figure S8). For an electrolyser with an IrO2/C anode and PEM, the coupling efficiency was maximised at 95% with a series of 6 solar cells (Figure 6A). At the operating point, the cell voltage was 3.4 V and the photocurrent 38 mA. Normalised to the area of the solar PV cells, this equals a current density of 5.3 mA/cm2. It equals 9.5 mA/cm2 in the electrolysis unit. In this current range, we can assume that the electrolyser produces formic acid at ca. 31% faradaic efficiency and hydrogen gas at ca. 67% (Figure 5). Therefore, the STC efficiency was 7.0% and the STFA efficiency 2.4%. For an electrolyser with NiFe anode and BPM, the coupling efficiency was maximised at 96% with a series of 7 solar cells (Figure 6B). At the operating point, the cell voltage was 3.8 V and the photocurrent 36 mA. Normalised to the area of the solar PV cells, this equals a current density of 4.4 mA/cm2. Because of the slightly lower photocurrent and use of a series of 7 solar cells, the STFA efficiency was slightly lower, viz. ca. 2.0%, and the STC efficiency 5.7%.
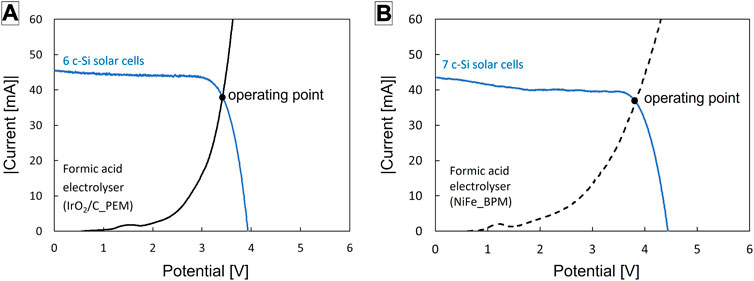
FIGURE 6. Matching of the polarisation curves of the electrolysers with that of a series of solar cells to optimize the coupling efficiency and photocurrent, for the electrolyser with IrO2/C anode and PEM (A) and the electrolyser with NiFe anode and BPM (B). The solar module was illuminated under 100 mW/cm2 with a Xe lamp equipped with an infrared filter and air mass 1.5G filter. The solar cells had a surface area of 1.18 cm2 each. The active geometric area of the electrodes was 4 cm2.
Literature on solar CO2 electrolysers targeting CO formation is most abundant. Solar-to-CO efficiencies reach up to 19.1%. (Cheng et al., 2020) Solar CO2 electrolysers targeting formic acid are more scarce, with the large majority producing formate. A selection of what are, to our knowledge, the most efficient solar electrolysers is given in Table 1. The highest reported solar-to-formate efficiency for a PV-EC electrolyser producing potassium formate is 7.2%. (Kato et al., 2021). Zhou et al. (2016) reported a remarkably high solar-to-formate efficiency of 10% with a PEC device. To our knowledge, this is the first work reporting on the efficiency of a solar CO2 electrolyser without liquid salt solutions directly producing formic acid. Compared to other PV-EC devices the current density of our electrolyser is in the same order of magnitude, but the cell voltage is the highest by at least 1.3 V. The faradaic efficiency of 31% is rather low, with other CO2 electrolysers producing formate at faradaic efficiencies of over 80%. Owing to the near-optimal solar matching, the STFA efficiency of 2.0% is of average value. Like for other solar electrolysers, the product concentration in this work is rather low (0.02 wt%). Formic acid of this concentration is only suited for a limited number of applications, such as feed for bioprocesses. (Thijs et al., 2022) The costs related to increasing the concentration by (extraction-) distillation processes are very high. (Ramdin et al., 2019; Thijs et al., 2022) Future research could focus on increasing the product concentration in the electrolyser stage by lowering the water flow rate in the middle compartment, which was not possible in the current experiments for technical reasons. In experiments in literature using similar three compartment lab scale electrolysers, high formic acid concentrations in the percentage range have been reached (Fan et al., 2020).
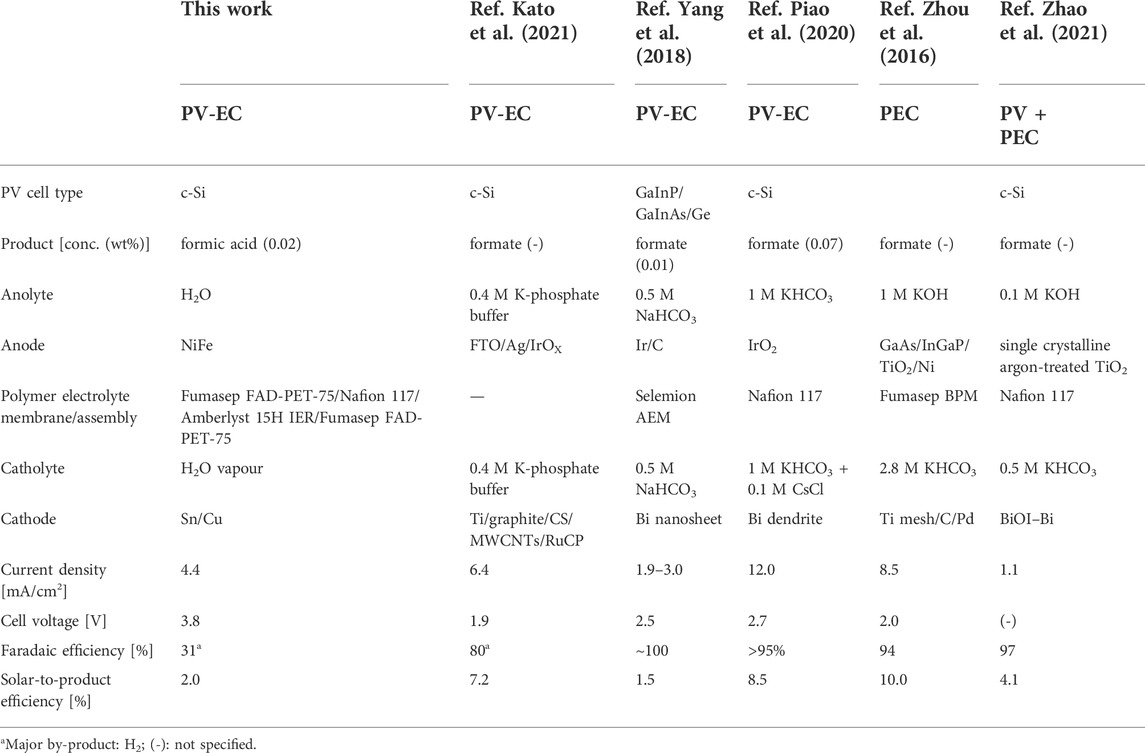
TABLE 1. Literature on solar CO2 electrolysers producing formate, compared to this work on a solar CO2 electrolyser producing dilute formic acid.
Several strategies can be followed to increase the STFA efficiency. With a faradaic efficiency for formic acid of 100%, the STFA efficiency of our electrolyser would be about 6.5%. Using more efficient multijunction PV cells would also lead to a substantial improvement. For hydrogen electrolysers, solar-to-hydrogen efficiencies go up to 30% with solar concentration and triple junction PV cells, which is about double compared to c-Si cells at 1 Sun, (Ager et al., 2015; Jia et al., 2016; Heremans et al., 2017; Khan et al., 2021b), although these cells are also significantly more expensive. Improvements can also be made by decreasing the cell potential required to drive the reaction, which would allow to use less c-Si cells in series, thereby increasing the efficiency. An experimental analysis was done to determine what components contribute most to the total cell potential.
When instead of H2O and CO2, 0.5 M H2SO4 and CO2 saturated 0.5 M KHCO3 solutions are fed to anode and cathode compartments respectively, the reaction conditions are similar to those in the H-cells in which the electrodes were individually characterised (subchapters 2.1 and 2.2). A polarization curve of such an electrolyser configuration is presented in Figure 7A. The ionic resistance measured with potentiostatic impedance spectroscopy was ca. 25.8 Ω.cm2. At 10 mA/cm2, this corresponds to an ohmic loss of 0.26 V. This shows that at least at low current densities, the ohmic losses in the three compartment solid electrolyte configuration are only a small contributor to the total cell potential. They could be even further reduced by decreasing the thickness of the middle compartment containing the ion exchanger beads, which was here 3 mm. Adding the standard reaction potential and the anode and cathode overpotential as determined in the H-cell setups, viz. 0.30 and 0.52 V, respectively, a total of 2.6 V is obtained. Experimentally, a comparable cell potential of about 2.7 V was required. When KHCO3 at the cathode is replaced by CO2 (Figure 7B), the cell potential increases to 3.7 V at 10 mA/cm2, which is a significant increase by about 1 V. The ionic resistance increased only slightly (26.8 Ω.cm2). Replacing H2SO4 at the anode with H2O (Figure 7B) does not further increase the cell potential. This implies that the large overpotential is a result of the cathode side operating in the absence of a liquid catholyte. Further research is needed to identify the exact cause of this. Possible explanations are an insufficient ionic contact between the cathode and the AEM, a lack of buffering capacity of the AEM as opposed to a bicarbonate solution leading to a high local pH, the absence of alkali cations to stabilize the CO2 reduction intermediate or a lack of bicarbonate or water as a proton donor. Reducing this overpotential is key to significantly improve the STFA efficiency.
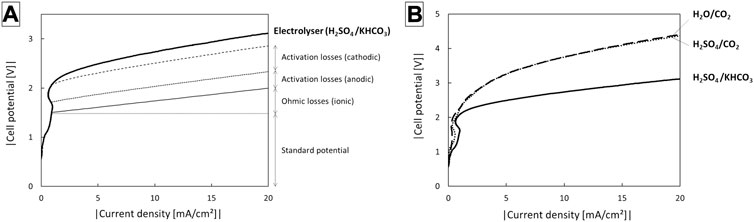
FIGURE 7. Electrolyser potential using different electrolyte compositions in the anode and cathode compartments of the three compartment electrolyser with IrO2/C anode.
To circumvent this overpotential loss, the three compartment electrolyser could be operated with a catholyte solution, as shown in Figure 8. Because K+ cations are hindered from moving through the AEM, the catholyte will not readily be consumed. Rather, the (bi)carbonates will be constantly replenished by adding CO2. At the low current densities of a PV-EC device as proposed in this work, the consumption rate of CO2 is low. An air flow might contain enough CO2 to maintain the catholyte at a stable (bi)carbonate concentration. This option needs further investigation. Additional research could focus on implementing a GDE-type electrode to improve the CO2 availability or on implementing an AEM that absorbs as little K+ co-ions as possible (Geise et al., 2014).
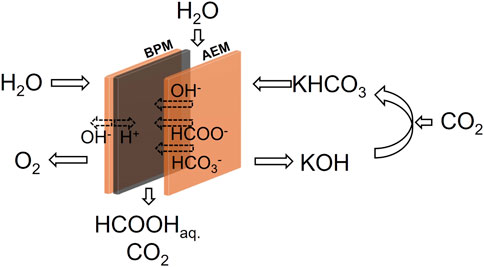
FIGURE 8. Reactor configuration of a three compartment formic acid electrolyser with recirculated bicarbonate catholyte.
In this work a first solar-driven electrolyser is demonstrated that directly produces formic acid from water and CO2. The electrolyser consists of three compartments and uses only Earth abundant metals and commercially available solid electrolytes. It produces dilute formic acid at a solar-to-formic acid efficiency of 2%, with hydrogen gas as the major by-product. The overall solar-to-chemical efficiency is 5.7%. By producing formic acid instead of the common potassium formate, the need for downstream acidification steps is avoided. The dilute formic acid product is directly useable as feed for bioprocesses, or can be concentrated by an (extraction-) distillation process for use as a liquid renewable fuel or chemical building block. By tuning the water flow in the middle compartment, the product concentration in the electrolyser stage could be increased to avoid the need for downstream processing completely.
An experimental analysis showed that a major part of the cell overpotential is due to the cathode compartment operating in the gas phase. Improving the cathode catalyst and its contact with the anion exchange membrane could result in a substantial improvement of the STFA efficiency. Another perspective for improvement is the use of a catholyte. This could combine the benefits of a liquid phase reactor with the straight production of formic acid.
The Sn/Cu electrode was prepared by electroplating Sn from a SnCl2-citrate solution onto a porous Cu foam substrate (MTI, 80 µm thickness, > 99.99% purity, 70%–80% porosity). The Cu foam was first cleaned by subsequent rinsing with ethanol, acetone and milli-Q water and drying in an oven at 60 °C for at least 1 h. Then, the foam was submerged in the electrolytic solution. The electrolytic solution was based on literature and was made by first dissolving sodium citrate dihydrate (≥99%) in milli-Q water (resistivity = 18.0 MOhm.cm) to a concentration of 0.05 M (Wang et al., 2016). Then the pH was adjusted to 6 by slowly adding droplets of a H2SO4 solution (50 vol%) while monitoring the pH. Finally, SnCl2 (Honeywell, 98%) was added to a concentration of 0.018 M, after which the solution was stirred overnight. The electroplating of Sn was performed with a VersaSTAT 4 potentiostat (Princeton Applied Research) at a constant current of −4.8 mA/cm2 for 35 min, with Cu foam as the working electrode and Pt as the counter electrode. Afterwards, the electrode was rinsed with milli-Q water.
The performance of the cathode was analysed in a H-cell setup. The H-cell operated at room temperature and was connected to a potentiostat (Ametek VersaSTAT 3) with VersaStudio software. The anode and cathode compartment were filled with a 90 ml solution of 0.5 M H2SO4 and 0.5 M KHCO3 (BioUltra, > 99.5%) respectively. The compartments were separated with a Nafion membrane (NafionTM N117, Ion Power) that was prepared by boiling it in a 5% solution of H2O2, a 1 M H2SO4 solution and milli-Q water for one, two and 3 hours at 120°C respectively. The cathode compartment was pre-saturated with CO2. During the experiments, it was continuously sparged with CO2 at a flowrate of 20 ml/min, while under constant stirring. Graphite and Ag/AgCl (RE-1CP, saturated KCl, EAg/AgCl = 0.197 V) were used as the counter and reference electrode respectively. The reaction potential was converted to a reversible hydrogen electrode using the following formula:
The resistance R was measured with electrochemical impedance spectroscopy, which was performed at open circuit potential from 1 Mhz to 100 Hz. The resistance was found in the high frequency region where the imaginary impedance was 0.
The IrO2/C electrode for anodic water oxidation was made by synthesising an ink and dropcasting this onto a carbon paper support (Toray TP-060). The ink was synthesised by adding 100 mg of IrO2 nanoparticles (FuelCellStore) to 960 µL of isopropanol (HPLC grade). 320 µL of a 5 wt% Nafion ionomer solution (FuelCellStore) was used as a binder. The ink was sonicated for 10 min. The carbon paper was rinsed with ethanol, acetone and milli-Q water and dried in an oven at 60°C for at least 1 h before dropcasting. 64 µL of ink was added per geometric cm2 of carbon paper. The IrO2 loading was determined by weighing before and after dropcasting. The NiFe electrode was prepared by electroplating Ni and Fe from a Ni-Fe solution onto a porous Ni foam substrate (PI-KEM, 1.6 mm thickness). The Ni foam was first cleaned by subsequent rinsing with ethanol, acetone and milli-Q water and drying in an oven at 60°C for at least 1 h. Then the foam was submerged in the electrolytic solution. The electrolytic solution was based on literature and consisted of NiSO4.7 H2O (120.6 g/L), NiCl2.6 H2O (3.3 g/L), H3BO3 (2.8 g/L), FeSO4.7 H2O (172.9 g/L) and FeCl2.4 H2O (3.6 g/L) in milli-Q water. (Solmaz and Kardaş, 2009). Then the pH was adjusted to 3 by slowly adding droplets of H2SO4 while monitoring the pH. The electrodeposition was performed under intensive stirring at a constant current of −50 mA/cm2 for 680 s, with Ni foam as the working and counter electrode. Afterwards, the electrode was rinsed with milli-Q water.
The performance of the anodes was analysed in a H-cell setup. For IrO2/C, the anode and cathode compartment were both filled with a 90 ml 0.5M H2SO4 solution. The compartments were separated with a Nafion 117 membrane. The anode compartment was pre-saturated with O2. During the experiments, it was continuously sparged with O2 at a flowrate of 20 ml/min, while under constant stirring. A Pt coil and Ag/AgCl (RE-1CP, saturated KCl, EAg/AgCl = 0.197 V) were used as the counter and reference electrode respectively. The performance of the NiFe anode was analysed in a 1M KOH solution sparged with O2 and constantly stirred. A Pt coil and Hg/HgO (20 wt% NaOH, E-61AP, EHg/HgO = 0.124 V) electrode were used as the counter and reference electrode respectively.
To determine the conductivity of the ion exchange resin beads, they were packed in a 7 mm thick layer in between two stainless steel plates. Cation and amphoteric exchangers (Amberlyst 15, Nafion NR-50 and Dowex Retardion-11A8) were hydrated with milli-Q water before the measurement. Anion exchangers (Amberlite IRA-402 and IRN-78) were ion-exchanged in a 1 M KOH electrolyte solution overnight and rinsed with milli-Q water. To ensure good contact between the beads and the plates, they were tighly pressed together and fastened with screws at an equal torque of 2 Nm. Potentiostatic EIS was used to determine the conductivity of the ion exchanger in between the plates. EIS was performed at open circuit potential from 1 Mhz to 100 Hz. The resistance was found in the high frequency region where the imaginary impedance was zero. The conductivity was calculated from resistance as follows:
A commercially available reactor (FuelCellStore) was modified to contain three compartments. The reactor consisted of two graphite blocks with serpentine flow paths and gold-plated current collector plates on either side. A middle compartment was made in house by 3D printing. This compartment had a thickness of 3 mm with two slits (8 mm by 0.6 mm) to allow water to be pumped through. The reactor was assembled as shown in Figure 3. The geometric area of the electrodes was 4 cm2. Milli-Q water was recirculated through the anode compartment with a peristaltic pump (Watson Marlow 205S) at a flowrate of 3.4 ml/min. A single-pass flow of milli-Q water was pumped through the middle compartment at a flowrate of 0.2 ml/min with a syringe pump (WPI, Aladdin). Humid CO2 gas flowed through the cathode compartment at 50 ml/min. The gas was humidified by flowing it through a glass humidifier at room temperature. To enhance the ionic contact between the cathode and the AEM, the cathode was coated with a layer of alkaline ionomer. The Sn/Cu electrode was dipped twice in a Pention D35 ionomer solution (FuelCellStore, 5 wt% in ethanol) with an intermediate drying step for several hours. Details on Pention D35 and SEM-imaging of the coated Sn/Cu electrode can be found in Supplementary Figure S1. Before the reaction, the ionomer-coated cathode and AEM(s) were immersed in a 0.5 M KHCO3 solution overnight to exchange the counterions to HCO3−. Before use, they were thoroughly rinsed with milli-Q water. The Amberlyst 15H resin beads were hydrated with milli-Q water.
For gas quantification, the gases were brought from the reactor to a gas chromatograph (Interscience CompactGC 4.0). The chromatograph was equipped with a precolumn (Rt-QBond), molecular sieve column (Rt-Molsieve 5A) and thermal conductivity detector for analysis of permanent gases using argon carrier gas. The total flow was set at 5 ml/min. The volumetric concentrations of H2 were determined from a linear calibration fitted over a range from 3 to 10 vol% H2. The faradaic efficiency towards H2 was calculated as follows:
For formate/formic acid quantification, ion chromatography (Metrohm, Metrosep A Supp 4 anion separation column) was used. For liquid water streams, 1 M KOH was added dropwise until a pH > 6 was obtained to ensure that the product, with a pKa of 3.75, was completely dissociated for analysis through ion chromatography. Gas flows were connected to a base trap filled with 10 ml of a 0.1 M KHCO3 solution (pH ∼ 6.8), from which was sampled after the reaction for analysis. The faradaic efficiency towards formate (at moment t) was calculated as follows:
(Partial) current densities were normalised to the geometric surface area of one side of the electrode, unless stated otherwise:
The raw data supporting the conclusion of this article will be made available by the authors, without undue reservation.
JM and JR initiated and supervised the research and contributed to the writing. BT performed the experiments and contributed to the writing. LH, GH, and WW contributed to the experiments and approved the manuscript for publication.
This research was funded by CO2PERATE, a cluster SBO project (No. HBC. 2017.0692) supported by Vlaams Agentschap Innoveren en Ondernemen (VLAIO).
JM acknowledges the Flemish government for long term structural funding (Methusalem program).
The authors declare that the research was conducted in the absence of any commercial or financial relationships that could be construed as a potential conflict of interest.
All claims expressed in this article are solely those of the authors and do not necessarily represent those of their affiliated organizations, or those of the publisher, the editors and the reviewers. Any product that may be evaluated in this article, or claim that may be made by its manufacturer, is not guaranteed or endorsed by the publisher.
The Supplementary Material for this article can be found online at: https://www.frontiersin.org/articles/10.3389/fceng.2022.1028811/full#supplementary-material
Ager, J. W., Shaner, M. R., Walczak, K. A., Sharp, I. D., and Ardo, S. (2015). Experimental demonstrations of spontaneous, solar-driven photoelectrochemical water splitting. Energy Environ. Sci. 8 (10), 2811–2824. doi:10.1039/c5ee00457h
Centi, G., Quadrelli, E. A., and Perathoner, S. (2013). Catalysis for CO2 conversion: A key technology for rapid introduction of renewable energy in the value chain of chemical industries. Energy Environ. Sci. 6 (6), 1711–1731. doi:10.1039/c3ee00056g
Cheng, W., Richter, M. H., Sullivan, I., Larson, D. M., Xiang, C., Brunschwig, B. S., et al. (2020). CO 2 reduction to CO with 19% E ffi ciency in a solar-driven gas di ff usion electrode flow cell under outdoor solar illumination. ACS Energy Lett. 5 (5), 470–476. doi:10.1021/acsenergylett.9b02576
Du, D., Lan, R., Humphreys, J., and Tao, S. (2017). Progress in inorganic cathode catalysts for electrochemical conversion of carbon dioxide into formate or formic acid. J. Appl. Electrochem. 47 (6), 661–678. doi:10.1007/s10800-017-1078-x
Fan, L., Xia, C., Zhu, P., Lu, Y., and Wang, H. (2020). Electrochemical CO2 reduction to high-concentration pure formic acid solutions in an all-solid-state reactor. Nat. Commun. 11 (1), 3633–3639. doi:10.1038/s41467-020-17403-1
García de Arquer, F. P., Dinh, C-T., Ozden, A., Wicks, J., McCallum, C., Kirmani, A. R., et al. (2020). CO 2 electrolysis to multicarbon products at activities greater than 1 A cm −2. Science 367 (6478), 661–666. doi:10.1126/science.aay4217
Geise, G. M., Cassady, H. J., Paul, D. R., Logan, B. E., and Hickner, M. A. (2014). Specific ion effects on membrane potential and the permselectivity of ion exchange membranes. Phys. Chem. Chem. Phys. 16 (39), 21673–21681. doi:10.1039/c4cp03076a
Global Formic Acid Market Report (2022). Formic acid market by product types (grades of 85%, 94%, 99%, and others), applications (agriculture, leather & textile, rubber, chemical & pharmaceuticals, and others), and regions (asia pacific, north America, Latin America, europe, and Middle East & africa) – global industry analysis, growth, share, size, trends, and forecast, 2021 – 2028. Available from: https://www.industryresearch.biz/global-formic-acid-market-18873267.
He, J., Dettelbach, K. E., Huang, A., and Berlinguette, C. P. (2017). Brass and bronze as effective CO2Reduction electrocatalysts. Angew. Chem. Int. Ed. Engl. 56 (52), 16806–16809. doi:10.1002/ange.201709932
He, J., and Janáky, C. (2020). Recent advances in solar-driven carbon dioxide conversion: Expectations versus reality. ACS Energy Lett. 5 (6), 1996–2014. doi:10.1021/acsenergylett.0c00645
Heremans, G., Trompoukis, C., Daems, N., Vankelecom, I. F. J., Martens, A., Rong, J., et al. (2017). Vapor-fed solar hydrogen production exceeding 15% efficiency using Earth abundant catalysts and anion exchange membrane. Sustain. Energy Fuels 1, 2061–2065. doi:10.1039/c7se00373k
Higgins, D., Hahn, C., Xiang, C., Jaramillo, T. F., and Weber, A. Z. (2019). Gas-diffusion electrodes for carbon dioxide reduction: A new paradigm. ACS Energy Lett. 4 (1), 317–324. doi:10.1021/acsenergylett.8b02035
International Energy Agency (IEA) (2021). Direct air capture. Available from: https://www.iea.org/reports/direct-air-capture.
Jia, J., Seitz, L. C., Benck, J. D., Huo, Y., Chen, Y., Ng, J. W. D., et al. (2016). Solar water splitting by photovoltaic-electrolysis with a solar-to-hydrogen efficiency over 30%. Nat. Commun. 7, 13237. doi:10.1038/ncomms13237
Kar, S., Goeppert, A., and Prakash, G. K. S. (2019). Integrated CO2 capture and conversion to formate and methanol: Connecting two threads. Acc. Chem. Res. 52 (10), 2892–2903. doi:10.1021/acs.accounts.9b00324
Kato, N., Mizuno, S., Shiozawa, M., Nojiri, N., Kawai, Y., Fukumoto, K., et al. (2021). A large-sized cell for solar-driven CO2 conversion with a solar-to-formate conversion efficiency of 7.2%. Joule 5 (3), 687–705. doi:10.1016/j.joule.2021.01.002
Khan, M. A., Al-Shankiti, I., Ziani, A., and Idriss, H. (2021). Demonstration of green hydrogen production using solar energy at 28% efficiency and evaluation of its economic viability. Sustain. Energy Fuels 5 (4), 1085–1094. doi:10.1039/d0se01761b
Khan, S., Hwang, J., Horn, Y., and Kripa, K. (2021). Catalyst-proximal plastrons enhance activity and selectivity of carbon dioxide electroreduction. Cell. Rep. Phys. Sci. 2 (2), 100318. doi:10.1016/j.xcrp.2020.100318
Kumawat, A. S., and Sarkar, A. (2017). Comparative study of carbon supported Pb, Bi and Sn catalysts for electroreduction of carbon dioxide in alkaline medium. J. Electrochem. Soc. 164 (14), H1112–H1120. doi:10.1149/2.0991714jes
Lee, M. Y., Park, K. T., Lee, W., Lim, H., Kwon, Y., and Kang, S. (2020). Current achievements and the future direction of electrochemical CO2 reduction: A short review. Crit. Rev. Environ. Sci. Technol. 50 (8), 769–815. doi:10.1080/10643389.2019.1631991
Lee, S., Ju, H. K., Machunda, R., Uhm, S., Lee, J. K., Lee, H. J., et al. (2015). Sustainable production of formic acid by electrolytic reduction of gaseous carbon dioxide. J. Mat. Chem. A Mat. 3 (6), 3029–3034. doi:10.1039/c4ta03893b
Li, A., Kong, S., Guo, C., Ooka, H., Adachi, K., Hashizume, D., et al. (2022). Enhancing the stability of cobalt spinel oxide towards sustainable oxygen evolution in acid. Nat. Catal. 5, 109–118. doi:10.1038/s41929-021-00732-9
Li, F., MacFarlane, D. R., and Zhang, J. (2018). Recent advances in the nanoengineering of electrocatalysts for CO2 reduction. Nanoscale 10 (14), 6235–6260. doi:10.1039/c7nr09620h
Lu, Q., and Jiao, F. (2016). Electrochemical CO2 reduction: Electrocatalyst, reaction mechanism, and process engineering. Nano Energy 29, 439–456. doi:10.1016/j.nanoen.2016.04.009
Lu, X., Leung, D. Y. C., Wang, H., Leung, M. K. H., and Xuan, J. (2014). Electrochemical reduction of carbon dioxide to formic acid. ChemElectroChem 1 (5), 836–849. doi:10.1002/celc.201300206
McCrory, C. C. L., Jung, S., Ferrer, I. M., Chatman, S. M., Peters, J. C., and Jaramillo, T. F. (2015). Benchmarking hydrogen evolving reaction and oxygen evolving reaction electrocatalysts for solar water splitting devices. J. Am. Chem. Soc. 137 (13), 4347–4357. doi:10.1021/ja510442p
Morimoto, M., Takatsuji, Y., Yamasaki, R., Hashimoto, H., Nakata, I., Sakakura, T., et al. (2018). Electrodeposited Cu-Sn alloy for electrochemical CO 2 reduction to CO/HCOO. Electrocatalysis 9, 323–332. doi:10.1007/s12678-017-0434-2
Pătru, A., Binninger, T., Pribyl, B., and Schmidt, T. J. (2019). Design principles of bipolar electrochemical Co-electrolysis cells for efficient reduction of carbon dioxide from gas phase at low temperature. J. Electrochem. Soc. 166 (2), F34–F43. doi:10.1149/2.1221816jes
Piao, G., Yoon, S. H., Han, D. S., and Park, H. (2020). Ion-enhanced conversion of CO2 into formate on porous dendritic bismuth electrodes with high efficiency and durability. ChemSusChem 13, 698–706. doi:10.1002/cssc.201902581
Qiao, J., Liu, Y., Hong, F., and Zhang, J. (2014). A review of catalysts for the electroreduction of carbon dioxide to produce low-carbon fuels. Chem. Soc. Rev. 43 (2), 631–675. doi:10.1039/c3cs60323g
Ramdin, M., Morrison, A. R. T., De Groen, M., Van Haperen, R., De Kler, R., Irtem, E., et al. (2019). High-pressure electrochemical reduction of CO2 to formic acid/formate: Effect of pH on the downstream separation process and economics. Ind. Eng. Chem. Res. 58 (51), 22718–22740. doi:10.1021/acs.iecr.9b03970
Solmaz, R., and Kardaş, G. (2009). Electrochemical deposition and characterization of NiFe coatings as electrocatalytic materials for alkaline water electrolysis. Electrochim. Acta 54 (14), 3726–3734. doi:10.1016/j.electacta.2009.01.064
Song, J. T., Song, H., Kim, B., and Oh, J. (2019). Towards higher rate electrochemical CO 2 conversion : From liquid-phase to gas-phase systems. Catalysts 9 (9), 224. doi:10.3390/catal9030224
Sullivan, I., Goryachev, A., Digdaya, I. A., Li, X., Atwater, H. A., Vermaas, D. A., et al. (2021). Coupling electrochemical CO2 conversion with CO2 capture. Nat. Catal. 4, 952–958. doi:10.1038/s41929-021-00699-7
Thijs, B., Houlleberghs, M., Hollevoet, L., Heremans, G., Rongé, J., and Martens, J. A. (2021). 2 hydrogen, fueling the future: Introduction to hydrogen production and storage techniques. Hydrogen Storage Sustain. 2, 159–194. doi:10.1515/9783110596281-010
Thijs, B., Rongé, J., and Martens, J. (2022). Matching emerging formic acid synthesis processes with application requirements. Green Chem. 24 (24), 2287–2295. doi:10.1039/d1gc04791d
Wang, Y., Zhou, J., Lv, W., Fang, H., and Wang, W. (2016). Electrochemical reduction of CO 2 to formate catalyzed by electroplated tin coating on copper foam. Appl. Surf. Sci. 362, 394–398. doi:10.1016/j.apsusc.2015.11.255
Xia, C., Zhu, P., Jiang, Q., Pan, Y., Liang, W., Stavitsk, E., et al. (2019). Continuous production of pure liquid fuel solutions via electrocatalytic CO2 reduction using solid-electrolyte devices. Nat. Energy 4 (9), 776–785. doi:10.1038/s41560-019-0451-x
Yang, H., Han, N., Deng, J., Wu, J., Wang, Y., Hu, Y., et al. (2018). Selective CO2 reduction on 2D mesoporous Bi nanosheets. Adv. Energy Mat. 8 (35), 1801536–6. doi:10.1002/aenm.201801536
Yang, H., Kaczur, J. J., Sajjad, S. D., and Masel, R. I. (2017). Electrochemical conversion of CO2 to formic acid utilizing SustainionTM membranes. J. CO2 Util. 20, 208–217. doi:10.1016/j.jcou.2017.04.011
Yang, H., Kaczur, J. J., Sajjad, S. D., and Masel, R. I. (2020). Performance and long-term stability of CO2conversion to formic acid using a three-compartment electrolyzer design. J. CO2 Util. 42, 101349. doi:10.1016/j.jcou.2020.101349
Yue, P., Fu, Q., Li, J., Zhang, L., Xing, L., Kang, Z., et al. (2021). Triple-phase electrocatalysis for the enhanced CO2 reduction to HCOOH on a hydrophobic surface. Chem. Eng. J. 405, 126975. doi:10.1016/j.cej.2020.126975
Zhao, C., and Wang, J. (2016). Electrochemical reduction of CO2 to formate in aqueous solution using electro-deposited Sn catalysts. Chem. Eng. J. 293, 161–170. doi:10.1016/j.cej.2016.02.084
Zhao, J., Xue, L., Niu, Z., Huang, L., Hou, Y., Zhang, Z., et al. (2021). Conversion of CO2 to formic acid by integrated all-solar-driven artificial photosynthetic system. J. Power Sources 512, 230532. doi:10.1016/j.jpowsour.2021.230532
Zheng, W., Liu, M., and Lee, L. Y. S. (2020). Best practices in using foam-type electrodes for electrocatalytic performance benchmark. ACS Energy Lett. 5 (10), 3260–3264. doi:10.1021/acsenergylett.0c01958
Zhou, X., Liu, R., Sun, K., Chen, Y., Verlage, E., Francis, S. A., et al. (2016). Solar-driven reduction of 1 atm of CO2to formate at 10% energy-conversion efficiency by use of a TiO2-protected III-V tandem photoanode in conjunction with a bipolar membrane and a Pd/C cathode. ACS Energy Lett. 1 (4), 764–770. doi:10.1021/acsenergylett.6b00317
Keywords: CCU, formic acid, renewable fuel, three compartment electrolyser, solar efficiency
Citation: Thijs B, Hanssens L, Heremans G, Wangermez W, Rongé J and Martens JA (2022) Demonstration of a three compartment solar electrolyser with gas phase cathode producing formic acid from CO2 and water using Earth abundant metals. Front. Chem. Eng. 4:1028811. doi: 10.3389/fceng.2022.1028811
Received: 26 August 2022; Accepted: 24 October 2022;
Published: 09 November 2022.
Edited by:
Anna Hankin, Imperial College London, United KingdomReviewed by:
Juqin Zeng, Italian Institute of Technology (IIT), ItalyCopyright © 2022 Thijs, Hanssens, Heremans, Wangermez, Rongé and Martens. This is an open-access article distributed under the terms of the Creative Commons Attribution License (CC BY). The use, distribution or reproduction in other forums is permitted, provided the original author(s) and the copyright owner(s) are credited and that the original publication in this journal is cited, in accordance with accepted academic practice. No use, distribution or reproduction is permitted which does not comply with these terms.
*Correspondence: Johan A. Martens, am9oYW4ubWFydGVuc0BrdWxldXZlbi5iZQ==
Disclaimer: All claims expressed in this article are solely those of the authors and do not necessarily represent those of their affiliated organizations, or those of the publisher, the editors and the reviewers. Any product that may be evaluated in this article or claim that may be made by its manufacturer is not guaranteed or endorsed by the publisher.
Research integrity at Frontiers
Learn more about the work of our research integrity team to safeguard the quality of each article we publish.