 Yan Chen
 Hyungwoong Ahn
- Institute for Materials and Processes, School of Engineering, The University of Edinburgh, Edinburgh, United Kingdom
In this paper, a feasibility study was carried out to evaluate cyclic adsorption processes for capturing CO2 from either shifted synthesis gas or H2 PSA tail gas of an industrial-scale SMR-based hydrogen plant. It is expected that hydrogen is to be widely used in place of natural gas in various industrial sectors where electrification would be rather challenging. A SMR-based hydrogen plant is currently dominant in the market, as it can produce hydrogen at scale in the most economical way. Its CO2 emission must be curtailed significantly by its integration with CCUS. Two Vacuum Pressure Swing Adsorption (VPSA) systems including a rinse step were designed to capture CO2 from an industrial-scale SMR-based hydrogen plant: one for the shifted synthesis gas and the other for the H2 PSA tail gas. Given the shapes of adsorption isotherms, zeolite 13X and activated carbon were selected for tail gas and syngas capture options, respectively. A simple Equilibrium Theory model developed for the limiting case of complete regeneration was taken to analyse the VPSA systems in this feasibility study. The process performances were compared to each other with respect to product recovery, bed productivity and power consumption. It was found that CO2 could be captured more cost-effectively from the syngas than the tail gas, unless the desorption pressure was too low. The energy consumption of the VPSA was comparable to those of the conventional MDEA processes.
Introduction
UK has set a legally binding target to achieve net zero GHG emission by 2050 by revising the Climate Change Act 2008 in 2019. Similarly, Scottish Government has published its Hydrogen Policy Statement in which it is aimed to achieve net zero greenhouse gas emissions by 2045 and a 75% reduction by 2030 against the 1990 baseline (Scottish Government, 2020a). There is no doubts that both low-carbon hydrogen and renewable energy will play a pivotal role in the net zero GHG emission economy. Hydrogen will be taken as a fuel in the sectors where full electrification is challenging, such as furnace, long haul transport, etc., Also, hydrogen is considered as a good energy carrier, as it can be generated by electrolysis using the extra renewable electricity that would otherwise be wasted. For a net zero GHG emission, it is crucial capturing CO2 from the air, in other words, negative emission. The biomass-derived hydrogen integrated with CCUS (Carbon Capture, Utilisation and Storage) as well as direct air capture are identified as promising negative emission routes.
Accordingly, each country has announced a roadmap to expand drastically the hydrogen supply capacity for the next 30 years. UK plans to install 5 GW of green and blue H2 production by 2030 and estimates the H2 demand in 2050 will reach 250 – 460 TWh, equivalent to 20 – 35% of UK energy consumption (UK BEIS, 2021).
Up to now, hydrogen is produced at scale by reforming fossil fuels, mainly natural gas and coal. However, a chemical process producing grey hydrogen by reforming a natural gas using steam involves enormous CO2 emission at a rate of 10 ton CO2 per 1 ton H2.
In principle, such an enormous CO2 emission involved in grey H2 production can be reduced greatly by its integration with CCUS. The hydrogen that is produced by reforming reactions of fossil fuels with its CO2 emission curtailed by CCUS is referred to as blue hydrogen.
Green hydrogen is defined as the hydrogen produced by splitting water (H2O) in an electrolyser powered by electricity. The electricity that an electrolyser consumes must not involve CO2 emission over the process of its production to claim its “green” credit. Green hydrogen is obviously more promising than blue hydrogen in terms of sustainability, but the hydrogen demand that is expected to grow rapidly for achieving the net zero GHG emission target can be met only by producing both green and blue hydrogens. As pointed out by the latest Hydrogen Assessment report (Scottish Government, 2020b), green hydrogen is currently economically unfeasible, as its production cost is almost three times that of blue hydrogen. According to the study, it is not until 2050 that green hydrogen’s levelised cost will be reduced to an extent that it becomes comparable to the blue hydrogen’s levelised cost. Constructing an infrastructure for supplying a huge amount of renewable electricity to electrolysis plants must take precedence in order to produce green hydrogen at scale.
Hence, blue hydrogen production is essential for propping up the hydrogen economy for the next decades to come before green hydrogen technologies mature. In this respect, we must endeavour to develop the most cost-effective way of capturing CO2 from a reforming-based H2 plant.
Currently, a majority of hydrogen production plants are based on steam methane reforming (SMR) of hydrocarbon gases. The SMR H2 plant mainly comprises reforming reactors followed by a hydrogen purification Pressure Swing Adsorption (PSA) as shown in Figure 1. In principle, the highly endothermic SMR reaction is favoured by low pressure and high temperature conditions, whilst the subsequent PSA unit needs a feed at high pressure and low temperature conditions for a decent working capacity of adsorbents. It is not advisable compressing the synthesis gas between the reforming and purification sections, as it would incur a huge energy penalty. A SMR H2 plant is normally designed to operate at around 20 bara, to reconcile the conflicting desired operating conditions of the two main units.
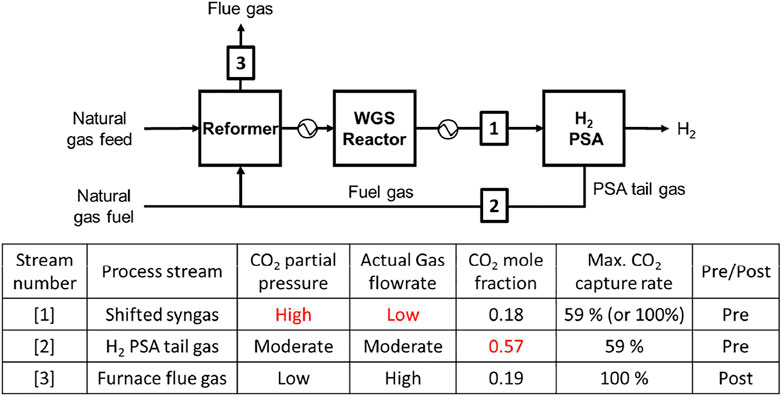
FIGURE 1. Process flow of a SMR hydrogen production plant and three process streams where CO2 can be captured.
As shown in Figure 1, CO2 can be captured from shifted synthesis gas (syngas), H2 PSA tail gas (tail gas) or flue gas (Soltani et al., 2014; Voss, 2014). To identify the stream conditions of the three process streams, a 6.8 ton H2/hr-scale H2 production plant was simulated using Honeywell UniSim. Table 1 shows stream conditions of the synthesis gas and the PSA tail gas that were estimated in the H2 plant UniSim simulation. A typical SMR H2 plant exhibits the following performances: 1) CH4 feed consumption (2.5–3.5 Gcal/1,000 Nm3 H2), 2) CH4 fuel consumption (0.5–1.5 Gcal/1,000 Nm3 H2), 3) Steam export (0.3–0.8 Gcal/1,000 Nm3 H2), and 4) CO2 emission rate (around 800 kg CO2/1,000 Nm3 H2). The extra steam available in a SMR H2 plant is so useful as it can be utilised to run a carbon capture plant that often requires heat or electricity for sorbent regeneration.
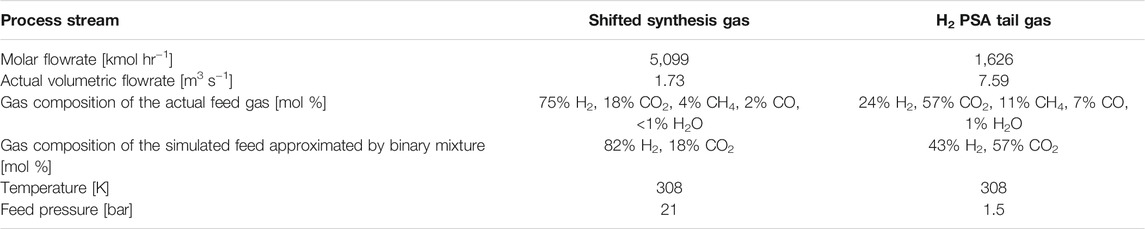
TABLE 1. Stream conditions of two VPSA feed gases in the SMR hydrogen plant at the production capacity of 6.8 ton H2/hr.
Among the three stream candidates, the flue gas has been ruled out on the grounds that its CO2 partial pressure is the lowest of three. Both syngas and tail gas are worth investigation as each of two has some distinctive features that make the gas favourable for CO2 capture. The syngas has the highest CO2 partial pressure of around 3 bara and the lowest actual gas volumetric flowrate. In contrast, the tail gas has the highest CO2 mole fraction of 0.57 and the lowest molar flowrate. It should be noted that the overall CO2 capture rate could increase from 59% to 90+% in case of the syngas capture case, as the decarbonised syngas can also be used as fuel in place of natural gas fuel (Ieaghg, 2017).
Several blue hydrogen projects have been commercialised successfully. The most eminent ones are Air Products’ Port Arthur project and Shell’s Quest CCS project, both of which capture CO2 from syngas. The Port Arthur project has captured 7 million tonnes of CO2 with a Vacuum Swing Adsorption process and used the CO2 for EOR since 2013. Quest CCS Project has captured over 5 million tonnes of CO2 with an amine process using ADIP-X solvent, a mixture of MDEA and piperazine, since 2015. CO2 capture from tail gas has also been developed at scales close to commercialisation. Japan’s Tomakomai project features a MDEA process with a capacity of 0.1 Mt CO2 per year. Air Liquide’s Port Jerome Project has developed a hybrid process comprising a cold box for CO2 liquefaction and a membrane unit for H2 recovery.
Among various CO2 capture processes considered for blue hydrogen production, it appears that adsorptive capture processes are the most harmonious with a hydrogen production plant in a sense that they may be able to produce pure hydrogen as well as pure CO2. Adsorption processes, once applied to syngas for CO2 capture, can be configured so as to produce a high purity of hydrogen as well as a high purity of CO2 (Sircar and Kratz, 1988; Streb and Mazzotti, 2020). Accordingly, a CO2 capture adsorption unit may be able to replace the existing H2 purification PSA in case of syngas capture, and it can also produce additional hydrogen product in case of tail gas capture as shown in Figure 2.
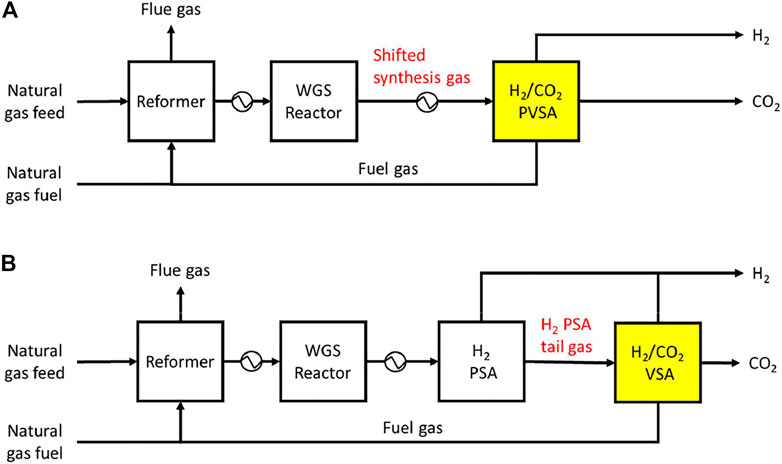
FIGURE 2. Block flow diagram of an SMR hydrogen plant integrated with a 5-step VPSA for CO2 capture: (A) syngas capture and (B) tail gas capture.
In this study it was aimed to carry out a feasibility study of cyclic adsorption processes for CO2 capture from the syngas and the tail gas. For the sake of simplicity, the process streams were approximated by a binary mixture of H2 and CO2 in which the other gases were replaced by hydrogen. The CO2 capture PSA design was based on a simple five-step VPSA cycle as shown in Figure 3. The CO2 capture PSA was analysed by Equilibrium Theory method, the mathematical model of which is delineated in the reference (Ruthven et al., 1994) and presented in Equilibrium Theory Model for PSA Analysis Section. As depicted in Figure 3, the five-step PSA unit has four effluents: pure H2, pure CO2, rinse step effluent and mixed gas. Accordingly, Figure 3 shows clearly where the four outlet streams are directed to. The two capture systems are to be designed by Equilibrium Theory and evaluated in terms of various performance indices for comparison.
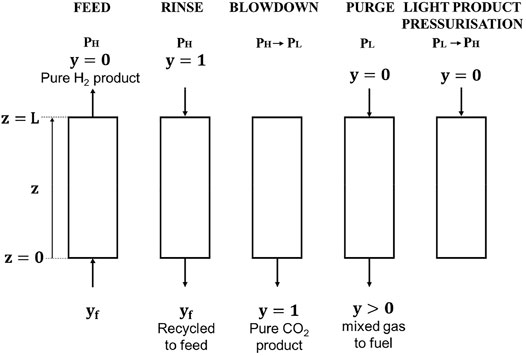
FIGURE 3. Step sequence of a five-step VPSA cycle for CO2 capture.
Mathematical Model
Adsorption Isotherm
In this study, activated carbon and zeolite 13X were chosen for selective adsorption of CO2 from the syngas and the tail gas, respectively. In designing a hydrogen purification PSA system of a SMR hydrogen plant (see Figure 1), activated carbons are often taken for the bottom layer near the column end that the feed gas is admitted to. This is because activated carbons own excellent CO2 adsorption capacities at the CO2 partial pressure in the feed (Ahn et al., 1999; Lee et al., 1999; Ahn et al., 2001). In contrast, zeolite 13X is deemed a benchmark adsorbent for capturing CO2 from a gas mixture around atmospheric pressure, for example, a flue gas composed mainly of N2 and CO2 (Krishnamurthy et al., 2014; Luberti et al., 2017; Ahn et al., 2020) and a synthesis gas generated by biomass gasification (Oreggioni et al., 2015). The CO2 isotherms of the two adsorbents are compared in Figure 4A. The CO2 isotherm on 13X is so close to an irreversible isotherm that it can capture large CO2 even at a very low CO2 partial pressure and the CO2 consumption for the rinse step would be very low. However, the 13X column is hard to regenerate unless it is evacuated to a very low pressure. The CO2 isotherm on the activated carbon is still favourable but way less irreversible than that on 13X, which imparts an excellent working capacity of CO2 without having to reduce the pressure so low for desorption.
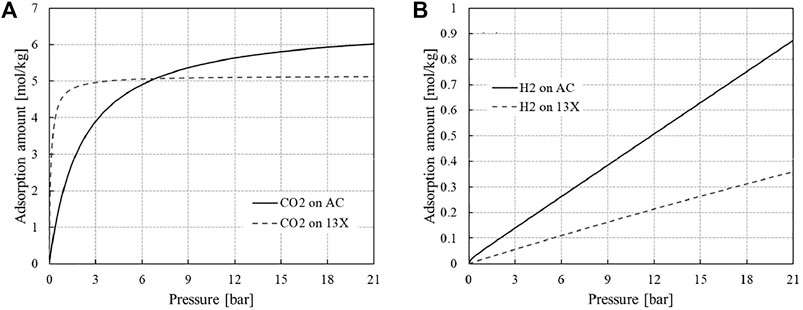
FIGURE 4. Equilibrium adsorption isotherms of (A) CO2 and (B) H2 on zeolite 13X and activated carbon at 308 K.
The dual-site Langmuir isotherm was taken to estimate the non-linear adsorption isotherm of CO2 on the activated carbon.
in which qAs1 = 6.611 mol kg−1, qAs2 = 0.011 mol kg−1, bA1 = 0.4762 bar−1, bA2 = 3.492 bar−1 at 308 K (Park et al., 2021).
The CO2 adsorption on the 13X was estimated by single-site Langmuir isotherm.
in which qAs = 5.145 mol kg−1, bA = 9.007 bar−1 at 308 K (Park et al., 2016).
In stark contrast, the equilibrium isotherms of hydrogen on both adsorbents are so close to linearity as shown in Figure 4B (Park et al., 2016; Park et al., 2021). In this study, the two hydrogen isotherms were approximated by linear isotherms by regressing the data over the range of measurement. The slopes of the fitted linear isotherms are 0.0421 mol kg−1 bar−1 and 0.0175 mol kg−1 bar−1 for activated carbon and 13X, respectively.
Equilibrium Theory Model for PSA Analysis
The PSA system with a rinse step shown in Figure 3 is the simplest step sequence for producing the heavy component at a very high purity during the blowdown step and the 5-step PSA system was analysed by Equilibrium Theory. The performance of a 5-step PSA working to separate a binary gas mixture can be estimated by Eqs 3a–9 that are derived and presented in the reference (Ruthven et al., 1994). In the mathematical expression, the strongly adsorbing component A’s adsorption equilibrium is allowed to be nonlinear while the weakly adsorbing component B’s adsorption isotherm must be linear with pressure or concentration. In addition to the general assumptions required for Equilibrium Theory, it was also assumed that the two adsorption isotherms are uncoupled. This model was developed under the limiting condition that a column is fully regenerated during the purge step for the sake of simplicity.
In order to estimate the product recovery, bed productivity and power consumption, it is crucial to estimate the total number of moles of the influent and effluent during each step. The equations for the quantities were all derived using Equilibrium Theory and they are listed below. Subscript I and O indicate influent and effluent, respectively.
• Feed step.
• Rinse step.
• Blowdown step.
• Purge step
• Light Product Pressurisation.
The product recoveries of H2 and CO2 are estimated by simply taking the mass balance around the column as follows:
The PSA system consumes power for evacuation of the column during the blowdown and purge steps and pressurisation of the rinse step’s effluent for its recycle to the feed. The power consumption for evacuation or compression was estimated by Eq. 10.
where F is gas flowrate (mol/s), R is gas constant (J/mol/K), T1 is inlet temperature (K), γ is volume exponent, P1 and P2 are inlet and outlet pressure of a vacuum pump or a compressor, and ηad is the adiabatic efficiency.
Results and Discussion
Process Design and Operation
The column diameter and length were estimated based on the same actual interstitial velocity of the feed gas and feed step time, 1 m/s and 600 s, respectively. Accordingly, it was also assumed that the cycle times of the two adsorption systems would be identical. The column diameter was found so as to meet the gas velocity condition, given the sum of the fresh and recycled gas feed flowrates. The column length was determined as the distance that the shock wave travels along the column during the feed step time. The pressure drop along the column at the feed step was estimated by Ergun equation. The calculation results for the two cases are juxtaposed in Table 2. The required column volume of the syngas case was around 1.5 times larger than that of the tail gas case, but the difference was mainly down to the difference of the adsorbent densities. The masses of adsorbents in a column are very similar to each other. The ratios of the pressure drop to the feed inlet pressure are 8 and 7% for the syngas and tail gas cases, respectively.
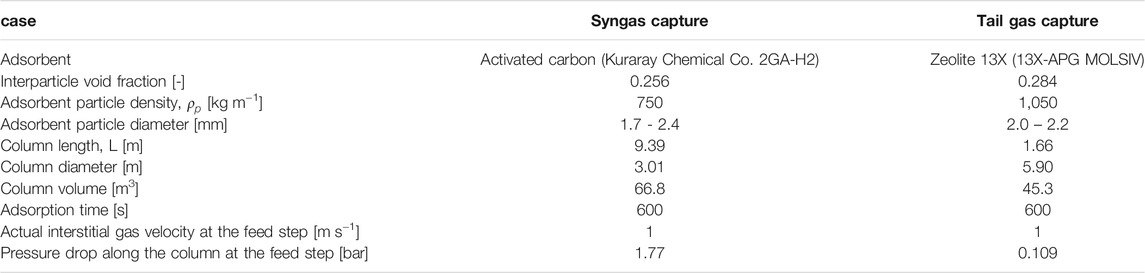
TABLE 2. Physical properties of the adsorbents and adsorption column design data (Park et al., 2016; Park et al., 2021).
Figure 5 shows a z-t diagram to depict clearly how the simple and shock waves move around the column during each step of the 5-step VPSA, and this diagram is valid for both capture cases. As expected, the characteristic lines are straight during the constant-pressure steps while they are curved during the pressure-varying steps. During the feed and rinse steps, shock waves propagate along the column from one end to the other end of the column. The simple wave at y = 0 reaches the column end during the purge step for complete regeneration. The gas leaving the column during the purge step is initially a pure heavy component, and the gas mole fraction decreases gradually to zero in case of complete regeneration. The performance may be improved by regenerating the column incompletely so that some of the heavy components still remain in the column at the end of the purge step. In Figure 5, X indicates the extent of purging, e.g., X = 1 for complete regeneration (Chiang, 1996; Ahn and Lee, 2020).
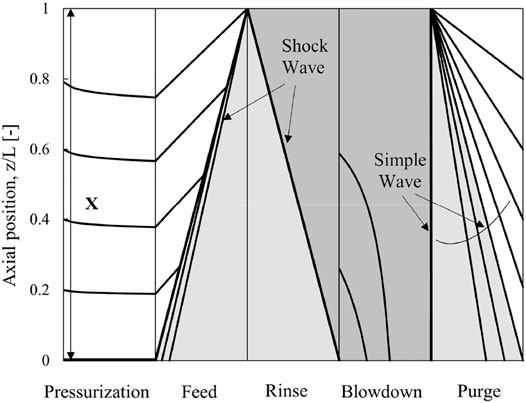
FIGURE 5. z-t diagram of a five-step VPSA process for syngas capture case. Lines represent the characteristics. The light grey area and the dark grey area indicate penetration of CO2 (0 < y < 1) and pure CO2 (y = 1), respectively.
Comparison of the Syngas and Tail Gas Capture Cases
Product Recovery and Bed Productivity: Effect of Desorption Pressure
It is desorption pressure that is the only operating variable considered in this study, with the other operating variables fixed at constant values. Figure 6 shows the effect of desorption pressure on the product recovery and bed productivity in the two capture cases. The H2 product recovery varies linearly with desorption pressure in both cases as shown in Figure 6A. The H2 recovery is estimated by Eq. 8 that is derived from the H2 mass balance around the column in a cycle. Among the terms in Eq. 8, only the moles of light product consumed for purging and pressurisation, NPI and NLI, are affected by desorption pressure. By rearranging Eq. 8, it turns out that only the pressure ratio, Ψ, is varied by changing the desorption pressure while the other terms’ values remain constant, which leads to the linear changes of H2 recovery with desorption pressure as shown in Figure 6A. The H2 recovery of the tail gas case is way too low, as the gas consumption for complete regeneration is so gigantic. The huge consumption of the purge gas is attributed to the CO2 isotherm on the 13X being nearly irreversible (Figure 4A). The desorption pressure has to be at least 0.07 bar, to have the H2 recovery positive. It may not be practical operating the process at such a low pressure from the industrial perspective. The tail gas contains much less hydrogen than the syngas, as around 90% of the hydrogen contained in the syngas is recovered as a high purity of hydrogen product at a hydrogen purification PSA (see Table 1). The adjusted H2 product recovery was also plotted in Figure 6A for the tail gas case, based on the total hydrogen product recovered by H2 PSA as well as CO2 VSA.
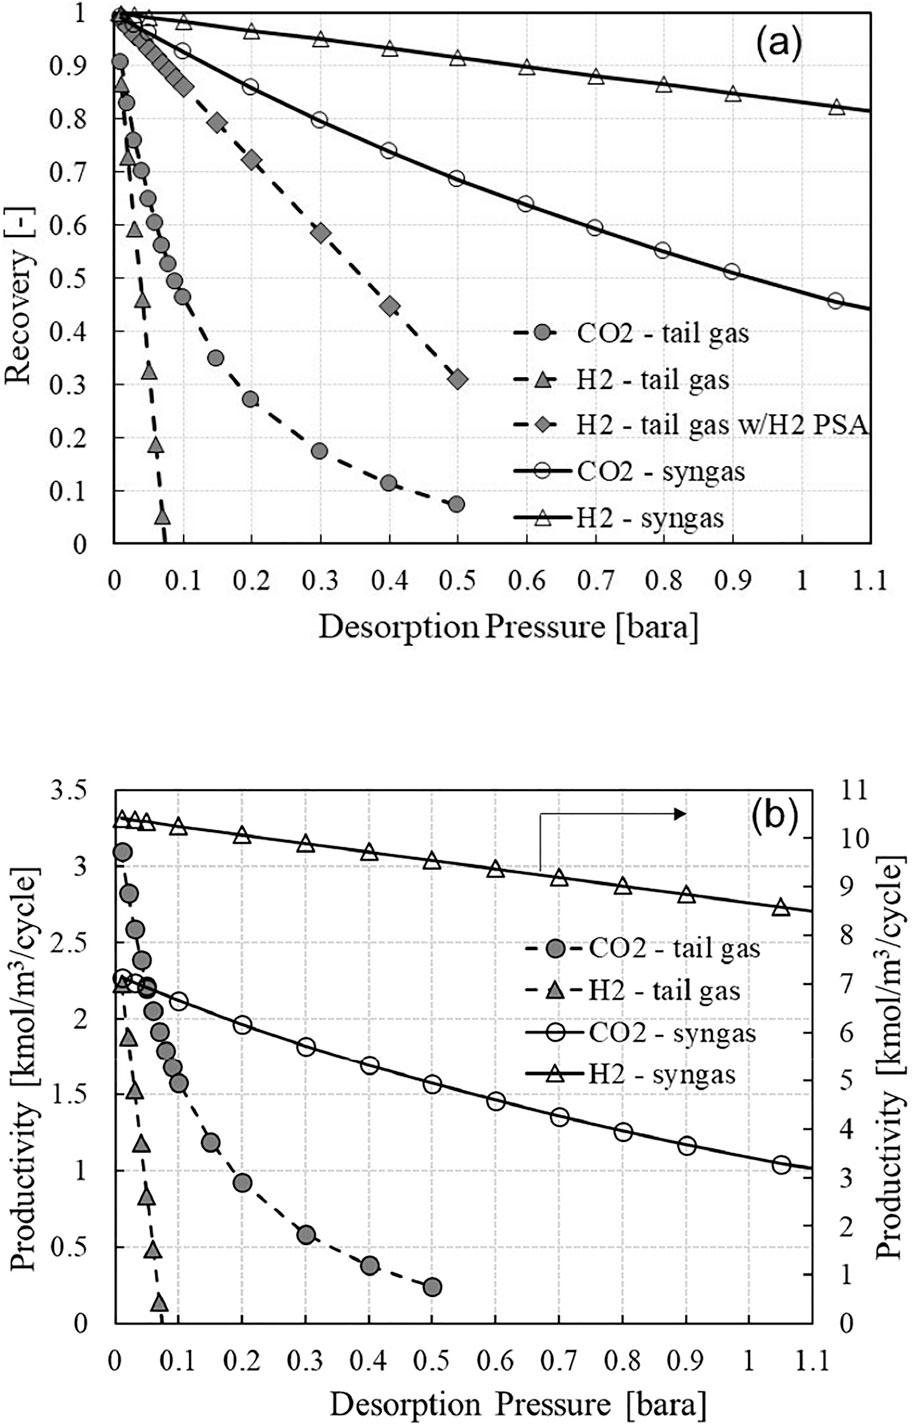
FIGURE 6. Effect of desorption pressure on (A) product recovery and (B) bed productivity.
As for CO2 product recovery, Eq. 9, the desorption pressure affects the amount of CO2 produced during the blowdown step, while the other quantities remain constant. The CO2 recovery relies on the amount of the CO2 being desorbed by depressurisation only, without using a purge gas. In this respect, the highly irreversible isotherm of CO2 on the 13X must be so disadvantageous, as it is very hard to desorb CO2 by reducing the pressure. The desorption pressure has to be decreased down to 0.01 bar to achieve 90% CO2 capture. In contrast, 92% CO2 capture is achievable at the desorption pressure of 0.1 bar in case of syngas capture.
The effect of desorption pressure on the bed productivity (Figure 6B) is by and large similar to its effect on the product recovery (Figure 6A). It should be noted that the CO2 molar flowrates in the two feeds are almost the same as each other, whilst the H2 molar flowrate of the syngas is six times larger than that of the tail gas. Such a high bed productivity with respect to hydrogen in the syngas case can be explained by the very large difference of H2 flowrate. At very low desorption pressures up to 0.05 bara, the bed productivity with respect to CO2 in the tail gas case is superior to that in the syngas case. But this is merely down to the difference of two bed volumes, and the two CO2-based bed productivities must be comparable to each other if they were expressed with respect to adsorbent mass instead of volume. At the desorption pressures being greater than 0.05 bara, the syngas case exhibits far greater bed productivity with respect to CO2.
Energy Consumption
Figure 7 shows the specific power consumptions of the 5-step VPSA with the desorption pressure ranging from 0.01 to 0.6 bara. The power consumption for pressurising the CO2 gas needed for the rinse step remains constant regardless of desorption pressure. However, the power consumptions for pulling a vacuum during the blowdown and purge steps vary greatly with the desorption pressure. The adiabatic efficiencies for gas compression and evacuation were fixed at 0.8, while they may need to be adjusted to different values that the manufacturers provide for specific machines, particularly in case of a vacuum pump running at a very low vacuum pressure. The total specific power consumption of the syngas case is relatively low, decreasing monotonously from 1.1 to 0.4 MJ/kg CO2 with the desorption pressure. In stark contrast, the total specific power consumption of the tail gas case reaches its minimum value of 0.7 MJ/kg CO2 at 0.02 bara, and it increases rapidly with desorption pressure, mainly due to the drastic decrease of the CO2 recovery. In general, the syngas case is superior to the tail gas case in terms of specific power consumption except for the very low desorption pressures below 0.05 bar.
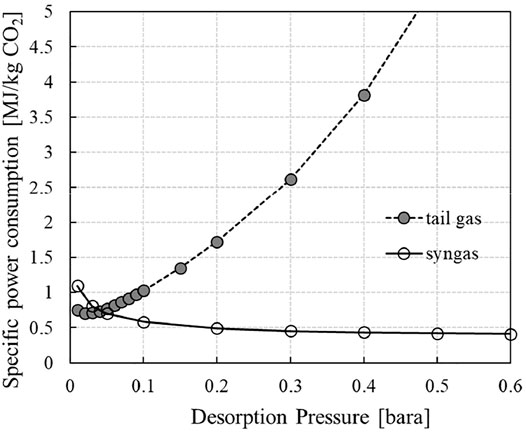
FIGURE 7. Effect of desorption pressure on specific power consumption.
It is interesting to compare the energy consumption between the CO2 capture VPSA and an MDEA absorption process, as MDEA is one of the most conventional solvents taken for selective CO2 removal from a feed gas with a relatively high CO2 partial pressure. MDEA is one of the components of the ADIP solvent taken for Shell’s Quest CCS project where CO2 is captured from a high pressure syngas, and the amine solvent was also chosen in the Japan’s Tomakomai project where CO2 is captured from the PSA tail gas. The process configuration of a MDEA capture plant is similar to those of physical solvent capture plants, such as Selexol process (Kapetaki et al., 2015). The rich solvent leaving the absorber is regenerated by two different mechanisms: depressurisation and steam stripping. In case of the absorber working at a high pressure, the entire rich solvent is admitted to flash drums where CO2 is partially desorbed. The liquid stream leaving the flash drum is the semi-lean amine. The semi-lean solvent is split into two sub-streams. One is returned to the absorber in the middle, while the rest is regenerated more thoroughly by steam stripping. The lean amine leaving the stripper is fed to the absorber on the top. Therefore, a MDEA process spends both electricity and heat, and the total energy consumption varies with the semi-lean amine recycle ratio, i.e., the ratio of the semi-lean amine being recycled back to the absorber to the total semi-lean amine leaving the flash drum.
In this study, an amine process using 40wt% aqueous MDEA solvent was simulated to estimate its energy consumption for two cases where CO2 is captured from either the syngas or the tail gas at their actual compositions listed in Table 1. The process simulations were carried out with Honeywell UniSim R461.1 and its associated DBRamine package. In this simulation, the absorber and stripper were designed to have sufficient numbers of stages and large diameters so that the rich and lean loading could not be enhanced notably by increasing the number of stages further. In other words, the absorption system designed in this study can be considered as a limiting case where its performance is controlled by vapour-liquid equilibrium only, similarly to those of the adsorptive capture systems designed by Equilibrium Theory in this study.
Figure 8 shows the energy consumption of the two MDEA processes working to capture CO2 from either syngas or tail gas. The energy consumption in terms of specific work consumption is affected greatly by the split ratio of the semi-lean amine between recycle to the absorber and steam stripping. It was found that the optimal ratio of the semi-lean recycle to the total semi-lean would be around 0.92, in other words, only 8% of the semi-lean solvent being directed to the stripper. The optimal semi-lean amine recycle ratio may vary slightly depending on what heat-to-work conversion factor to use. In this study, the reboiler heat of low pressure steam was converted to the equivalent work with the conversion factor of 0.3 (Ahn et al., 2013). At the optimal recycle ratio, the specific work consumption was as low as 0.35 MJ/kg CO2. Therefore the two capture processes are expected to incur the energy consumptions similar to each other in case of syngas capture.
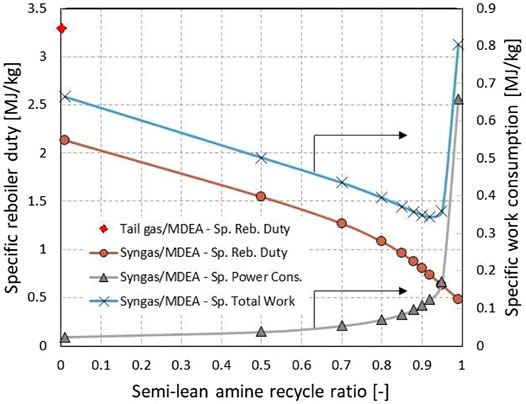
FIGURE 8. Energy consumption of a 40wt% aqueous MDEA process in case of CO2 capture from the syngas or tail gas under equilibrium-controlled condition.
For the low pressure tail gas, the absorption process was designed so that the rich amine was regenerated by steam stripping only. The specific reboiler duty of the tail gas capture was estimated around 3.3 MJth/kg CO2, greater than 2.2 MJth/kg CO2 of the syngas capture case at the semi-lean recycle ratio set to zero. The difference of the reboiler duties is mainly down to the difference of the CO2 partial pressure in the feed that results in different rich loading. In case of the tail gas feed, the VPSA may be competitive over the MDEA unit if the desorption pressure is set as low as less than 0.05 bara.
Conclusions and Future Work
A Pressure Swing Adsorption process incorporating a rinse step has been studied to decarbonise a conventional SMR H2 plant by capturing CO2 from either the synthesis gas or the H2 PSA tail gas. For the sake of quick feasibility study, the 5-step VPSA system was analysed by Equilibrium Theory without conducting complex numerical simulation. As a result of the analysis, it was found out that the shifted synthesis gas would be by and large more advantageous than the tail gas with respect to product recovery, bed productivity and power consumption, unless the VPSAs would be operated at an impractically low desorption pressure, i.e., less than 0.05 bara. The energy consumption of the VPSA was estimated as low as those of the MDEA units with the CO2 recovery greater than 90%.
The VPSA designed for syngas capture is similar to the Gemini process’s A beds in that they work for CO2 capture, while the two systems are different in terms of regeneration and repressurisation methods (Sircar and Kratz, 1988). The 5-step VPSA can be easily expanded to function to produce pure hydrogen as well as pure CO2 by its integration with another adsorption cycle for hydrogen purification. In this respect, the existing H2 PSA can be repurposed so that it can perform CO2 capture as well as H2 purification.
The theoretical model taken for PSA analysis in this study was so simple to use and the PSA performance was estimated effortlessly. But the PSA design/operation and adsorption dynamics that the model considered may not reflect the actual situation exactly. The Equilibrium Theory model will be developed further so as to enhance its accuracy and reliability, by considering incomplete regeneration, coupled isotherm, pressure equalisation steps, etc.
Data Availability Statement
The raw data supporting the conclusions of this article will be made available by the authors, without undue reservation.
Author Contributions
YC: Equilibrium Theory calculation, wrote the mathematical model section, collected the data HA: Conceived and designed the analysis, wrote the paper, collected the data, performed the analysis, MDEA simulation.
Funding
This work was supported by the United Kingdom Engineering and Physical Sciences Research Council (EPSRC) grant EP/J018198/1. HA and YC. are grateful for funding from Birse Trustees to support the PhD study at the University of Edinburgh.
Conflict of Interest
The authors declare that the research was conducted in the absence of any commercial or financial relationships that could be construed as a potential conflict of interest.
Publisher’s Note
All claims expressed in this article are solely those of the authors and do not necessarily represent those of their affiliated organizations, or those of the publisher, the editors and the reviewers. Any product that may be evaluated in this article, orclaim that may be made by its manufacturer, is not guaranteed or endorsed by the publisher.
References
Ahn, H., Hong, S.-H., Zhang, Y., and Lee, C.-H. (2020). Experimental and Simulation Study on CO2 Adsorption Dynamics of a Zeolite 13X Column during Blowdown and Pressurization: Implications of Scaleup on CO2 Capture Vacuum Swing Adsorption Cycle. Ind. Eng. Chem. Res. 59, 6053–6064. doi:10.1021/acs.iecr.9b05862
Ahn, H., Lee, C.-H., Seo, B., Yang, J., and Baek, K. (1999). Backfill Cycle of a Layered Bed H(2)PSA Process. Adsorption-Journal Int. Adsorption Soc. 5, 419–433. doi:10.1023/a:1008973118852
Ahn, H., and Lee, J. H. (2020). Equilibrium Theory Analysis of Vacuum Swing Adsorption for Separation of Ethanol from CO2 in a Beverage Dealcoholization Process. Ind. Eng. Chem. Res. 59, 21948–21956. doi:10.1021/acs.iecr.0c04768
Ahn, H., Luberti, M., Liu, Z., and Brandani, S. (2013). Process Configuration Studies of the Amine Capture Process for Coal-Fired Power Plants. Int. J. Greenhouse Gas Control. 16, 29–40. doi:10.1016/j.ijggc.2013.03.002
Ahn, H., Yang, J., and Lee, C.-H. (2001). Effects of Feed Composition of Coke Oven Gas on a Layered Bed H(2)PSA Process. Adsorption-Journal Int. Adsorption Soc. 7, 339–356. doi:10.1023/a:1013138221227
Chiang, A. S. T. (1996). An Analytical Solution to Equilibrium PSA Cycles. Chem. Eng. Sci. 51, 207–216. doi:10.1016/0009-2509(95)00267-7
Ieaghg (2017). Technical Report 2017-02 Techno-Economic Evaluation of SMR Based Standalone (Merchant) Hydrogen Plant with CCS. Cheltenham, United Kingdom: IEAGHG.
Kapetaki, Z., Brandani, P., Brandani, S., and Ahn, H. (2015). Process Simulation of a Dual-Stage Selexol Process for 95% Carbon Capture Efficiency at an Integrated Gasification Combined Cycle Power Plant. Int. J. Greenhouse Gas Control. 39, 17–26.
Krishnamurthy, S., Rao, V. R., Guntuka, S., Sharratt, P., Haghpanah, R., Rajendran, A., et al. (2014). CO2capture from Dry Flue Gas by Vacuum Swing Adsorption: A Pilot Plant Study. Aiche J. 60, 1830–1842. doi:10.1002/aic.14435
Lee, C.-H., Yang, J., and Ahn, H. (1999). Effects of Carbon-To-Zeolite Ratio on Layered Bed H2 PSA for Coke Oven Gas. Aiche J. 45, 535–545. doi:10.1002/aic.690450310
Luberti, M., Oreggioni, G. D., and Ahn, H. (2017). Design of a Rapid Vacuum Pressure Swing Adsorption (RVPSA) Process for post-combustion CO2 Capture from a Biomass-Fuelled CHP Plant. J. Environ. Chem. Eng. 5, 3973–3982. doi:10.1016/j.jece.2017.07.029
Oreggioni, G. D., Brandani, S., Luberti, M., Baykan, Y., Friedrich, D., and Ahn, H. (2015). CO2 Capture from Syngas by an Adsorption Process at a Biomass Gasification CHP Plant: Its Comparison with Amine-Based CO2 Capture. Int. J. Greenhouse Gas Control. 35, 71–81. doi:10.1016/j.ijggc.2015.01.008
Park, Y., Ju, Y., Park, D., and Lee, C.-H. (2016). Adsorption Equilibria and Kinetics of Six Pure Gases on Pelletized Zeolite 13X up to 1.0 MPa: CO2, CO, N2, CH4, Ar and H2. Chem. Eng. J. 292, 348–365. doi:10.1016/j.cej.2016.02.046
Park, Y., Kang, J.-H., Moon, D.-K., Jo, Y. S., and Lee, C.-H. (2021). Parallel and Series Multi-Bed Pressure Swing Adsorption Processes for H2 Recovery from a Lean Hydrogen Mixture. Chem. Eng. J. 408, 127299. doi:10.1016/j.cej.2020.127299
Scottish Government (2020a). Scottish Government Hydrogen Policy Statement. Available at: https://www.gov.scot/publications/scottish-government-hydrogen-policy-statement/pages/12/.
Scottish Government (2020b). Scottish Hydrogen: Assessment Report [Online]. Available at: https://www.gov.scot/publications/scottish-hydrogen-assessment-report/(Accessed.
Sircar, S., and Kratz, W. C. (1988). Simultaneous Production of Hydrogen and Carbon Dioxide from Steam Reformer Off-Gas by Pressure Swing Adsorption. Separat. Sci. Technol. 23, 2397–2415. doi:10.1080/01496398808058461
Soltani, R., Rosen, M. A., and Dincer, I. (2014). Assessment of CO2 Capture Options from Various Points in Steam Methane Reforming for Hydrogen Production. Int. J. Hydrogen Energ. 39, 20266–20275. doi:10.1016/j.ijhydene.2014.09.161
Streb, A., and Mazzotti, M. (2020). Novel Adsorption Process for Co-production of Hydrogen and CO2 from a Multicomponent Stream-Part 2: Application to Steam Methane Reforming and Autothermal Reforming Gases. Ind. Eng. Chem. Res. 59, 10093–10109. doi:10.1021/acs.iecr.9b06953
Voss, C. (2014). CO2 Removal by PSA: an Industrial View on Opportunities and Challenges. Adsorption 20, 295–299. doi:10.1007/s10450-013-9574-8
Nomenclature
b Langmuir isotherm parameter, bar−1
N Total moles of either influent or effluent during a step, mol
P Pressure, bar Purge step
q Adsorbed amount, mol kg−1
qs Saturation adsorption amount, mol kg−1
t Time, s
z Axial position, m
Greek Symbols
Subscripts
A Heavy component, CO2
B Light component, H2 or Blowdown step
F Feed step
I Influent
L Column length, m Light product pressurisation step
O Effluent
P Pressure, bar Purge step
R Rinse step
Keywords: CO2 capture, equilibrium theory, hydrogen plant, pressure swing adsorption, synthesis gas, PSA tail gas, energy consumption, MDEA process
Citation: Chen Y and Ahn H (2021) Feasibility Study of Vacuum Pressure Swing Adsorption for CO2 Capture From an SMR Hydrogen Plant: Comparison Between Synthesis Gas Capture and Tail Gas Capture. Front. Chem. Eng. 3:742963. doi: 10.3389/fceng.2021.742963
Received: 17 July 2021; Accepted: 04 November 2021;
Published: 01 December 2021.
Edited by:
Moises Bastos-Neto, Federal University of Ceara, BrazilReviewed by:
Rui P.P.L. Ribeiro, New University of Lisbon, PortugalLuca Riboldi, Norwegian University of Science and Technology, Norway
Giorgia Mondino, SINTEF Industry, Norway
Copyright © 2021 Chen and Ahn. This is an open-access article distributed under the terms of the Creative Commons Attribution License (CC BY). The use, distribution or reproduction in other forums is permitted, provided the original author(s) and the copyright owner(s) are credited and that the original publication in this journal is cited, in accordance with accepted academic practice. No use, distribution or reproduction is permitted which does not comply with these terms.
*Correspondence: Hyungwoong Ahn, SC5BaG5AZWQuYWMudWs=