- Energy and Buildings Research Center, Kuwait Institute for Scientific Research, Kuwait City, Kuwait
Hydrogen as a chemical fuel and energy carrier can provide the path to solar energy storage to overcome the intermittency issues. Hydrogen can be produced by various methods; among them is the thermochemical water splitting of metal/metal oxide reduction oxidization (redox) reactions. Many redox cycles were identified, including the non-volatile redox pair, such as the iron/iron oxide. This redox pair has the capability to produce Hydrogen with rapid reaction rates especially when it is used in powder form due to the high specific reactive surface area. Yet, this pair suffers from sintering at temperatures exceeding 500°C. Sintering adversely affects the Hydrogen production process and inhibits the recycling of the powder. To overcome sintering, experimental investigations using elemental iron and silica were conducted as detailed in this paper. The oxidation of elemental iron (Fe) powder by steam to produce Hydrogen was carried out using a fluidized bed reactor. The investigations aimed at developing a practical sintering inhibition technique that can allow repeated redox cycles, stabilize the powder reactivity, and maintain Hydrogen production. The experimental investigations involved varying the fluidized bed temperature between 630–968°C. The steam mass flow rate was set to 2 g/min. To inhibit sintering, solid-state mixing of crystalline, or amorphous silica with porous iron powder was used at various iron/silica volume fractions. The investigations showed that mixing iron with silica hinders the sintering but reduces the Hydrogen yield. Mixing iron with crystalline silica with 0.5, 0.67, and 0.75 apparent volume fraction reduces the Hydrogen yield compared to pure iron by 20, 30, and 45%, respectively. Mixing iron with amorphous silica reduces the Hydrogen yield by 35 and 45%, as compared to pure iron, for iron 0–250 and 125–355 µm particle size distribution, respectively. The Hydrogen production rate for iron/amorphous silica mixtures surpassed that of the iron/crystalline silica. Mixing iron with amorphous silica prevented sintering at elevated bed temperatures in the range of 850°C, and only clumping occurred. The clumped samples restored their original powder condition with minimum agitation. Thus, solid-state mixing of amorphous silica with iron powder can be a promising technique to retard iron/iron oxide particles sintering.
Introduction
Hydrogen is abundantly available in the Universe in its non-elemental form due to its reactivity. Sources of Hydrogen include water and hydrocarbons. To recover Hydrogen from its available resources, various methods are developed. Some of these methods are commercially available such as steam methane reformation (SMR), and others are still in research and development. In 2024, the global Hydrogen market is anticipated to reach USD191.8 billion with a total production volume of 122.58 million tonnes. While the current main four production processes include natural gas steam reforming, oil partial oxidation, coal gasification, and water electrolysis, the first two held the highest market share in 2019. The global Hydrogen market can be segmented into five regions: Asia-Pacific, Europe, North America, Middle East and Africa, and Central and South America. Asia-Pacific produced the largest share of Hydrogen in 2019, followed by Europe (GlobeNewswire, 2020).
Hydrogen that is produced by using fossil fuels is referred to as grey Hydrogen. If Hydrogen is produced using non-renewable energy sources, such as fossil fuels and nuclear, while meeting the low-carbon threshold (CO2 management), then it is referred to as blue Hydrogen (CertifHy Canada Inc., 2020; Giovannini, 2020; Cloete et al., 2021; Woodside, 2021).
In 2019, it was reported that 70 million tons of Hydrogen are produced and used in several applications, including ammonia and ethanol production, oil refining, and transportation fuel (Ogden, 1999;Roberts, 2018).
Recently interest in Hydrogen as an energy carrier and feedstock increased as a solution for decarbonization. In countries where solar energy is abundant and because of the decline of the cost of solar energy technologies, green Hydrogen (produced by using renewable energy) is being evaluated, and several projects and feasibility assessments are being conducted. Other countries are going through a transitional stage in which blue Hydrogen production is being considered or even actually produced (Gielen et al., 2019).
Direct thermal water splitting is one of the Hydrogen production processes. This method requires extremely high temperatures, around 2,227°C, to dissociate water into H2 and O2. Thermochemical water splitting (TCWS) through secondary reactions of reactive metals/metal oxides enables water splitting at lower temperatures (Neises et al., 2008; Sattler et al., 2017). This method can split water into its elemental constituents, Hydrogen, and oxygen through reduction and oxidation (redox) cycles of some reactive metals/metals’ oxides. But this method faces several challenges including, material stability issues, hazardous or corrosive reactants, and/or products. These challenges necessitate the need for materials that can withstand corrosive environments and high temperatures above 1,000°C (Abanades, 2019; Hossain et al., 2019). The high temperature required for redox cycles can be either provided by utilizing nuclear energy or renewable energy sources. The latter can provide a pathway for green Hydrogen production. When renewable energy is used, redox pairs can be placed in reactors that are placed at the focal point of a solar-thermal power towers or a parabolic dish (Agrafiotis et al., 2007). The German Aerospace Center (DLR) developed reactors in which honeycomb ceramic structures coated with active redox material of metal oxides powders were placed in a solar receiver that is mounted at the focal point in a solar-thermal power tower located in Cologne, Germany (Roeb et al., 2006; Neises et al., 2008). Kodama developed a solar chemical reactor with an internally circulating fluidized bed irradiated from the top using concentrated solar power (Kodama and Gokon, 2007; Gokon et al., 2008; Xiao et al., 2012).
Nuclear power plants (NPP) can be used to provide heat for thermochemical water splitting. The outlet temperature of the nuclear high temperature reactor (HTR) and very high temperature reactors (VHTRs) ranges between 850 and 1,000°C. Therefore, the thermal energy generated in the nuclear reactor can be transferred through a specialized heat exchanger to provide the required heat for the thermochemical water-splitting process. One example of TCWS cycles that can be used with nuclear reactor heat is the sulfur-iodine (S-I) three steps cycle in which the temperature ranges between 120 and 800°C. Another example is the three-step copper-chlorine (Cu-Cl) cycle that requires 600°C (Verfondern, 2007; Jaszczur et al., 2016).
TCWS cycles have the potential to deliver overall system efficiencies above 40% (T-Raissi, 2003). Various thermochemical cycles can be used to split water and ultimately produce Hydrogen. Over 350 cycles were identified (Charvin et al., 2006; Charvin et al., 2008). Safari and Dincer evaluated a four-step water splitting using iron-chlorine (Fe-Cl) cycle. They have modeled the cycle using the Aspen Plus software package and conducted parametric studies to assess the effect of pressure, temperature, and steam to feed ratio on reaction products and conversion rates (Safari and Dincer, 2020). Abanades et al. screened water splitting cycles available in the literature that are suitable for utilization with solar energy. They have established a database for 280 cycles. Based on set criteria and aiming at reducing the number of cycles to a manageable number, 30 solar-driven water-splitting thermochemical cycles were identified. The operating temperature of the cycles ranged between 400 and 2,000°C. Since at higher temperatures, the cost and availability of process chemicals will be a concern, the maximum temperature was limited to 2,000°C (Abanades, 2019).
In general, the TCWS cycles are represented by the following equations (André et al., 2017; Villafán-Vidales et al., 2019):
M refers to the used metal, and MO refers to the corresponding metal oxide. The first step, reduction, represents the solar dissociation of the metal oxide to a lower-valence metal oxide or elemental metal. The second step is an exothermic hydrolysis reaction with a metal in which H2 is liberated, and a corresponding metal oxide is formed (Steinfeld, 2002). Both steps require high temperatures, usually exceeding 227°C, depending on the reactive metal.
Several cycles were thermodynamically examined and tested in solar reactors, including zinc and its oxides (ZnO/Zn) and iron oxide (Fe3O4/FeO) redox pairs. Other redox pairs such as titanium oxide (TiO/TiOx), Cobalt Oxide (Co3O4/CoO), and Manganese Oxide Mn3O4/MnO have been considered, but the yield of Hydrogen production is too low (Steinfeld, 2002; Milliken, 2007; Kreider et al., 2011). Of particular interest is non-volatile iron oxide redox pairs (Fe3O4/FeO). Iron (Fe) oxides are widely available, cheap, nontoxic, and can provide high pure Hydrogen yield. The TCWS using iron oxides can be realized through the following reactions:
Iron oxide used in the TCWS can be in various forms and structures, including powder, rod, and monolithic structures. If a powder is used, it can be either in a fixed or a fluidized bed reactor. The latter can provide higher reactivity, hence more Hydrogen yield, due to the increased surface area of the powder. Yet this method is faced with the challenge of the iron powder particles sintering (cohesion/agglomeration). During sintering, the particles start to join by forming necks leading to powder densification. This densification is a result of the elimination of internal pores and voids. As a result, particle fluidization and Hydrogen yield in repetitive reactions’ cycles will be negatively affected.
In an attempt to reduce sintering in fluidized bed reactors and avoid attrition, admixtures of catalysts and sintering inhibitors (usually ceramics) are used. Corradi and Ceresa, and Olsen studied inhibiting sintering of iron oxide particles by coating with SiO2 to study its effect on magnetic properties. They have concluded that coating with silica improves the resistance to temperature effects hence, retarding sintering (Ceresa, 1979; Olsen, 1986). Clavenna et al. opined that zirconia, particularly yttria-stabilized zirconia (YSZ), demonstrate superior agglomeration resistance and resist attrition (erosion) at extremely high temperatures of 1,500 and 1,600°C (Clavenna et al., 1995). They have found that an admixture of catalytically active metal and YSZ can hinder sintering. They recommend that admixtures consist of YSZ and a catalyst. The YSZ particle diameter should range between 30–150 µm and represent 80–99.5% of the total sample weight. The catalyst weight range should be between 0.5–20% of the total sample weight. Al-Raqom and Klausner evaluated mixing iron and zirconia (ZrO2). They have found that the efficacy of zirconia as a sintering inhibitor was found to be dependent on the iron and zirconia mean particle size, particle size distribution and iron/zirconia apparent volume ratio. Mixing iron powder with ZrO2 realized 3–7% sintering only for bed temperatures ranging between 867 and 895°C. The Hydrogen production rate realized by oxidizing the Fe/ZrO2 mixture was not affected when compared to pure iron powder oxidation (Al-Raqom and Klausner, 2014). Lei et al. evaluated the influence of MgO coating to prevent the sintering of Fe2O3 particles in a fluidized bed. They considered different coating methods, including briquetting-sintering, powder method, slurry-sintering, and high-temperature injection. Briquetting-sintering and high-temperature injection are complicated processes and require high operating costs. All the evaluated methods prevented agglomeration of Fe2O3 and realized 1 h of fluidization time. The simplest and most cost-effective method was the powder method, which involved solid-state mixing of MgO and Fe2O3 powders (Guo et al., 2015). Other researchers explored the option of depositing iron/iron oxide on honeycomb structures to hinder sintering. But the coated layer formed by the deposited iron/ion oxide can suffer from spallation with continuous reactions (Bobek et al., 2012; Mei et al., 2013; Stehle et al., 2015).
This work was carried out to explore a practical (simple and cost-effective) technique that can inhibit sintering in the iron/iron oxide thermochemical water splitting cycle for Hydrogen production. The research described evaluates using silica of two different structures (crystalline and amorphous) as sintering inhibitors with iron/iron oxide powders. The scope of the experimental work is focused on the solid-state mixing of silica (crystalline and amorphous) and iron/iron oxide powders.
Methods
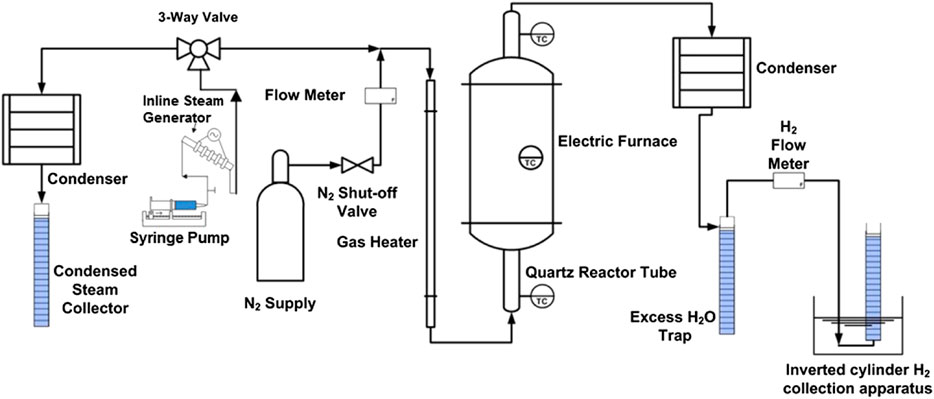
An experimental testing facility was developed to investigate the reactivity of the various iron/sintering-inhibitor powder combinations. The facility was constructed and operated at the University of Florida, Gainesville, United States. The experimental facility diagram is shown in Figure 1.
A vertical electric furnace obtained from MTI corporation is used for the experiment. A fused quartz tube extends through the electric furnace. The tube is 0.6 m long with a 21 mm inner diameter. The electrical furnace controllable operational range is continuous for a temperature range of 100–1100°C and can go as high as 1200°C for an operational time of less than 1 h. The furnace heating rate is 10°C/minute and is equipped with a built-in proportional–integral–derivative (PID) controller with 30 programmable segments (+/− 1°C accuracy).
The powder is placed in the quartz tube and supported by a distributor made of a ceramic thermal insulation material that withstands temperatures up to 1650°C. The powder is then fluidized by superheated steam, which is partially used for Hydrogen production. The outlet gas from the reactor is directed through a condenser, in which excess steam is condensed from the Hydrogen gas flow. This condenser is emptied into a sealed cylinder (water trap) to collect the condensate. The Hydrogen gas is then directed into a flow meter and then to an inverted water-filled, graduated cylinder. The rate of Hydrogen production is recorded by the flow meter. Hydrogen volume is visually logged by the amount of displaced water in the graduated cylinder at normal conditions NTP (Normal Temperature and Pressure; 20°C and 101 kPa). The rate of Hydrogen production is recorded by an Alicat M-series mass flow meter (Alicat Scientific, Tucson, AZ, United States) with an operating range of 0–5 standard liters per minute (sLPM) and uncertainty of +/− 0.8% of reading plus 0.2% of full scale.
K-type stainless-steel sheathed thermocouples are used to monitor and record temperatures of the gas entering, exiting the quartz reactor chamber and the fluidized bed. A national instruments data acquisition board, NI USAB-6225 (National Instruments, Austin, TX, United States), is used to collect the thermocouples and flow meters voltage signals. A LabVIEW virtual instrument is used to observe, control, and collect the experimental data.
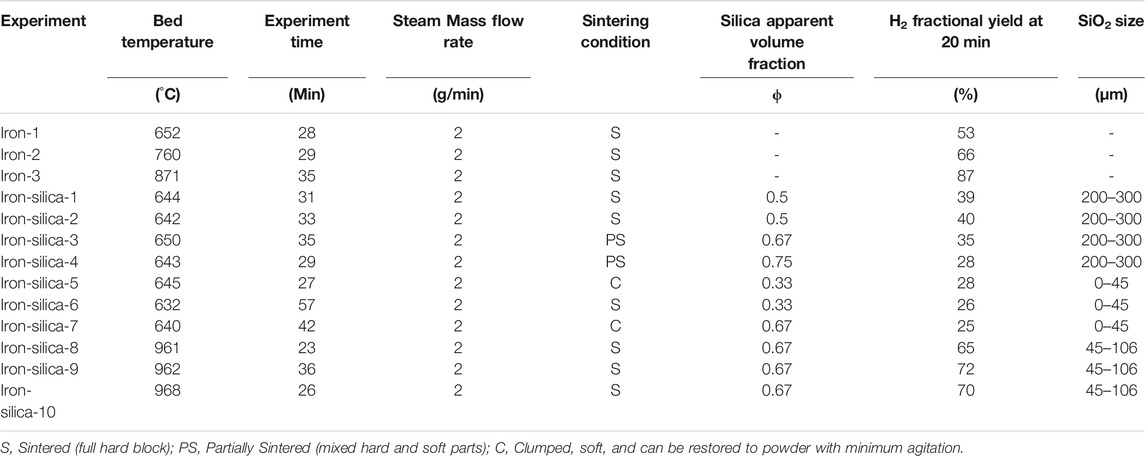
A few initial runs are conducted for each set of tests, including reacting fresh iron powder as a base case to compare against. The base case temperatures are set at 650 and 950°C. Table 1 lists the bed temperature that is indicative of the reaction temperature.
The used iron powder, Ancor MH-100 (GKN Hoeganaes Corporation, Cinnaminson, New Jersey, United States), is 99.56% pure and porous with a mean particle size of 98 μm and a wide particle size distribution (0–250 μm). Each sample included 25 g (9 ml) of iron powder.
To inhibit sintering, silica, both crystalline and amorphous silica were used. The crystalline silica was obtained from US Silica, Katy, TX, United States. The amorphous silica, known as Diatomaceous Earth (DE), was from Natures Wisdom LLC, Prosper, TX, United States. Crystalline Silica (SiO2) is regarded as an effective anti-sintering agent (Olsen, 1986). Crystalline silica in the iron/silica mixture apparent volume fractions (Φ) is 0.33, 0.5, 0.67, and 0.75. The crystalline silica particle size distribution included three sets, 0–45, 45–106, and 200–300 μm. The amorphous silica in the iron/silica mixture represented 0.67 volume fraction, and 25 g of iron powder is used in two sets 0–250 and 125–355 µm to evaluate the effect of the particle size distribution on sintering. The experimental investigations’ details are listed in Tables 1, 2 for crystalline silica and amorphous silica, respectively.
The main focus of this work is on the oxidation step since upon the reaction of iron and steam, iron picks up mass (oxygen) and form iron oxide. This addition of mass at high temperatures causes sintering. The oxidation step of the reaction was carried out using crystalline and amorphous silica. One complete cycle that involved oxidation, reduction, and then oxidation was carried out to assess the recyclability of the iron/silica mixture.
Before each experiment, the experimental setup was purged with nitrogen. The nitrogen flow is initiated through the reactor with a volumetric flow rate of 1.5 sLPM to purge the system. The nitrogen flow continues till the desired bed temperature is reached. After that, the superheated steam is introduced to the powder at 2 g/min for a duration that is shown in Tables 1, 2. The experiments were terminated when the Hydrogen production seized. The purging procedure is followed before and after each experiment.
To ensure that the powder mixture is fluidized, the steam was introduced at a mass flow rate of 2 g/min (13 cm/s velocity). This velocity exceeds the minimum fluidization velocity of the iron powder and silica. The Minimum fluidization velocity shown in Table 3 was obtained using the following equation (Babu et al., 1978):
Where:
Umf: Minimum fluidization velocity
dp: Mean particle diameter (m)
µf: Fluid (steam) dynamic viscosity (kg/m.s)
ρf: Fluid density (kg/m3)
ρp: Particle density (kg/m3)
Ar: Archimedes number,
In the reduction step, iron oxide formed in the oxidation step is reduced to elemental iron. The reduction reaction shown in Eq. 3 is achieved at a very high temperature exceeding 1500°C. Thus, to maintain the powder form and prevent further sintering that will occur if the iron oxide is reduced at high temperature (1500°C), a reduction agent Carbon Monoxide (CO) was used to lower the reaction temperature. This allowed for the reduction step to be carried out at 850°C. The CO was introduced at a rate of 0.1 SLPM for 2 h and 15 min. The reduction step is shown in Eq. 6.
Results
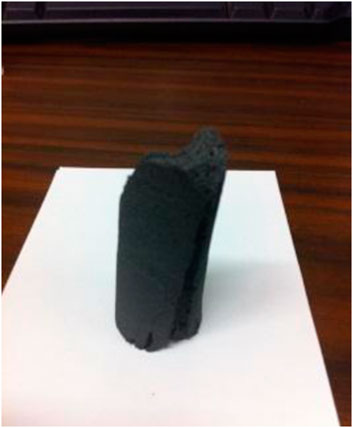
Experiments were conducted to evaluate the effectiveness of crystalline silica in hindering iron/iron oxide powder sintering. As indicated in Table 1, all pure iron samples get sintered. The pure iron after reaction converted to magnetite (Fe3O4), hence the dark black color. Figure 2 shows the sintered sample of pure iron reacted at 850°C. The sample was solid and hard.
Figure 3 illustrates the samples after experiments at bed temperatures of 645°C (clumped), 650°C (partially sintered), and 961°C (sintered). Iron-silica-3 sample partially sintered after reacting the sample for 35 min, as shown in Figure 3 (middle). Similarly, Iron-silica-4 partially sintered after 29 min of reaction time. It is noticed that for the SiO2 particle size range of 200–300 µm, the samples either partially sintered or fully sintered. Those that sintered had a lower SiO2 volume fraction of 0.5. This coincides with the patent disclosure of Clavenna et al., 1995. The range of the ZrO2 mass fraction described by Clavenna et al. was 80–99.5%, reflecting this on the SiO2 experiments conducted in this research. This would be equivalent to 0.67 and 0.75 SiO2/Fe volume fractions.
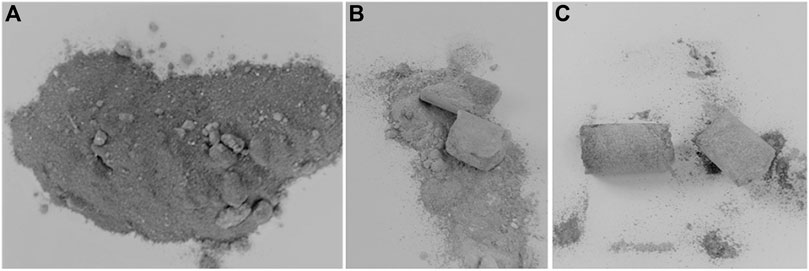
FIGURE 3. Picture of the Fe/SiO2 powder after Iron-silica-5 experiment (left), Iron-silica-3 experiment (middle) and Iron-silica-8 experiment (right).
In Iron-silica-5 and Iron-silica-7 experiments, the powder clumped. The clumped powder was reverted to its original loose condition with simple mechanical agitation sufficient to break up the powder’s clumped parts. Iron-silica-6 sintered as the experiment was run for a longer time (57 min). It is noticed that the silica volume fraction did not affect the sintering condition for the silica particle size range of 0–45 µm.
For the higher temperature experiments, above 950°C, all samples sintered. The narrow particle size distribution was used to test its effect on sintering at higher temperatures. Al-Raqom and Klausner showed that iron mixed with ZrO2 could hinder sintering (7% of sample sintered) at higher temperatures reaching 898°C (Al-Raqom and Klausner, 2014).
The smaller-sized silica particles inhibited the sintering as the sample tends to clump rather than sinter when larger particles were used. When larger particles were used, higher silica volume fraction reduced sintering as the samples only partially sintered.
The stoichiometric Hydrogen volume that can evolve from the iron/steam oxidation for 25 g of iron powder was estimated to be 14.47 L. To compare the Hydrogen volume evolving from each experiment, Hydrogen fractional yield was calculated as follows:
Since the experiment time varied, the Hydrogen fractional yield was estimated for each experiment after 20 min to unify the experiment duration.
The minimum Hydrogen fractional yield averaged about 26% for the smaller silica particle size distribution of 0–45 µm. When the particle size was increased to 200–300 µm, the Hydrogen fractional yield increased to an average of 38%. This means that the particle size of the sintering inhibitor can affect the reaction kinetics as it can reduce the reactive powder surface area by blocking it when it adheres to the surface. Figure 4 shows scanning electron microscopy (SEM) images of iron/silica samples of experiments Iron-silica-3 (left) and Iron-silica-7 (right). The purple particles are the SiO2, and the yellow/pink are iron/iron oxide (Fe3O4). It is shown that the larger silica particles do not block the iron reactive surface area while the smaller ones are dispersed and block the reactive surface area by intruding into the pores. The average Hydrogen fractional yield for higher reaction temperature (above 950°C) was 69%. This high yield is due to the higher reaction temperature.
Figure 5 displays the Hydrogen yield for iron mixed with 200–300 μm silica powder with different silica volume fractions at 650°C. Increasing the silica apparent volume fraction decreases the Hydrogen yield. Increasing the silica apparent volume fraction to 0.5, 0.67, and 0.75 reduces the Hydrogen yield compared to pure iron by 25, 34, and 47%, respectively. This is an average reduction of 33% compared to pure iron that reacted for 20 min at a similar temperature range.
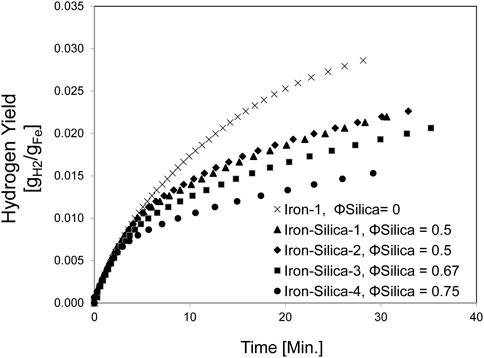
FIGURE 5. Hydrogen yield for mixed iron and silica (200–300 µm) with various silica volume fractions at 650°C (set furnace temperature).
The Hydrogen production rate is shown in Figure 6. The Hydrogen production rate decreased as the silica volume fraction is increased. The maximum Hydrogen rate for iron was 1.27 sLPM, and the average maximum rate for iron/silica was 1.08 sLPM. The rate for Iron-silica-1 and Iron-silica-2 was close as both experiments were for SiO2 volume fraction of 0.5.
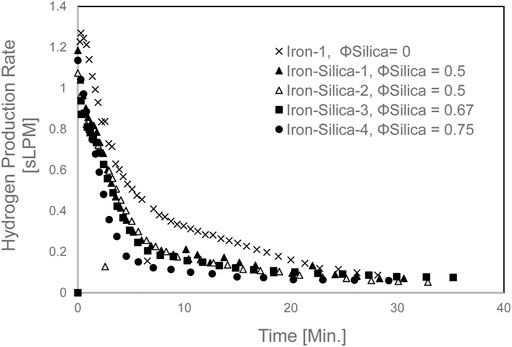
FIGURE 6. Hydrogen production rate for mixed iron and silica (200–300 µm) with various silica volume fractions at 650 °C set furnace temperature).
Hydrogen yield for the mixed iron and silica (0–45 µm) with various silica volume fractions at 650°C set furnace temperature is shown in Figure 7. As observed, changing the silica volume fraction did not reveal any difference in terms of Hydrogen yield. Yet, it reduced Hydrogen yield by 53% as compared with pure iron at 20 min of experiment time. The Hydrogen production rate is shown in Figure 8. The Hydrogen production rate drastically decreased to a maximum of 0.34 sLPM.
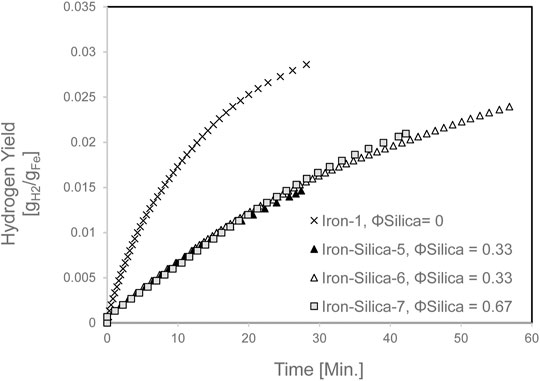
FIGURE 7. Hydrogen yield for mixed iron and silica (0–45 µm) with various silica volume fractions at 650 °C set furnace temperature.
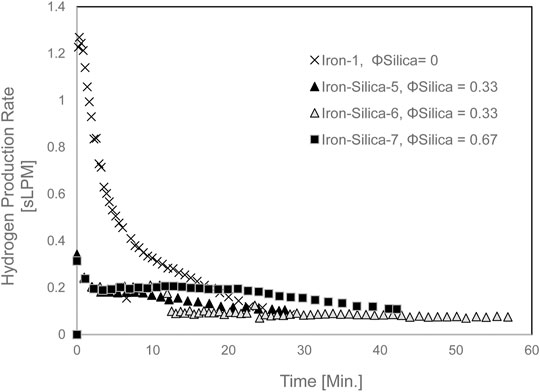
FIGURE 8. The Hydrogen production rate for mixed iron and silica (0–45 µm) with various silica volume fractions at 650 °C set furnace temperature.
Figure 9 shows the Hydrogen yield for iron/silica (45–106 μm) with a 0.67 volume fraction at a set bed temperature of 950°C. The average Hydrogen production yield at 20 min of experiment time was 10 L. When pure iron was reacted at 871°C, Hydrogen production yield at 20 min of experiment time was 12.6 L. Thus, at high temperatures (950°C, set reactor temperature), the Hydrogen yield was reduced by 21% compared to pure iron case. Unfortunately, having iron-only experiments was not feasible as the iron sintered and destroyed the thermocouple measuring the fluidized bed temperature and compromised the data collection. The maximum Hydrogen production rate dropped from 1.2 sLPM for the iron only (Iron-3) to an average of 0.7 sLPM for the Iron-Silica mixture (Figure 10).
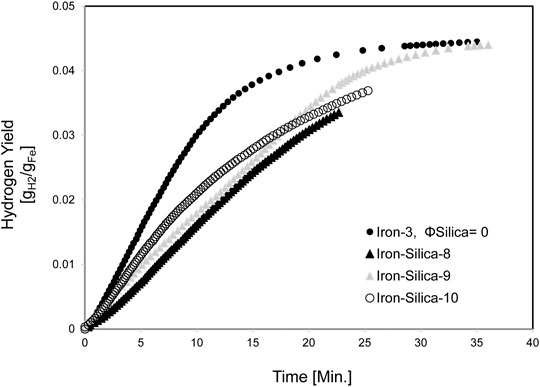
FIGURE 9. Hydrogen yield for mixed iron and silica (45–106 µm) with 0.67 silica volume fractions at 950°C set furnace temperature, pure iron furnace set temperature is 850°C.
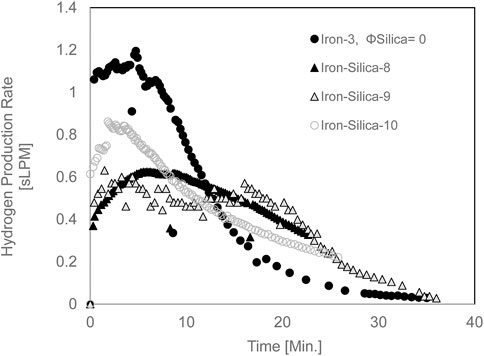
FIGURE 10. The Hydrogen production rate for mixed iron and silica (45–106 µm) with 0.67 silica volume fractions at 950°C set furnace temperature, pure iron furnace set temperature is 850°C.
Another type of silica was investigated, and that was amorphous (non-crystalline) silica, commonly known as diatomaceous Earth. Diatomaceous Earth (DE) is a naturally available silica source composed of prehistoric plants’ skeletons, or diatoms, containing less than one percent crystalline silica. The DE has irregularly shaped diatoms; hence it is amorphous and exhibits a small apparent density that is 260 g/L. Diatomaceous Earth melts at 1700°C (Fighting, 2001). The food-grade DE used in the experiments contained less than 1% silica.
The operational conditions for iron and DE experiments are listed in Table 2. The experiments included using 25 g iron powder in two sample size distributions of 0–250 µm and 125–355 µm mixed with DE and 0.67 volume fraction. One reduction/oxidation (redox) cycle was carried out (DE-0-250-2-OX-1 and 2) to evaluate the DE/Fe powder mixture’s recyclability.
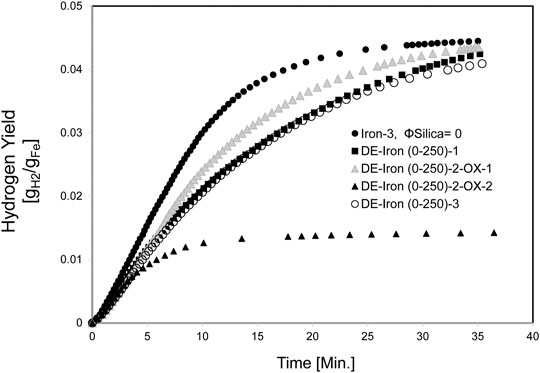
Iron with a particle size distribution of 0–250 µm mixed with DE experiments is shown in Figure 11. The Hydrogen fractional yield of the DE/Fe powder combinations averaged 71% at 850°C average temperature, and it was 87% for pure iron powder at 871°C.
The samples with DE clumped, making it easier to proceed to consecutive redox cycles. Comparing the Hydrogen fractional yield (71%) for the iron (0–250 µm)/DE (800°C temperature range) to 69% of the iron (45–106 µm)/crystalline silica (900°C temperature range), the values were comparable.
Since the DE experiments showed better results in hindering sintering, a complete redox cycle was attempted to evaluate the recyclability of the DE/Fe mixture. The Hydrogen production rate for this experiment is shown in Figure 12. First elemental iron was reacted with 2 g/min steam in DE-Iron (0-250)-2-OX-1, which is the oxidation step. Then to test the recyclability of the mixture, a reduction step was carried out.
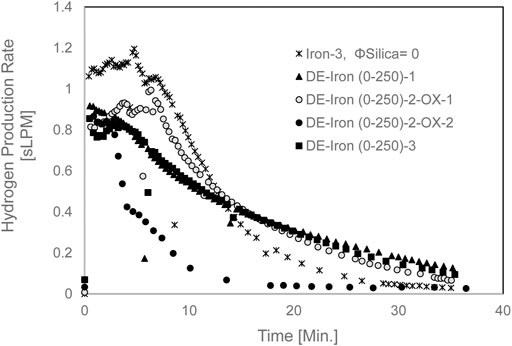
FIGURE 12. The Hydrogen production rate for mixed DE/Fe (0–250 µm) at set furnace temperature of 850°C.
After the reduction step, the second oxidation step was carried out in experiment DE-Iron (0-250)-2-OX-2. The maximum Hydrogen production rate slightly dropped from 0.994 to 0.866 sLPM for oxidation-1 and oxidation-2, respectively, as shown in Figure 12. The maximum average rate was 1.18 sLPM for pure iron (Iron-3).
The Hydrogen yield, shown in Figure 11, was drastically reduced in the second oxidation step. This is attributed to the reduction cycle’s effect, which did not realize the full reduction of magnetite (Fe3O4), formed after the iron/steam oxidation step, to elemental iron. The Hydrogen fractional yield dropped from 77 to 29% for oxidation-1 and oxidation-2 experiments, respectively. In general, the Hydrogen production rate when diatomaceous Earth is used as a sintering inhibitor with iron powder was lower than that for the unmodified iron powder.
Throughout the experiments, mixing iron with DE led to clumping only of the powder samples after the reaction cycles were conducted at temperatures exceeding 800°C. As compared to crystalline silica, this is considered a good achievement. A picture of the DE/Fe sample before and after the reaction is shown in Figure 13.
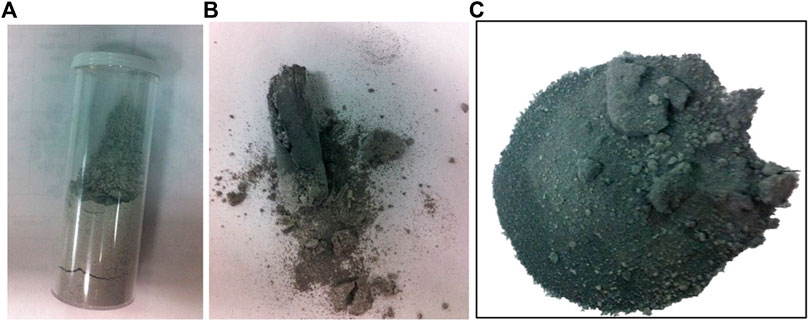
FIGURE 13. DE/Fe sample before reaction (left), DE-Iron (0-250)-2-OX-1 (middle) and DE-Iron (0-250)-2-OX-2 (right).
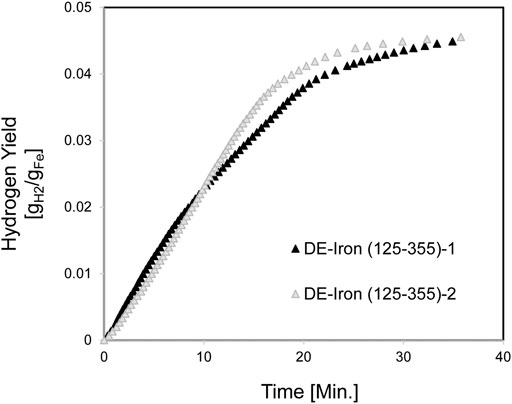
Another set of experiments were carried out with 125–355 µm iron particle size distribution to investigate the effect of eliminating the smaller particles in reducing the clumping. The Hydrogen yield for DE/Fe (125–355 µm) is shown in Figure 14. The Hydrogen fractional yield was 79 and 86% for DE-Iron (125-355)-1 and DE-Iron (125-355)-2, respectively. Both samples clumped and were crushed easily with minimum agitation restoring their initial powder condition.
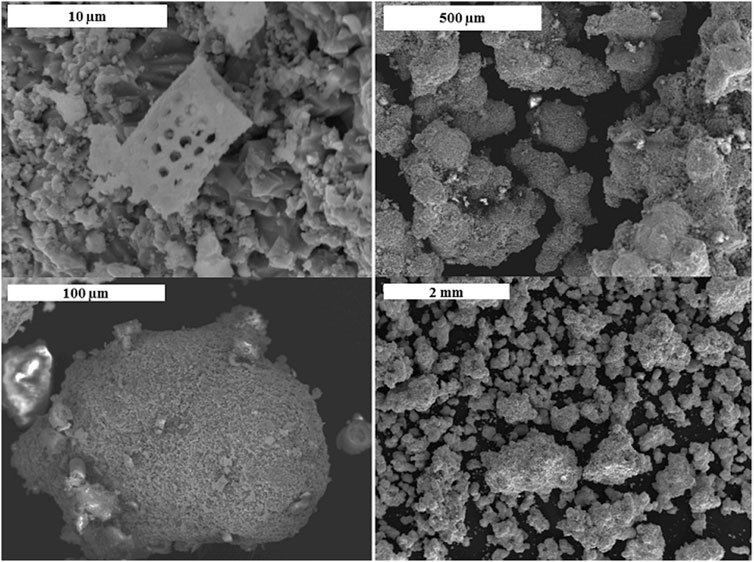
SEM images of the sample after DE-Iron (0-250)-2-OX-2 experiment under various magnifications are shown in Figure 15. The DE adheres to the iron particles surface, as shown in Figure 15, bottom left image. Figure 15 top right indicates the diatoms porous structure.
Discussion
Sintering is found to be inhibiting Hydrogen production in the repetitive redox cycles. Accordingly, a series of experiments were carried out to evaluate the effectiveness of solid-state mixing of porous iron powder with silica (crystalline and amorphous) in hindering the sintering of iron/iron oxide during redox reactions. A total of ten crystalline SiO2 and five amorphous SiO2 mixed with Fe experiments were conducted. Various iron/silica powder combinations were inspected, including different silica volume fractions (0.33, 0.5, 0.67, and 0.75), iron particle distributions (0–250 and 125–355 µm) and silica size distribution (0–45, 45–106, and 200–300 µm). Initially, pure iron experiments were carried out as a base case. All pure iron samples sintered. In the case of crystalline SiO2, most of the samples sintered as well. It was observed that incorporating amorphous silica in the iron powder shows promising results in hindering sintering in the oxidation step compared to reacting pure iron powder or iron powder mixed with crystalline SiO2. All amorphous SiO2 samples clumped, their initial loose powder condition was restored with minimum agitation. When the clumped DE/Fe oxide sample was inspected, it was found that the DE particles cling to the surface of the iron particles preventing them from sintering, leading to soft clumping.
For the crystalline silica, the Hydrogen fractional yield at 20 min ranged between 26 and 69%. The higher yield was observed for the silica particle size range of 45–106 µm, and the rate of Hydrogen production was 0.7 sLPM on average. The smaller yield was for, the smaller silica particle size distribution of 0–45 µm. This indicates that the smaller size of the silica can inhibit Hydrogen production as it blocks some of the iron pores. As the silica apparent volume fraction increased from 0.5, to 0.67, and 0.75 the Hydrogen yield decreased by 25, 34 and 47% as compared to pure iron.
The amorphous silica experiments involved varying the iron powder particle size distribution. Two ranges were inspected, including 0–250 and 125–355 µm and 0.67 volume fraction. One full reduction/oxidation (redox) cycle was carried out to evaluate the DE/Fe powder mixture's recyclability. The Hydrogen fractional yield of iron (0–250 µm) mixed with DE averaged 71% at 850°C average temperature, and it was 87% for pure iron powder at 871°C.
The samples with DE clumped, making it easier to proceed to consecutive redox cycles. The average Hydrogen fractional yield (71%) for the iron (0–250 µm)/DE (800°C temperature range) was comparable to that of the iron (45–106 µm)/crystalline silica (900°C temperature range), which was 69% on average.
Since the DE/Fe mixture showed better results in terms of sintering, its recyclability was further inspected by conducting a complete oxidation/reduction/oxidation cycle. The mixture went through oxidation, reduction, and then oxidation cycles. The Hydrogen fractional yield dropped from 77 to 29% for oxidation-1 and oxidation-2 experiments, respectively. This decrease is attributed to the reduction cycle as the full reduction of magnetite (Fe3O4) to elemental iron was not realized.
In general, experiments results showed that using amorphous silica can yield a higher Hydrogen rate compared to crystalline silica. In crystalline silica, the smaller the particle reduces the iron/iron oxide’s sintering. The use of amorphous silica prevents sintering and leads to clumping. The clumped samples can retain their initial loose powder condition with minimum agitation.
Conclusion
Sintering can hinder Hydrogen production in iron redox cycles. The experimental assessment discussed in this work aimed at investigating solid-state mixing of silica and iron/iron oxide powder to inhibit sintering.
It was found that mixing iron with silica reduces the Hydrogen yield in the first oxidation step. This is mainly because the silica particles tend to clog some of the pores within the porous iron, reducing the reactive surface area. Moreover, increasing the silica apparent volume fraction decreases the Hydrogen yield. When the crystalline silica apparent volume fraction varied between (0.5–0.75), the Hydrogen yield reduced by (25–47%). In the case of the DE, amorphous silica, it is observed that the Hydrogen yield appears to be independent of silica volume fraction. However, it is reduced by 31% compared to pure iron. It is believed that the smaller silica particles block the pores of the iron powder and reduce sintering and Hydrogen production. When comparing the Hydrogen production rate for the tested samples, it is noted that it is higher when the iron is mixed with the amorphous silica compared to the case of the crystalline silica, which can be attributed to the porosity of the amorphous silica.
The utilization of silica as a sintering inhibitor can be further inspected to arrive at the optimum combination that allows better Hydrogen generation in repetitive iron redox cycles. Future work can investigate using amorphous silica with various iron particle size ranges. Full redox cycles can be examined to assess the recyclability of the DE-Fe mixture and the hydrogen yield.
Data Availability Statement
The original contributions presented in the study are included in the article, further inquiries can be directed to the corresponding author.
Author Contributions
Conceptualization, literature, investigation, analysis and writing: FR.
Conflict of Interest
The author declares that the research was conducted in the absence of any commercial or financial relationships that could be construed as a potential conflict of interest.
References
Abanades, S. (2019). Metal Oxides Applied to Thermochemical Water-Splitting for Hydrogen Production Using Concentrated Solar Energy. ChemEngineering 3 (3), 63. doi:10.3390/chemengineering3030063
Agrafiotis, C. C., Pagkoura, C., Lorentzou, S., Kostoglou, M., and Konstandopoulos, A. G. (2007). Hydrogen Production in Solar Reactors. Catal. Today 127 (1–4), 265–277. doi:10.1016/j.cattod.2007.06.039
Al-Raqom, F., and Klausner, J. F. (2014). Reactivity of Iron/Zirconia Powder in Fluidized Bed Thermochemical Hydrogen Production Reactors. J. Energ. Resour. Tech. 136, 8. doi:10.1115/1.4024856
André, L., Abanades, S., and Cassayre, L. (2017). High-temperature Thermochemical Energy Storage Based on Redox Reactions Using Co-fe and Mn-Fe Mixed Metal Oxides. J. Solid State. Chem. 253, 6–14. doi:10.1016/j.jssc.2017.05.015
Babu, S., Shah, B., and Talwalker, A. (1978). Fluidization Correlation for Coal Gasification Materials—Minimum Fluidization Velocity and Fluidized Bed Expansion. Aiche Symp. Ser. 74, 176–186.
Bobek, M. M., Stehle, R. C., and Hahn, D. W. (2012). Investigation of Iron Oxide Morphology in a Cyclic Redox: Water Splitting Process for Hydrogen Generation. Materials 5 (10), 2003–2014. doi:10.3390/ma5102003
Ceresa, E. M. (1979). Influence of Reduction Temperature on Coercivities, Coercivity Factors and Rheological Properties of ϒ-Fe2O3 and Silica Coated ϒ-Fe2O3. IEEE Trans. Magnetics 15 (3), 1068–1072. doi:10.1109/TMAG.1979.1070327
CertifHy Canada Inc. (2020). Green and Blue Hydrogen. Available at: http://www.certifhy.ca/Green and Blue H2.html#:∼:text=Blue (Hydrogen is hydrogen that, renewable energy sources (e.g. nuclear).
Charvin, P., Abanades, S., Flamant, G., Neveu, P., and Lemort, F. (2006). Screening and Testing of Promising Solar Thermochemical Water Splitting Cycles for Hydrogen Production. 16th World Hydrogen Energ. Conf. 2006, WHEC 2, 1758–1768. February 2015.
Charvin, P., Stéphane, A., Florent, L., and Gilles, F. (2008). Analysis of Solar Chemical Processes for Hydrogen Production from Water Splitting Thermochemical Cycles. Energ. Convers. Manag. 49 (6), 1547–1556. doi:10.1016/j.enconman.2007.12.011
Clavenna, L. R., Davis, S. M., Fiato, R. A., and Say, G. R. (1995). Particulate Solids for Catalyst Supports and Heat Transfer Materials (Patent No. 5,395,813). United States Patent Office.
Cloete, S., Ruhnau, O., and Hirth, L. (2021). On Capital Utilization in the Hydrogen Economy: The Quest to Minimize Idle Capacity in Renewables-Rich Energy Systems. Int. J. Hydrogen Energ. 46 (1), 169–188. doi:10.1016/j.ijhydene.2020.09.197
Fighting, F. (2001). DIATOMACEOUS EARTH (UNCALCINED). Available at: http://www.inchem.org/documents/icsc/icsc/eics0248.htm.
Gielen, D., Taibi, E., and Miranda, R. (2019). HYDROGEN : A RENEWABLE ENERGY PERSPECTIVE (Issue September). Available at: https://www.irena.org/-/media/Files/IRENA/Agency/Publication/2019/Sep/IRENA_Hydrogen_2019.pdf.
Giovannini, S. (2020). 50 Shades of (Grey and Blue and green) Hydrogen. Available at: https://energy-cities.eu/50-shades-of-grey-and-blue-and-green-hydrogen/.
GlobeNewswire (2020). Global Hydrogen Market Insights, 2020-2024 by Production Process, End-User, Generation System and Region. Research And Markets. Available at: https://www.globenewswire.com/news-release/2020/03/05/1995602/0/en/Global-Hydrogen-Market-Insights-2020-2024-by-Production-Process-End-user-Generation-System-and-Region.html.
Gokon, N., Takahashi, S., Yamamoto, H., and Kodama, T. (2008). Thermochemical Two-step Water-Splitting Reactor with Internally Circulating Fluidized Bed for thermal Reduction of Ferrite Particles. Int. J. Hydrogen Energ. 33 (9), 2189–2199. doi:10.1016/j.ijhydene.2008.02.044
Guo, L., Tang, J., Tang, H., and Guo, Z. (2015). Influence of Different MgO Coating Methods on Preventing Sticking during Reduction of Fe2O3 Particles in a Fluidized Bed. Mater. Today Proc. 2, S332–S341. doi:10.1016/j.matpr.2015.05.047
Hossain, A., Sakthipandi, K., Atique Ullah, A. K. M., and Roy, S. (2019). Recent Progress and Approaches on Carbon-free Energy from Water Splitting. Nano-Micro Lett. 11 (1), 1–26. doi:10.1007/s40820-019-0335-4
Jaszczur, M., Rosen, M. A., Śliwa, T., Dudek, M., and Pieńkowski, L. (2016). Hydrogen Production Using High Temperature Nuclear Reactors: Efficiency Analysis of a Combined Cycle. Int. J. Hydrogen Energ. 41 (19), 7861–7871. doi:10.1016/j.ijhydene.2015.11.190
Kodama, T., and Gokon, N. (2007). Thermochemical Cycles for High-Temperature Solar Hydrogen Production. Chem. Rev. 107 (10), 4048–4077. doi:10.1021/cr050188a
Kreider, P. B., Funke, H. H., Cuche, K., Schmidt, M., Steinfeld, A., and Weimer, A. W. (2011). Manganese Oxide Based Thermochemical Hydrogen Production Cycle. Int. J. Hydrogen Energ. 36 (12), 7028–7037. doi:10.1016/j.ijhydene.2011.03.003
Mei, R., Hahn, D., Klausner, J., Petrasch, J., Mehdizadeh, A., Allen, K., et al. (2013). Novel Magnetically Fluidized Bed Reactor Development for the Looping Process: Coal to Hydrogen Production R&D.
Milliken, J. (2007). DOE Hydrogen and Fuel Cells Program: 2007 Annual Progress Report. Available at: https://www.hydrogen.energy.gov/annual_progress07.html.
Neises, M., Roeb, M., Schmu¨cker, M., Sattler, C., and Pitz-Paal, R. (2008). “Kinetic Investigations of a Two-step Thermochemical Water-Splitting Cycle Using Mixed Iron Oxides Fixed on Ceramic Substrates,” in Proceedings of ASME 2008 2nd International Conference on Energy Sustainability, 335–343. doi:10.1115/ES2008-54093
Ogden, J. M. (1999). Prospects for Building a Hydrogen Energy Infrastructure. Annu. Rev. Energ. Environ. 24, 227–279. doi:10.1146/annurev.energy.24.1.227
Olsen, K. H. (1986). Mechanism of Sintering Inhibition in Silica Treated Iron Oxide Recording Particles. J. Magnetism Magn. Mater., 57, 1691–1692. doi:10.1016/0304-8853(86)90980-7
Roberts, D. (2018). The "hydrogen Economy” May Be a Thing after All. Available at: https://www.vox.com/energy-and-environment/2018/2/16/16926950/hydrogen-fuel-technology-economy-hytech-storage.
Roeb, M., Monnerie, N., Schmitz, M., Sattler, C., Konstandopoulos, A. G., Agrafiotis, C., et al. (2006). Thermo-chemical Production of Hydrogen from Water by Metal Oxides Fixed on Ceramic Substrates. 16th World Hydrogen Energy ConferenceWHEC 4, 3365–3376.
Safari, F., and Dincer, I. (2020). A Study on the Fe–Cl Thermochemical Water Splitting Cycle for Hydrogen Production. Int. J. Hydrogen Energ. 45 (38), 18867–18875. doi:10.1016/j.ijhydene.2020.04.208
Sattler, C., Roeb, M., Agrafiotis, C., and Thomey, D. (2017). Solar Hydrogen Production via sulphur Based Thermochemical Water-Splitting. Solar Energy 156, 30–47. doi:10.1016/j.solener.2017.05.060
Stehle, R. C., Bobek, M. M., and Hahn, D. W. (2015). Iron Oxidation Kinetics for H2 and CO Production via Chemical Looping. Int. J. Hydrogen Energ. 40 (4), 1675–1689. doi:10.1016/j.ijhydene.2014.11.035
Steinfeld, A. (2002). Solar Hydrogen Production via a Two-step Water-Splitting Thermochemical Cycle Based on Zn/ZnO Redox Reactions. Int. J. Hydrogen Energ. 27 (6), 611–619. doi:10.1016/S0360-3199(01)00177-X
T-Raissi, A. (2003). “Analysis of Solar Thermochemical Water-Spliting Cycles for Hydrogen Production,” in Hydrogen, Fuel Cells, and Infrastructure Technologies (Issue January).
Verfondern, K. (Editors) (2007). Nuclear Energy for Hydrogen Production. Forschungszentrum Jülich GmbH.
Villafán-Vidales, H. I., Arancibia-Bulnes, C. A., Valades-Pelayo, P. J., Romero-Paredes, H., Cuentas-Gallegos, A. K., and Arreola-Ramos, C. E. (2019). Hydrogen from Solar thermal Energy. Solar Hydrogen Production: Processes, Systems and Technologies. Amsterdam, Netherlands: Elsevier. doi:10.1016/B978-0-12-814853-2.00010-2
Woodside (2021). Hydrogen – Energy for a Lower Carbon Future. Available at: https://www.woodside.com.au/innovation/hydrogen#:∼:text=We’re focusing on two (steam methane reforming (SMR).&text=Green hydrogen is produced from water using renewable power.
Keywords: redox, sintering, hydrogen, water splitting, thermochemical
Citation: Al-Ragom F (2021) Utilization of Crystalline and Amorphous Silica as a Sintering Inhibitor in Iron/Iron Oxide Thermochemical Water Splitting Cycle. Front. Chem. Eng. 3:676532. doi: 10.3389/fceng.2021.676532
Received: 05 March 2021; Accepted: 17 May 2021;
Published: 09 June 2021.
Edited by:
Yusuf Bicer, Hamad bin Khalifa University, QatarCopyright © 2021 Al-Ragom. This is an open-access article distributed under the terms of the Creative Commons Attribution License (CC BY). The use, distribution or reproduction in other forums is permitted, provided the original author(s) and the copyright owner(s) are credited and that the original publication in this journal is cited, in accordance with accepted academic practice. No use, distribution or reproduction is permitted which does not comply with these terms.
*Correspondence: Fotouh Al-Ragom, ZnJhZ29tQGtpc3IuZWR1Lmt3
 Fotouh Al-Ragom