 Christophe Castel
 Roda Bounaceur
 Eric Favre
95% of researchers rate our articles as excellent or good
Learn more about the work of our research integrity team to safeguard the quality of each article we publish.
Find out more
ORIGINAL RESEARCH article
Front. Chem. Eng. , 29 April 2021
Sec. Separation Processes
Volume 3 - 2021 | https://doi.org/10.3389/fceng.2021.668867
This article is part of the Research Topic From CO2 emissions to Fuels and Chemicals: Current Development, Challenges and Perspectives View all 6 articles
The direct capture of CO2 from air (DAC) has been shown a growing interest for the mitigation of greenhouse gases but remains controversial among the engineering community. The high dilution level of CO2 in air (0.04%) indeed increases the energy requirement and cost of the process compared to carbon capture from flue gases (with CO2 concentrations around 15% for coal power plants). Until now, solid sorbents (functionalized silica, ion exchange resins, metal–organic frameworks, etc.) have been proposed to achieve DAC, with a few large-scale demonstration units. Gas-liquid absorption in alkaline solutions is also explored. Besides adsorption and absorption, membrane processes are another key gas separation technology but have not been investigated for DAC yet. The objective of this study is to explore the separation performances of a membrane unit for CO2 capture from air through a generic engineering approach. The role of membrane material performances and the impact of the operating conditions of the process on energy requirement and module production capacity are investigated. Membranes are shown to require a high selectivity in order to achieve purity in no more than two stages. The specific energy requirement is globally higher than that of the adsorption and absorption processes, together with higher productivity levels. Guidelines on the possibilities and limitations of membranes for DAC are finally proposed.
Drastic reductions in CO2 emissions are urgently needed in order to face climate change concerns (Field and Mach, 2017). Among the portfolio of strategies that can be deployed to mitigate greenhouse gases in the atmosphere, Carbon Capture and Storage (CCS) is considered a key technology (Lackner, 2003). CCS consists of first capturing CO2 from concentrated sources (power plants, cement factories, blast furnaces, refineries) that typically emit around 1 million tons of CO2 per year or more per site. The CO2 is then concentrated, compressed, transported in a pipe, and injected into appropriate geological formations for long-term storage (depleted reservoirs, saline aquifers). CCS is actively investigated through numerous R&D (Research & Development) projects, with a strong emphasis on the capture step, which accounts for 60–80% of the cost of the overall CCS chain (Steeneveldt et al., 2006). More specifically, an energy-efficient capture process is of major importance, in order to minimize the impact of secondary carbon emissions; a maximum of 2 GJ per ton of recovered CO2 (thermal basis) is often taken as the target (Figueroa et al., 2008). A broad range of capture processes has been investigated for CCS. Absorption in a chemical solvent is usually considered the best available technology today, with several pilot units installed and tested on real flue gases (Davidson and Metz, 2005). Adsorption and membrane processes are expected to play also an important role as second-generation technologies (Favre, 2007; Merkel et al., 2010). A different strategy, namely CCU (Carbon Capture and Use), is also being intensively investigated more recently in the place of carbon storage; it consists of using CO2 as a feedstock for chemicals or fuel production (such as methanol, methane, dimethylether, and polycarbonates). The challenge of CCU strongly differs from that of CCS because a cost-effective hybrid separation/reaction process (a classical chemical engineering problem) has to be designed (Senftle and Carter, 2017). The carbon footprint of CCU is also an issue.
Besides carbon capture from flue gases, direct air capture (DAC) has been proposed more recently (Keith, 2009). The topic remains controversial among the scientific community, mostly because of the higher thermodynamic barrier due to the lower concentration of CO2 in air. There is in fact a factor of 300 between CO2 concentration in flue gases (typically 15% for coal power plants) and air (400 ppm). This necessarily generates a larger specific energy requirement that depends on the type of capture technology but is not clearly quantitatively established yet (House et al., 2011). Moreover, the energy and materials costs of moving large quantities of air through an absorbing structure are also expected to result in large capture costs. Nevertheless, DAC is being increasingly investigated in the scientific community and some companies have started demonstration units for different applications (greenhouses, carbonated beverages, etc.) (Lackner, 2016; Keith et al., 2018). CO2 recovered from DAC can be used either for direct use or for chemical or biochemical transformation. Figure 1 summarizes the overall framework of CCS, CCS, and DAC.
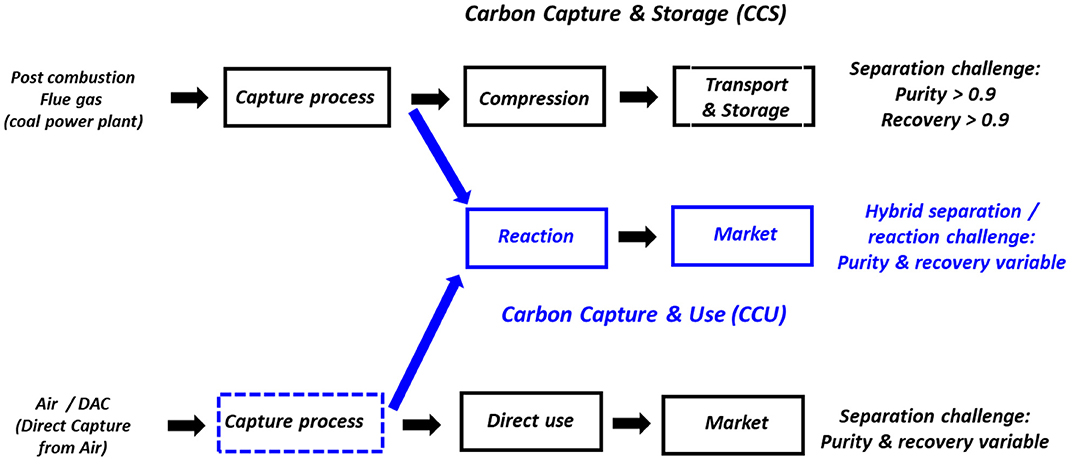
Figure 1. Simplified representation of Carbon Capture and Storage (CCS), Carbon Capture and Use (CCU), and Direct Air Capture (DAC). DAC can be used either for direct use of CO2 or chemical transformation and requires a capture process. The dotted blue rectangle shows the scope of this study.
Similar to CCS, DAC requires an efficient, energy-intensive process in order to be practically applied (rectangle in dotted line on Figure 1). The capture performances are, however, very different from CCS because no clear and fixed purity and recovery targets are defined (Senftle and Carter, 2017). Adsorption processes based on different solid sorbents are considered the best technology today (Sanz-Pérez et al., 2016). A large number of solid sorbents, including polymer-impregnated resins (Chen et al., 2013), ion exchange resins (Wright et al., 2010), amine-functionalized cellulose (Gebald et al., 2014), MOFs (Verdegaal et al., 2016), and activated carbons (Hauchhum and Mahanta, 2014), among others, have been proposed. Because of the key impact of energy requirement, several sorbent regeneration strategies are explored in terms of process and operating conditions. Besides the classical Pressure Swing Adsorption (PSA) option, temperature, vacuum, moisture swing, electro, and, for some very specific adsorbents, photo-switch regeneration have been proposed (Wurzbacher et al., 2012; Lyndon et al., 2013; Wang et al., 2013; Wilcox, 2020). Specific energy requirements for DAC cover a broad range, from 1.3 up to 8 GJ per ton of recovered CO2 (Keith et al., 2018).
Besides adsorption processes, gas absorption into reactive liquids has been proposed for a long time (Tepe and Dodge, 1943; Greenwood and Pearce, 1953), especially for pre-purification through air separation. Different solvents (alkali, ionic liquids) are currently investigated as a potential DAC technology (Baciocchi et al., 2006; Keith et al., 2018). The high energy requirement of the process, ranging from 2.1 to 10.7 GJ per ton of CO2, remains an issue (Kiani et al., 2020).
Table 1 summarizes the different gas separation technologies, their respective advantages and drawbacks, and the current state-of-the-art technologies for DAC.
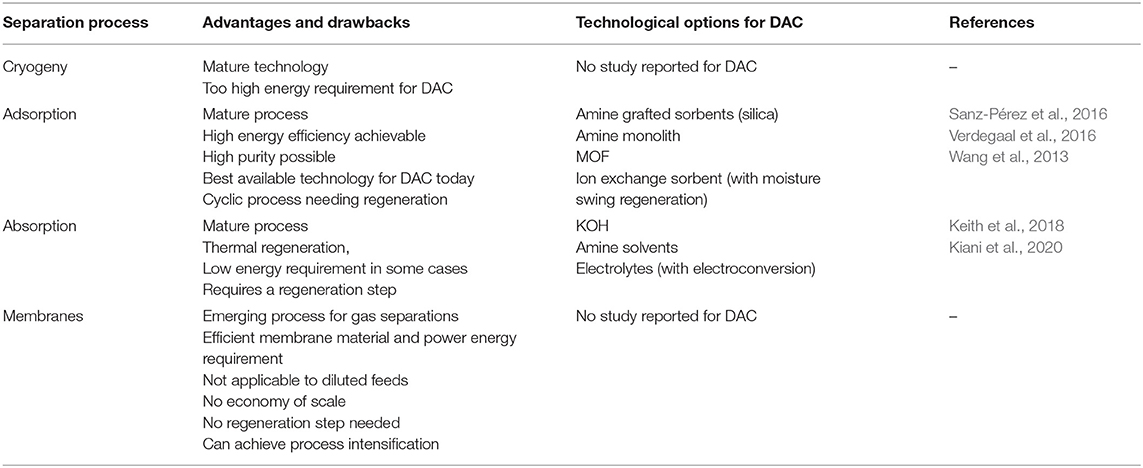
Table 1. Overview of the different gas separation processes and current state-of-the-art technologies for DAC application.
Surprisingly, membrane processes, showing attractive performances for carbon capture from flue gases (Favre, 2007; Merkel et al., 2010), have not been investigated for DAC up to now. Except for a proof of concept study on a Fixed Site Carrier Membrane for CO2 capture from air (Rahaman et al., 2012) and some reports on CO2 elimination from air for space (Hwang et al., 2008) or air separation pre-purification applications (Wu et al., 2019), no research addressed a generic analysis of the possibilities and limitations of a membrane unit for DAC. The purity, recovery, specific energy requirement, or treatment capacity of membrane processes for DAC application remain essentially unknown.
This study intends to fill that gap, through an engineering parametric study covering the impact of materials performances and operating conditions. A single-stage process has been taken for simulations for not only the sake of simplicity but also because multistage processes, including multicompression and/or vacuum operation, are usually used when increased purity and recovery are needed. The specificity of DAC, with no recovery target and the need for simple, one-step air-blowing technologies, suggests to first clearly define the purity, energy, and productivity of a single-stage membrane process. It is expected that the results detailed in this paper will help to better evaluate the best place and role of membranes for DAC purposes, be it for standalone or hybrid technologies (i.e., pre- or post-concentration of an absorption or adsorption process).
As explained in the introduction section, a large majority of research studies on carbon capture have been applied to flue gas treatment in a CCS framework. In that case, a CO2 outlet concentration (i.e., purity) of 90% or more and a recovery of 90% or more are taken as specifications (Steeneveldt et al., 2006). Within that context, the possibilities of membrane processes have been investigated through a great number of studies, and either two-stage or hybrid membrane/cryogeny processes, with different types of design, have been proposed (Favre, 2007; Figueroa et al., 2008; Merkel et al., 2010).
The DAC context is very different in that the feed CO2 concentration is very low (400 ppm) and no purity or recovery target is defined. Moreover, CO2 can be either used per se after capturing from air (algae ponds, greenhouses, carbonated beverages, etc.) or transformed into a given chemical product or fuel (Figure 1). Consequently, it is not possible to fix for DAC a precise CO2 purity, together with recovery constraints. This brings the need for very large flexibility that will be explored in this study. Membrane processes are known to show a strong parametric sensitivity and it is very useful to generate master curves where the interplay between purity, energy requirement, and productivity are linked together (Baker, 2004; Favre, 2017).
More specifically, the engineering methodology applied hereafter is sketched in Figure 2 and it has been proposed and applied for different membrane gas separations (Castel et al., 2018). The separation performances of a membrane process (single-stage) will be systematically simulated for feed air conditions (simplified to a binary CO2/N2 mixture in the first step, but extended to N2/CO2/O2/H2O in the second step). The outlet CO2 purity and the associated energy requirement and overall specific fluxes will be computed for different membrane materials and operating conditions. This set of data will offer the opportunity to perform technico-economical analyses in future studies.
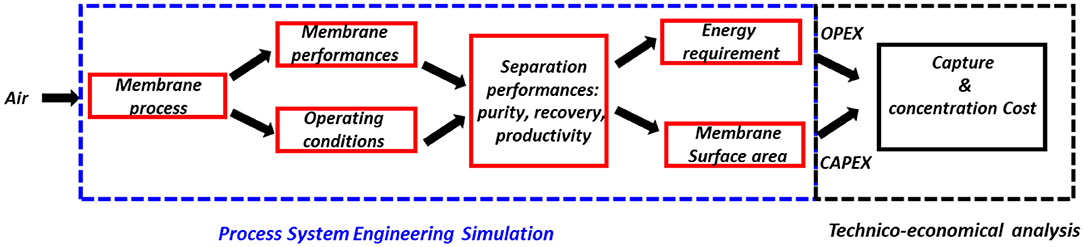
Figure 2. Sketch of the overall framework of the study. The separation performances of a capture process for DAC (i.e., dotted blue rectangle, which corresponds to the capture box in Figure 1), based on a single-stage membrane separation unit, are explored. The impact of membrane performances and operating conditions will be systematically covered in order to evaluate the specific energy requirement and production capacity of a membrane process fed by air. These key data are needed for further technico-economical studies of DAC (black box on the right) but this task will not be performed here.
Industrial membrane gas separations are almost exclusively based on thin-film polymeric asymmetric or composite materials today (Baker and Low, 2014). In the first step, the separation performances of different polymeric membranes will be studied based on a so-called trade-off approach (Robeson, 2008). A series of polymeric materials and the corresponding characteristics, namely permeance and selectivity, are shown in Table 2. Globally speaking, it can be seen in Figure 3 that a trade-off exists between permeance, which impacts membrane surface area, and selectivity, which impacts the CO2 outlet purity. The different material characteristics taken for simulation purposes in this study are indicated in Figure 3.
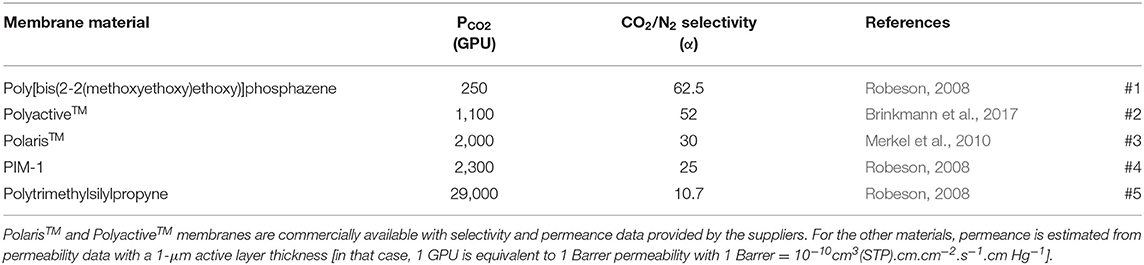
Table 2. Examples of polymeric membrane materials with CO2 permeance and CO2/N2 selectivity performances.
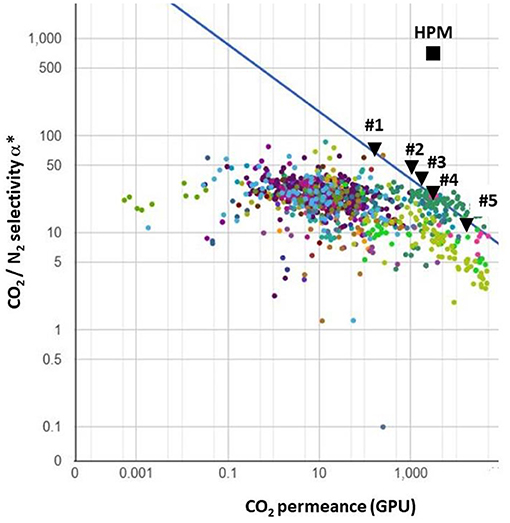
Figure 3. CO2/N2 gas pair trade-off curve [from Robeson (2008), adapted]. Polymeric membrane materials listed in Table 2 are indicated (#1–#5). The filled square [HPM, High-Performance Material (Li et al., 2013; Yuan et al., 2017)] corresponds to a recently reported inorganic material used for simulation purposes.
In the second step, high-performance non-polymeric materials, showing performances beyond the trade-off limit of polymers, should also be investigated. Numerous materials have been reported (e.g., zeolites, carbon molecular sieves, graphenes, metal–organic frameworks, liquid membranes, fixed-site carrier membranes, etc.) to achieve that target (Skoulidas et al., 2002; Geim, 2009; Gascon and Kapteijn, 2010). An exhaustive analysis of the impact of the characteristics of these different membrane families is beyond the scope of this study. For the sake of simplicity, one of the most promising recently reported materials, showing record performances in terms of CO2/N2 selectivity (α = 680) and CO2 permeance (PCO2 = 2,500 GPU), will be taken (Li et al., 2013; Yuan et al., 2017). The potential interest of advanced materials for DAC, be it for purity or energy efficiency, will thus be evaluated.
When the feed conditions and membrane performances are fixed, a classical process simulation study, historically developed by Weller and Steiner (1950), can be performed. The methodology has been largely reported in previous studies (Belaissaoui et al., 2014; Bounaceur et al., 2017; Favre, 2017) and will be simply summarized here.
Basically, the membrane process is supposed to be under steady-state and isothermal conditions. Flow conditions are postulated (such as perfectly mixed, cross plug flow, co- or counter-current plug flow) and the differential mass balance of the different permeants can be solved, together with a mass transfer expression. Constant permeance and no flux coupling are assumed, which is in agreement with previous studies (Pan and Habgood, 1978; Kaldis et al., 2000). The overall set of hypotheses has been already validated and it is expected to be representative of the CO2/N2 gas pair. The methodology can also be extended to multicomponent feed mixtures (Kaldis et al., 2000). For practical purposes, cross plug flow or counter-current flow are most often used for simulations because they are close to the real performances of industrial modules (Favre, 2007; Merkel et al., 2010).
A very interesting feature of the above approach is that the system is completely governed by four dimensionless numbers (material selectivity α*, pressure ratio ψ, module stage cut θ, dimensionless surface area S) enabling generic process solutions to be obtained (Weller and Steiner, 1950):
where P stands for membrane permeance, p′ for upstream (retentate) pressure, p′′ for downstream (permeate) pressure, Qp for permeate flowrate, Qin for feed flowrate, and A for the membrane surface area. Stage cut θ and pressure ratio ψ ranging, by definition, from 0 to 1, an exhaustive set of process solutions can be obtained through numerical resolution. The corresponding dimensionless surface area S can then be used to calculate the real membrane surface area A (in m2), for a given feed flow rate, membrane permeance, and upstream pressure.
The stage-cut value will impact the CO2 recovery ratio R through: .
The typical engineering resolution framework is shown in Figure 4. The number of variables to be defined is minimal because module geometry is not required in the resolution at this stage; the permeance data, feed composition, and operating conditions (pressure ratio, stage cut) are sufficient for the outlet compositions and flowrates to be determined. In the second step, process solutions based on feed compression and/or vacuum pumping can be investigated in order to obtain explicit module productivity (π), which corresponds to the specific CO2 transmembrane flux (i.e. mol CO2.m−2.s−1) and energy requirement (E) data, based on the following expressions (Favre, 2007; Bounaceur et al., 2017), with γ the adiabatic expansion coefficient of the gas mixture (i.e., ratio of the pressure over volume heat capacity):
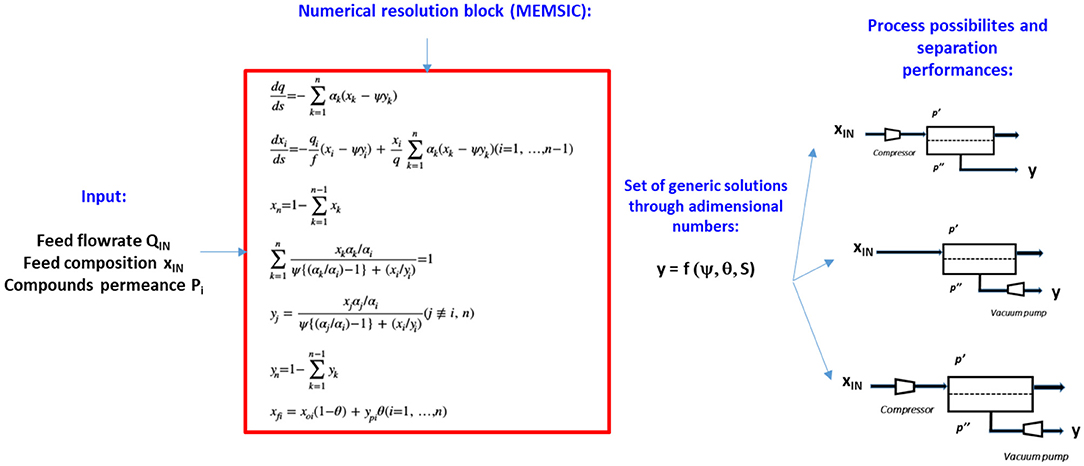
Figure 4. Simplified representation of the engineering methodology which is applied in this study. Q stands for air or flue gas feed flowrate, xIN for inlet mole fraction, p′′ for permeate pressure, p′ for retentate pressure. ψ is the module pressure ratio, θ the module stage cut, and S the dimensionless surface area. For DAC, the objective is to get for each set of operating conditions the CO2 outlet (permeate) concentration y, the CO2 recovery ratio R, and the associated energy requirement E and membrane productivity π.
In the first step, the impact of module conditions has been investigated, in order to select the most efficient option for simulation purposes. For carbon capture from flue gases, the cross plug flow or counter-current flow is taken, because these hydrodynamic conditions offer the best performances when purity (y = 0.9) and recovery (R = 0.9) targets are fixed. The DAC framework is very different. The target compound (CO2) is diluted and no specific recovery is needed. Moreover, pushing recovery R will logically decrease the retentate concentration (xOUT), which impacts the driving force. For a diluted feed mixture, a larger recovery will thus induce vanishing CO2 fluxes together with a decreasing outlet purity (y). Then, it can be anticipated that a low recovery R (i.e., a low module stage cut θ) should be favored, so that the outlet concentration y is not too decreased and the specific CO2 flux remains large enough. Figure 5 shows a comparison between permeate purity y and recovery ratio R for different operating (pressure ratio) conditions. Carbon capture from flue gas and DAC are compared, with a baseline case corresponding to the Polaris membrane (Table 2).
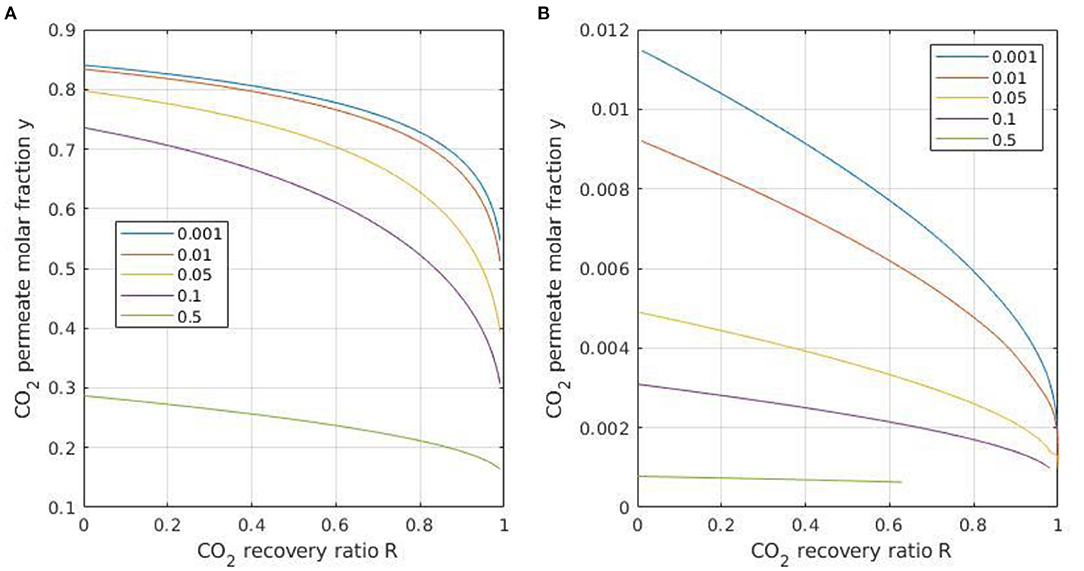
Figure 5. Permeate purity y as a function of recovery ratio R for different pressure ratios (indicated in the rectangle box) for a flue gas feed mixture (xIN = 0.15) (A) and air feed (xIN = 400 ppm) (B). Polaris membrane performances (#3 in Table 2), cross plug flow conditions.
A maximal CO2 purity of around 1% is achievable for DAC (i.e., y = 0.01), providing a vanishing pressure ratio and stage cut is applied. A decreasing permeate purity value is obtained as soon as the recovery and/or pressure ratio is increased. It can be noted at this stage that, for DAC, the need to push purity and the fact that no recovery is fixed suggest the usage of a low module stage cut θ. In that case, the impact of the flow conditions is negligible. The simple, perfectly mixed case could thus be taken for simulation purposes (Favre, 2017). This peculiarity, which strongly differs from classical membrane gas separation applications, is specific to DAC and it results from the fact a maximal purity is needed and no recovery target is fixed.
Because maximizing purity is of major importance in DAC, the upper outlet concentration that can be obtained by a single-stage module has been computed in the second step. Based on the low stage-cut assumption detailed in the previous section, the maximal y value can be calculated as soon as membrane performances and pressure ratio are fixed.
Figure 6A shows the results for different polymeric membranes. It can be seen that even the best polymeric membrane materials enable a CO2 purity in the range of 2% (y = 0.02) to the best. The interest to use highly selective materials and low pressure ratio is clear. A very low pressure ratio corresponds, however, to a large energy requirement. The energy requirement and the specific membrane surface area for feed compression and vacuum pumping are also shown in Figures 6B,C. These sets of data summarize the interplay between the CO2 outlet purity y, the energy requirement E (which plays a key role in OPEX), and the membrane surface area A (which plays a key role in CAPEX). A technico-economical analysis can be performed based on these, as indicated in Figure 2. More specifically, the increasing energy requirement with feed dilution is confirmed; compared to CCS with coal power plant flue gases, where a specific energy requirement of around 220 kWh per ton of recovered CO2 is achievable, the minimal energy requirement for DAC with a polymeric membrane is around 18,000 kWh per ton of CO2 when a highly selective polymeric membrane is operated under vacuum pumping conditions. Vacuum pumping should thus be favored in order to minimize E; this is however at the expense of an increased membrane surface area A (Figure 6C). From a practical point of view, it is important to stress that it is difficult to achieve a vacuum level below 1–10 mBar at an industrial scale with classical primary vacuum pumps. For a strict vacuum pumping strategy, this limitation has to be taken into account and it translates into a pressure ratio lower limit of around 0.01. A 0.001-pressure ratio level could possibly be achieved with high-performance leak-proof vacuum systems, but this target is challenging from a technological point of view. The specific energy requirement of vacuum pumping is indeed around three orders of magnitudes lower than compression, together with an increase of around five orders of magnitude in specific surface area. The strong impact of pressure ratio on module performances is confirmed. The best cost-effective solution can be identified as soon as membrane, compressor, vacuum pump, and electricity costs are defined. This interesting technico-economical study is beyond the scope of this paper, but it could be performed based on the data set shown in Figure 6.
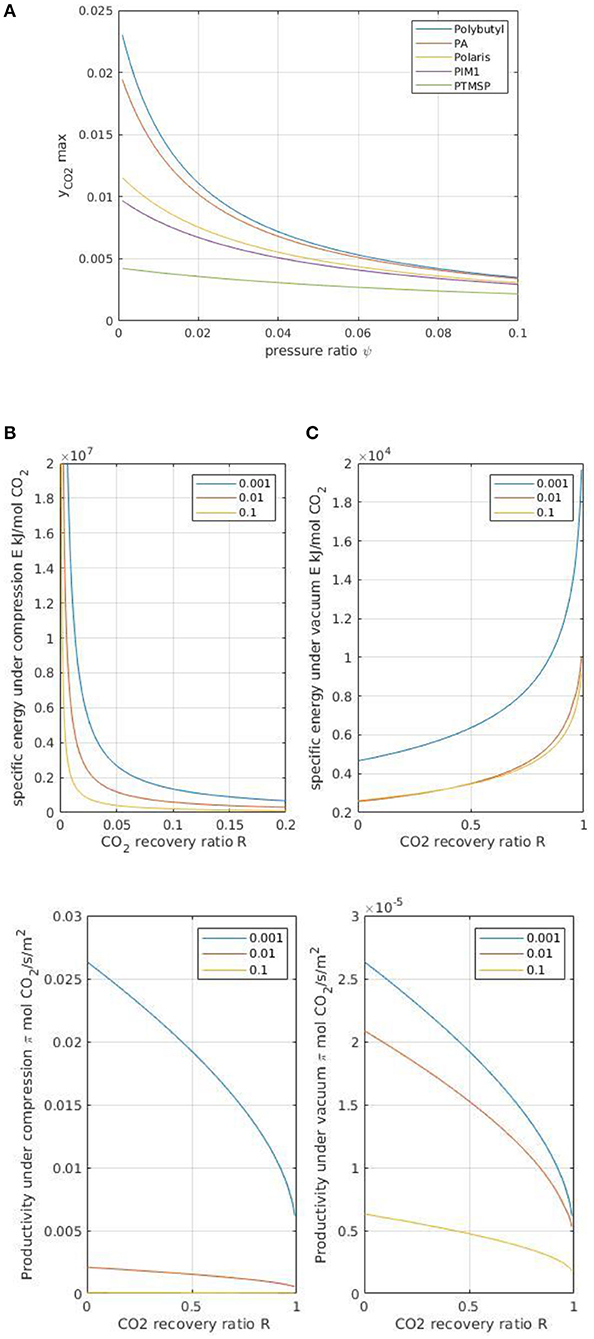
Figure 6. (A) Maximal permeate purity y as a function of module pressure ratio (ψ) for different polymeric membrane materials (listed in Table 2). (B) Specific energy requirement E (expressed in kJ per mol of recovered CO2) for a single-stage module under feed compression and vacuum pumping conditions and for different module pressure ratios (ψ). Polaris membrane, cross plug flow conditions. (C) Module productivity π (expressed in mol of recovered CO2 per m2 surface area) for a single-stage module under feed compression or vacuum pumping conditions and for different module pressure ratios (ψ). Polaris membrane, cross plug flow conditions.
Given the key role played by membrane selectivity, the separation performances of the most selective, non-commercially available material have been further investigated. For the sake of simplicity, a recently reported material has been taken for simulation purposes with a record CO2/N2 selectivity (α = 680) and CO2 permeance (PCO2 = 2,500 GPU).
The results are shown in Figure 7, where they are compared to that from the Polaris membrane (i.e., the carbon capture membrane currently commercially available). The increase of CO2 purity with a high selectivity membrane material (HPM) is clear (Figure 7A). A maximum value of around 14% (i.e., closed to the CO2 of coal-power-plant flue gas) can be achieved for a very low module pressure ratio.
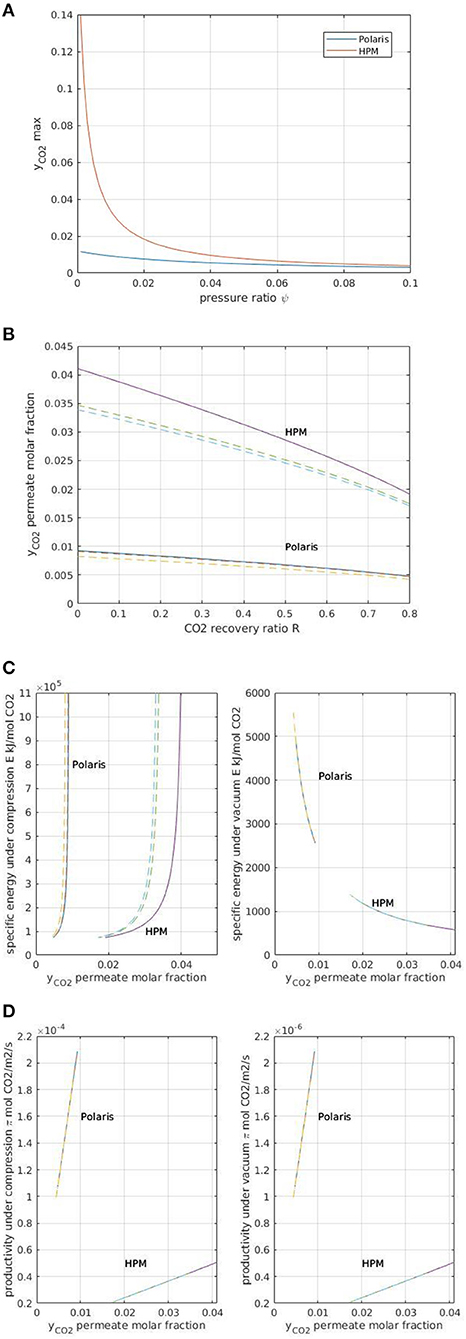
Figure 7. (A) Maximal permeate purity y as a function of module pressure ratio (ψ) for an advanced membrane material HPM (α = 680, PCO2 = 2,500 GPU) in comparison with Polaris membrane. (B) Purity (y) vs. recovery (R) for DAC with Polaris and HPM membranes. Continuous lines correspond to the classical simulation framework detailed in the text section (section Overall Framework). Dotted lines correspond to a rigorous simulation taking into account concentration polarization effects on the retentate side (gas-phase mass transfer coefficient 10−1 m.s−1, gas-phase velocity 1 m.s−1). (C) Specific energy requirement E (expressed in kJ per mol of recovered CO2) for a single-stage module under feed compression and vacuum pumping conditions for Polaris and HPM membranes. Module pressure ratio 0.01. Continuous lines, classical simulation framework; dotted lines, simulations taking into account concentration polarization effects on the retentate side. (D) Module productivity π (expressed in mol of recovered CO2 per m2 surface area) for a single-stage module under feed compression or vacuum pumping conditions and for Polaris and HPM membranes. Module pressure ratio 0.01. Continuous lines, classical simulation framework; dotted lines, simulations taking into account concentration polarization effects on the retentate side.
The purity–recovery trade-off is shown in Figure 7B for Polaris and HPM. The impact of concentration polarization, which is expected to be significant only for highly permeable and selective membranes, has also been added for the sake of comparison (Favre, 2017). The negligible impact of this phenomenon on Polaris membrane is confirmed; numerous process simulation studies previously conducted (Baker, 2004; Favre, 2007, 2017) which did not take into account this effect are thus validated. For HPM however, concentration polarization, corresponding to the occurrence of a non-negligible mass transfer resistance in the gas phase (retentate side), should be taken into account. Because pushing CO2 purity is likely to be of great interest for DAC, high selectivity and high permeance membrane materials are expected to be necessary. These results show that, in that case, the concentration polarization effect should be included in the simulation studies. Experimental and simulation studies indeed suggest a 100 selectivity/1,000 GPU permeance threshold for this phenomenon to be significant (Lüdtke et al., 1998; Mourgues and Sanchez, 2005).
The advantages of HPM in terms of specific energy requirement are shown in Figure 7C. For feed compression, HPM enables a higher purity to be attained compared to the Polaris membrane for a similar specific energy requirement. This result is typical of a low module stage cut, where permeate purity can be tuned mostly by changing the module pressure ratio. A specific purity/energy requirement curve is obtained, with a shift toward higher purities when a more selective membrane is used. A completely different behavior is obtained for vacuum pumping. In that case, a significantly higher purity is obtained with HPM, together with a much lower energy requirement. The interest to select a vacuum pumping strategy when energy efficiency has to be maximal is thus confirmed (Favre, 2007, 2017; Belaissaoui et al., 2014).
Figure 7D compares the specific productivity of Polaris and HPM membranes as a function of CO2 purity. It is shown that the increased purity obtained by the HPM membrane is associated with significantly lower productivity. Increasing selectivity indeed systematically induces a larger membrane surface area requirement due to the faster decrease in the driving force as the permeating purity increases (Baker, 2004). This somehow counterintuitive relationship led to the promotion of high permeance rather than very high selectivity membranes for CCS application (Baker, 2004; Merkel et al., 2010). Interestingly, the feed compression and vacuum pumping curves (Figure 7D) show a similar pattern except for a factor of 100 in terms of specific productivity. This peculiar behavior results from the specific conditions of DAC: with a very low stage cut, the upstream CO2 concentration is almost constant. So, for a given permeate concentration (i.e., CO2 purity y), the driving force between feed compression and vacuum pumping will simply depend on the pressure ratio. The two orders of magnitude between the two figures are thus a direct consequence of the pressure ratio, namely the value of 0.01.
In the last step, the impact of air compounds (other than nitrogen and carbon dioxide) has been studied. It is in fact important to know whether oxygen or water (which are present in the air feed for DAC application) are found in the enriched carbon dioxide flow rate (i.e., permeate outlet of a membrane module). Depending on the target application of the captured CO2, it can be necessary to remove oxygen or humidity, or ensure a threshold value; this holds particularly for CCU, where catalytic conversion can be, in some cases, sensitive to oxygen or wet CO2 feed.
In order to evaluate the composition of the CO2 outlet stream, a series of simulations have been performed with a multicomponent feed stream corresponding to air (N2 79%, O2 21%, CO2 400 ppm, dry basis), saturated in humidity at 25C. A Polyactive™ membrane has been taken for simulation purposes because permeance data for these compounds have been reported (Brinkmann et al., 2017); the results are shown in Figure 8. Because polymeric membranes always show a very high permeability toward water and a larger oxygen permeability than nitrogen permeability, the permeate is enriched in oxygen and collects almost integrally the water feed flux. This point has to be stressed, both for CO2 chemical transformation and for hybrid processes (humidity can impact adsorption processes for instance, and these results show that a membrane unit installed before a PSA system will generate a wet CO2 stream). Taking into account again the hypothesis that low stage cut conditions are more appropriate for DAC, it can be concluded that a single-stage membrane CO2 stream with a classical CO2 selective polymeric membrane will contain around 29% oxygen, 30% water, 40% nitrogen, and up to 1% CO2. This set of information can be of interest when membrane processes are considered for DAC applications, be it for CCU or direct use (Figure 1).
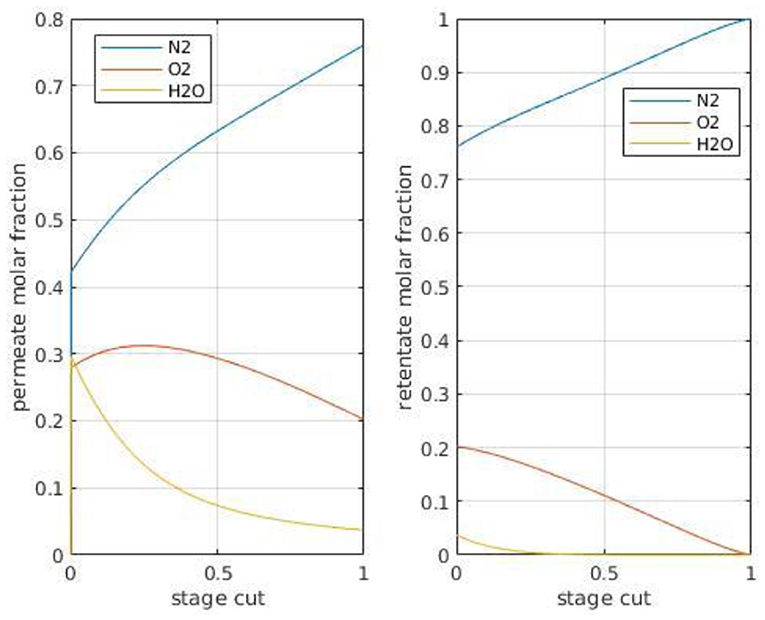
Figure 8. Retentate (xout) and permeate (y) compositions for different air compounds as a function of module stage cut with a Polyactive membrane (#2 in Table 2). Permeance in GPU: CO2: 1,100, N2: 28.5, O2: 77.8, H2O: 2,000 (Brinkmann et al., 2017). Pressure ratio (ψ) 0.01, cross plug flow conditions.
It is likely that non-polymeric membranes will show different behaviors. Unfortunately, the permeance of oxygen and water is most often not reported in studies on advanced carbon capture materials.
Based on the set of simulations detailed above, the different ranges of permeate compositions and process performances have been described. From a practical point of view, the limited CO2 purity level which is attainable can be anticipated to be too low for several target applications. The single-stage option should then be discarded, and multistaged processes must be considered (Favre, 2017). A typical membrane cascade used to increase purity for a fast compound is shown in Figure 9. A large spectrum of connection possibilities and module conditions can be investigated so that the most efficient design is selected. Because a high purity is needed, a simple permeate to feed connection, with no recycling loop, is likely to be of interest (Baker, 2004). Basically, each set of module pressure ratio and stage cut will generate a specific process separation performance, as shown on the graph in Figure 9. Taking the θ, ψ pair as a degree of freedom for each membrane stage, an increased CO2 purity will be obtained according to the step-by-step construction shown in the figure. Taking 2 and 12% as the upper one-stage purity level for polymeric and advanced membrane materials (Figures 6A, 7A), respectively, purities around 50 and 98% could be theoretically obtained with a two-stage process. Nevertheless, because these calculations correspond to a minimum pressure ratio (that is a maximal energy requirement) and a minimal stage cut, a more realistic set of conditions should be selected. This suggests a systematic process synthesis study to be achieved in order to identify the most cost-effective two-stage solution for different CO2 purity levels.
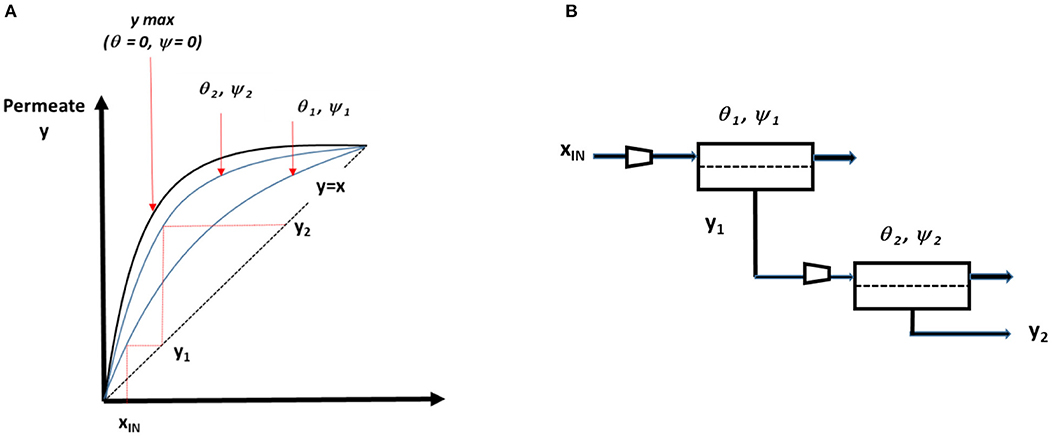
Figure 9. Generic composition curve of a multistage membrane process for DAC and the corresponding two-stage process design. Simulations enable the permeate composition to be predicted for a set of pressure ratio, stage cut, and membrane performances. The maximal purity, shown by the upper bold line on graph (A) is obtained for vanishing pressure ratio (i.e., maximal energy requirement) and vanishing stage cut (i.e., minimal productivity). Different purity performances can be obtained for each set of ψ and θ. CO2 purity can gradually increase as a function of each module outlet (permeate) and operating conditions. An infinite number of solutions are possible for a given target composition (y2 for the two-stage example shown). The best set of ψ and θ values can be identified by process optimization methods if a cost function is defined. (B) Example of a multistage membrane process.
In the last step, a tentative comparison between the key performance indicators of membrane processes and absorption and adsorption processes is proposed and shown in Table 3. A synoptic graph showing the range of performances of DAC, CCS, and biomass is also shown in Figure 10. In Table 3, CCUS and DAC are considered so that the impact of CO2 feed dilution is highlighted. Besides the separation performances, namely CO2 purity (y) and recovery (R), existing data on energy requirement (E) and specific production capacity, expressed on a volume basis (C, expressed in kg CO2.m−3.s−1) have been gathered. Production capacity C is of major interest in order to evaluate the footprint of the process. For membrane processes, C can be obtained from module productivity π as soon as a specific membrane surface area is defined; a typical value of 5,000 m2.m−3 has been taken for the membrane gas separation modules (Baker, 2004). The objective is to picture, roughly, the pros and cons of the different CO2 capture processes. It is obvious that, for DAC, very few studies and data are available and the numbers indicated in the table should not be considered definitive. Given a large number of possibilities and process options, it is likely that different performance levels could be achieved in the near future.
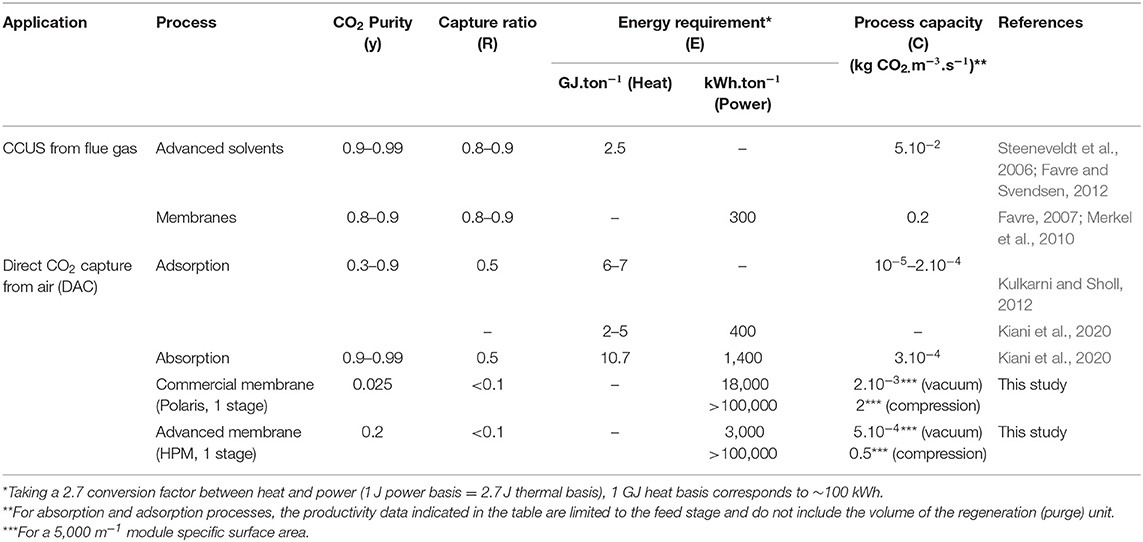
Table 3. Tentative comparison of key performance indicators of CCUS and DAC processes, based on existing studies.
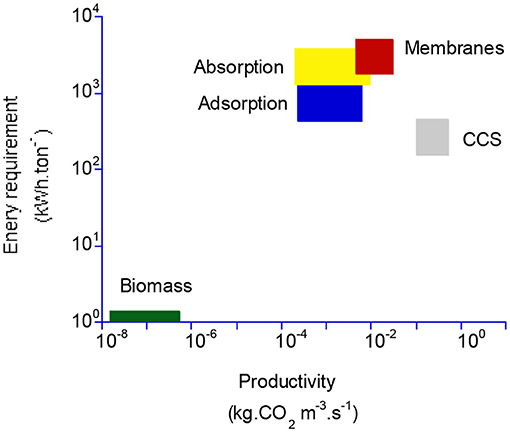
Figure 10. Tentative map showing the energy and productivity performances of different DAC processes, compared to biomass and CCS. The range of performances for each technology is based on a very limited number of studies and should not be considered definitive. The very broad range of the two indicators is noticeable. Compared to biomass productivity in terms of carbon storage (Xu et al., 2014), DAC technologies offer a strong increase at the expense of a very large energy requirement.
It is interesting to note, however, that DAC energy efficiency and productivity performance are always far lower than post-combustion carbon capture. The very broad range of performance indicators for the different DAC processes should also be highlighted. For membrane processes, the very high energy requirement of compression is probably not acceptable (unless strategies such as energy recovery systems are used); vacuum pumping should thus be favored, ideally in combination with high-performance materials. In the latter case, the energy requirement is close to absorption processes, and the productivity is in the same range as that of the absorption columns. The major limitation of membrane processes compared to adsorption and absorption is the low achievable purity. To that extent, multistage processes should be investigated. It might be that a two-stage process, making use of high-performance membrane materials and an optimal set of operating conditions, offers attractive performances in terms of purity/energy/productivity.
In the last step, a preliminary estimate of the cost of the membrane processes for DAC has been made, based on a cost function previously proposed for air separation or natural gas treatment (Bozorg et al., 2019, 2020). A cost of $50 per m2 of the membrane has been taken and a two-step process with HPM membrane (Figure 9B), operated under vacuum (1 to 10 mBar) with a very low stage cut (around 0.01) has been used. The overall cost is obtained to be 3–10 k$ per ton of CO2. This is in agreement with preliminary estimates, which predict the capture cost to be $1,000 or more per ton using rules of thumb estimations (House et al., 2011).
This study intended to explore the separation performances of a single-stage membrane module for the application of Direct Air Capture. Different membrane materials and a broad range of operating conditions have been investigated through a parametric engineering study.
The main conclusions of the study are summarized hereafter. First, with the existing (commercially available) membrane materials, the maximal outlet CO2 purity of a single-stage unit is around 2%. This calls for either multistaged processes or high-performance materials in order to achieve higher purity levels. A two-stage process with existing commercial materials could achieve, at best, a purity in the range of 50%.
Given the strong sensitivity of purity vs. CO2 recovery ratio R, a low module stage cut should be favored. This strongly differs from the carbon capture framework (for which R > 0.8) and should correspond to a negligible impact of module hydrodynamics (plug flow or perfectly mixed flow) on separation performances. Concentration polarization effects are negligible with the current polymeric membranes for carbon capture. A low stage cut will however generate high specific feed flow rates for a target permeate production level. In that case, a module pressure drop impact, which has been neglected in this study, is likely to play a role.
The specific energy requirement E is minimized by vacuum pumping operation, but a large membrane surface area is then required. Very high membrane permeance is thus of major importance in order to minimize the size of the installations.
The minimal specific energy requirement of membrane processes for DAC with currently commercially available materials is around 18,000 kWh.ton−1, which is very high compared to the upper range of adsorption and absorption processes.
Polymeric membranes generate a CO2 flux with significant oxygen content and water. This has to be taken into account, depending on the target use of the CO2. For some thermal or catalytic conversion processes, oxygen and/or water can be problematic and additional polishing steps might be needed.
High-performance materials, more recently reported with CO2/N2 selectivity levels way above 100, offer promising breakthrough process possibilities. The concentration polarization effect should however be systematically taken into account in order to achieve rigorous evaluations in that case. CO2 purity can reach 12% with a single-stage process and up to 99% with a two-stage process. Moreover, the energy requirement drops down to 3,000 kWh.ton−1 for vacuum operation, with slightly higher specific productivity than absorption and adsorption processes. A preliminary cost analysis generates an overall cost in the range of 3–10 k$ per ton of CO2 for a two-stage process.
Globally speaking, process comparisons of gas separation technologies are rather limited (Prasad et al., 1994). This study offers the first set of data for a critical comparison of membrane processes for DAC, which is a very specific and challenging application; it can also be useful for preliminary technico-economical studies. In terms of perspectives, the rather low CO2 purity that can be produced at the permeate side (y) is likely to be unacceptable for a series of applications. With currently commercially available membranes, the 2% CO2 concentration could be of interest for the intensification of greenhouses or algae ponds. The 12% CO2 concentration that could be achievable with high-performance materials (such as the one detailed in this study) globally corresponds to that of a power plant flue gas and may offer more attractive performances for direct use. It might also be that it still represents too large a dilution into N2 (inert gas). In that event, multistage membrane units or hybrid processes could be of interest. It is expected that the results reported in this study will stimulate further efforts and help to identify the best place and role of membrane processes for DAC.
The raw data supporting the conclusions of this article will be made available by the authors, without undue reservation.
All authors listed have made a substantial, direct and intellectual contribution to the work, and approved it for publication.
The authors declare that the research was conducted in the absence of any commercial or financial relationships that could be construed as a potential conflict of interest.
Baciocchi, R., Storti, G., and Mazzotti, M. (2006). Process design and energy requirements for the capture of carbon dioxide from air. Chem. Eng. Process. 45,1047–1058. doi: 10.1016/j.cep.2006.03.015
Baker, R. (2004). Membrane Technology and Applications. (Chichester, NY: J. Wiley). doi: 10.1002/0470020393
Baker, R. W., and Low, T. B. (2014). Gas separation membrane materials: a perspective. Macromolecules 47, 6999–7013. doi: 10.1021/ma501488s
Belaissaoui, B., Le Moullec, Y., Hagi, H., and Favre, E. (2014). Energy efficiency of oxygen enriched air technologies: cryogeny vs membrane separation. Sep. Purificat. Technol. 125, 142–150. doi: 10.1016/j.seppur.2014.01.043
Bounaceur, R., Berger, E., Pfister, M., Ramirez Santos, A. A., and Favre, E. (2017). Rigorous variable permeability modelling and process simulation for the design of polymeric membrane gas separation units: MEMSIC simulation tool. J. Membr. Sci. 523, 77–91. doi: 10.1016/j.memsci.2016.09.011
Bozorg, M., Addis, B., Piccialli, V., Castel, C., Pinnau, I., and Favre, E. (2019). Polymeric membrane materials for nitrogen production from air: a process synthesis study. Chem. Eng. Sci. 207, 1196–1213. doi: 10.1016/j.ces.2019.07.029
Bozorg, M., Ramírez-Santos, Á. A., Addis, B., Piccialli, V., Castel, C., and Favre, E. (2020). Optimal process design of biogas upgrading membrane systems: polymeric vs. high performance inorganic membrane materials. Chem. Eng. Sci. 225:115769. doi: 10.1016/j.ces.2020.115769
Brinkmann, T., Lillepärg, J., Notzke, H., Pohlmann, J., Shishatskiy, S., Wind, J., et al. (2017). Development of CO2 selective poly(ethylene oxide)-based membranes: from laboratory to pilot plant scale. Engineering 3, 485–493. doi: 10.1016/J.ENG.2017.04.004
Castel, C., Wang, L., Corriou, J. P., and Favre, E. (2018). Steady vs unsteady membrane gas separation processes. Chem. Eng. Sci. 183, 136–147. doi: 10.1016/j.ces.2018.03.013
Chen, Z., Deng, S., Wei, H., Wang, B., Huang, J., and Yu, G. (2013). Polyethylenimine-impregnated resin for high CO2 adsorption: an efficient adsorbent for CO2 capture from simulated flue gas and ambient air. ACS Appl. Mater. Interfaces 5, 6937–6945. doi: 10.1021/am400661b
Davidson, O., and Metz, B. (2005). Special Report on Carbon Dioxide Capture and Storage. Geneva: International Panel on Climate Change.
Favre, E. (2007). carbon dioxide recovery from post combustion processes: Can gas permeation membranes compete with absorption? J. Membrane Sci. 294, 50–59. doi: 10.1016/j.memsci.2007.02.007
Favre, E. (2017). “Polymeric membranes for gas separation,” in Comprehensive Membrane Science and Technology, eds E. Drioli and L. Giorno (New York, NY: Elsevier). doi: 10.1016/B978-0-12-409547-2.12743-X
Favre, E., and Svendsen, H. F. (2012). Membrane contactors for intensified post-combustion carbon dioxide capture by gas–liquid absorption processes. J. Membr. Sci. 407–408, 1–7. doi: 10.1016/j.memsci.2012.03.019
Field, C. B., and Mach, K. J. (2017). Rightsizing carbon dioxide removal. Science 356, 706–707. doi: 10.1126/science.aam9726
Figueroa, D. J., Fout, T., Plasynski, S., McIlvried, H., and Srivastava, R. D. (2008). Advances in CO2 capture technology—the U.S. Department of energy's carbon sequestration program. Int. J. Greenhouse Gas Control 2, 9–20. doi: 10.1016/S1750-5836(07)00094-1
Gascon, J., and Kapteijn, F. (2010). Metal-organic framework membranes– high potential, bright future? Angew. Chem. Int. Ed. 49, 1530–1532. doi: 10.1002/anie.200906491
Gebald, C., Wurzbacher, J. A., Borgschulte, A., Zimmermann, T., and Steinfeld, A. (2014). Single-component and binary CO2 and H2O adsorption of amine- functionalized cellulose. Environ. Sci. Technol. 48, 2497–2504. doi: 10.1021/es404430g
Geim, A. K. (2009). Graphene: status and prospects. Science 324, 1530–1534. doi: 10.1126/science.1158877
Greenwood, K., and Pearce, M. (1953). The removal of carbon dioxide from atmospheric air by scrubbing with caustic soda in packed towers. Trans. Inst. Chem. Eng. 31, 201–207. doi: 10.1021/cen-v031n042.p4324
Hauchhum, L., and Mahanta, P. (2014). Carbon dioxide adsorption on zeolites and activated carbon by pressure swing adsorption in a fixed bed. Int. J. Energy Environ. Eng. 5, 349–356. doi: 10.1007/s40095-014-0131-3
House, K. Z., Baclig, A. C., Ranjan, M., van Nierop, E., Wilcox, J., and Herzog, H. (2011). Economic and energetic analysis of capturing CO2 from ambient air. Proc. Natl. Acad. Sci. U. S. A. 108, 20428–20433. doi: 10.1073/pnas.1012253108
Hwang, H. T., Harale, A., Liub, P., Sahimia, M., and Tsotsis, T. T. (2008). A membrane-based reactive separation system for CO2 removal in a life support system. J. Membrane Sci. 315, 116–124. doi: 10.1016/j.memsci.2008.02.018
Kaldis, S. P., Kapantaidakis, G. C., and Sakellaropoulos, G. P. (2000). Simulation of multicomponent gas separation in a hollow fiber membrane by orthogonal collocation—hydrogen recovery from refinery gases. J. Membr. Sci. 173, 61–71. doi: 10.1016/S0376-7388(00)00353-7
Keith, D. (2009). Why capture CO2 from the atmosphere?, Science, 325, 1654–1655. doi: 10.1126/science.1175680
Keith, D. W., Holmes, G., Angelo, D., and Heidel, K. (2018). A process for capturing CO2 from the atmosphere. Joule 2, 1573–1594. doi: 10.1016/j.joule.2018.05.006
Kiani, A., Jiang, K., and Feron, P. (2020). Techno-economic assessment for CO2 capture from air using a conventional liquid-based absorption process. Front. Energy Res. 8:92. doi: 10.3389/fenrg.2020.00092
Kulkarni, A. R., and Sholl, D. S. (2012). Analysis of equilibrium based TSA processes for direct capture of CO2 from air. Ind. Eng. Chem. Res. 51, 8631–8645. doi: 10.1021/ie300691c
Lackner, K. S. (2003). A guide to CO2 sequestration. Science 300, 1677–1678. doi: 10.1126/science.1079033
Lackner, K. S. (2016). The promise of negative emissions. Science 354:714. doi: 10.1126/science.aal2432
Li, H., Song, Z., Zhang, X., Huang, Y., Li, S., Mao, Y., et al. (2013). Ultrathin, molecular-sieving graphene oxide membranes for selective hydrogen separation. Science 342, 95–98. doi: 10.1126/science.1236686
Lüdtke, O., Behling, R. D., and Ohlrogge, K. (1998). Concentration polarization in gas permeation. J. Membr. Sci. 146, 145–157. doi: 10.1016/S0376-7388(98)00104-5
Lyndon, R., Konstas, K., Ladewig, B. P., Southon, P. D., Kepert, P. C., and Hill, M. R. (2013). Dynamic photo-switching in metalorganic frameworks as a route to low-energy carbon dioxide capture and release. Angew. Chem. Int. Ed. Engl. 52, 3695–3698. doi: 10.1002/anie.201206359
Merkel, T., Lin, H., Wei, X., and Baker, R. (2010). Power plant post-combustion carbon dioxide capture: an opportunity for membranes. J. Membrane Sci. 359, 126–139. doi: 10.1016/j.memsci.2009.10.041
Mourgues, A., and Sanchez, J. (2005). Theoretical analysis of concentration polarization in membrane modules for gas separation with feed inside the hollow-fibers. J. Membr. Sci. 252, 133–144. doi: 10.1016/j.memsci.2004.11.024
Pan, C.-Y., and Habgood, H. W. (1978). Gas separation by permeation part I. Calculation methods and parametric analysis. Can. J. Chem. Eng. 56, 197–209. doi: 10.1002/cjce.5450560207
Prasad, R., Shaner, R. L., and Doshi, K. J. (1994). “Comparison of membranes with other gas separation technologies,” in Polymeric Gas Separation Membranes, eds D. R. Paul and Y. P. Yampol'skii (Boca Raton, FL: CRC Press, Inc.).
Rahaman, M. S. A., Zhang, L., Cheng, L. H., Xu, L. H., and Chen, H. L. (2012). Capturing carbon dioxide from air using a fixed carrier facilitated transport membrane. RSC Adv. 2, 9165–9172. doi: 10.1039/c2ra20783d
Robeson, L. M. (2008). The upper bound revisited. J. Membrane Sci. 320, 390–400. doi: 10.1016/j.memsci.2008.04.030
Sanz-Pérez, S., Murdock, C. R., Didas, S. A., and Jones, C. W. (2016). Direct capture of CO2 from ambient air. Chem. Rev. 116, 11840–11876 doi: 10.1021/acs.chemrev.6b00173
Senftle, T. P., and Carter, E. A. (2017). The holy grail: chemistry enabling an economically viable CO2 capture. Utilization and storage strategy. Acc. Chem. Res. 50, 472–475. doi: 10.1021/acs.accounts.6b00479
Skoulidas, A. I., Ackerman, D. M., Johnson, J. K., and Sholl, D. S. (2002). Rapid transport of gases in carbon nanotubes. Phys. Rev. Lett. 89:185901. doi: 10.1103/PhysRevLett.89.185901
Steeneveldt, R., Berger, B., and Torp, T. A. (2006). CO2 capture and storage: closing the knowing doing gap. Chem. Eng. Res. Dev. 84–A9, 739–763. doi: 10.1205/cherd05049
Tepe, J. B., and Dodge, B. F. (1943). Absorption of carbon dioxide by sodium hydroxide solutions in a packed column. Trans. Am. Inst. Chem. Eng. 39, 255–276.
Verdegaal, W. M., Wang, K., Sculley, J. P., Wriedt, M., and Zhou, H. C. (2016). Evaluation of metal-organic frameworks and porous polymer networks for CO2-capture applications. ChemSusChem 9, 636–643. doi: 10.1002/cssc.201501464
Wang, T., Lackner, K. S., and Wright, A. B. (2013). Moisture-swing sorption for carbon dioxide capture from ambient air: a thermodynamic analysis. Phys. Chem. Chem. Phys. 15, 504–514. doi: 10.1039/C2CP43124F
Weller, S., and Steiner, A. W. (1950). Separation of gases by fractional permeation through membranes. J. Appl. Phys. 21, 279–283. doi: 10.1063/1.1699653
Wilcox, J. (2020). An electro-swing approach. Nat. Energy 5, 121–122. doi: 10.1038/s41560-020-0554-4
Wright, A. B., Lackner, K. S., and Ginster, U. (2010). Method and Apparatus for Extracting Carbon Dioxide from Air.
Wu, D., Yi, C., Wang, W., Wang, Y., Yang, B., and Qi, S. (2019). Membrane separation process modeling for CO2 partial removal in prepurification of air separation units. Chem. Eng. Commun. 12, 1676–1688. doi: 10.1080/00986445.2019.1570162
Wurzbacher, J. A., Gebald, C., Piatkowski, N., and Steinfeld, A. (2012). Concurrent separation of CO2 and H2O from air by a temperature- vacuum swing adsorption/desorption cycle. Environ. Sci. Technol. 46, 9191–9198. doi: 10.1021/es301953k
Xu, B., Yang, Y., Li, P., Shen, H., and Fang, J. (2014). Global patterns of ecosystem carbon flux in forests: a biometric data-based synthesis. Glob. Biogeochem. Cycles 28, 962–973. doi: 10.1002/2013GB004593
Yuan, S., Zou, L., Qin, J. S., Li, J., Huang, L., Feng, L., et al. (2017). Construction of hierarchically porous metal–organic frameworks through linker labilization. Nat. Commun. 8:15356. doi: 10.1038/ncomms15356
Keywords: membrane, gas, carbon dioxide, engineering, air, capture
Citation: Castel C, Bounaceur R and Favre E (2021) Membrane Processes for Direct Carbon Dioxide Capture From Air: Possibilities and Limitations. Front. Chem. Eng. 3:668867. doi: 10.3389/fceng.2021.668867
Received: 17 February 2021; Accepted: 06 April 2021;
Published: 29 April 2021.
Edited by:
Adele Brunetti, National Research Council (CNR), ItalyReviewed by:
Zeinab Abbas Jawad, Qatar University, QatarCopyright © 2021 Castel, Bounaceur and Favre. This is an open-access article distributed under the terms of the Creative Commons Attribution License (CC BY). The use, distribution or reproduction in other forums is permitted, provided the original author(s) and the copyright owner(s) are credited and that the original publication in this journal is cited, in accordance with accepted academic practice. No use, distribution or reproduction is permitted which does not comply with these terms.
*Correspondence: Christophe Castel, Y2hyaXN0b3BoZS5jYXN0ZWxAdW5pdi1sb3JyYWluZS5mcg==
Disclaimer: All claims expressed in this article are solely those of the authors and do not necessarily represent those of their affiliated organizations, or those of the publisher, the editors and the reviewers. Any product that may be evaluated in this article or claim that may be made by its manufacturer is not guaranteed or endorsed by the publisher.
Research integrity at Frontiers
Learn more about the work of our research integrity team to safeguard the quality of each article we publish.