 Li Zhong
 Evanna L. Gleason
- Department of Biological Sciences, Louisiana State University, Baton Rouge, LA, United States
The strength and sign of synapses involving ionotropic GABA and glycine receptors are dependent upon the Cl− gradient. We have shown that nitric oxide (NO) elicits the release of Cl− from internal acidic stores in retinal amacrine cells (ACs); temporarily altering the Cl− gradient and the strength or even sign of incoming GABAergic or glycinergic synapses. The underlying mechanism for this effect of NO requires the cystic fibrosis transmembrane regulator (CFTR) but the link between NO and CFTR activation has not been determined. Here, we test the hypothesis that NO-dependent Ca2+ elevations activate the Ca2+-dependent adenylate cyclase 1 (AdC1) leading to activation of protein kinase A (PKA) whose activity is known to open the CFTR channel. Using the reversal potential of GABA-gated currents to monitor cytosolic Cl−, we established the requirement for Ca2+ elevations. Inhibitors of AdC1 suppressed the NO-dependent increases in cytosolic Cl− whereas inhibitors of other AdC subtypes were ineffective suggesting that AdC1 is involved. Inhibition of PKA also suppressed the action of NO. To address the sufficiency of this pathway in linking NO to elevations in cytosolic Cl−, GABA-gated currents were measured under internal and external zero Cl− conditions to isolate the internal Cl− store. Activators of the cAMP pathway were less effective than NO in producing GABA-gated currents. However, coupling the cAMP pathway activators with the release of Ca2+ from stores produced GABA-gated currents indistinguishable from those stimulated with NO. Together, these results demonstrate that cytosolic Ca2+ links NO to the activation of CFTR and the elevation of cytosolic Cl−.
Introduction
Retinal amacrine cells (ACs) are interneurons located in the inner plexiform layer (IPL) where they make synaptic contacts with bipolar cells, ganglion cells, and other ACs. Most ACs are either GABAergic or glycinergic and affect excitatory synapses via presynaptic inhibition with output to bipolar cell synaptic terminals and postsynaptic inhibition onto ganglion cell dendrites and AC processes (MacNeil and Masland, 1998; Grimes, 2012; Diamond, 2017). Inhibition occurs when GABA or glycine binds to the ionotropic receptors which are ligand-gated Cl− channels. The electrochemical gradient of Cl− across the plasma membrane determines the postsynaptic voltage response because the membrane potential moves to the equilibrium potential for Cl− when GABA- or glycine-gated channels are open. Because the equilibrium potential for Cl− is largely determined by the cytosolic Cl− concentration, regulation of cytosolic Cl− is a key determinant of the strength and even sign of GABAergic and glycinergic synapses.
Cl− cotransporter is a well-known mechanism that regulates cytosolic Cl− concentration (Ben-Ari et al., 2012). The chloride cotransporters Na-K-2Cl (NKCC) and K-Cl (KCC) modulate the neuronal response to GABA and glycine by determining intracellular Cl− level using the Na+ and K+ gradients, respectively (Russell, 2000; Delpire and Mount, 2002; Payne et al., 2003; Gamba, 2005). Previous work in our lab has shown that nitric oxide (NO) can stimulate the release of Cl− from acidic intracellular stores in ACs by a mechanism involving the cystic fibrosis transmembrane conductance regulator (CFTR; Hoffpauir et al., 2006; Krishnan and Gleason, 2015; Krishnan et al., 2017).
CFTR is a Cl− channel that has two membrane spanning domains (MSD), two cytosolic nucleotide binding domains (NBD), and a regulatory domain (RD) that contains numerous phosphorylation sites. It is encoded by the CFTR gene and mutations in this gene cause the deleterious effects observed in cystic fibrosis (Riordan et al., 1989; Tsui, 1992; Quinton, 1999). This disease is associated with reduced chloride permeability across the apical epithelial membrane (Quinton and Bijman, 1983; Widdicombe et al., 1985).
The chloride channel CFTR can be regulated by protein kinases and it is most strongly activated by protein kinase A (PKA; Picciotto et al., 1992; Gadsby and Nairn, 1999). CFTR can also be modulated by Ca2+ signaling as well as the cAMP pathway in epithelia (Kunzelmann and Mehta, 2013; Bozoky et al., 2017). Instead of stimulating the CFTR channel directly, Ca2+ can activate calcium-dependent adenylate cyclase (AdC) isoforms 1, 3, or 8, leading to the production of cAMP and activation of PKA. PKA can phosphorylate the CFTR RD and then activate the CFTR Cl− channel (Halls and Cooper, 2011; Billet and Hanrahan, 2013). All AdC isoforms can be found in the central nervous system, but AdC8 is the least abundant (Xia et al., 1991; Mons et al., 1993). Although AdC3 is Ca2+/Calmodulin-activated, the sensitivity to Ca2+ is 100 times lower than that of AdC1 and activation requires the presence of other effectors such as forskolin or an activator of G proteins in human embryonic kidney 293 cells (Choi et al., 1992). The resting concentration of intracellular free Ca2+ in neurons typically ranges between 50 and 100 nM which matches the range of free Ca2+ producing half-maximal activation of AdC1 (Choi et al., 1992; Villacres et al., 1995; Masada et al., 2009).
We have previously demonstrated that NO leads to a CFTR-dependent release of internal Cl− (Krishnan et al., 2017). However, the mechanism underlying this effect was unknown. In a previous study on the regulation of L-type Ca2+ channels in ACs, we learned that AdC1 is expressed in both cell bodies and cell processes of ACs in culture (Tekmen and Gleason, 2010). We have also reported that NO can increase cytosolic Ca2+ (Maddox and Gleason, 2017). Another possibility is that NO directly activates CFTR via s-nitrosylation. Analysis of the chicken CFTR sequence with the bioinformatics program RecSNO (Siraj et al., 2021) predicts nine likely s-nitrosylation sites. However, our observation of NO-dependent Ca2+ elevations leads us to prioritize investigating the role of AdC1. Hence, we hypothesized that the NO-generated Ca2+ elevations in ACs activate AdC1, produce elevations in cAMP, and ultimately phosphorylation and activation of CFTR via PKA.
To test this hypothesis, whole-cell voltage clamp recording was used to monitor changes in AC cytosolic Cl− and Ca2+ imaging was used for monitoring cytosol Ca2+ concentration. We found that NO-dependent release of internal Cl− was inhibited when either cytosolic Ca2+ was buffered by BAPTA or the cAMP pathway was suppressed by inhibitors. These data suggest that Ca2+ is crucial for NO-dependent release of Cl− and it activates cAMP pathway through activation of AdC1.
Materials and Methods
Cell Culture
Retinas were dissected from 8-day chick embryos, and cells were plated on poly-L-Ornithine pre-processing dishes. Cells were first plated with Dulbecco’s modified Eagle’s medium (DMEM; Life Technologies), 5% fetal calf serum (Sigma, St. Louis, MO, USA), 100 U/ml penicillin, 100 μg/ml streptomycin, and 2 mM glutamine (Life Technologies), then fed every 2 days by replacing the media with feeding solution which contains neurobasal medium (Life Technologies), 1% B-27 nutrient medium and penicillin-streptomycin-glutamine (Life Technologies) for 2 weeks. For further details see Maddox and Gleason (2017). The experimental ACs were identified using established morphological criteria (Gleason et al., 1993) and were used for the experiment after 7–11 days in cultures.
Electrophysiology
Culture dishes were anchored on the stage of an Olympus IX70 inverted microscope. An Ag-AgCl reference pellet electrode was submerged in 3M KCl solution and connected to the dish through a 1% agarose salt bridge. Patch pipettes were pulled from thick-walled borosilicate glass (1.5 mm outer diameter, 0.86 mm inner diameter) using a P-97 Flaming/Brown Puller (Sutter Instruments, Novato, CA, USA). The pipettes were chosen by a tip resistance between 8 and 12 MΩ. Whole-cell voltage clamp recordings were performed using Axopatch 1D amplifier, Digidata 1322A data-acquisition board, and Clampex 10.0 (Molecular Devices, Sunnyvale, CA, USA). The external solution was pushed to the dish with a constant flow rate 1 ml/min via a pressurized 8-channel perfusion system (Automate Scientific, Berkeley, CA, USA). Data were obtained from the ACs that were not in contact with other neurons. The current-voltage relationship was corrected for series resistance and junction potential errors (13 mV), calculated from pClamp 10.0 calculator. For voltage ramp experiments, the voltage was held at −70 mV for 150 ms, then stepped to −90 ms for 50 ms and ramped from −90 mV to +50 mV over 200 ms before stepping back to −70 mV. Each sweep contained two ramps, the first was for measuring the leak currents for subtraction from the second ramp recorded in the presence of GABA (20 μM). The total time of the protocol for each sweep was 2.7 s. The GABAA receptor conductance was determined by calculating the slope of the current-voltage relationship from −60 mV to −40 mV.
For GABA pulse experiments, the voltage was held at −70 mV for 9.5 s, then exposed to GABA (20 μM) for 400 ms. Each sweep contained five GABA pulses and the total time of the sweep was 29 s. The largest GABA pulse response was chosen for analysis. The GABA-gated current amplitude with treatment was calculated by subtracting the control GABA-gated current with no test treatment. Each replicate indicates an individual cell. The experiments in Figure 5 (NO vs. cAMPct) and in Figure 8D (NO vs. cAMPct + ionomycin) were analyzed with the same NO control group because the experiments were done on the same group of cells. The external solution and GABA containing external solution flowed into the test dish through fast-step perfusion system SF-77C via 3-barrel square glass (Warner Instruments, Hamden, CT, USA). All experiments were performed at room temperature.
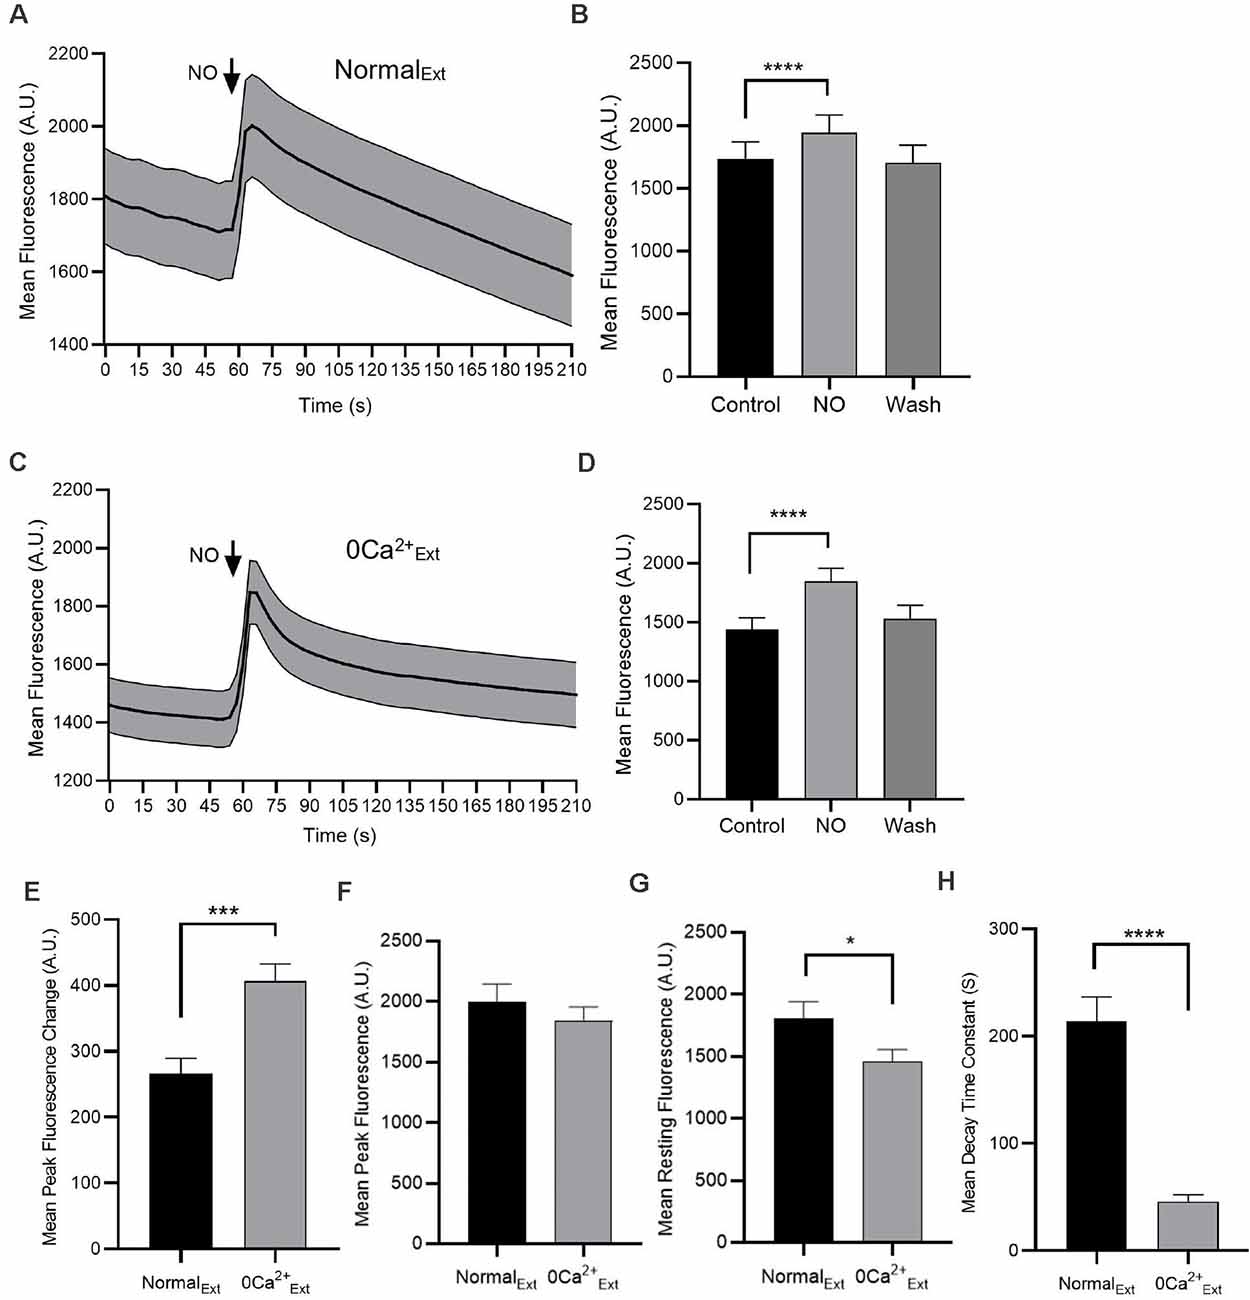
Figure 1. Nitric oxide (NO) increases cytosolic Ca2+ concentration. Fluorescence intensity measurements from Amacrine cells (ACs) loaded with Oregon Green BAPTA-1 488-AM are shown (A,C). (A) In the normal external solution, NO produces an increase in cytosolic Ca2+. (B) The quantified mean fluorescence ± SEM; n = 45. For the control group, the mean value is calculated as the average of the last 30 s data before adding NO. For the NO group, the mean value is calculated as the average of the middle 30 s during the NO response. For the wash group, the mean is calculated by using the average of the data from 150 to 177 s. ****P < 0.0001 (paired t-test). (C) In the absence of Ca2+ (0 Ca2+Ext), NO increases cytosolic Ca2+. (D) The quantified mean fluorescence ± SEM; n = 54. ****P < 0.0001 (paired t-test). (E) The quantified mean peak fluorescence ± SEM after subtracting baseline in normal external condition, n = 45 and in zero Ca2+ external condition, n = 54. ***P < 0.001 (unpaired t-test). (F) The quantified mean peak fluorescence ± SEM in normal external condition, n = 45 and in zero Ca2+ external condition, n = 54. P = 0.38 (unpaired t-test). (G) The quantified mean resting fluorescence ± SEM in normal external condition, n = 45 and in zero Ca2+ external condition, n = 54. *P < 0.05 (unpaired t-test). (H) The quantified mean decay time constant ± SEM in normal external condition, n = 33 and in zero Ca2+ external condition, n = 49. Data for each cell are fitted with one phase decay exponential curve. ****P < 0.0001 (unpaired t-test).
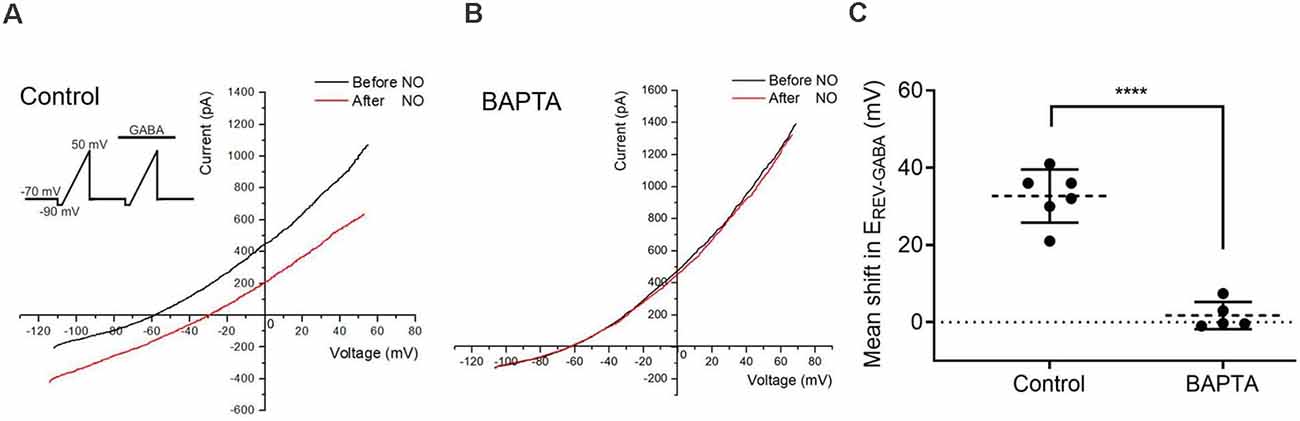
Figure 2. Calcium elevations are required for the NO-dependent release of internal Cl−. (A,B) The current-voltage relationship for the GABA-gated current (20 μM) before and after NO. Inset shows the voltage ramp protocol with GABA delivered during the second ramp. Under control conditions, EREV-GABA shifts to the right. With the Ca2+ chelator, BAPTA (50 μM) in the recording pipet, NO fails to elicit the EREV-GABA shift. (C) The quantified mean shift in EREV-GABA ± SEM; control, n = 6; BAPTA, n = 5. ****P < 0.0001 (unpaired t-test).
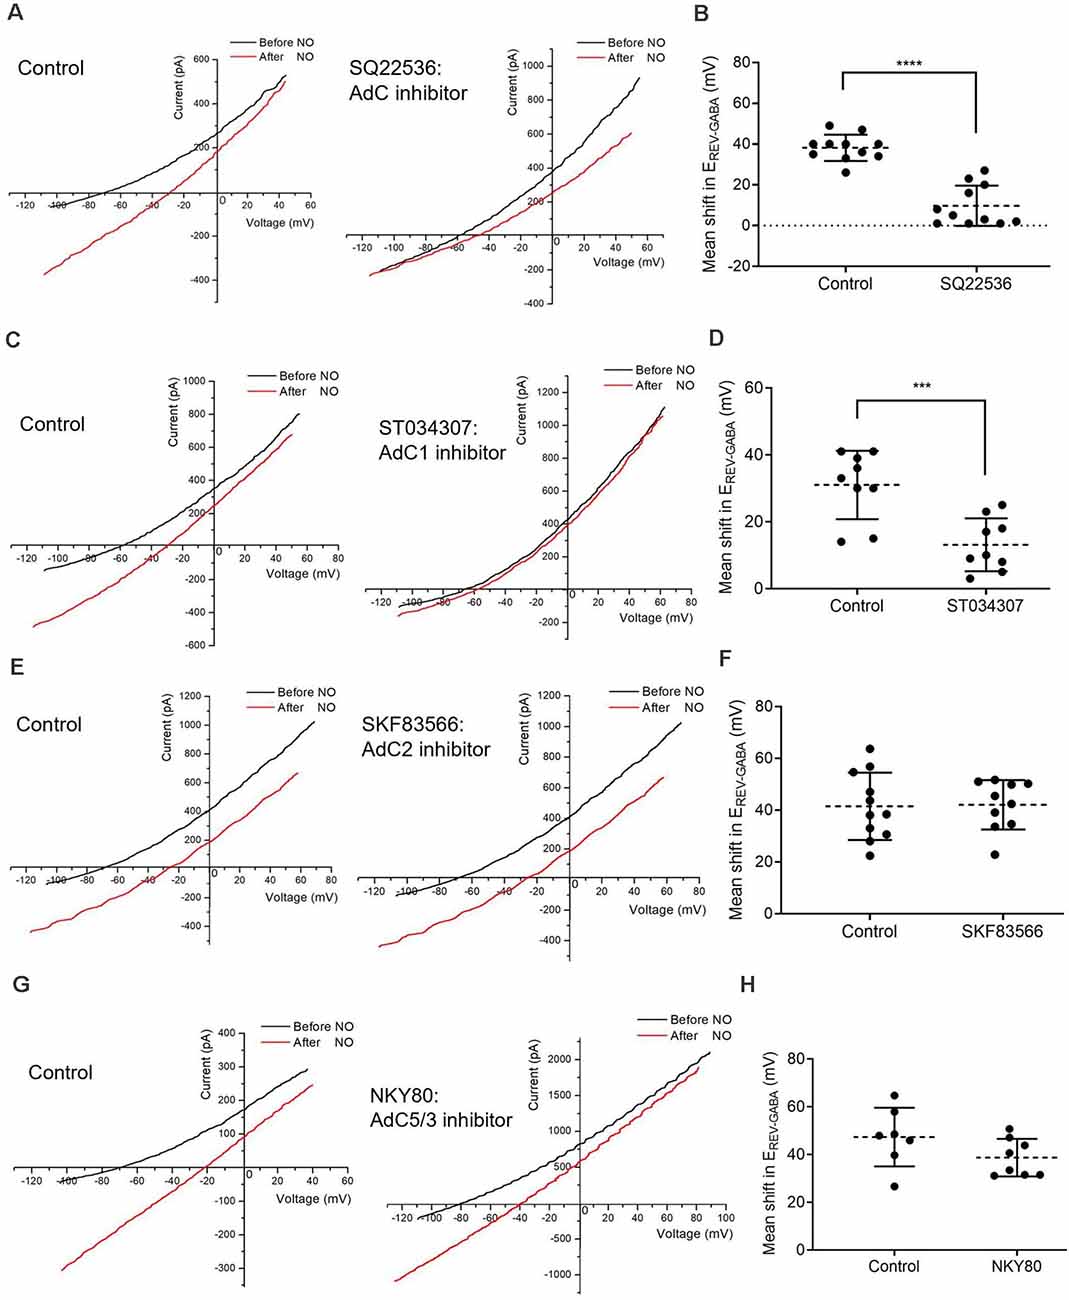
Figure 3. AdC1 inhibitors suppress NO-dependent Cl− release. (A) Data from cells recorded under control condition (left) or pre-incubated with general AdC inhibitor, SQ22536 (100 nM) for 30 mins (right) showing reduced shift amplitudes. (B) The quantified mean shift in EREV-GABA ± SEM; n = 11 each. ****P < 0.0001 (unpaired t-test). (C) Pre-incubation with AdC 1 inhibitor, ST034307 (100 nM) for 30 mins, suppresses the NO-dependent shift in EREV-GABA. (D) The quantified mean shift in EREV-GABA ± SEM; n = 9. ***P < 0.001 (unpaired t-test). (E) Pre-incubation with the AdC 2 inhibitor, SKF83566 (10 μM) for 20 mins, does not inhibit the NO-dependent shift in EREV-GABA. (F) The quantified mean shift in EREV-GABA ± SEM; control, n = 11; SKF83566, n = 10. P = 0.91 (unpaired t-test). (G) Pre-incubation with the AdC 5/3 inhibitor, NKY80 (200 μM) for 20 mins does not block the NO-dependent shift. (H) The quantified mean shift in EREV-GABA ± SEM; control, n = 7; NKY80, n = 8. P = 0.13 (unpaired t-test).
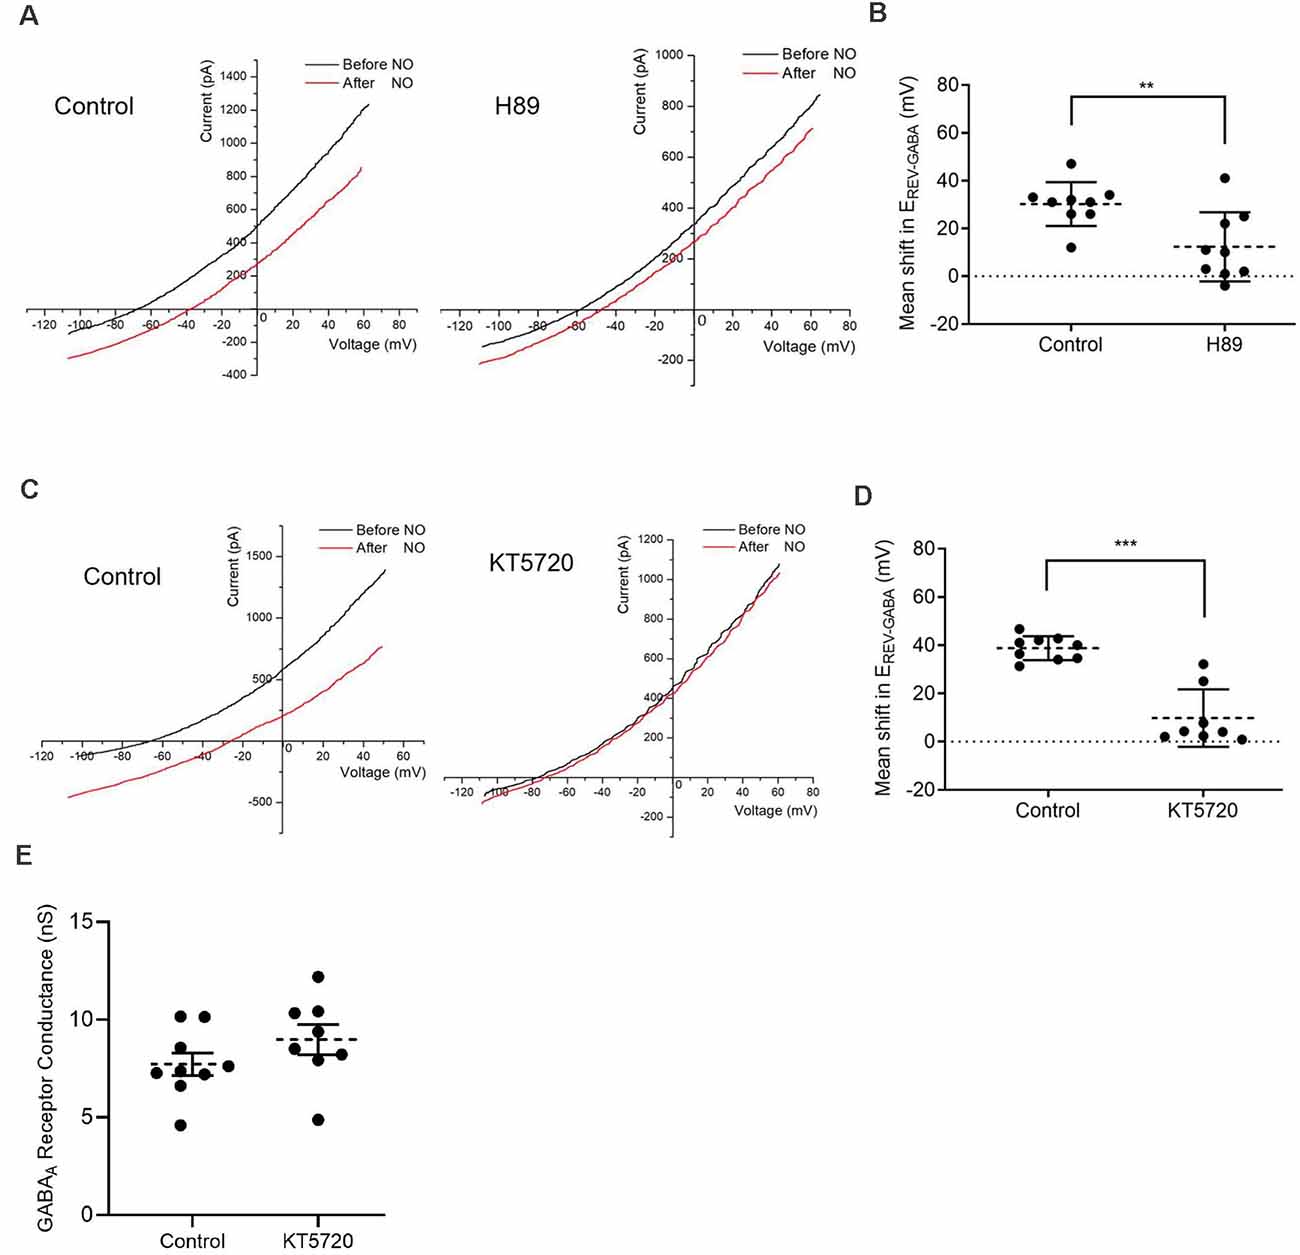
Figure 4. Protein kinase A (PKA) activity is required for the NO-dependent shift in EREV-GABA. (A) Date from cells recorded under control condition (left) or pre-incubated with a kinase inhibitor, H89 (1 μM) for 30 min (right) that suppresses the NO-dependent shift in EREV-GABA. (B) The quantified mean shift in EREV-GABA ± SEM; n = 9. **P < 0.01 (unpaired t-test). (C) Pre-incubation with selective PKA inhibitor, KT5720 (300 nM, 20 min), also reduces EREV-GABA. (D) The quantified mean shift EREV-GABA ± SEM; control, n = 9; KT5720, n = 8. ***P < 0.001 (Welch’s unpaired t-test). (E) Quantified mean GABAA receptor conductance ± SEM; control, n = 9; KT5720, n = 8. P = 0.2057 (unpaired t-test).
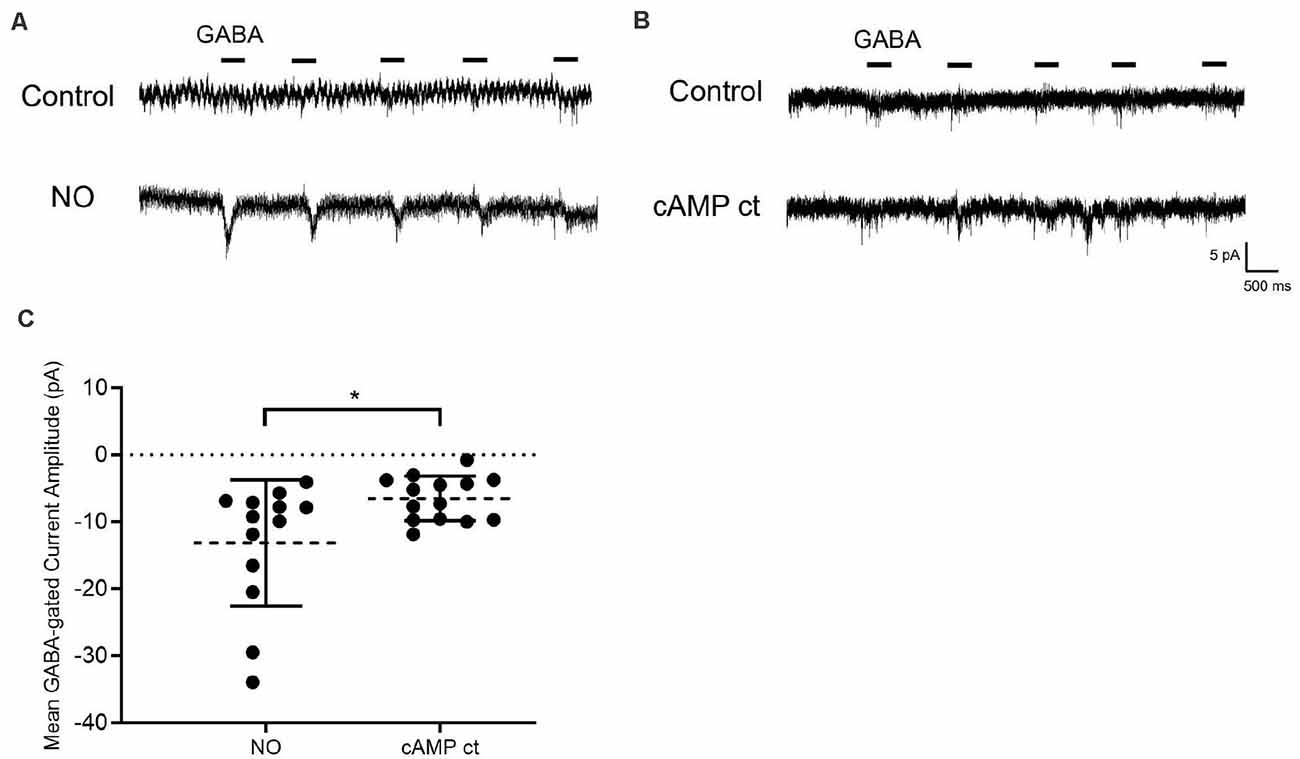
Figure 5. Elevating cAMP in the absence of NO promotes Cl− release from the internal store. (A) Sample traces from cells are held at −70 mV with GABA (20 μM) applied for 400 ms. In the presence of NO, a GABA-gated inward current appears indicating that Cl− had been released into the cytosol. (B) In different cells, exposure to a cocktail of reagents selected to elevate cAMP (cAMP ct: forskolin, 1 μM; 8-bromo-cAMP, 100 μM; IBMX, 20 μM) but no NO, results in a small GABA-dependent inward current. (C) The quantified mean GABA-gated current amplitude ± SEM; NO, n = 13; cocktail, n = 14. *P < 0.05 (Welch’s unpaired t-test).
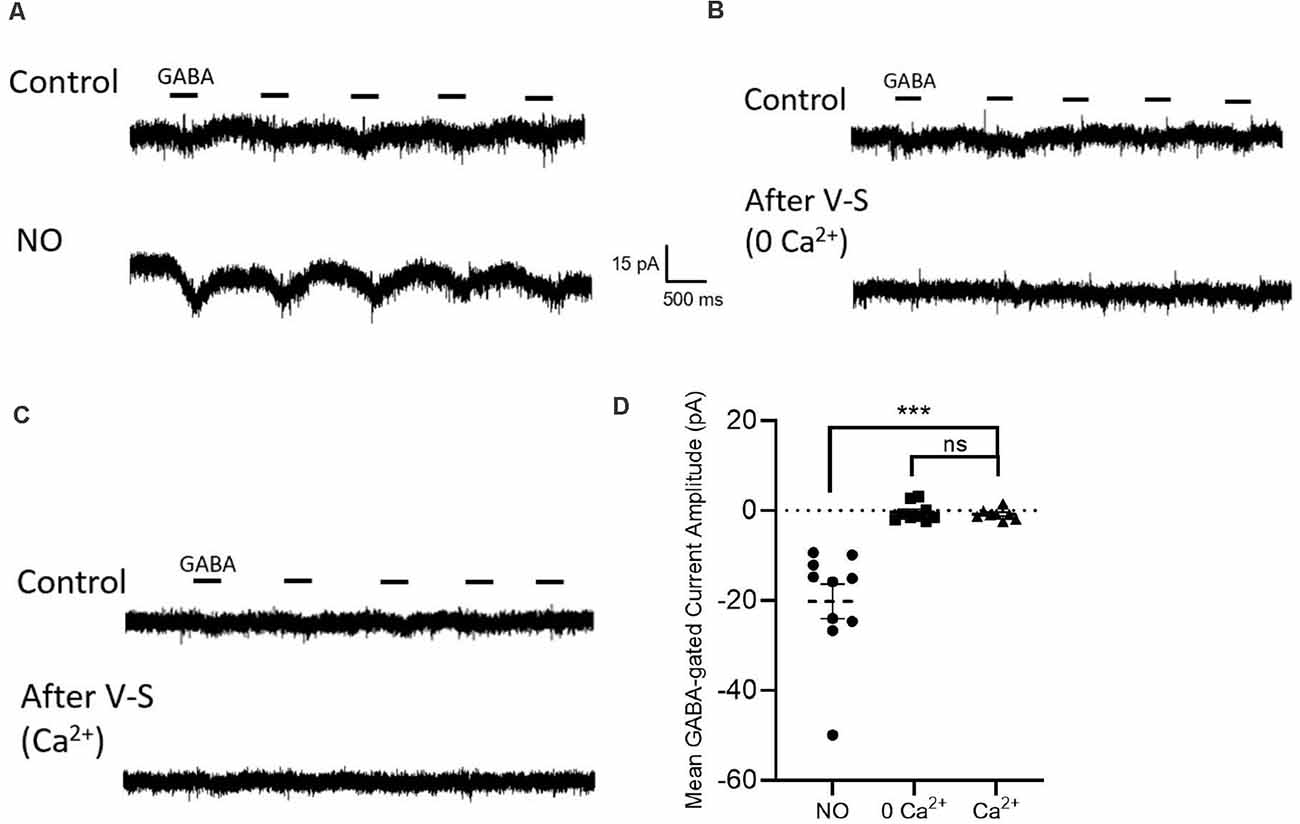
Figure 6. Influx of external Ca2+ fails to release Cl− from the internal store. (A) Sample traces from cells are held at −70 mV with GABA (20 μM) applied for 400 ms. With NO stimulation, GABA-gated inward currents generate. (B) Voltage-step control settings in zero Ca2+ zero Cl− external environment. Sample traces from cells that the top trace is stimulated with GABA pulse protocol, the bottom trace is repeated with GABA pulse protocol after voltage step stimulation. (C) Same experiment setting in Ca2+ (3 mM) external solution. (D) Quantified mean GABA-gated current amplitude ± SEM; NO control, n = 10; 0 Ca2+ control, n = 9; Ca2+, n = 8; p = 0.6; ns: not significant. ***P < 0.001 (repeated-measures ANOVA).
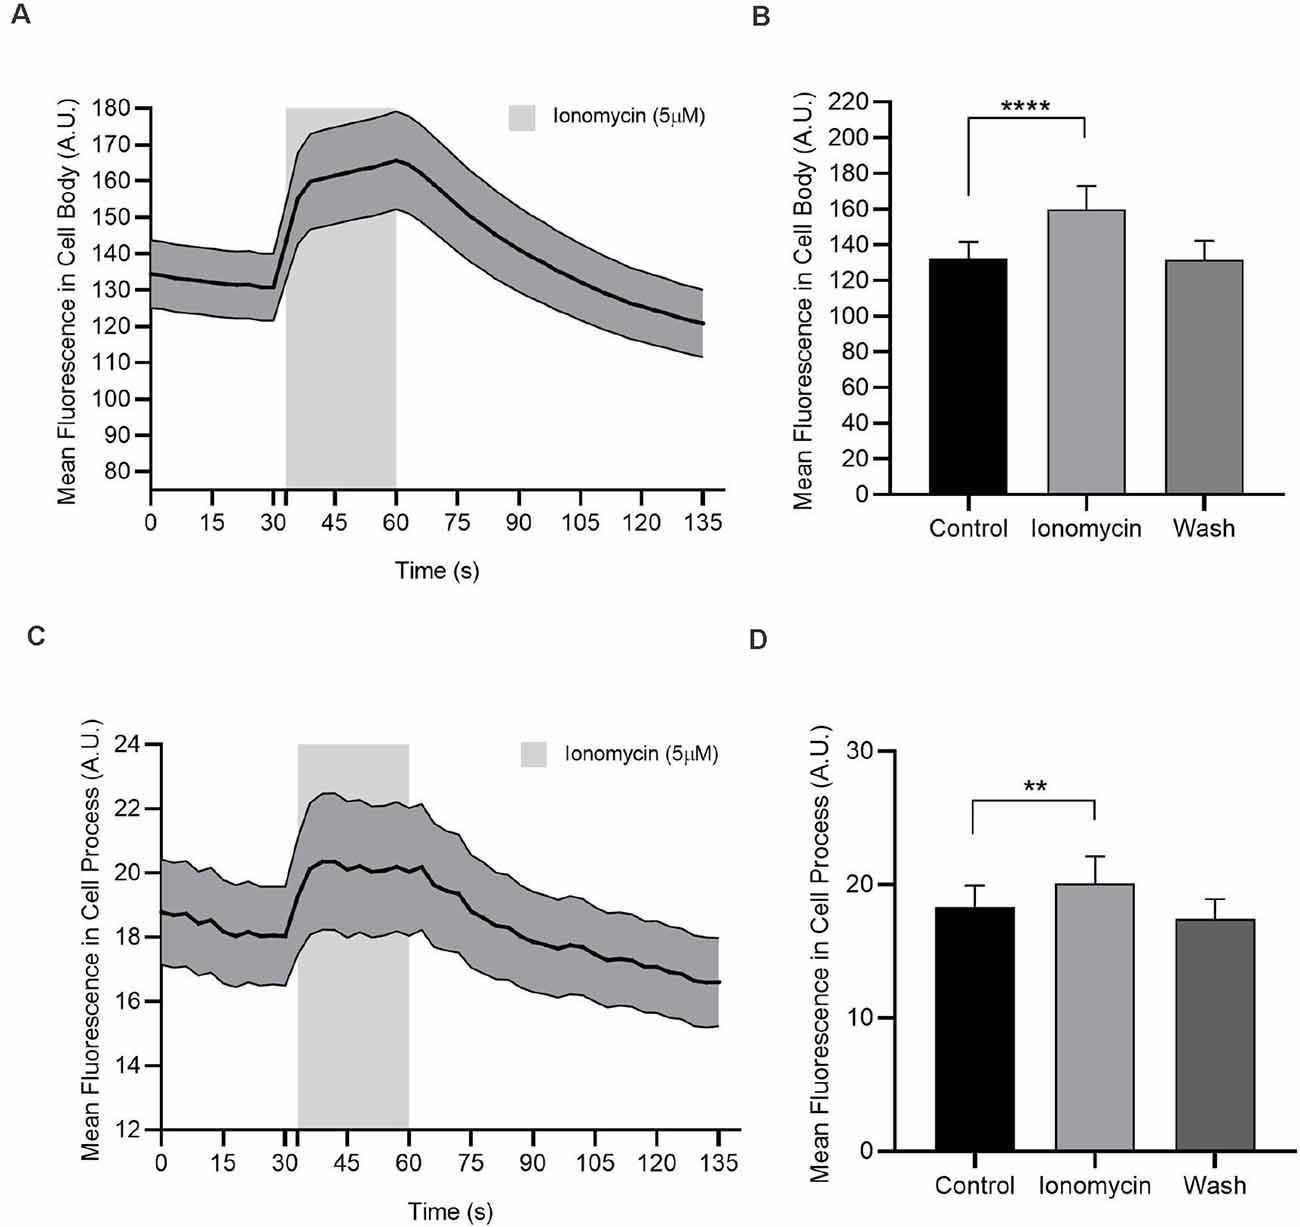
Figure 7. In the absence of extracellular Ca2+, ionomycin releases Ca2+ from internal stores. Calcium imaging experiments of AC cell body and cell process are loaded with Oregon Green BAPTA-1 488-AM. (A) Ionomycin (5 μM) increases cytosolic Ca2+ in the cell body. (B) Quantified mean fluorescence ± SEM; n = 73. For the control and ionomycin groups, mean value is calculated as the average of all test time in a condition. For the wash, the mean is calculated from the time point 93–120 s. ****P < 0.0001 (paired t-test). (C) Ionomycin (5 μM) increases cytosolic Ca2+ in the cell process. (D) Quantified mean fluorescence ± SEM; n = 58. Mean values are calculated as in (C). **P < 0.01 (paired t-test).
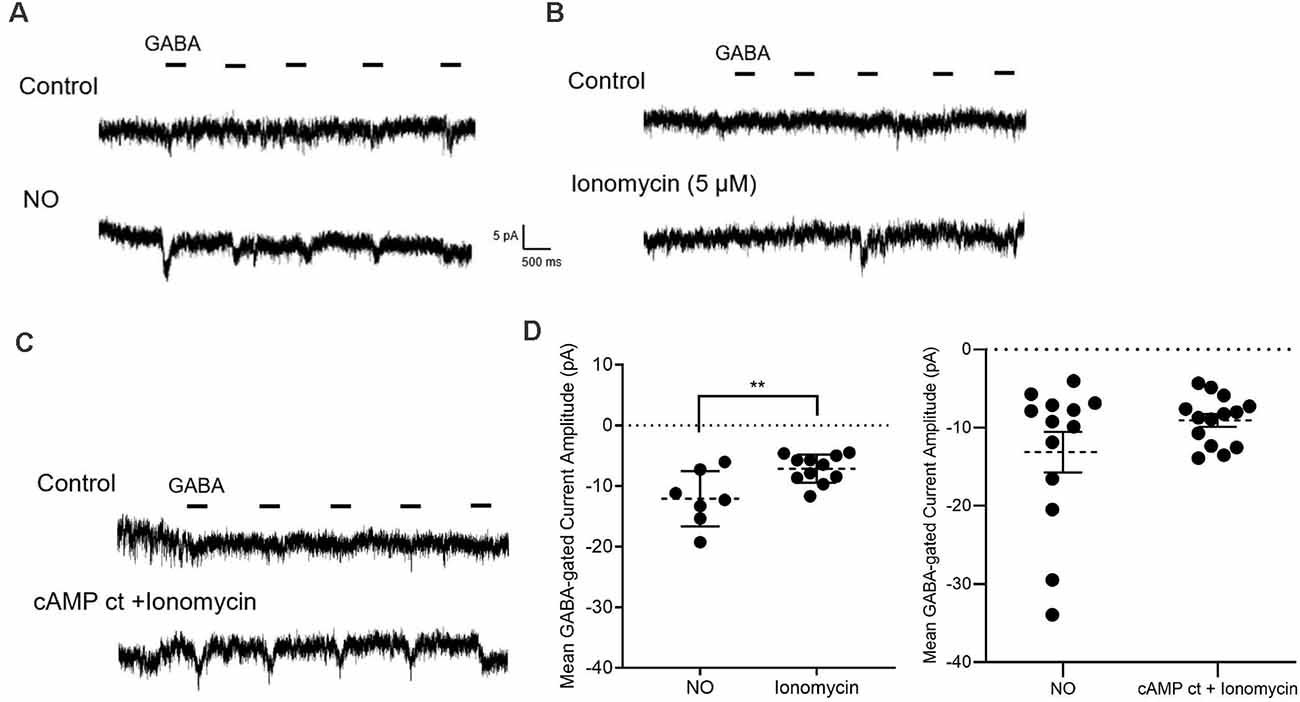
Figure 8. Pairing elevated cAMP and Ca2+ mimics the effects of NO. (A–C) Sample traces from GABA pulse recording (20 μM) in zero external Ca2+ and zero Cl− internal and external solutions. The GABA-dependent inward current is elicited by NO (50 μl) in (A) by Ca2+ ionophore, ionomycin (5 μM) in (B), and by co-application of cAMP ct and ionomycin (5 μM) in (C). (D) Quantified mean GABA-gated current amplitude ± SEM; NO, n = 7; ionomycin, n = 11. NO, n = 13 (control cells are replotted from Figure 5D; see “ Materials and Methods” section); cocktail and ionomycin, n = 14. **P < 0.01 (left: unpaired t-test, right: Welch’s unpaired t-test).
Solutions
All components were purchased from Sigma-Aldrich (St. Louis, MO, USA) unless otherwise indicated. The normal external solution contained (in mM): NaCl (116.7), KCl (5.3), tetrathylammonium (TEA)-Cl (20.0), CaCl2 (3), MgCl2 (0.41), glucose (5.6), HEPES (10.0), pH adjusted to 7.4 with NaOH. For voltage ramp recordings, Tetrodotoxin citrate (TTX; 300 nM, Abcam, Cambridge, UK) and La3+ (50 μM) were added to block voltage-gated Na+ and Ca2+ currents, respectively. The normal internal solution contained (in mM): Cs-acetate (100.0), CsCl (10.0), CaCl2 (0.1), MgCl2 (2.0), HEPES (10.0), and EGTA (1.0), pH adjusted to 7.4 with CsOH. For GABA pulse experiments, zero Cl− external solution was made with (in mM): Na-methanesulfonate (145.0), glucose (5.6), and 10.0 HEPES, pH adjusted to 7.4 with NaOH. The zero Cl− internal solution was made with (in mM): Cs-methanesulfonate (125.0) and HEPES (10.0), pH adjusted to 7.4 with CsOH. The agarose salt bridge was placed close to the outflow in order to minimize Cl− leaking onto ACs during recording. For Ca2+ imaging experiments, zero Ca2+ external solution contained (in mM): NaCl (141.5), KCl (5.37), MgCl2 (0.41), glucose (5.6), HEPES (3.02), pH adjusted to 7.4 with NaOH. For all electrophysiological experiments, the internal solution was supplemented with an ATP regeneration system containing creatine phosphokinase (50 U/ml), creatine phosphate (20 mM), ATP disodium (1 mM), ATP dipotassium (3 mM), and GTP disodium (2 mM). The NO-saturated solution was prepared by bubbling Fisher ultra-distilled pure water with argon for 15 min, then bubbled with pure NO gas for 15 min. NO solution was delivered by injection into the external solution perfusion line. The concentration of NO at the perfusion outlet was in the 100’s nM-low μM range. NO (30–50 μl) has been estimated to reach the recorded cell in ~3 s and to remain for ~3–5 s (Hoffpauir et al., 2006).
Reagents
All reagents were purchased from Tocris (Bristol, UK). The 1,2-Bis(2-aminophenoxy)ethane-N,N,N′,N′-tetraacetic acid tetrakis (acetoxymethyl ester; BAPTA, 50 μM) was prepared as a 50 mM stock in DMSO and diluted in internal solution. The AdC inhibitor (SQ 22536, 100 nM), AdC 1 inhibitor (ST 034307, 100 nM), AdC2 inhibitor (SKF 83566 hydrobromide, 10 μM), AdC 5/3 inhibitor 2-Amino-7-(2-furanyl)-7,8-dihydro-5(6H)-quinazolinone (NKY 80, 200 μM), PKA inhibitor N-[2-[[3-(4-Bromophenyl)-2-propenyl]amino]ethyl]-5-isoquinolinesulfonamide dihydrochloride (H89 dihydrochloride, 1 μM) and selective PKA inhibitor (KT 5720, 300 nM) were prepared as 1,000X stocks in DMSO and diluted to 1X in the external solution. Cells were preincubated with inhibitors at 37°C in 5% CO2 for 20–30 mins before recording. The Cell-permeable cAMP analog (8-Bromo-cAMP, sodium salt, 100 μM), the phosphodiesterase inhibitor (non-selective; 3-Isobutyl-1-methylxanthine, 20 μM), and AdC activator forskolin (1 μM) were prepared as 1,000X stocks in DMSO and diluted to 1X in the external solution. 8-Bromo-cAMP, IBMX, and forskolin were applied during recording via the perfusion. The calcium ionophore (ionomycin, 5 μM) was prepared as a 5 mM stock in DMSO and diluted in the external solution.
Calcium Imaging
The cell-permeable fluorescence Ca2+ indicator Oregon Green 488 Bapta-1, AM (OGB, 2 μM, Life Technologies, Grand Island, NY) stock solution (2 mM) was mixed with Pluronic F-127 (2.5% w/v in DMSO, Life Technologies) 1:1 sonicated, then 2 μl was added to 1 ml of Hank’s buffered saline solution (HBSS), vortexed and sonicated for 30 s to produce the loading solution. The culture media was replaced with OGB in HBSS and cells were incubated for 1 h at room temperature. For zero Ca2+ experiments, the perfusion was switched to zero Ca2+ external solution prior to the start of the recording. Images were taken every 3 s with 1 s exposure time on an inverted Olympus IX70 microscope (Center Valley, PA) fitted with a SensiCam QE (Cooke, Kelheim, Germany). Data were collected from regions of interest (ROIs) in ACs bodies and cell processes. For analysis of the effect of NO, the mean value of the control group was calculated by taking the average of the last 30 s before NO application, the mean value of the NO group was calculated by taking the average of the middle 30 s during NO application. The average of data points from 150 s to 177 s was the mean value for the wash group. The mean peak fluorescence change was calculated by subtracting the mean of baseline fluorescence intensity (30 s before NO response) from the peak NO response for data from each ROI. For analysis of the effect of ionomycin, the means of all data points collected before, and during ionomycin application were calculated. Wash data were calculated from a window of time from 93 s to 120 s. Images acquisition and analysis were achieved using Slidebook 5.0 software.
Data Analysis
Analysis of voltage ramps experiments, the current and voltage relationships were calculated and plotted in Origin 8.0 (OriginLab, Northampton, MA, USA). Clampfit 10.0 software was used to exhibit the sweep traces and analyze the currents. Analysis of GABA pulse experiments, GABA-gated inward currents were displayed in Clampfit 10.0 and filtered with Gaussian low pass at 300 Hz. Data were calculated and plotted in Origin 8.0. Calcium imaging data were analyzed in Slidebook 5.0. All the descriptive statistics, unpaired t-tests, paired t-tests, and Welch’s t-tests and ANOVA were performed on Prism 8 (GraphPad Software, La Jolla, CA, USA). Data were reported as means ± SEM. The P-value of significance was <0.05.
Results
NO Releases Ca2+ From Stores
We have previously shown that the NO donor SNAP can enhance intracellular Ca2+ in ACs via activation of transient receptor potential canonical channel 5 (TRPC5; Maddox and Gleason, 2017; Maddox et al., 2018). To confirm the NO-bubbled external solution also elevates Ca2+ levels, cells were loaded with Oregon Green BAPTA-1 488-AM (OGB, 2 μM) and fluorescence intensity was monitored over time. With application of NO in normal external solution, the intracellular Ca2+ increased by about 12% (control, 1,736 ± 133.4 AU; NO, 1943 ± 140.5 AU; n = 45; p < 0.0001, paired t-test, Figures 1A,B). To determine whether this NO exposure could elicit the release of Ca2+ from stores, Ca2+ was removed from the external solution. NO elicited a 28% cytosolic Ca2+ elevation in the absence of extracellular Ca2+ (control, 1,441 ± 97.1 AU; NO, 1848 ± 109 AU; n = 54; p < 0.0001, paired t-test, Figures 1C,D). After subtracted baseline fluorescence, cells in zero Ca2+ extracellular condition had higher cytosolic Ca2+ increase than that in normal external condition (normal external, 266.1 ± 23.2 AU; n = 45; zero Ca2+ external, 406.8 ± 26.1 AU; n = 54; p < 0.001, unpaired t-test, Figure 1E). However, the maximum NO responses in normal and zero Ca2+ external were not statistically different (normal external, 2,002 ± 141.2 AU; n = 45; zero Ca2+ external, 1,848 ± 109 AU; n = 54; p = 0.38, unpaired t-test, Figure 1F). The higher magnitude of change NO-dependent cytosolic Ca2+ in zero Ca2+ external is due to the lower resting cytosolic Ca2+ level (normal external, 1,808 ± 131.7 AU; n = 45; zero Ca2+ external, 1,460 ± 94.2 AU; n = 54; p < 0.05, unpaired t-test, Figure 1G). The decay time constant in normal external was larger than that in zero Ca2+ external condition, suggesting that the later part of the response was more dependent upon extracellular Ca2+, consistent with activation of TRPC5 (Maddox et al., 2018; normal external, 213.8 ± 22.9, n = 33 s; zero Ca2+ external, 45.8 ± 6.2 s, n = 49; p < 0.0001, unpaired t-test, Figure 1H). Together, these results suggest that NO-bubbled solutions can elicit both Ca2+ influx across the plasma membrane and release of Ca2+ from internal stores.
Ca2+ Elevations Are Required for the NO-Dependent Release of Internal Cl−
To determine whether the elevation in cytosolic Ca2+ is required for the release of internal Cl−, the effect of BAPTA was tested. To estimate cytosolic Cl− concentration, the NO-dependent shift in the reversal potential of GABA-gated current (EREV-GABA) was determined by delivering voltage ramps during the application of GABA to activate GABAA receptors. As previously demonstrated with gramicidin perforated-patch recordings (Hoffpauir et al., 2006), the resting intracellular Cl− level is relatively low in ACs and similar to our pipet solution Cl− concentration. EREV-GABA was determined before and after NO to track cytosolic Cl− concentration changes. Under control conditions, the reversal potential had a positive shift with NO, indicating an increase in cytosolic Cl− (control, 32.7 ± 2.8 mV, n = 6, Figure 2A). The Ca2+ chelator BAPTA (50 μM) was applied via the recording pipette. In cells loaded with BAPTA, the NO-dependent reversal potential shift was strongly inhibited (BAPTA, 1.7 ± 1.6 mV, P < 0.0001, n = 5, Figures 2B,C). These results indicated that calcium elevations are required for the NO-dependent release of internal Cl−.
Only AdC1 Inhibitors Suppress the NO-Dependent Release of Cl−
To investigate the involvement of AdC1 in release of Cl− from the internal store, the effects of AdC inhibitors were examined. SQ22536 (100 nM), a general AdC inhibitor, suppressed the shift in EREV-GABA (control shift, 38.2 ± 1.9 mV; SQ22536 shift, 9.7 ± 3.0 mV; n = 11 for both groups; p < 0.0001, unpaired t-test, Figures 3A,B). The AdC1 inhibitor, ST034307 (100 nM) was also effective; providing evidence for the involvement of AdC1, specifically (control shift, 31.0 ± 3.4 mV; ST 034307 shift, 13.1 ± 2.6 mV; n = 9 each; p < 0.001, unpaired t-test, Figures 3C,D). Neither the AdC2 inhibitor SKF83566 (10 μM) nor the AdC3 and 5 inhibitor (NKY 80, 200 μM) inhibited the NO-dependent shift in EREV-GABA (control shift, 41.5 ± 3.9 mV, n = 11; SKF83566 shift, 42.1 ± 3.0 mV, n = 10; p = 0.9079; control shift, 47.3 ± 4.6 mV, n = 7; NKY 80 shift, 38.7 ± 2.8, n = 8; p = 0.1254; unpaired t-tests, Figures 3E–H). Together, these results suggest that AdC1, specifically, is involved in the NO-dependent internal Cl− release.
PKA Inhibitors Disrupt the NO-Dependent Release of Internal Cl−
To examine the role of PKA in determining cytosolic Cl− concentration, two PKA inhibitors (H89 1 μM, KT5720 300 nM) were employed. Both inhibitors were effective in suppressing the NO-dependent internal Cl− release (control shift, 30.2 ± 3.1 mV; H89 shift, 12.3 ± 4.8 mV, preincubated for 30 min; n = 9 for both groups; p < 0.01, unpaired t-test, Figures 4A,B; control shift, 38.8 ± 1.7 mV, n = 9; KT5720 shift, 9.8 ± 4.2 mV, preincubated for 20 min, n = 8; p < 0.0001, Welch’s unpaired t-test, Figures 4C,D). In addition, there is evidence that PKA directly modulates GABAA receptors in multiple cell types including retinal neurons (Porter et al., 1990; Wong and Moss, 1992; Feigenspan and Bormann, 1994; Veruki and Yeh, 1994; Wexler et al., 1998). To test this possibility that inhibition of PKA might affect the GABAA receptor itself by altering mean open time or receptor sensitivity, we compared the conductance of the GABA-gated current in control and KT5720 pretreatment conditions. No effects of PKA inhibition on the conductance were observed (control, 7.72 ± 0.58 nS, n = 9; KT5720, 8.98 ± 0.77 nS, n = 8; p = 0.2057, unpaired t-tests, Figure 4E). In sum, these results indicate a role for AdC1-dependent signaling via cAMP and PKA in the activation of CFTR.
Elevating cAMP in the Absence of NO Promotes Cl− Release From the Internal Store
If AdC1 and PKA are sufficient for the release of Cl− from internal stores, we should be able to bypass NO and directly activate the cAMP pathway to release Cl− into the cytosol. To achieve this, we used a combination of reagents to create a cAMP “cocktail” (cAMP ct) composed of the AdC activator, forskolin (1 μM); the cAMP analog, 8-bromo-cAMP (100 μM), and the phosphodiesterase inhibitor, IBMX (20 μM). To maximize our ability to detect Cl− release and to ensure that we were measuring Cl− originating from the internal store, we employed an alternative experimental strategy. GABA-gated currents were recorded in Cl−-free internal and external solutions. Because EREV-GABA is not measurable under these conditions, cells were held at −70 mV and GABA (20 mM) was applied for 400 ms (five times /sweep). GABA-gated inward currents were initially very small then disappeared completely as the Cl−-free pipet solution washed out residual Cl− from the cell. After NO, however, GABA-gated inward currents were observed indicating that sequestered Cl− had been released into the cytosol and then exited via open GABAA receptors on the plasma membrane (Figure 5A).
The cAMP pathway inhibitor experiments suggest that activation of the cAMP pathway is necessary for the NO-dependent shift in EREV-GABA. To test whether cAMP pathway activity is sufficient, cells were exposed to cAMP ct designed to elevate cAMP levels and PKA activity. In the GABA pulse experiment, the cAMP ct generated a small inward GABA-gated current (Figure 5B). Although the GABA responses were elicited by cAMP ct, they were significantly smaller than those recorded in response to NO (Figure 5C). These results indicate that elevating cAMP signaling alone has a small effect on releasing Cl− from internal store (NO, −13.1 ± 2.6 pA, n = 13; cAMP ct −6.5 ± 0.9 pA, n = 14; p < 0.05, Welch’s unpaired t-test).
Activation of Voltage-Gated Ca2+ Channels Does Not Elicit Cl− Release
The activity of AdC1 relies on Ca2+. To determine whether a Ca2+ elevation alone is sufficient to activate the pathway and cause the release of internal Cl, a series of 10 sweeps, 100 ms voltage steps from −70 mV to 0 mV of each sweep were delivered after the GABA pulse control sweeps (Figures 6B,C). For these experiments, 3 mM Ca2+ was added to the external solution (Figure 6C). After the voltage steps, subsequent GABA pulses did not elicit inward currents (NO control, −20.2 ± 3.8 pA, n = 10; 0Ca2+ control, −0.4 ± 0.7 pA, n = 9; Ca2+, −0.8 ± 0.4 pA, n = 8; p = 0.6, repeated-measures ANOVA, Figures 6A–D). These results suggest that Ca2+ influx via voltage-gated Ca2+ channels is not effective in activating efflux of Cl− from internal stores.
Ionomycin Releases Ca2+ From Internal Stores in the Absence of Extracellular Ca2+
If the influx of Ca2+ through voltage-gated Ca2+ channels is ineffective in elevating cytosolic Cl− but Ca2+ elevations are required, perhaps it is Ca2+ released from internal stores specifically, that links NO to Cl− efflux. To test this, we first confirmed that we could use ionomycin in Ca2+-free external solution to elicit the release from Ca2+ stores. OGB-loaded ACs were monitored during exposure to ionomycin (5 μM). Data were captured in AC cell bodies and cell processes. With ionomycin, intracellular Ca2+ increased by about 21% and 9.8% in cell bodies and processes, respectively (cell bodies: control, 132.3 ± 9.3 AU; ionomycin 160 ± 13 AU; n = 73; p < 0.0001, paired t-test, Figures 7A,B; cell processes: control, 18.3 ± 1.6 AU; ionomycin 20.1 ± 2.0 AU; n = 58; p < 0.01, paired t-test, Figures 7C,D). These data show that ionomycin is effective in releasing store Ca2+ in ACs.
Pairing Elevated cAMP and Ca2+ Release Mimics the Effects of NO
To test whether the release of store Ca2+ can stimulate Cl− release from the Cl− internal store, GABA pulse data were gathered before and after exposure to ionomycin. These experiments were done in the absence of internal and external Cl−, and external Ca2+. With the addition of ionomycin (5 μM), small GABA-gated inward currents were elicited but were significantly smaller than those elicited by NO (NO, −12.1 ± 1.7 pA, n = 7; ionomycin, −7.1 ± 0.7 pA, n = 11; p < 0.01, unpaired t-test, Figures 8A,B,D). Either store release of Ca2+ or elevation of cAMP was less effective than NO in eliciting release of internal Cl− (Figures 5B,C, 8B,D). As such, we hypothesized that releasing stored Ca2+ and the downstream effects of elevating cytosolic cAMP would have synergistic effects on Cl− release. To test this, ionomycin and cAMP ct were co-applied and the effect on GABA-gated currents in zero Cl− and zero Ca2+ external solutions was determined under these conditions, the effects of NO could be mimicked (NO, −13.1 ± 2.6 pA, n = 13; cAMP ct + ionomycin, −9.0 ± 0.8 pA, n = 14; p = 0.1588, Welch’s unpaired t-test, Figures 8C,D). Together, these results provide evidence that Ca2+-dependent AdC1 provides a link between NO-dependent cytosolic Ca2+ signaling and cytosolic Cl− concentration.
Discussion
Here we show that by eliciting Ca2+ release, NO sets the conditions for CFTR-dependent efflux of Cl− from internal stores. We establish that Ca2+ store release, AdC1 activation, and PKA activation are all necessary for the NO-dependent release of Cl− into the cytosol. Our attempts to bypass NO and the Ca2+ elevations by experimentally elevating cytosolic cAMP engendered Cl− release, but these manipulations were not as effective as NO itself. Combining cAMP elevations with the release of stored Ca2+ generated Cl− release indistinguishable from NO. This implies that there might be an additional Ca2+-dependent component to this mechanism that is as yet, unidentified. Taken together, these results establish that AdC1 links calcium signaling and the cAMP pathway to the regulation of cytosolic Cl− via CFTR.
CFTR and cAMP Signaling Interactions
It is well established that activation of CFTR is modulated by the cAMP signaling pathway (Anderson and Welsh, 1991). Here we report that AdC1, specifically, is a site of interaction between Ca2+ and cAMP for CFTR regulation in chick ACs. Functional coupling between AdC1 and CFTR has been demonstrated in human bronchial cell lines (Namkung et al., 2010; Lérias et al., 2018) airway, and intestinal epithelia (Benedetto et al., 2017) and human fetal lung explants (Brennan et al., 2016). Here, we demonstrate for the first time, a similar relationship in neurons.
A common theme for CFTR is that it forms function partnerships with other transport proteins (Li and Naren, 2010). It has become well established in epithelial cells that a physical and functional relationship exists between CFTR and TMEM16A (anoctamin 1), a Ca2+-activated Cl− channel (Ousingsawat et al., 2011; Benedetto et al., 2017, 2019). Interestingly, TMEM16A has been localized to AC-AC GABAergic synapses in the mouse retina (Jeon et al., 2013) and we have evidence that it is expressed in cultured GABAergic chick ACs at the mRNA and protein levels (unpublished observations). Two emerging properties of TMEM16A make it a good candidate for an additional Ca2+-dependent component of the CFTR activation mechanism in ACs. First, in epithelia, the co-expression of TMEM16A and CFTR confers a system where cytosolic Ca2+ elevations and activation of the cAMP pathway become intertwined by the activity of Ca2+-dependent AdCs, mostly likely AdC1 (Benedetto et al., 2017; Lérias et al., 2018). Furthermore, although the mechanism is not understood, expression of TMEM16A enhances G-protein coupled receptor-mediated Ca2+ release via the inositol 1,4,5-trisphosphate receptors (IP3R; Schreiber et al., 2015; Benedetto et al., 2017). It may be that TMEM16A serves a similar function in ACs, even in the absence of receptor activation. Second, it has been elegantly demonstrated that TMEM16A is activated by Ca2+ released from stores exclusively, in epithelia (Cabrita et al., 2017) and sensory neurons (Jin et al., 2013). These reports align with our observation that only store-released Ca2+ is effective in eliciting elevations in cytosolic Cl−.
Ca2+ Signaling for Cl− Regulation
We find that Ca2+ influx is not effective in enhancing cytosolic Cl− but that Ca2+ store release is. AdC1 is typically expressed on the plasma membrane as are voltage-gated Ca2+ channels, so our observations suggest that the expression of these two membrane proteins is significantly non-overlapping. Furthermore, the effectiveness of Ca2+ store release raises the possibility that the Ca2+ store release mechanism is localized together with Cl− release sites.
The mechanism by which NO releases internal Ca2+ in ACs remains unknown. We have previously determined that the effect of NO on cytosolic Cl− in ACs is independent of soluble guanylyl cyclase activity (Hoffpauir et al., 2006). This observation raises the possibility that NO functions via S-nitrosylation. NO can activate ryanodine receptors (RyRs) via S-nitrosylation (Eu et al., 2000), and NO-dependent release of store Ca2+ via RyRs was shown to affect cerebellar neuron synaptic plasticity as well as cell death (Kakizawa et al., 2012). In addition, the IP3R can be S-nitrosylated and elicit Ca2+ release from the IP3-sensitive store in human neutrophils (Pan et al., 2008). The interplay between IP3R and RyR has been demonstrated in the production of cytosolic Ca2+ waves (Boittin et al., 1999; Gordienko and Bolton, 2002), and both receptors are expressed in cultured ACs (Warrier et al., 2005; Sen et al., 2007).
Acidic organelles such as lysosomes (Patel and Docampo, 2010) are another potential source of Ca2+. This Ca2+ store can be mobilized in response to nicotic acid adenine dinucleotide phosphate (NAADP) activation of Ca2+ permeable two-pore channels (TPCs; Calcraft et al., 2009). However, the only link between NO and the pathway we have identified is that cAMP can regulate NAADP production (Wilson and Galione, 1998). Nonetheless, it is an intriguing possibility that acidic organelles might function in both mobilizing Ca2+ and regulating Cl− levels in the cytosol.
Can signaling molecules other than NO link cytosolic Ca2+ and cytosolic Cl−? Chick ACs have been demonstrated to express neurotensin receptors that are coupled to Ca2+ store release via Gq-activated phospholipase C and IP3Rs (Borges et al., 1996). Neurotensin itself is expressed by a population of adult chicken ACs that co-express both enkephalin and somatostatin (Watt and Florack, 1994). Interestingly, the levels of all three peptides exhibit light-dependent oscillations in release with the highest level of release occurring in the dark (Yang et al., 1997). Thus, if neurotensin acting on its receptor can link Ca2+ elevations with Cl− elevations, we would expect this effect to be most robust under scotopic conditions.
The metabotropic glutamate receptor mGluR5 has also been demonstrated to be linked to the IP3 pathway in chick ACs (Sosa et al., 2002; Sosa and Gleason, 2004). In addition, mGluR5 has been localized to ACs in the adult chicken retina at the light microscope level (Kreimborg et al., 2001) and in AC processes in the electron microscope (Sen and Gleason, 2006). Dopamine is a key retinal regulator in the vertebrate retina and D1 (AdC-linked) dopamine receptors are expressed in the inner retina across vertebrates (Veruki and Wässle, 1996; Mora-Ferrer et al., 1999; as reviewed in Nguyen-Legros et al., 1999) including the chicken retina (Firth et al., 1997). Although D1 receptors are linked to elevations in cAMP, it may be that their effect on cytosolic Cl− is relatively small given the limited effects we found for the cAMP cocktail in our experiments. Nonetheless, it remains possible that NO is not the only signaling molecule with the potential to regulate cytosolic Cl−. However, given what we have learned about the importance of the Ca2+ source, the location of these receptors is likely to be a significant determining factor in their involvement.
Wexler et al. (1998) tested the NO donor SNAP on cultured rat ACs and found that downstream suppression of PKA activity reduced GABA receptor-mediated current. With similar concentrations of SNAP, we have previously demonstrated a small (~15%) enhancement in the GABA-gated current but no shift in EREV-GABA (Hoffpauir et al., 2006). In the present experiments, we see no effect of PKA inhibition on the conductance of the GABA response. In Wexler et al. (1998), PKA activity was modified acutely and effects began to diminish within a few minutes during reagent application and at a rate that would have brought the effect back to baseline in about 10 min. Our PKA inhibitor experiments involved 20 min pre-incubations such that any acute effects could have been reversed by the time we made our recordings. Alternatively, in addition to potential species differences, ACs are a diverse group, and differences in timing and preparation, and maintenance of cultures could easily select for a different sub-population of ACs.
Nitric oxide synthases (NOS) are widespread in the chicken retina (Tekmen-Clark and Gleason, 2013) and there are four subtypes of chick ACs expressed neuronal NOS (nNOS), specifically (Fischer and Stell, 1999). Furthermore, it has been reported that nNOS expression is clustered in the presynaptic region of some ACs dendrites (Cao and Eldred, 2001) and NO imaging shows that diffusion from AC processes is limited (Eldred and Blute, 2005). Together, these observations suggest that although NO can be generated broadly in the retina, its effects could be highly localized to pre-and post-synaptic partners in the inner retina. As we develop a deeper understanding of the signaling mechanisms underlying NO- and CFTR-dependent cytosolic Cl− regulation, we may uncover additional regulators of inhibition that play a role in AC synaptic output and thus the signals that retina ganglion cells convey to visual centers in the brain.
Data Availability Statement
The raw data supporting the conclusions of this article will be made available by the authors, without undue reservation.
Ethics Statement
The animal study was reviewed and found to be exempt by the LSU Institutional Animal Care and Use Committee.
Author Contributions
LZ and EG planned the experiments and drafted the manuscript. LZ carried out all of the experiments. All authors contributed to the article and approved the submitted version.
Conflict of Interest
The authors declare that the research was conducted in the absence of any commercial or financial relationships that could be construed as a potential conflict of interest.
Publisher’s Note
All claims expressed in this article are solely those of the authors and do not necessarily represent those of their affiliated organizations, or those of the publisher, the editors and the reviewers. Any product that may be evaluated in this article, or claim that may be made by its manufacturer, is not guaranteed or endorsed by the publisher.
Acknowledgments
We thank Dr. Huangen Ding and his lab for generously supplying us with NO-bubbled solutions.
References
Anderson, M. P., and Welsh, M. J. (1991). Calcium and cAMP activate different chloride channels in the apical membrane of normal and cystic fibrosis epithelia. Proc. Natl. Acad. Sci. U S A 88, 6003–6007. doi: 10.1073/pnas.88.14.6003
Ben-Ari, Y., Khalilov, I., Kahle, K. T., and Cherubini, E. (2012). The GABA excitatory/inhibitory shift in brain maturation and neurological disorders. Neuroscientist 18, 467–486. doi: 10.1177/1073858412438697
Benedetto, R., Cabrita, I., Schreiber, R., and Kunzelmann, K. (2019). TMEM16A is indispensable for basal mucus secretion in airways and intestine. FASEB J. 33, 4502–4512. doi: 10.1096/fj.201801333RRR
Benedetto, R., Ousingsawat, J., Wanitchakool, P., Zhang, Y., Holtzman, M. J., Amaral, M., et al. (2017). Epithelial chloride transport by CFTR requires TMEM16A. Sci. Rep. 7:12397. doi: 10.1038/s41598-017-10910-0
Billet, A., and Hanrahan, J. W. (2013). The secret life of CFTR as a calcium-activated chloride channel. J. physiol. 591, 5273–5278. doi: 10.1113/jphysiol.2013.261909
Boittin, F. X., Macrez, N., Halet, G., and Mironneau, J. (1999). Norepinephrine-induced Ca2+ waves depend on InsP3 and ryanodine receptor activation in vascular myocytes. Am. J. Physiol. 277, C139–C151. doi: 10.1152/ajpcell.1999.277.1.C139
Borges, S., Gleason, E., Frerking, M., and Wilson, M. (1996). Neurotensin induces calcium oscillations in cultured amacrine cells. Vis. Neurosci. 13, 311–318. doi: 10.1017/s0952523800007550
Bozoky, Z., Ahmadi, S., Milman, T., Kim, T. H., Du, K., Di Paola, M., et al. (2017). Synergy of cAMP and calcium signaling pathways in CFTR regulation. Proc. Natl. Acad. Sci. U S A 114, E2086–E2095. doi: 10.1073/pnas.1613546114
Brennan, S. C., Wilkinson, W. J., Tseng, H. -E., Finney, B., Monk, B., Dibble, H., et al. (2016). The extracellular calcium-sensing receptor regulates human fetal lung development via CFTR. Sci. Rep. 6:21975. doi: 10.1038/srep21975
Cabrita, I., Benedetto, R., Fonseca, A., Wanitchakool, P., Sirianant, L., Skryabin, B. V., et al. (2017). Differential effects of anoctamins on intracellular calcium signals. FASEB J. 31, 2123–2134. doi: 10.1096/fj.201600797RR
Calcraft, P. J., Ruas, M., Pan, Z., Cheng, X., Arredouani, A., Hao, X., et al. (2009). NAADP mobilizes calcium from acidic organelles through two-pore channels. Nature 459, 596–600. doi: 10.1038/nature08030
Cao, L., and Eldred, W. D. (2001). Subcellular localization of neuronal nitric oxide synthase in turtle retina: electron immunocytochemistry. Vis. Neurosci. 18, 949–960. doi: 10.1017/S0952523801186128
Choi, E. J., Xia, Z., and Storm, D. R. (1992). Stimulation of the type III olfactory adenylyl cyclase by calcium and calmodulin. Biochem. 31, 6492–6498. doi: 10.1021/bi00143a019
Delpire, E., and Mount, D. B. (2002). Human and murine phenotypes associated with defects in cation-chloride cotransport. Annu. Rev. Physiol. 64, 803–843. doi: 10.1146/annurev.physiol.64.081501.155847
Diamond, J. S. (2017). Inhibitory interneurons in the retina: types, circuitry and function. Annu. Rev. Vis. Sci. 3, 1–24. doi: 10.1146/annurev-vision-102016-061345
Eldred, W. D., and Blute, T. A. (2005). Imaging of nitric oxide in the retina. Vision Res. 45, 3469–3486. doi: 10.1016/j.visres.2005.07.033
Eu, J. P., Sun, J., Xu, L., Stamler, J. S., and Meissner, G. (2000). The skeletal muscle calcium release channel: coupled O2 sensor and NO signaling functions. Cell 102, 499–509. doi: 10.1016/s0092-8674(00)00054-4
Feigenspan, A., and Bormann, J. (1994). Facilitation of GABAergic signaling in the retina by receptors stimulating adenylate cyclase. Proc. Natl. Acad. Sci. U S A 91, 10893–10897. doi: 10.1073/pnas.91.23.10893
Firth, S. I., Morgan, I. G., and Boelen, M. K. (1997). Localization of D1 dopamine receptors in the chicken retina. Aust. N. Z. J. Ophthalmol. 25, S64–S66. doi: 10.1111/j.1442-9071.1997.tb01760.x
Fischer, A. J., and Stell, W. K. (1999). Nitric oxide synthase-containing cells in the retina, pigmented epithelium, choroid and sclera of the chick eye. J. Comp. Neurol. 405, 1–14. doi: 10.1002/(sici)1096-9861(19990301)405:1<1::aid-cne1>3.0.co;2-u
Gadsby, D. C., and Nairn, A. C. (1999). Control of CFTR channel gating by phosphorylation and nucleotide hydrolysis. Physiol. Rev. 79, S77–S107. doi: 10.1152/physrev.1999.79.1.S77
Gamba, G. (2005). Molecular physiology and pathophysiology of electroneutral cation-chloride cotransporters. Physiol. Rev. 85, 423–493. doi: 10.1152/physrev.00011.2004
Gleason, E., Borges, S., and Wilson, M. (1993). Synaptic transmission between pairs of retinal amacrine cells in culture. J. Neurosci. 13, 2359–2370. doi: 10.1523/JNEUROSCI.13-06-02359.1993
Gordienko, D. V., and Bolton, T. B. (2002). Crosstalk between ryanodine receptors and IP3 receptors as a factor shaping spontaneous Ca2+-release events in rabbit portal vein myocytes. J. Physiol. 542, 743–762. doi: 10.1113/jphysiol.2001.015966
Grimes, W. N. (2012). Amacrine cell-mediated input to bipolar cells: variations on a common mechanistic theme. Vis. Neurosci. 29, 41–49. doi: 10.1017/S0952523811000241
Halls, M. L., and Cooper, D. M. (2011). Regulation by Ca2+-signaling pathways of adenylyl cyclases. Cold Spring Harb. Perspect. Biol. 3:a004143. doi: 10.1101/cshperspect.a004143
Hoffpauir, B., McMains, E., and Gleason, E. (2006). Nitric oxide transiently converts synaptic inhibition to excitation in retinal amacrine cells. J. Neurophysiol. 95, 2866–2877. doi: 10.1152/jn.01317.2005
Jeon, J. H., Paik, S. S., Chun, M. -H., Oh, U., and Kim, I. -B. (2013). Presynaptic localization and possible function of calcium-activated chloride channel anoctamin 1 in the mammalian retina. PLoS One 8:e67989. doi: 10.1371/journal.pone.0067989
Jin, X., Shah, S., Liu, Y., Zhang, H., Lees, M., Fu, Z., et al. (2013). Activation of the Cl− channel ANO1 by localized calcium signals in nociceptive sensory neurons requires coupling with the IP3 receptor. Sci. Signal. 6:ra73. doi: 10.1126/scisignal.2004184
Kakizawa, S., Yamazawa, T., Chen, Y., Ito, A., Murayama, T., Oyamada, H., et al. (2012). Nitric oxide-induced calcium release via ryanodine receptors regulates neuronal function. EMBO J. 31, 417–428. doi: 10.1038/emboj.2011.386
Kreimborg, K. M., Lester, M. L., Medler, K. F., and Gleason, E. L. (2001). Group I metabotropic glutamate receptors are expressed in the chicken retina and by cultured retinal amacrine cells. J. Neurochem. 77, 452–465. doi: 10.1046/j.1471-4159.2001.00225.x
Krishnan, V., and Gleason, E. (2015). Nitric oxide releases Cl− from acidic organelles in retinal amacrine cells. Front. Cell. Neurosci. 9:213. doi: 10.3389/fncel.2015.00213
Krishnan, V., Maddox, J. W., Rodriguez, T., and Gleason, E. (2017). A role for the cystic fibrosis transmembrane conductance regulator in the nitric oxide-dependent release of Cl− from acidic organelles in amacrine cells. J. Neurophysiol. 118, 2842–2852. doi: 10.1152/jn.00511.2017
Kunzelmann, K., and Mehta, A. (2013). CFTR: a hub for kinases and crosstalk of cAMP and Ca2+. FEBS J. 280, 4417–4429. doi: 10.1111/febs.12457
Lérias, J., Pinto, M., Benedetto, R., Schreiber, R., Amaral, M., Aureli, M., et al. (2018). Compartmentalized crosstalk of CFTR and TMEM16A (ANO1) through EPAC1 and ADCY1. Cellular signalling 44, 10–19. doi: 10.1016/j.cellsig.2018.01.008
Li, C., and Naren, A. P. (2010). CFTR chloride channel in the apical compartments: spatiotemporal coupling to its interacting partners. Integr. Biol. (Camb) 2, 161–177. doi: 10.1039/b924455g
MacNeil, M. A., and Masland, R. H. (1998). Extreme diversity among amacrine cells: implications for function. Neuron 20, 971–982. doi: 10.1016/s0896-6273(00)80478-x
Maddox, J. W., and Gleason, E. (2017). Nitric oxide promotes GABA release by activating a voltage-independent Ca2+ influx pathway in retinal amacrine cells. J. Neurophysiol. 117, 1185–1199. doi: 10.1152/jn.00803.2016
Maddox, J. W., Khorsandi, N., and Gleason, E. (2018). TRPC5 is required for the NO-dependent increase in dendritic Ca2+ and GABA release from chick retinal amacrine cells. J. Neurophysiol. 119, 262–273. doi: 10.1152/jn.00500.2017
Masada, N., Ciruela, A., MacDougall, D. A., and Cooper, D. M. (2009). Distinct mechanisms of regulation by Ca2+/calmodulin of type 1 and 8 adenylyl cyclases support their different physiological roles. J. Biol. Chem. 284, 4451–4463. doi: 10.1074/jbc.M807359200
Mons, N., Yoshimura, M., and Cooper, D. M. (1993). Discrete expression of Ca2+/calmodulin-sensitive and Ca2+-insensitive adenylyl cyclases in the rat brain. Synapse 14, 51–59. doi: 10.1002/syn.890140108
Mora-Ferrer, C., Yazulla, S., Studholme, K. M., and Haak-Frendscho, M. (1999). Dopamine D1-receptor immunolocalization in goldfish retina. J. Comp. Neurol. 411, 705–714. doi: 10.1002/(sici)1096-9861(19990906)411:4<705::aid-cne14>3.0.co;2-y
Namkung, W., Finkbeiner, W. E., and Verkman, A. S. (2010). CFTR-adenylyl cyclase I association responsible for UTP activation of CFTR in well-differentiated primary human bronchial cell cultures. Mol. Biol. Cell. 21, 2639–2648. doi: 10.1091/mbc.E09-12-1004
Nguyen-Legros, J., Versaux-Botteri, C., and Vernier, P. (1999). Dopamine receptor localization in the mammalian retina. Mol. Neurobiol. 19, 181–204. doi: 10.1007/BF02821713
Ousingsawat, J., Kongsuphol, P., Schreiber, R., and Kunzelmann, K. (2011). CFTR and TMEM16A are separate but functionally related Cl-channels. Cell. Physiol. Biochem. 28, 715–724. doi: 10.1159/000335765
Pan, L., Zhang, X., Song, K., Wu, X., and Xu, J. (2008). Exogenous nitric oxide-induced release of calcium from intracellular IP3 receptor-sensitive stores via S-nitrosylation in respiratory burst-dependent neutrophils. Biochem. Biophys. Res. Commun. 377, 1320–1325. doi: 10.1016/j.bbrc.2008.11.001
Patel, S., and Docampo, R. (2010). Acidic calcium stores open for business: expanding the potential for intracellular Ca2+ signaling. Trends Cell Biol. 20, 277–286. doi: 10.1016/j.tcb.2010.02.003
Payne, J. A., Rivera, C., Voipio, J., and Kaila, K. (2003). Cation-chloride co-transporters in neuronal communication, development and trauma. Trends Neurosci. 26, 199–206. doi: 10.1016/S0166-2236(03)00068-7
Picciotto, M., Cohn, J., Bertuzzi, G., Greengard, P., and Nairn, A. (1992). Phosphorylation of the cystic fibrosis transmembrane conductance regulator. J. Biol. Chem. 267, 12742–12752.
Porter, N. M., Twyman, R. E., Uhler, M. D., and Macdonald, R. L. (1990). Cyclic AMP-dependent protein kinase decreases GABAA receptor current in mouse spinal neurons. Neuron 5, 789–796. doi: 10.1016/0896-6273(90)90338-g
Quinton, P. M. (1999). Physiological basis of cystic fibrosis: a historical perspective. Physiol. Rev. 79, S3–S22. doi: 10.1152/physrev.1999.79.1.S3
Quinton, P. M., and Bijman, J. (1983). Higher bioelectric potentials due to decreased chloride absorption in the sweat glands of patients with cystic fibrosis. N. Engl. J. Med. 308, 1185–1189. doi: 10.1056/NEJM198305193082002
Riordan, J. R., Rommens, J. M., Kerem, B., Alon, N., Rozmahel, R., Grzelczak, Z., et al. (1989). Identification of the cystic fibrosis gene: cloning and characterization of complementary DNA. Science 245, 1066–1073. doi: 10.1126/science.2475911
Russell, J. M. (2000). Sodium-potassium-chloride cotransport. Physiol. Rev. 80, 211–276. doi: 10.1152/physrev.2000.80.1.211
Schreiber, R., Faria, D., Skryabin, B. V., Wanitchakool, P., Rock, J. R., and Kunzelmann, K. (2015). Anoctamins support calcium-dependent chloride secretion by facilitating calcium signaling in adult mouse intestine. Pflugers Arch. 467, 1203–1213. doi: 10.1007/s00424-014-1559-2
Sen, M., and Gleason, E. (2006). Immunolocalization of metabotropic glutamate receptors 1 and 5 in the synaptic layers of the chicken retina. Vis. Neurosci. 23, 221–231. doi: 10.1017/S0952523806232073
Sen, M., McMains, E., and Gleason, E. (2007). Local influence of mitochondrial calcium transport in retinal amacrine cells. Vis. Neurosci. 24, 663–678. doi: 10.1017/S0952523807070551
Siraj, A., Chantsalnyam, T., Tayara, H., and Chong, K. T. (2021). Recsno: prediction of protein s-nitrosylation sites using a recurrent neural network. IEEE Access 9, 6674–6682. doi: 10.1109/ACCESS.2021.3049142
Sosa, R., and Gleason, E. (2004). Activation of mGlu modulates Ca2+ currents in retinal amacrine cells from the chick. Vis. Neurosci. 21, 807–816. doi: 10.1017/S0952523804216017
Sosa, R., Hoffpauir, B., Rankin, M. L., Bruch, R. C., and Gleason, E. L. (2002). Metabotropic glutamate receptor 5 and calcium signaling in retinal amacrine cells. J. Neurochem. 81, 973–983. doi: 10.1046/j.1471-4159.2002.00883.x
Tekmen-Clark, M., and Gleason, E. (2013). Nitric oxide production and the expression of two nitric oxide synthases in the avian retina. Vis. Neurosci. 30, 91–103. doi: 10.1017/S0952523813000126
Tekmen, M., and Gleason, E. (2010). Multiple Ca2+-dependent mechanisms regulate L-type Ca2+ current in retinal amacrine cells. J. Neurophysiol. 104, 1849–1866. doi: 10.1152/jn.00031.2010
Tsui, L. C. (1992). The spectrum of cystic fibrosis mutations. Trends Genet. 8, 392–398. doi: 10.1016/0168-9525(92)90301-j
Veruki, M. L., and Wässle, H. (1996). Immunohistochemical localization of dopamine D1 receptors in rat retina. Eur. J. Neurosci. 8, 2286–2297. doi: 10.1111/j.1460-9568.1996.tb01192.x
Veruki, M. L., and Yeh, H. H. (1994). Vasoactive intestinal polypeptide modulates GABAA receptor function through activation of cyclic AMP. Vis. Neurosci. 11, 899–908. doi: 10.1017/s0952523800003850
Villacres, E. C., Wu, Z., Hua, W., Nielsen, M. D., Watters, J. J., Yan, C., et al. (1995). Developmentally expressed Ca2+-sensitive adenylyl cyclase activity is disrupted in the brains of type I adenylyl cyclase mutant mice. J. Biol. Chem. 270, 14352–14357. doi: 10.1074/jbc.270.24.14352
Warrier, A., Borges, S., Dalcino, D., Walters, C., and Wilson, M. (2005). Calcium from internal stores triggers GABA release from retinal amacrine cells. J. Neurophysiol. 94, 4196–4208. doi: 10.1152/jn.00604.2005
Watt, C. B., and Florack, V. J. (1994). A triple-label analysis demonstrating that enkephalin-, somatostatin-and neurotensin-like immunoreactivities are expressed by a single population of amacrine cells in the chicken retina. Brain Res. 634, 310–316. doi: 10.1016/0006-8993(94)91935-6
Wexler, E. M., Stanton, P. K., and Nawy, S. (1998). Nitric oxide depresses GABAA receptor function via coactivation of cGMP-dependent kinase and phosphodiesterase. J. Neurosci. 18, 2342–2349. doi: 10.1523/JNEUROSCI.18-07-02342.1998
Widdicombe, J. H., Welsh, M. J., and Finkbeiner, W. E. (1985). Cystic fibrosis decreases the apical membrane chloride permeability of monolayers cultured from cells of tracheal epithelium. Proc. Natl. Acad. Sci. U S A 82, 6167–6171. doi: 10.1073/pnas.82.18.6167
Wilson, H. L., and Galione, A. (1998). Differential regulation of nicotinic acid-adenine dinucleotide phosphate and cADP-ribose production by cAMP and cGMP. Biochem. J. 331, 837–843. doi: 10.1042/bj3310837
Wong, M., and Moss, R. L. (1992). Long-term and short-term electrophysiological effects of estrogen on the synaptic properties of hippocampal CA1 neurons. J. Neurosci. 12, 3217–3225. doi: 10.1523/JNEUROSCI.12-08-03217.1992
Xia, Z. G., Refsdal, C. D., Merchant, K. M., Dorsa, D. M., and Storm, D. R. (1991). Distribution of mRNA for the calmodulin-sensitive adenylate cyclase in rat brain: expression in areas associated with learning and memory. Neuron 6, 431–443. doi: 10.1016/0896-6273(91)90251-t
Keywords: adenylate cyclase 1, cAMP, CFTR, nitric oxide, Ca2+, amacrine cell, GABAergic neuron
Citation: Zhong L and Gleason EL (2021) Adenylate Cyclase 1 Links Calcium Signaling to CFTR-Dependent Cytosolic Chloride Elevations in Chick Amacrine Cells. Front. Cell. Neurosci. 15:726605. doi: 10.3389/fncel.2021.726605
Received: 17 June 2021; Accepted: 19 July 2021;
Published: 11 August 2021.
Edited by:
Wallace B. Thoreson, University of Nebraska Medical Center, United StatesReviewed by:
Jozsef Vigh, Colorado State University, United StatesRobert Gabriel, University of Pécs, Hungary
Copyright © 2021 Zhong and Gleason. This is an open-access article distributed under the terms of the Creative Commons Attribution License (CC BY). The use, distribution or reproduction in other forums is permitted, provided the original author(s) and the copyright owner(s) are credited and that the original publication in this journal is cited, in accordance with accepted academic practice. No use, distribution or reproduction is permitted which does not comply with these terms.
*Correspondence: Evanna L. Gleason, ZWdsZWFzb0Bsc3UuZWR1