 Sujata Prasad
 Wen S. Sheng
 Shuxian Hu
 Priyanka Chauhan
 James R. Lokensgard
- Neurovirology Laboratory, Department of Medicine, University of Minnesota, Minneapolis, MN, United States
Upon reactivation of quiescent neurotropic viruses antigen (Ag)-specific brain resident-memory CD8+ T-cells (bTRM) may respond to de novo-produced viral Ag through the rapid release of IFN-γ, which drives subsequent interferon-stimulated gene expression in surrounding microglia. Through this mechanism, a small number of adaptive bTRM may amplify responses to viral reactivation leading to an organ-wide innate protective state. Over time, this brain-wide innate immune activation likely has cumulative neurotoxic and neurocognitive consequences. We have previously shown that HIV-1 p24 Ag-specific bTRM persist within the murine brain using a heterologous prime-CNS boost strategy. In response to Ag restimulation, these bTRM display rapid and robust recall responses, which subsequently activate glial cells. In this study, we hypothesized that repeated challenges to viral antigen (Ag) (modeling repeated episodes of viral reactivation) culminate in prolonged reactive gliosis and exacerbated neurotoxicity. To address this question, mice were first immunized with adenovirus vectors expressing the HIV p24 capsid protein, followed by a CNS-boost using Pr55Gag/Env virus-like particles (HIV-VLPs). Following the establishment of the bTRM population [>30 days (d)], prime-CNS boost animals were then subjected to in vivo challenge, as well as re-challenge (at 14 d post-challenge), using the immunodominant HIV-1 AI9 CD8+ T-cell epitope peptide. In these studies, Ag re-challenge resulted in prolonged expression of microglial activation markers and an increased proliferative response, longer than the challenge group. This continued expression of MHCII and PD-L1 (activation markers), as well as Ki67 (proliferative marker), was observed at 7, 14, and 30 days post-AI9 re-challenge. Additionally, in vivo re-challenge resulted in continued production of inducible nitric oxide synthase (iNOS) with elevated levels observed at 7, 14 and 30 days post re-challenge. Interestingly, iNOS expression was significantly lower among challenged animals when compared to re-challenged groups. Furthermore, in vivo specific Ag re-challenge produced lower levels of arginase (Arg)-1 when compared with the challenged group. Taken together, these results indicate that repeated Ag-specific stimulation of adaptive immune responses leads to cumulative dysregulated microglial cell activation.
Introduction
Inflammatory responses are beneficial when activated in a properly regulated manner for a defined period; however, prolonged or excessive dysregulated inflammation causes numerous chronic, systemic diseases such as arthritis, multiple sclerosis, systemic lupus erythematosus, and many others (Amor et al., 2014; Straub and Schradin, 2016). In spite of the fact that the central nervous system (CNS) poses a unique microenvironment, which normally restricts immune responses, it does exhibit key features of inflammation and peripheral immune cells are recruited in response to brain infections. Inflammatory reactions following viral infection are dominated by MHC class I-restricted CD8+ T lymphocytes (Mutnal et al., 2011; Kim and Shin, 2019). These cells are key players in adaptive immune responses, which restrict viral spread through cytotoxic responses, as well as other associated inflammatory events. Persisting T lymphocytes have been detected within postmortem brain tissue following viral infection and have led to the investigations of T-cell: microglial cell interactions (Smolders et al., 2018; Williams et al., 2020). Because the largely non-regenerating brain is more sensitive to cellular injury, we hypothesized that repeated challenges to viral antigen (Ag) (modeling repeated episodes of viral reactivation) culminate in prolonged reactive gliosis and defective microglial cell functions.
Pathogenic T-cells induce inflammation upon recognition of cognate Ag and are known to contribute to tissue damage during both systemic and localized infection (Steinbach et al., 2018). These Ag-specific cells dramatically change their behavior and their interaction with resident immune cells within the brain when they encounter cognate Ag (Prasad et al., 2018, 2019; Prasad and Lokensgard, 2019). Pathogenic T-cell activation-induced inflammation has been reported in CNS autoimmune disease (Fletcher et al., 2010; Ji et al., 2010). Moreover, various elegant studies using multiple mouse models have demonstrated increased T-cell infiltration during chronic neurodegeneration (Wakim et al., 2010, 2012; Prasad et al., 2015). A population of memory T-cells residing within the brain plays a major role in shaping neuropathological outcomes (Smolders et al., 2018; Wu et al., 2018; Mockus et al., 2019).
Tissue-resident memory T-cells (TRM) are a population of T lymphocytes that reside long-term within peripheral tissues. Like other tissues, it has been demonstrated that Ag-specific TRM cells reside within the brain (bTRM; Wakim et al., 2010, 2012; Park and Kupper, 2015; Prasad et al., 2017). These cells survey for their cognate Ag and are able to initiate immediate, enhanced, tissue-wide inflammation for pathogen removal in the case of re-infection or reactivation. We and others have reported that these Ag-specific TRM cells respond quickly to low amounts of Ag through abundant cytokine production, such as IFN-γ, IL-2, TNF-α, and other cytotoxic mediators (Cox et al., 2013; Steinbach et al., 2018; Tan et al., 2018; Prasad et al., 2019). These proinflammatory cytokines, particularly IFN-γ, are well known to produce chronic immune activation (Mutnal et al., 2011; Lokensgard et al., 2015; Ta et al., 2019).
Pathogenic stimuli and proinflammatory cytokines produced by Ag-specific bTRM trigger microglial cell activation. It has been well documented that mediators like IFN-γ, TNF-α, and IL-1β amplify the activation of resident glia (Schachtele et al., 2014; Bachiller et al., 2018; Prasad et al., 2019). In particular, IFN-γ production by T lymphocytes serves as an activating factor for microglia and evokes an exaggerated response to secondary inflammatory stimuli (Prasad et al., 2019). Activated microglia subsequently influence the surrounding brain microenvironment through the production of various pro-inflammatory (e.g., IL-1, IL-6, IL-12, TNF-α) and anti- inflammatory cytokines (e.g., TGF-β, IL-10) as well as neurotoxic mediators such as inducible nitric oxide synthase (iNOS; Hanisch, 2002; Wang et al., 2015; Lively and Schlichter, 2018). IFN-γ, together with TNF-α, triggers nitric oxide-induced neurodegeneration (Belkhelfa et al., 2014). Thus, while microglial activation is critical to clear invading pathogens, inflammatory imbalances may impact their function and contribute to neurotoxicity and associated neurodegeneration.
Brain tissues are well-known reservoirs of latent viral infection, including herpesviruses as well as HIV-1, and there is considerable evidence that reactivation occurs frequently under various disease settings (Luzuriaga et al., 2015; Doll et al., 2020; Forte et al., 2020; Marcocci et al., 2020). Although reactivation of these latent infections may result in recurrent disease over time, well-regulated sequences of cellular events normally generate rapid and effective host defense against the reactivated pathogens (Tan et al., 2018; Prasad et al., 2019). Through de novo production of foreign viral Ag, reactivation has the potential to exaggerate adaptive memory responses and mounting evidence indicates that even small amounts of Ag may cause extensive collateral tissue damage and neuronal dysfunction (Doll et al., 2020; Marcocci et al., 2020). However, cellular events involved in clearing reactivation-produced Ag remain to be elucidated.
Recent findings from our laboratory demonstrate that challenges of bTRM to specific epitope peptides induce activation of microglia (Prasad et al., 2019). To study the impact of repeated Ag stimulation on microglial cell activation and its associated neurotoxicity, in a scenario modeling latent viral brain infection and its intermittent reactivation, we used our well-established prime-CNS boost model. Using this model, we have previously demonstrated that viral Ag triggered subsequent adaptive responses. This study is a follow-up of our previous findings. Here, we provide evidence that repeated Ag-specific stimulation of adaptive immune responses from bTRM leads to cumulative dysregulated microglial cell activation, proliferation, and neurotoxic mediator production.
Materials and Methods
Ethical Statement
This study was carried out in strict accordance with recommendations in the Guide for the Care and Use of Laboratory Animals of the National Institutes of Health. The protocol was approved by the Institutional Animal Care and Use Committee (Protocol ID #: 2001-37808A) of the University of Minnesota. Surgery was performed under Ketamine/Xylazine anesthesia and all efforts were made to minimize suffering. Following surgery, all animals were routinely cared for in accordance with RAR (Research Animal Resources) before being euthanized using isoflurane. Institutional Biosafety Committee (IBC) guidelines and recommended procedures were strictly followed (Protocol ID #: 2005-38144H).
Virus and Animals
Production of a 2nd-generation (i.e., ΔE1 + ΔE3), replication-incompetent adenovirus vector which expresses the HIV-1 capsid protein p24 under control of the minimal CMV IE promoter (i.e., rAd5-p24) was outsourced to Cyagen Biosciences (Santa Clara, CA, USA). Female BALB/c mice (6–8 week old) were infected with rAd5-p24 (1 × 10¹⁰ PFU/mouse) via tail-vein injection. To promote immune cell infiltration and retention within the brain, animals were then boosted [day (d) 7 later] via an intracranial injection of HIV virus-like particles (HIV-VLPs). Animals received 300 fluorescent units (FU) of HIV-VLP in a volume no greater than 5 μl delivered into striatum via stereotaxic injection.
Production of HIV Virus-Like Particles (HIV-VLPs)
Production of HIV-VLPs was performed by transfection of HEK 293T cells with pEYFP-N3 HIV-1, a Gag-expressing codon-optimized plasmid encoding the 55 kDa Gag precursor protein fused to an enhanced yellow fluorescent protein (EYFP), under control of the human CMV IE promoter, obtained from Louis Mansky (Institute for Molecular Virology, University of Minnesota); p3NL(ADA) env, encoding a full-length R5-tropic envelope protein, under control of the HIV-1 LTR promoter, was obtained with permission from Eric Freed (NCI, Frederick, MD, USA). Because these HIV-VLPs express EYFP, FU were used as an indicator of quantity and were quantified using a Spectramax M2 Fluorescent reader 485ex/538em at 530 nm cut-off. An HIV-VLP dose of 300 FU equivalents conferred reliable stimulation and promoted peripheral immune cell infiltration into the brain.
Intracranial Injection of Mice
Intracranial injection of mice was performed as previously described with slight modifications (Cheeran et al., 2007). Briefly, 6–8 week old female animals were anesthetized using a combination of Ketamine and Xylazine (100 mg and 10 mg/kg body weight, respectively) and immobilized on a small animal stereotactic instrument equipped with a Cunningham mouse adapter (Stoelting Co., Wood Dale, IL, USA). To minimize pain, subcutaneous injection of the analgesic bupivacaine [1–2 mg/kg (0.4–0.8 ml/kg of a 0.25% solution), Hospira, Inc., Lake forest, IL, USA] prior to incision was performed. The skin and underlying connective tissue were reflected to expose reference sutures (sagittal and coronal) on the skull. The sagittal plane was adjusted in a manner that Bregma and lambda were positioned at the same coordinates on the vertical plane. A burr hole was drilled to expose the underlying dura at pre-determined coordinates to access the left striatum (AP = 0 mm, ML = 2.0 mm from Bregma, and DV = 3.0 mm from skull surface). Animals received 300 FU of HIV-VLP in a volume no greater than 5 μl delivered to the striatum via stereotaxic injection, using a Hamilton syringe (10 μl) fitted to a 27 G needle. The injection was delivered 1 μl/min over a period of 5 min. The needle was retracted slowly and the burr hole was closed using sterile bone-wax. The animals were then removed from the stereotaxic apparatus, placed on a heating pad and the skin incision was closed with 4-0 silk sutures with an FS-2 needle (Ethicon, Somerville, NJ, USA).
Ag Challenge and Re-challenge
Previous studies have identified the capsid p24 H-2Kd MHC class I-restricted peptide AMQMLKETI (i.e., AI9) as an immunodominant epitope (Tan et al., 2016, 2018). In vivo challenge (i.e., first AI9 injection) and re-challenge (i.e., second AI9 injection) were performed by injecting animals with HIV-1-specific T-cell epitope peptide AI9. Ag-challenge was performed d 30 post-HIV-VLP administration, whereas re-challenge was performed at d 14 post-challenge. Animals were injected with 100 μM AI9 peptide in 5 μl saline delivered into the brain striatum. Brain tissue was isolated at d 2, 7, 14, and 30 post-challenge and re-challenge. Brain-derived mononuclear cells (BMNC) were examined for Ag-specific CD8+ T-cells, as well as microglial cell activation, by flow cytometry.
Brain Leukocyte Isolation and Flow Cytometry Analysis
BMNC were isolated from brains of prime-CNS boost animals using a previously described procedure with minor modifications (Ford et al., 1995; Marten et al., 2003; Cheeran et al., 2007; Mutnal et al., 2011). Briefly, whole brain tissues were harvested (n = 6 animals/group/experiment) without enzymatic treatment, and minced finely using a scalpel, and the minced tissues were stirred on a magnetic stirrer for 30 min in RPMI 1640 (2 g/L D-glucose and 10 mM HEPES). Single cell preparations of infected brains were resuspended in 30% Percoll (Sigma-Aldrich, St. Louis, MO) and banded on a 70% Percoll cushion at 900× g for 30 min at 15°C. Brain leukocytes obtained from the 30–70% Percoll interface were collected. Cells were treated with Fc block (anti-CD32/CD16 in the form of 2.4G2 hybridoma culture supernatant with 2% normal rat and 2% normal mouse serum) to inhibit non-specific Ab binding. Cells were then counted using the trypan blue dye exclusion method, and 1 × 10⁶ cells were subsequently stained using anti-mouse immune cell surface markers for 15–20 min at 4°C (anti-CD45-BV605, anti-PD-L1-PE-Cy7, anti-CD11b-AF700, anti-CD103-FITC, anti-CD69-eF450, anti-MHCII-APC (Thermo Fisher Scientific, Waltham, MA, USA) and anti-CD8-BV-510 from (Biolegend, San Diego, CA, USA). Control isotype Abs were used for all fluorochrome combinations to assess nonspecific Ab binding. For tetramer staining, the H-2Kd MHC class I-restricted peptide AI9 tetramer was purchased from MBL Corporation (Woburn, MA, USA) and used for the evaluation of Ag-specific responses. Samples were acquired using an LSRII H4760 (BD Biosciences, San Jose, CA, USA) flow cytometer, whereas others were acquired using Fortessa X-20 (BD Biosciences). Live leukocytes were gated using forward scatter and side scatter parameters and data were analyzed using FlowJo software (FlowJo, Ashland, OR, USA).
Intracellular Cytokine Staining
To assess the production of iNOS and Arg1, and to evaluate the proliferative response of the microglial cells, intracellular staining was performed. BMNC (2 × 10⁶ cells/well) were surface stained prior to fixation/permeabilization using cytofix/cytosperm kit (eBioscience, now Thermo Fisher Scientific). Cells were then stained using iNOS-PE, Ki67-PE-cy7 (Thermo Fisher Scientific), and Arg1-FITC (R&D Systems, Minneapolis, MN, USA) as recommended by the manufacturer’s protocol. Stained cells were analyzed using flow cytometry as described above.
Primary Microglial Cell Cultures
Murine cerebral cortical cells were collected from neonatal Balb/c mice (1 d old). These cells were dissociated after a 30 min trypsinization (0.25%) in HBSS and plated in 75 cm2 culture flasks in DMEM containing 6% FBS, penicillin (100 U/ml), streptomycin (100 μg/ml), gentamicin (50 μg/ml), and Fungizone® amphotericin B (250 pg/ml). The medium was replenished at d 1 and 4 after plating. On d 12 of culture, floating microglial cells were harvested and plated onto 48-well cell culture plates (1 × 10⁵ cells/well). After a 1 h incubation at 37°C, the culture plates were washed and incubated overnight before starting the experiments. Purified microglial cell cultures stained positively with Iba-1 antibodies (>95%) and 3–5% with glial fibrillary acid protein (GFAP) antibodies, a specific astrocyte marker.
Real-Time RT-PCR
For real-time RT-PCR, BMNC collected from animals at d 14 post-challenge were either stimulated with AI9 peptide or left unstimulated for 1 h before being co-cultured with purified microglial cell (>95% microglia) for 24 h. Total RNA was extracted from co-cultured cells using the RNeasy® Lipid Tissue Mini kit (Qiagen, Valencia, CA, USA), treated with DNase and reverse transcribed to cDNA with oligo (dT)12–18, random hexmer, dNTPs (Gene Link, Hawthorne, NY), RNase inhibitor and SuperScript™ III reverse transcriptase (Invitrogen, Carlsbad, CA, USA). Diluted cDNA, primers, and SYBR® Advantage® qPCR premix (Takara Bio USA, Mountain View, CA, USA) were subjected to real-time PCR (Bio-Rad Laboratories, Hercules, CA, USA) according to the manufacturer’s guidelines. Primer sequences used were: sense 5′-GCGTCATTGAATCACACCTG-3′ and antisense 5′-GACCTGTGGGTTGTTGACCT-3′ for IFN-γ (104 bp); sense 5′-TGGCCACCTTGTTCAGCTACG-3′ and antisense 5′-GCCAAGGCCAAACACAGCATA-3′ for iNOS (213 bp); sense 5′-AGACTTCCATCCAGTTGCCTTC-3′ and anti-sense 5′-CATTTCCACGATTTCCCAGAG-3′ for IL-6 (175 bp) ; sense 5′-CTGTGAAGGGAATGGGTGTT-3′ and antisense 5′-GGTCACTGTCCCAGCATCTT-3′ for TNF-α (200 bp); sense 5′-CGTGAGTGGGAAGAGAAGTGTC-3′ and antisense 5′-CTACAATGAGGAACAACAGGATGG-3′ for PD-L1 (239 bp) and sense 5′-TGCTCGAGATGTCATGAAGG-3′ and antisense 5′-AATCCAGCAGGTCAGCAAAG-3′ for HPRT (hypoxanthine phosphoribosyltransferase, 95 bp). The PCR conditions for the Bio-Rad CFX96 qPCR System were: 1 denaturation cycle at 95°C for 10 s; 40 amplification cycles of 95°C for 10 s, 60°C annealing for 10 s, and elongation at 72°C for 10 s; followed by 1 dissociation cycle. The relative product levels were quantified using the 2−ΔΔCt method (Livak and Schmittgen, 2001) and were normalized to the housekeeping gene HPRT.
Statistical Analysis
Data are representative of two separate experiments, each experiment using six animals per group per time point, where brain tissue homogenates of two animals were pooled together. The results were analyzed by the student’s t-test as well as One-way ANOVA using GraphPad prism 7.03 software. A value of p < 0.05 was considered significant.
Results
Ag-Specific CD69+CD103+CD8+ bTRM Cells Persist and Proliferate in Response to Re-challenge
In our previous study, we demonstrated that the bTRM cells persist within the murine brain and that their subsequent Ag-specific challenge induced reactive gliosis. In this study, we followed-up on those findings by first demonstrating that bTRM proliferate in response to re-challenge with the immunodominant HIV-1 AI9 CD8+ T-cell epitope peptide. To achieve this, BALB/c mice were first immunized via tail vein injection with recombinant adenovirus vectors expressing the HIV-1 p24 capsid protein (rAd5-p24), followed by a CNS-boost using Pr55Gag/Env virus-like particles (HIV-VLPs) injected into the striatum. Following the establishment of the bTRM population (>30 d), which we have previously characterized and reported (Prasad et al., 2019), prime-CNS boost animals were then subjected to in vivo Ag-challenge (d 30 post HIV-VLP injection), as well as re-challenge (d 14 post-challenge), using the AI9 CD8+ T-cell epitope peptide (Figure 1A). Knowing that TRM cells rapidly respond to small amounts of Ag, we went on to investigate the total CD8+ T-cell population, Ki67+CD8+ T-cells, Ag-specific CD8+ T-cells, and Ag-specific CD103+CD69+CD8+ T-cells in response to Ag. The re-challenged group of animals displayed an elevated total number of CD8+ T-cells and the difference was found to be significant when compared to saline controls. Moreover, Ki67 expression on total CD8+ T-cells revealed that a sizable fraction readily proliferated seeing its antigen. These total CD8+ T-cells were then analyzed for the absolute number of Ag-specific CD8+ cells. Our data revealed significantly increased levels of tetramer-specific CD8 T-cells among the re-challenged group. Similar observations were made when we analyzed the number of Ag-specific CD103+CD69+CD8+ T-cells (Figures 1B,C). In addition to the absolute numbers, we analyzed the frequencies of these populations. We found that the majority of AI9 tetramer-specific CD8+ T-cells co-expressed CD69 and CD103 at d 2 post re-challenge. The frequency of Ag-specific CD69+CD103+CD8+ T-cells was significantly higher in the AI9 re-challenged group (78.7 ± 1.1%) than the saline group (24.4 ± 0.7%) at d 2 post re-challenge (Figures 1B,D). We next evaluated the proliferative response and survival of the bTRM cells following re-challenge. It was interesting to note that Ag-specific CD69+CD103+CD8+ T-cells displayed increased proliferation following repeated exposure to specific peptide, however, these cells expressed lower levels of Bcl-2 (a marker of cell survival; Figures 1B,D). In sharp contrast, Ag-specific bTRM cells in the saline group showed significantly lower levels of proliferation, whereas their survival was significantly higher when compared to the Ag-specific re-challenge animals. Additionally, bTRM cells in the AI9 re-challenged group showed significantly higher expression of Ki67 (marker for proliferation) 23.5 ± 0.98% than those in the saline group which expressed about 6.5 ± 0.7% Ki67. We also found elevated levels of Bcl-2 expression (61 ± 2.4%) on bTRM cells in the saline group whereas, the AI9 re-challenged group expressed about 32 ± 2.3% of Bcl-2 which was significantly lower (Figures 1B,D). In addition, we analyzed the Ag-specific CD103- population among the saline group of animals and observed lower expression of Bcl-2, which may indicate reduced survival of these CD103- cells (Supplementary Figure 2D).
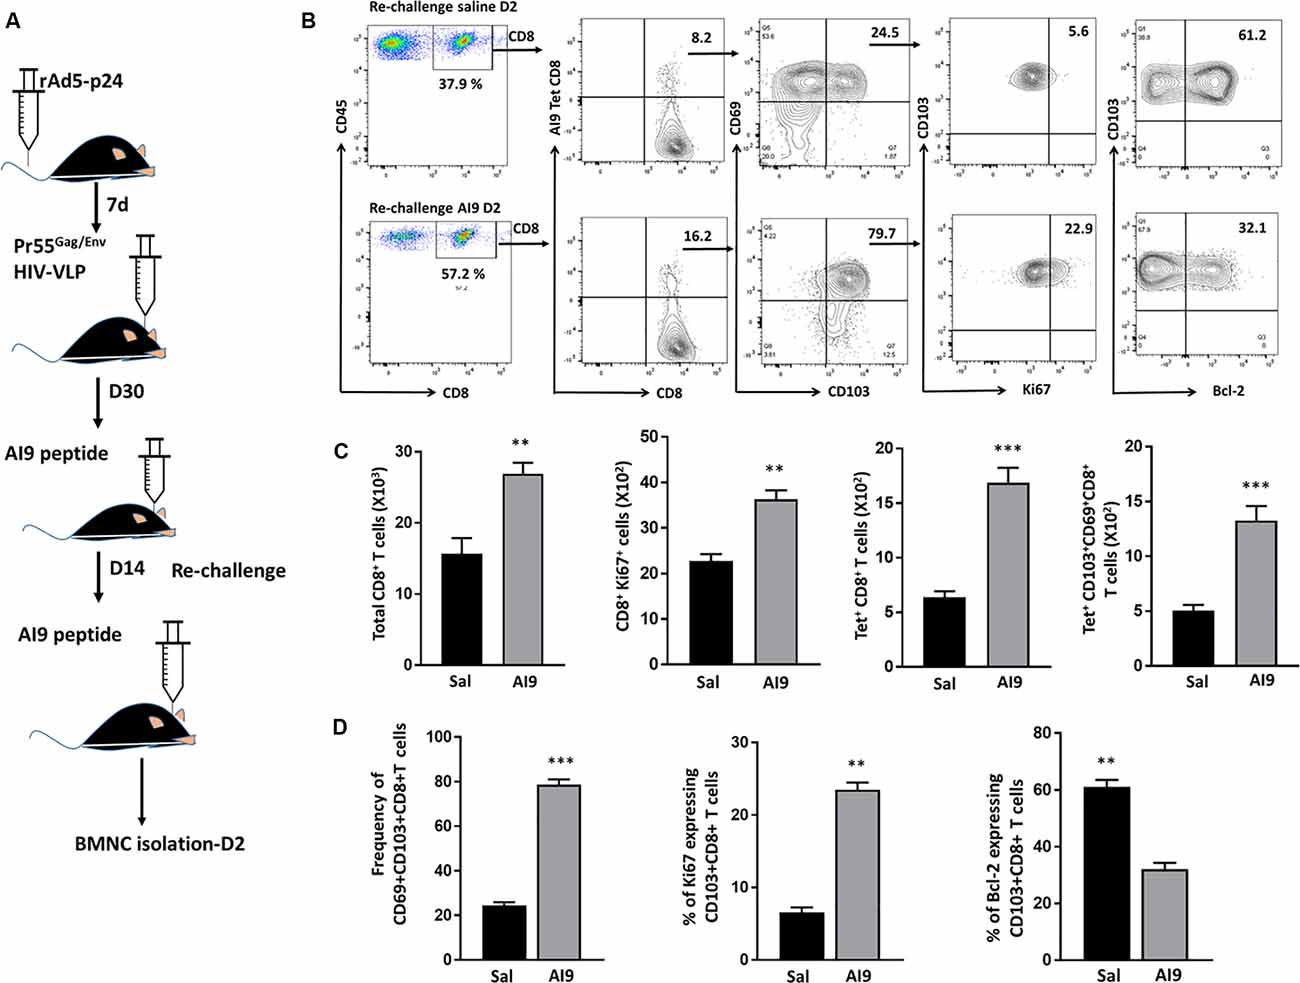
Figure 1. Ag-specific CD69+CD103+CD8+ brain resident-memory T-cells persisted and proliferated in response to re-challenge. (A) Schematic of the experimental design illustrates intravenous delivery of recombinant adenovirus vectors expressing HIV-1 p24 capsid protein (rAd5-p24), followed by a CNS-boost consisting of intracranial injection of HIV-VLPs into the striatum. Thirty days later, in vivo challenge was performed by injecting cognate antigen (AI9 peptide) or saline (controls) into the brain. Subsequent re-challenge was performed at d 14 post-challenge. BMNC were collected at d 2 post re-challenge. (B) Representative flow cytometry plots show the expression of CD8+ T-cells, tetramer-specific CD8+ T-cells, tetramer-specific CD69+CD103+CD8+ bTRM, Ki67 (i.e., proliferating cells) as well as Bcl-2 (i.e., survival marker) expression on tetramer-specific CD69+CD103+CD8+ bTRM at d 2 post-AI9 re-challenge (bottom panel of contour plot), and saline control (upper panel). (C) Absolute numbers of brain infiltrating CD8+ T-cells, proliferating CD8+ T-cells, tetramer-specific CD8+ T-cells, and Ag-specific CD69+CD103+CD8+ bTRM were determined at d 2-post re-challenge. (D) Pooled data present the frequencies (mean ± SD) of Ag-specific CD69+CD103+CD8+ bTRM, percent proliferating, and percent expressing Bcl-2 among the re-challenge group at d 2. Data presented are representative of two separate experiments, each experiment used six animals per group per time point with brain tissue homogenates from two animals being pooled. **p < 0.01 and ***p < 0.001.
Prolonged Microglial Activation Following In vivo Re-challenge With T-Cell Epitope Peptides
We have previously reported an immediate and dramatic upregulation of microglial activation markers in response to in vivo exposure of specific epitope peptides (Prasad et al., 2019). To investigate the impact of repeated Ag challenge on these resident immune cells of the brain, we examined the effects of challenge and re-challenge. First, we examined the activation of microglia (CD45int/CD11b+) through assessment of the kinetics of MHCII and PD-L1 (activation markers) expression at d 2, 7, 14, and 30 following both challenge and re-challenge via intracranial injection of AI9 peptide (Figure 2A). Among the animals that were subjected to challenge, a rapid upregulation of MHCII (74.2 ± 1.8% vs. 17.6 ± 2.9% without peptide) and PD-L1 (74.5 ± 2.8% vs. 13.3 ± 1.3% without peptide) was observed at d 2 (Figures 2B,C, Supplementary Figures 1C,D). However, over the time course of Ag exposure expression of these two activation markers waned i.e., MHCII was reduced to 30.8 ± 2.1% at d 7, 10.1 ± 1.0% at d 14 and 4.5 ± 0.5% at d 30 post-challenge (Figures 2B,C). Similarly, expression of PD-L1 decreased to 23.3 ± 1.8% at d 7, 10.5 ± 1.4% at d 14 and 4.2 ± 0.4% at d 30-post re-challenge (Figures 2D,E). In sharp contrast, subsequent re-challenge resulted in more modest upregulation of MHCII (45.7 ± 1.2%) and PD-L1 (34.6 ± 1.3%) at d 2-post re-challenge. To ensure the microglial cell inflammatory response detected was due to cognate peptide delivered into the CNS (and not due to the intracranial injection itself) we used control groups where saline was injected. Among control animals, MHCII expression was 17.6 ± 2.9% following challenge and its expression was 20 ± 1.4% following re-challenge; similarly, PD-L1 expression was 13.3 ± 1.3% and 20.2 ± 0.8% at d 2 post-challenge and re-challenge, respectively (Supplementary Figures 1A,C,D). These data demonstrated that microglial cells displayed prolonged activation in response to subsequent re-challenge when compared to challenge alone. Microglia displayed sustained, elevated MHCII expression (46.3 ± 1.0%) at d 7; d 14 (31.7 ± 2.1%), and d 30 post re-challenge (12.7 ± 1.0%). Similarly, a prolonged elevation of PD-L1 expression was also observed (48.8 ± 2.9%) at d 7; d 14 (31.5 ± 1.0%); and d 30 post re-challenge (12.9 ± 1.2%) when compared to challenge alone (Figures 2B–E).
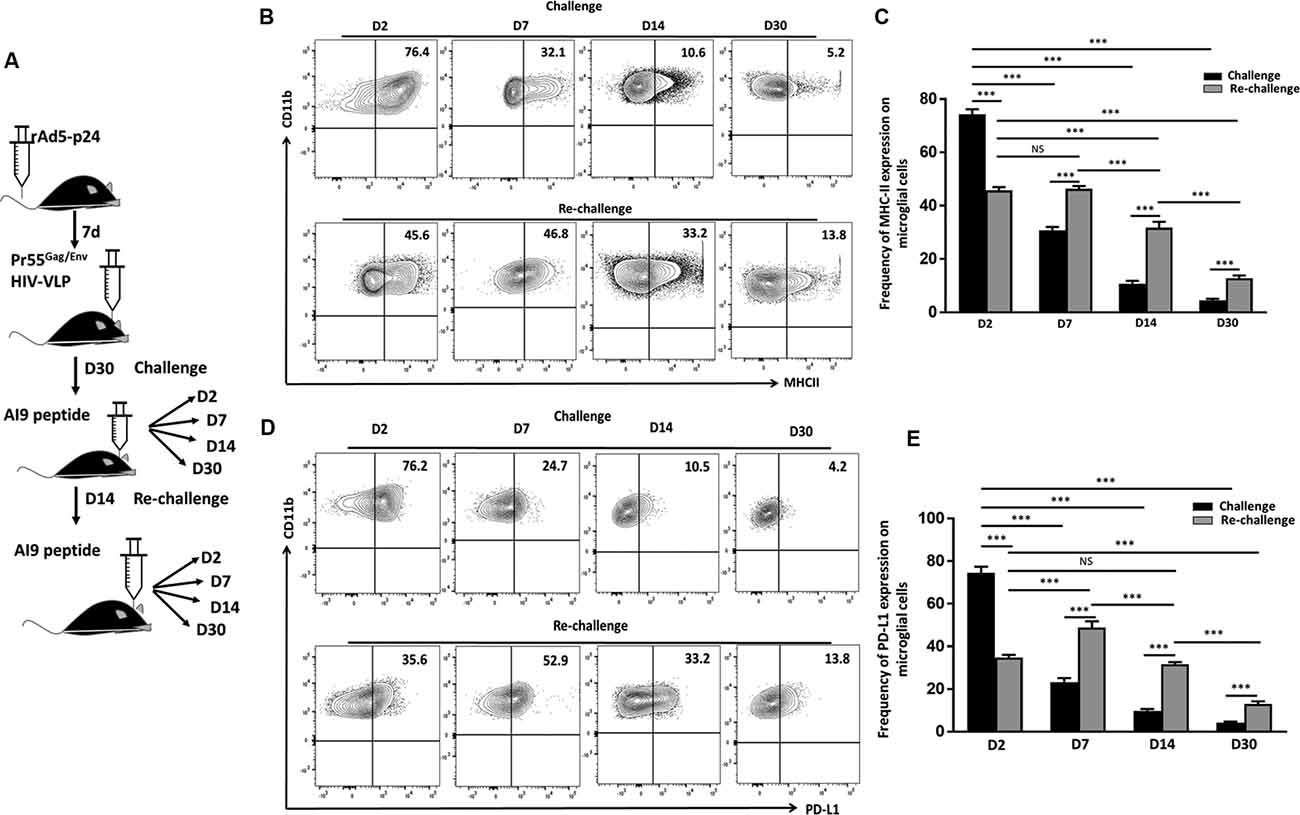
Figure 2. In vivo re-challenge with T-cell epitope peptide-induced long-term microglial cell activation. (A) Schematic design of AI9 peptide injection into the brain and tissue collection at d 2, 7, 14, and 30 post in vivo challenge and re-challenge. (B) Contour plots present MHCII expression on CD45int/CD11b+ microglial cells at the indicated time points post-challenge and re-challenge. (C) Bar graph presents the pooled frequency (as a percentage) of MHCII expression on microglia at d 2, d 7, d 14, and d 30 post-challenge and re-challenge. (D) Representative contour plots present expression of PD-L1 on microglia at d 2, 7, 14, and 30 post-challenge and re-challenge. (E) Bar graph presenting pooled data of the percentage of PD-L1 expression on microglial cells. Data presented are representative of two independent experiments using six animals/group/time point (i.e., two brains pooled together). P values were derived from one-way ANOVA statistical testing. ***p < 0.001; non-significant (NS) represent groups with no significant differences.
Re-challenge With T-Cell Epitope Peptide Results in Sustained Microglial Proliferation
Pathological neuroinflammation generally displays a progressive expansion of the microglial cell population (Gomez-Nicola et al., 2013; Olmos-Alonso et al., 2016). In parallel to assessing their activation status, we went on to evaluate the microglial proliferative response to both challenge and re-challenge. To achieve this, BMNC were isolated at different time points from animals subjected to Ag challenge and re-challenge and stained for Ki67, a marker for proliferating cells. We then assessed the microglial expression of Ki67. At d 2 post-stimulation, the frequency of microglia expressing Ki67 was 20.7 ± 1.2% in the group receiving challenge; and 18.7 ± 1.8% in the animals receiving subsequent re-challenge, indicating an immediate response to specific Ag exposure in both the groups (Figures 3A,B). Further analysis of Ki67 expression showed a significant increase in the frequency of the proliferating microglia at d 7, d 14, and d 30 among the re-challenged animals when compared to the challenged animals. As shown in Figure 3, Ki67 expression in microglia from animals receiving re-challenge was 12.9 ± 2% at d 7, 13 ± 0.94% at d 14, and 12.6 ± 1.3% at d 30 post re-challenge. In contrast, microglial cells obtained from animals receiving challenge alone expressed Ki67 in 7.4 ± 0.4% at d 7, 6.8 ± 0.8% at d 14, and 5.3 ± 0.4% at d 30 post-challenge. This microglial cell population showed prolonged proliferative responses in the re-challenged group. We next evaluated the absolute number of microglia at all time points among the challenge and re-challenge groups. An increased number of microglial cells was observed in both challenged and re-challenged groups at d 2 (Figures 3A,C). However, among the challenged groups of animals, the number of microglial cells subsides to normal levels (Supplementary Figure 1B). In sharp contrast, the number of microglial cells remained elevated among the re-challenged group at all time points when compared to the challenged group (Figure 3C). Additionally, similar observations were made when the absolute number of proliferating microglia were evaluated (Figure 3D). These data demonstrate prolonged microglial cell expression of Ki67 in response to the repeated Ag exposure.
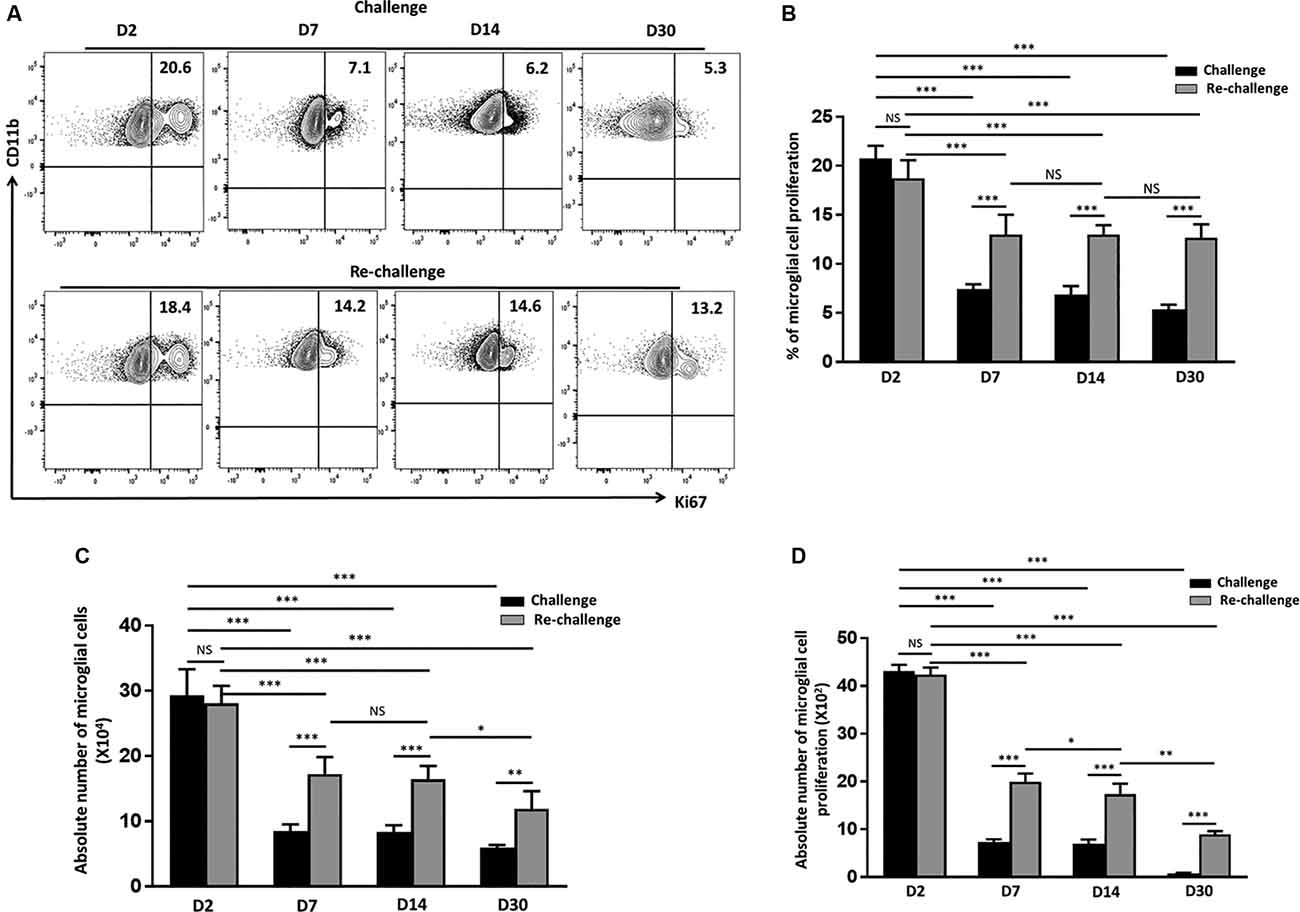
Figure 3. In vivo peptide re-challenge resulted in sustained microglial cell proliferation. (A) Representative contour plots present the expression of Ki67 on CD45int/CD11b+ microglial cells at d 2, 7, 14, and 30 post-challenge and re-challenge with cognate antigen. (B) Bar graph presents pooled data as a percentage (mean ± SD) of Ki67 expression on the microglial-gated population. (C) Bar graph presents the absolute numbers of microglial cells among challenged and re-challenged groups at d 2, d 7, d 14, and 30. (D) Pooled data show the absolute numbers of proliferating microglia among challenged and re-challenged groups at the indicated time points. Data are derived from two independent experiments using six animals/group/time point (two brains pooled together). *p < 0.05, **p < 0.01, ***p < 0.001; non-significant (NS) represent groups with no significant differences.
Re-challenge With T-Cell Epitope Peptide Results in Sustained Production of iNOS by Activated Microglia
Having observed that microglia displayed a long–term activated and proliferative phenotype in response to re-challenge, we then went on to assess if they also produced elevated levels of neurotoxic mediators that may be detrimental to neural tissue integrity. So, we evaluated the production of iNOS via intracellular staining among both challenge and re-challenge groups of animals at different time points post-stimulation. Elevated levels of iNOS were observed at d 2 both among the challenge (23.4 ± 1%) and re-challenge group (21.2 ± 1.2%) of animals (Figures 4A,B). Further analysis of iNOS production revealed that microglial cells from animals which were re-challenged produced it at a significantly higher frequency at d 7 (15.3 ± 1.0%); and persistent, elevated production was observed at d 14 (16.4 ± 1.1%), which remained higher at d 30 (11.7 ± 0.5%) when compared to the challenge groups (Figures 4A,B). Among challenged groups of animals iNOS production was 7.9 ± 0.2% at d 7, which further reduced to 5.7 ± 0.3% at d14, and 5.5 ± 0.4% at d 30. Finally, controls showed that administration of saline resulted in lower levels of iNOS production by microglia (Supplementary Figures 1A,B). To further investigate the effects of challenge and re-challenge on microglia, we evaluated the expression of anti-inflammatory marker arginase 1 (Arg1). Interestingly, we found that the expression of Arg1 was significantly reduced at all time points post re-challenge when compared to the challenged alone group of animals. The levels of Arg1 expression by microglia were 5.4 ± 0.5% at d 2, 4.7 ± 0.4% at d 7, 4 ± 0.4% at d 14, and 5.2 ± 0.3% at d 30 in the re-challenged group of animals. In contrast, among the challenged groups, the levels of Arg1 were 14.3 ± 0.5% at d 2, 12.4 ± 0.5% at d 7, 9.2 ± 0.4% at d 14, and 9.8 ± 0.4% at d 30 (Figures 4C,D). Taken together, these data indicate that there is increased iNOS and correspondingly decreased Arg1 production among microglia in animals receiving re-challenge with T-cell epitope peptide.
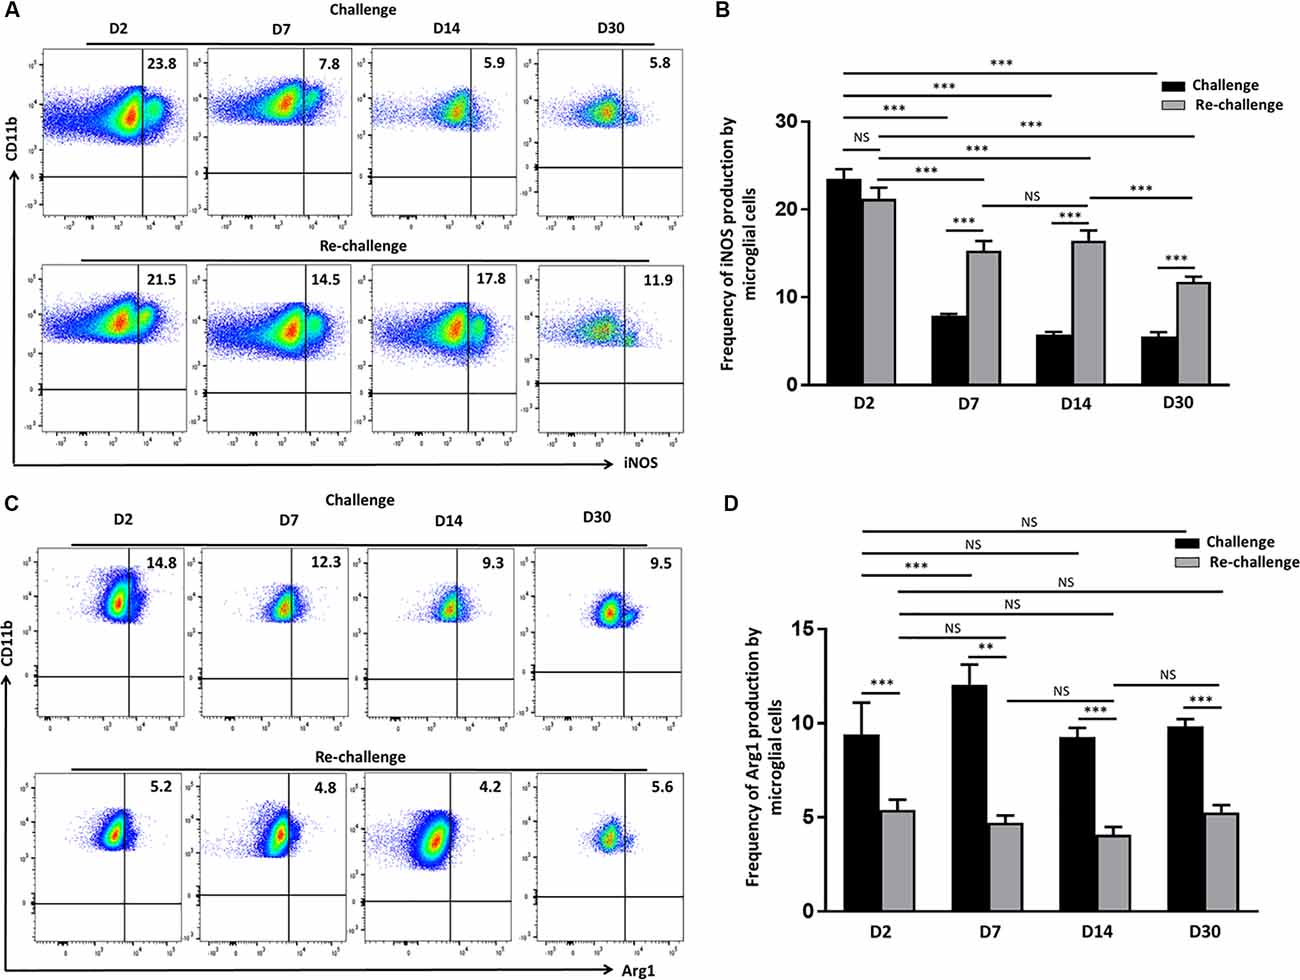
Figure 4. Re-challenge with T-cell epitope peptide-induced prolonged inducible nitric oxide synthase (iNOS) production by reactive microglia. (A) Representative pseudocolor plots illustrate microglial cell iNOS production at d 2, 7, 14, and 30 post-challenge and re-challenge with cognate antigen. (B) Bar graph indicates the frequencies of iNOS producing microglia under the indicated stimulation conditions. (C) Representative pseudocolor plot shows the percentage of the microglial cell expressing Arg1 in response to challenge and re-challenge at the indicated time points. (D) Bar graph presents pooled data showing the percentage cells expressing Arg1. Data presented as mean ± SD from two different experiments using six animals/group/time point (two brains pooled together). **p < 0.01, ***p < 0.001; non-significant (NS) represent groups with no significant differences.
Increased Production of Proinflammatory Mediators Following Ex vivo T-Cell Epitope Re-challenge
Following our observation, that in vivo epitope peptide re-challenge resulted in prolonged microglial activation and sustained production of cytotoxic factors; we next investigated the impact of ex vivo re-challenge. In these experiments, BMNC which were isolated from animals at d 14 post-challenge were co-cultured with primary microglial cells, and re-challenged with AI9 peptide, or left unstimulated (Figure 5A). Using a semi-quantitative real-time (RT)-PCR we assessed the levels of IFN-γ, iNOS, IL-6, TNF-α, and PD-L1 transcripts, which demonstrate neuroinflammation. We detected significantly elevated IFN-γ and iNOS gene expression among the ex vivo AI9 re-challenged groups when compared to untreated controls. A reduced yet still significant upregulation of PD-L1 and TNF-α transcripts was also observed (Figure 5B). IL-6 transcript levels were also elevated compared to non-restimulated controls but did not reach statistical significance. We also evaluated the transcript levels of these markers among the BMNC control group. Data generated from these cells displayed negligible levels of IFN-γ, iNOS, IL-6, TNF-α, and PD-L1 transcripts.
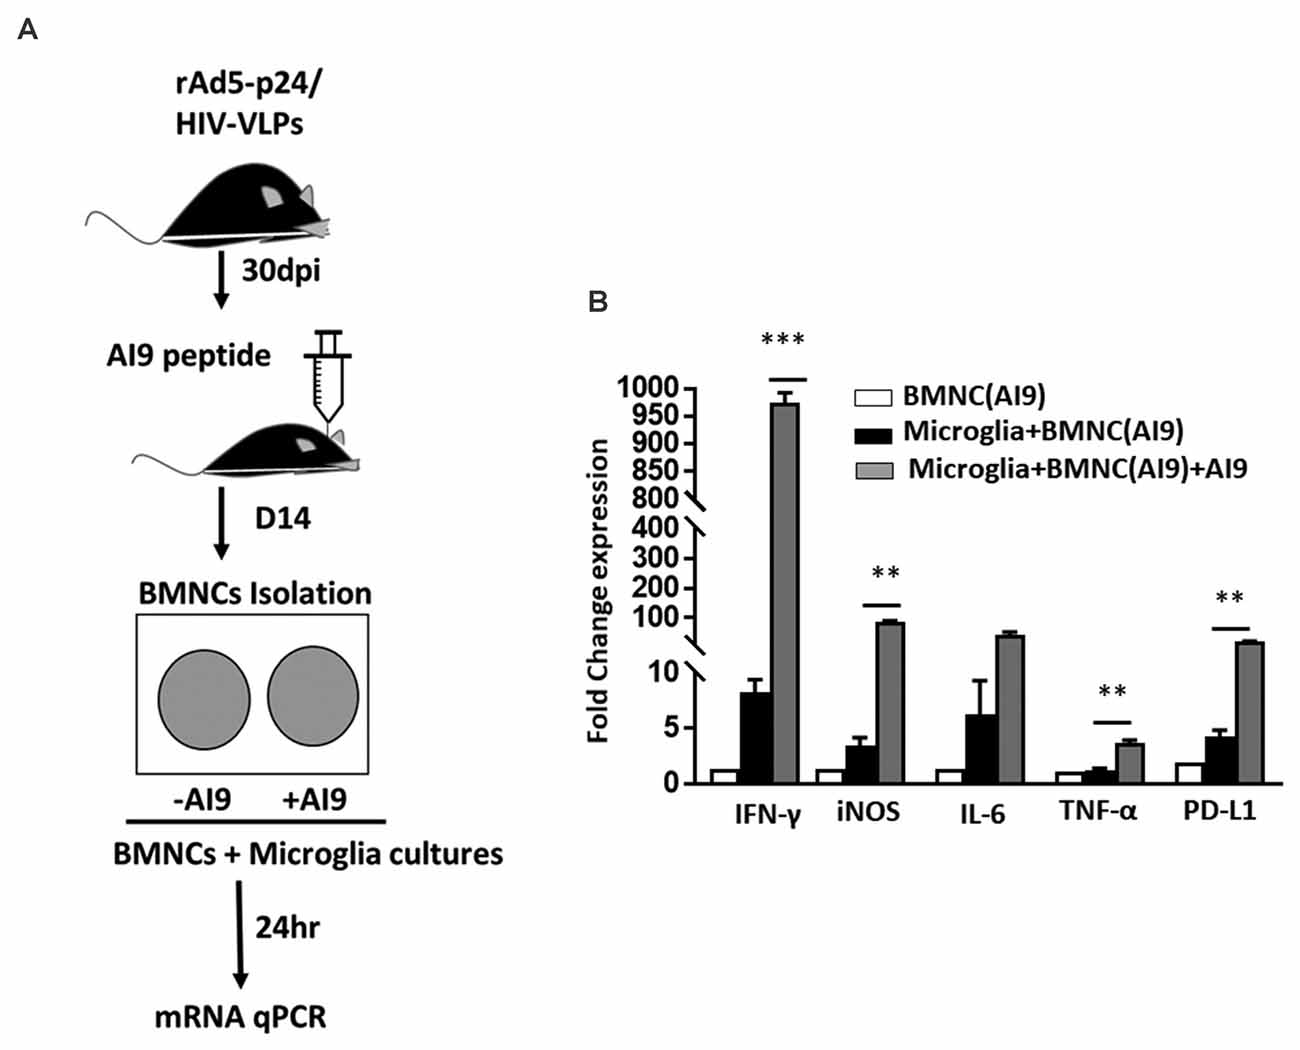
Figure 5. Ex vivo peptide re-challenge resulted in production of pro-inflammatory mediators. (A) Schematic of the experimental design shows that BMNC isolated at d 14 post-challenge were co-cultured with primary microglia. BMNC were either treated with HIV-specific AI9 peptide or left untreated before addition to the microglial cell culture. Real time RT-PCR was performed after 24 h. (B) Bar graph displays fold change in IFN-γ, iNOS, IL-6, TNF-α, and PD-L1 mRNA expression. Expression values were normalized to untreated controls. Data are presented as mean ± SD of two independent experiments using six animals. ***p < 0.001 and **p < 0.01.
Discussion
The pathogenic potential of latent brain infection and the impact of periodic viral reactivation on the CNS is poorly understood. Accumulating studies have identified a link between viral re-challenge and neurodegeneration (Martin et al., 2014; Machado-Santos et al., 2018; Doll et al., 2020; Marcocci et al., 2020), however, the cellular events that contribute to it remain unclear. Elucidating the outcome of cumulative, repeated Ag challenge will be an important step towards understanding these mechanisms. Our previous findings report that Ag-specific bTRM rapidly expand and produce inflammatory cytokines in response to their cognate Ag (Prasad et al., 2019). In this study, we provide further evidence that bTRM cells also proliferate following repeated episodes of Ag exposure. In addition, a small fraction of these cells maintained homeostatic proliferation, as observed by Ki67 expression, and displayed increased survival in the absence of re-challenge. It has been reported that TRM cells in the lung have limited longevity and that circulating T-effector memory cells which seed the lung help to maintain this stable population (Slutter et al., 2017). Although, bTRM cells exhibit defects in survival capacity ex vivo (Wakim et al., 2010), these cells do possess high proliferative potential in response to reactivation events, which is similar to our finding (Steinbach et al., 2016).
The nature of viral infection shapes the phenotypic heterogeneity of CD8+ bTRM cells. In this study, the frequency of CD69+CD103+CD8+ T-cells was around 80% following the Ag re-challenge, whereas only 25% of these cells persisted in the absence of Ag re-challenge. These data show that the chronicity of viral infection modulates the frequency of persisting bTRM cells. Furthermore, among the saline group, we observed both CD103+ and CD103- populations. TRM cells are a highly sensitive and activated T cell population and high numbers may not be required to persist in the absence of Ag, particularly in tissues like the brain. It is known that CD103-T-cells are recruited into the brain during the acute phase of infection but are not retained. There is also evidence, which indicates that CD103- populations can persist within the brain, albeit rather poorly when compared to the CD103+ counterparts. Genetic profiling of these cells indicates that CD103 expression influences T-cell retention, survival, and function within the CNS (Wakim et al., 2012). In our study, in analyzing the Ag-specific CD103- population among the saline group of animals, we observed lower expression of Bcl-2, which may indicate reduced survival of this CD103- population. However, further studies are required to address if the CD103- population upregulates CD103+ in response to Ag stimulation. A more detailed study is required to understand if Ag-specific cells get activated and expand in response to the peptide that drains into lymphoid tissue. However, it is clear from numerous reports that activated TRM cells produce soluble mediators, which recruit additional T cells from the periphery (Tan et al., 2018; Wu et al., 2018).
IFN-γ is considered a major effector cytokine produced by TRM. Transcript levels of IFN-γ among ex vivo re-challenged groups of animals indicate immediate effector responses to Ag re-challenge. Our findings are in line with other studies where TRM cells respond to previously encountered pathogens in an Ag-specific manner and express higher transcript levels of pro-inflammatory cytokines than their circulating counterparts (Hombrink et al., 2016; Kumar et al., 2017). The presence of preformed RNA encoding IFN-γ may also help explain the remarkable effectiveness of TRM populations (Behr et al., 2018). While their survival and functional response does not wane over time, our data support the idea that the frequency of bTRM cells declines in absence of cognate Ag. However, there are studies that report TRM cells in the lung exhibit waning immunity (Slutter et al., 2017). While the protective role of TRM to Ag re-challenge is well established, various aspects of bystander immune activation that may drive CNS injury remain unclear.
Brain-resident microglia detect and respond to pro-inflammatory triggers by switching to a reactive phenotype and releasing factors, which have neurotoxic side effects. This activation of microglial cells is a complex phenomenon and is associated with consequences ranging from neuroprotective to neurotoxic (Sierra et al., 2013), hence the critical need to understand these links. Microglia are a heterogeneous population whose phenotype depends on the local cytokine milieu, adopting various functions critical for neuronal health and CNS homeostasis (Perry et al., 2010). These cells normally express low levels of MHCII, however, under neuroinflammatory conditions activated microglia display highly upregulated expression (Schachtele et al., 2014).
The impact of repeated episodes of viral reactivation on microglial cell activation is unknown. In this study, we demonstrated that with repeated in vivo cognate peptide stimulation, microglial cells portray persistently activated profiles, as observed by MHCII and PD-L1 upregulation. Similarly, there are other studies, which report that MHCII signaling is critical for microglial cell activation, associated inflammatory responses, and neurodegeneration (Harms et al., 2013). Moreover, PD-L1 expression by microglia resulted in reduced cytotoxicity of cells expressing viral epitope peptides (Chauhan et al., 2021). PD-1: PD-L1 interactions are well-known to downregulate immune responses to prevent immunopathology. We have previously reported that TRM cells within the brain express high levels of PD-1. Yet, despite this expression, bTRM cells display increased cytokine production and proliferation in response to cognate antigen (i.e., these cells are not exhausted). These data indicate that PD-1 signaling is not only required to limit the severity of neuroinflammation but also functions to sustain the appropriate level of inflammation required to control the persistent or reactivated virus. In addition to an activated phenotype, we observed that microglia proliferate for an extended time in response to repeated Ag stimulation. Our findings are in line with others, which show that microglial cell expansion is a key component of neurodegenerative diseases (Gomez-Nicola et al., 2013).
IFN-γ receptors are abundantly and functionally present on microglia and chronic exposure to IFN-γ drives an exaggerated microglial response (Ta et al., 2019). Additionally, there are reports showing that exposure to recombinant IFN-γ is associated with microglial expansion, as well as NO release via iNOS (Papageorgiou et al., 2016). Similarly, in our study, prolonged activated microglial cells produced iNOS following repeated antigen exposure. Interestingly, these reactive microglia lacked expression of anti-inflammatory marker Arg1, indicating classical activation. Moreover, ex vivo peptide re-challenge resulted in increased transcript levels of cytokines such as IFN-γ, IL-6, and iNOS. Furthermore, there are reports which show that priming of microglia with IFN-γ not only induces cell proliferation and activation but also upregulates iNOS production, which may drive decreased neuronal information processing (Lynch, 2014; Ta et al., 2019). Importantly to our study, it is well established that neurons are sensitive to infection-induced-inflammatory stimuli, which may result in cellular damage. These findings indicate that sustained neuroinflammatory events may result in bystander CNS injury. Taken together, our findings indicate that repeated Ag-specific stimulation of adaptive immune responses leads to cumulative dysregulated microglial cell activation, proliferation, and production of neurotoxic mediators.
Data Availability Statement
The original contributions presented in the study are included in the article/Supplementary Material, further inquiries can be directed to the corresponding author.
Ethics Statement
The animal study was reviewed and approved by University of Minnesota Institutional Animal Care and Use Committee.
Author Contributions
SP, SH, and JL conceived and designed the experiments and analyzed the data. SP, SH, WS, and PC performed experiments. All authors contributed to the article and approved the submitted version.
Funding
This project was supported by award number NS-038836 from the National Institute of Neurological Disorders and Stroke; and MH-066703 from the National Institute of Mental Health.
Conflict of Interest
The authors declare that the research was conducted in the absence of any commercial or financial relationships that could be construed as a potential conflict of interest.
Publisher’s Note
All claims expressed in this article are solely those of the authors and do not necessarily represent those of their affiliated organizations, or those of the publisher, the editors and the reviewers. Any product that may be evaluated in this article, or claim that may be made by its manufacturer, is not guaranteed or endorsed by the publisher.
Supplementary Material
The Supplementary Material for this article can be found online at: https://www.frontiersin.org/articles/10.3389/fncel.2021.686340/full#supplementary-material.
SUPPLEMENTARY FIGURE 1 | Microglial cell activation status among saline controls. (A) Flow cytometry gating strategy for CD8+ T-cells and microglia. Microglial cells were identified as the CD45intCD11b+ population within total BMNC and leukocytes were identified within the CD45hi population. (B) Bar graph presents the absolute numbers of microglia among the challenged control group (saline-injected animals) at d 2, d 7, d 14, and d 30. (C) Representative contour images of the microglial population display the expression of activation markers (i.e., MHC-II and PD-L1) in control groups under the indicated stimulated conditions. (D) Bar graph shows frequencies of MHC-II and PD-L1 on microglial cells at d 2 following challenge and re-challenge of the saline controls. (E) Representative contour plots display proliferating microglial cells among the control animals at d 2 and d 14-post saline injection. (F) Bar graph shows the percentage of Ki67 expression by microglia among saline control groups at the indicated time points and among rAD-p24/HIV-VLP animals prior to saline injection. Pooled data are presented as mean ± SD from two independent experiments using six animals/group/time point.
SUPPLEMENTARY FIGURE 2 | iNOS production by microglial cells among saline controls. (A) Representative pseudocolor plots showing the production of iNOS by the microglia among saline control animals at d 2 post-challenge and re-challenge. (B) Bar graph display pooled data of the frequency of iNOS production among the indicated treatment groups. (C) Contour plot displays the isotype control for Ki67 expression. (D) Contour plot shows Bcl-2 expression on the CD103- population pre-gated on Ag-specific CD8+ T-cells.
References
Amor, S., Peferoen, L. A., Vogel, D. Y., Breur, M., van der Valk, P., Baker, D., et al. (2014). Inflammation in neurodegenerative diseases—an update. Immunology 142, 151–166. doi: 10.1111/imm.12233
Bachiller, S., Jimenez-Ferrer, I., Paulus, A., Yang, Y., Swanberg, M., Deierborg, T., et al. (2018). Microglia in neurological diseases: a road map to brain-disease dependent-inflammatory response. Front. Cell. Neurosci. 12:488. doi: 10.3389/fncel.2018.00488
Behr, F. M., Chuwonpad, A., Stark, R., and van Gisbergen, K. (2018). Armed and ready: transcriptional regulation of tissue-resident memory CD8 T cells. Front. Immunol. 9:1770. doi: 10.3389/fimmu.2018.01770
Belkhelfa, M., Rafa, H., Medjeber, O., Arroul-Lammali, A., Behairi, N., Abada-Bendib, M., et al. (2014). IFN-γ and TNF-α are involved during Alzheimer disease progression and correlate with nitric oxide production: a study in algerian patients. J. Interferon Cytokine Res. 34, 839–847. doi: 10.1089/jir.2013.0085
Chauhan, P., Hu, S., Prasad, S., Sheng, W. S., and Lokensgard, J. R. (2021). Programmed death ligand-1 induction restrains the cytotoxic T lymphocyte response against microglia. Glia 69, 858–871. doi: 10.1002/glia.23932
Cheeran, M. C., Hu, S., Palmquist, J. M., Bakken, T., Gekker, G., and Lokensgard, J. R. (2007). Dysregulated interferon-gamma responses during lethal cytomegalovirus brain infection of IL-10-deficient mice. Virus Res. 130, 96–102. doi: 10.1016/j.virusres.2007.05.022
Cox, M. A., Kahan, S. M., and Zajac, A. J. (2013). Anti-viral CD8 T cells and the cytokines that they love. Virology 435, 157–169. doi: 10.1016/j.virol.2012.09.012
Doll, J. R., Hoebe, K., Thompson, R. L., and Sawtell, N. M. (2020). Resolution of herpes simplex virus reactivation in vivo results in neuronal destruction. PLoS Pathog. 16:e1008296. doi: 10.1371/journal.ppat.1008296
Fletcher, J. M., Lalor, S. J., Sweeney, C. M., Tubridy, N., and Mills, K. H. (2010). T cells in multiple sclerosis and experimental autoimmune encephalomyelitis. Clin. Exp. Immunol. 162, 1–11. doi: 10.1111/j.1365-2249.2010.04143.x
Ford, A. L., Goodsall, A. L., Hickey, W. F., and Sedgwick, J. D. (1995). Normal adult ramified microglia separated from other central nervous system macrophages by flow cytometric sorting. Phenotypic differences defined and direct ex vivo antigen presentation to myelin basic protein-reactive CD4+ T cells compared. J. Immunol. 154, 4309–4321.
Forte, E., Zhang, Z., Thorp, E. B., and Hummel, M. (2020). Cytomegalovirus latency and reactivation: an intricate interplay with the host immune response. Front. Cell. Infect. Microbiol. 10:130. doi: 10.3389/fcimb.020.00130
Gomez-Nicola, D., Fransen, N. L., Suzzi, S., and Perry, V. H. (2013). Regulation of microglial proliferation during chronic neurodegeneration. J. Neurosci. 33, 2481–2493. doi: 10.1523/JNEUROSCI.4440-12.2013
Hanisch, U. K. (2002). Microglia as a source and target of cytokines. Glia 40, 140–155. doi: 10.1002/glia.10161
Harms, A. S., Cao, S., Rowse, A. L., Thome, A. D., Li, X., Mangieri, L. R., et al. (2013). MHCII is required for alpha-synuclein-induced activation of microglia, CD4 T cell proliferation and dopaminergic neurodegeneration. J. Neurosci. 33, 9592–9600. doi: 10.1523/JNEUROSCI.5610-12.2013
Hombrink, P., Helbig, C., Backer, R. A., Piet, B., Oja, A. E., Stark, R., et al. (2016). Programs for the persistence, vigilance and control of human CD8(+) lung-resident memory T cells. Nat. Immunol. 17, 1467–1478. doi: 10.1038/ni.3589
Ji, Q., Perchellet, A., and Goverman, J. M. (2010). Viral infection triggers central nervous system autoimmunity via activation of CD8+ T cells expressing dual TCRs. Nat. Immunol. 11, 628–634. doi: 10.1038/ni.1888
Kim, T. S., and Shin, E. C. (2019). The activation of bystander CD8(+) T cells and their roles in viral infection. Exp. Mol. Med. 51, 1–9. doi: 10.1038/s12276-019-0316-1
Kumar, B. V., Ma, W., Miron, M., Granot, T., Guyer, R. S., Carpenter, D. J., et al. (2017). Human Tissue-resident memory T cells are defined by core transcriptional and functional signatures in lymphoid and mucosal sites. Cell Rep. 20, 2921–2934. doi: 10.1016/j.celrep.2017.08.078
Livak, K. J., and Schmittgen, T. D. (2001). Analysis of relative gene expression data using real-time quantitative PCR and the 2(−Delta Delta C(T)) method. Methods 25, 402–408. doi: 10.1006/meth.2001.1262
Lively, S., and Schlichter, L. C. (2018). Microglia responses to pro-inflammatory stimuli (LPS, IFNgamma+TNFalpha) and reprogramming by resolving cytokines (IL-4, IL-10). Front. Cell. Neurosci. 12:215. doi: 10.3389/fncel.2018.00215
Lokensgard, J. R., Schachtele, S. J., Mutnal, M. B., Sheng, W. S., Prasad, S., and Hu, S. (2015). Chronic reactive gliosis following regulatory T cell depletion during acute MCMV encephalitis. Glia 63, 1982–1996. doi: 10.1002/glia.22868
Luzuriaga, K., Gay, H., Ziemniak, C., Sanborn, K. B., Somasundaran, M., Rainwater-Lovett, K., et al. (2015). Viremic relapse after HIV-1 remission in a perinatally infected child. N. Engl. J. Med. 372, 786–788. doi: 10.1056/NEJMc1413931
Lynch, M. A. (2014). The impact of neuroimmune changes on development of amyloid pathology; relevance to Alzheimer’s disease. Immunology 141, 292–301. doi: 10.1111/imm.12156
Machado-Santos, J., Saji, E., Troscher, A. R., Paunovic, M., Liblau, R., Gabriely, G., et al. (2018). The compartmentalized inflammatory response in the multiple sclerosis brain is composed of tissue-resident CD8+ T lymphocytes and B cells. Brain 141, 2066–2082. doi: 10.1093/brain/awy151
Marcocci, M. E., Napoletani, G., Protto, V., Kolesova, O., Piacentini, R., Li Puma, D. D., et al. (2020). Herpes simplex virus-1 in the brain: the dark side of a sneaky infection. Trends Microbiol. 28, 808–820. doi: 10.1016/j.tim.2020.03.003
Marten, N. W., Stohlman, S. A., Zhou, J., and Bergmann, C. C. (2003). Kinetics of virus-specific CD8+ -T-cell expansion and trafficking following central nervous system infection. J. Virol. 77, 2775–2778. doi: 10.1128/JVI.77.4.2775-2778.2003
Martin, C., Aguila, B., Araya, P., Vio, K., Valdivia, S., Zambrano, A., et al. (2014). Inflammatory and neurodegeneration markers during asymptomatic HSV-1 reactivation. J. Alzheimers Dis. 39, 849–859. doi: 10.3233/JAD-131706
Mockus, T. E., Ren, H. M., Shwetank, and Lukacher, A. E. (2019). To go or stay: the development, benefit and detriment of tissue-resident memory CD8 T cells during central nervous system viral infections. Viruses 11:842. doi: 10.3390/v11090842
Mutnal, M. B., Hu, S., Little, M. R., and Lokensgard, J. R. (2011). Memory T cells persisting in the brain following MCMV infection induce long-term microglial activation via interferon-gamma. J. Neurovirol. 17, 424–437. doi: 10.1007/s13365-011-0042-5
Olmos-Alonso, A., Schetters, S. T., Sri, S., Askew, K., Mancuso, R., Vargas-Caballero, M., et al. (2016). Pharmacological targeting of CSF1R inhibits microglial proliferation and prevents the progression of Alzheimer’s-like pathology. Brain 139, 891–907. doi: 10.1093/brain/awv379
Papageorgiou, I. E., Lewen, A., Galow, L. V., Cesetti, T., Scheffel, J., Regen, T., et al. (2016). TLR4-activated microglia require IFN-gamma to induce severe neuronal dysfunction and death in situ. Proc. Natl. Acad. Sci. U S A 113, 212–217. doi: 10.1073/pnas.1513853113
Park, C. O., and Kupper, T. S. (2015). The emerging role of resident memory T cells in protective immunity and inflammatory disease. Nat. Med. 21, 688–697. doi: 10.1038/nm.3883
Perry, V. H., Nicoll, J. A., and Holmes, C. (2010). Microglia in neurodegenerative disease. Nat. Rev. Neurol. 6, 193–201. doi: 10.1038/nrneurol.2010.17
Prasad, S., Hu, S., Sheng, W. S., Chauhan, P., and Lokensgard, J. R. (2018). Reactive glia promote development of CD103(+) CD69(+) CD8(+) T-cells through programmed cell death-ligand 1 (PD-L1). Immun. Inflamm. Dis. 6, 332–344. doi: 10.1002/iid3.221
Prasad, S., Hu, S., Sheng, W. S., Chauhan, P., and Lokensgard, J. R. (2019). Recall responses from brain-resident memory CD8(+) T cells (bTRM) induce reactive gliosis. iScience 20, 512–526. doi: 10.1016/j.isci.2019.10.005
Prasad, S., Hu, S., Sheng, W. S., Chauhan, P., Singh, A., and Lokensgard, J. R. (2017). The PD-1: PD-L1 pathway promotes development of brain-resident memory T cells following acute viral encephalitis. J. Neuroinflammation 14:82. doi: 10.1186/s12974-017-0860-3
Prasad, S., Hu, S., Sheng, W. S., Singh, A., and Lokensgard, J. R. (2015). Tregs modulate lymphocyte proliferation, activation and resident-memory T-cell accumulation within the brain during MCMV infection. PLoS One 10:e0145457. doi: 10.1371/journal.pone.0145457
Prasad, S., and Lokensgard, J. R. (2019). Brain-resident T cells following viral infection. Viral Immunol. 32, 48–54. doi: 10.1089/vim.2018.0084
Schachtele, S. J., Hu, S., Sheng, W. S., Mutnal, M. B., and Lokensgard, J. R. (2014). Glial cells suppress postencephalitic CD8+ T lymphocytes through PD-L1. Glia 62, 1582–1594. doi: 10.1002/glia.22701
Sierra, A., Abiega, O., Shahraz, A., and Neumann, H. (2013). Janus-faced microglia: beneficial and detrimental consequences of microglial phagocytosis. Front. Cell. Neurosci. 7:6. doi: 10.3389/fncel.2013.00006
Slutter, B., Van Braeckel-Budimir, N., Abboud, G., Varga, S. M., Salek-Ardakani, S., and Harty, J. T. (2017). Dynamics of influenza-induced lung-resident memory T cells underlie waning heterosubtypic immunity. Sci. Immunol. 2:eaag2031. doi: 10.1126/sciimmunol.ag2031
Smolders, J., Heutinck, K. M., Fransen, N. L., Remmerswaal, E. B. M., Hombrink, P., Ten Berge, I. J. M., et al. (2018). Tissue-resident memory T cells populate the human brain. Nat. Commun. 9:4593. doi: 10.1038/s41467-018-07053-9
Steinbach, K., Vincenti, I., Kreutzfeldt, M., Page, N., Muschaweckh, A., Wagner, I., et al. (2016). Brain-resident memory T cells represent an autonomous cytotoxic barrier to viral infection. J. Exp. Med. 213, 1571–1587. doi: 10.1084/jem.20151916
Steinbach, K., Vincenti, I., and Merkler, D. (2018). Resident-memory T cells in tissue-restricted immune responses: for better or worse? Front. Immunol. 9:2827. doi: 10.3389/fimmu.2018.02827
Straub, R. H., and Schradin, C. (2016). Chronic inflammatory systemic diseases: An evolutionary trade-off between acutely beneficial but chronically harmful programs. Evol. Med. Public Health 2016, 37–51. doi: 10.1093/emph/eow001
Ta, T. T., Dikmen, H. O., Schilling, S., Chausse, B., Lewen, A., Hollnagel, J. O., et al. (2019). Priming of microglia with IFN-gamma slows neuronal gamma oscillations in situ. Proc. Natl. Acad. Sci. U S A 116, 4637–4642. doi: 10.1073/pnas.1813562116
Tan, H. X., Gilbertson, B. P., Jegaskanda, S., Alcantara, S., Amarasena, T., Stambas, J., et al. (2016). Recombinant influenza virus expressing HIV-1 p24 capsid protein induces mucosal HIV-specific CD8 T-cell responses. Vaccine 34, 1172–1179. doi: 10.1016/j.vaccine.2016.01.030
Tan, H. X., Wheatley, A. K., Esterbauer, R., Jegaskanda, S., Glass, J. J., Masopust, D., et al. (2018). Induction of vaginal-resident HIV-specific CD8 T cells with mucosal prime-boost immunization. Mucosal Immunol. 11, 994–1007. doi: 10.1038/mi.2017.89
Wakim, L. M., Woodward-Davis, A., and Bevan, M. J. (2010). Memory T cells persisting within the brain after local infection show functional adaptations to their tissue of residence. Proc. Natl. Acad. Sci. U S A 107, 17872–17879. doi: 10.1073/pnas.1010201107
Wakim, L. M., Woodward-Davis, A., Liu, R., Hu, Y., Villadangos, J., Smyth, G., et al. (2012). The molecular signature of tissue resident memory CD8 T cells isolated from the brain. J. Immunol. 189, 3462–3471. doi: 10.4049/jimmunol.1201305
Wang, W. Y., Tan, M. S., Yu, J. T., and Tan, L. (2015). Role of pro-inflammatory cytokines released from microglia in Alzheimer’s disease. Ann. Transl. Med. 3:136. doi: 10.3978/j.issn.2305-5839.2015.03.49
Williams, G. P., Marmion, D. J., Schonhoff, A. M., Jurkuvenaite, A., Won, W. J., Standaert, D. G., et al. (2020). T cell infiltration in both human multiple system atrophy and a novel mouse model of the disease. Acta Neuropathol. 139, 855–874. doi: 10.1007/s00401-020-02126-w
Keywords: viral reactivation, microglia, neurotoxicity, reactive gliosis, resident memory T-cells, immune activation
Citation: Prasad S, Sheng WS, Hu S, Chauhan P and Lokensgard JR (2021) Dysregulated Microglial Cell Activation and Proliferation Following Repeated Antigen Stimulation. Front. Cell. Neurosci. 15:686340. doi: 10.3389/fncel.2021.686340
Received: 26 March 2021; Accepted: 16 July 2021;
Published: 10 August 2021.
Edited by:
Bruno Hernaez, Severo Ochoa Molecular Biology Center (CSIC-UAM), SpainReviewed by:
Cornelia Bergmann, Case Western Reserve University, United StatesBenjamin Clarkson, Mayo Clinic, United States
Copyright © 2021 Prasad, Sheng, Hu, Chauhan and Lokensgard. This is an open-access article distributed under the terms of the Creative Commons Attribution License (CC BY). The use, distribution or reproduction in other forums is permitted, provided the original author(s) and the copyright owner(s) are credited and that the original publication in this journal is cited, in accordance with accepted academic practice. No use, distribution or reproduction is permitted which does not comply with these terms.
*Correspondence: James R. Lokensgard, bG9rZW4wMDZAdW1uLmVkdQ==