 Rosie Owens1†
 Kathleen Grabert1†
 Claire L. Davies1Alessio Alfieri1Jack P. Antel2
 Luke M. Healy2
 Barry W. McColl1*
- 1The Royal (Dick) School of Veterinary Studies, University of Edinburgh, Midlothian, UK
- 2Neuroimmunology Unit, Montreal Neurological Institute, McGill University, Montreal, QC, Canada
The triggering receptor expressed on myeloid cells (TREM) family of proteins are cell surface receptors with important roles in regulation of myeloid cell inflammatory activity. In the central nervous system, TREM2 is implicated in further roles in microglial homeostasis, neuroinflammation and neurodegeneration. Different TREM receptors appear to have contrasting roles in controlling myeloid immune activity therefore the relative and co-ordinated regulation of their expression is important to understand but is currently poorly understood. We sought to determine how microglial TREM expression is affected under neuroinflammatory conditions in vitro and in vivo. Our data show that microglial Trem1 and Trem2 gene expression are regulated in an opposing manner by lipopolysaccharide (LPS) in vitro in both adult murine and human microglia. LPS caused a significant induction of Trem1 and a contrasting suppression of Trem2 expression. We also observed similar divergent Trem1 and Trem2 responses in vivo in response to acute brain inflammation and acute cerebral ischaemia. Our data show that inhibition of NF-κB activation prevents the LPS-induced alterations in both Trem1 and Trem2 expression in vitro indicating NF-κB as a common signaling intermediate controlling these divergent responses. Distinct patterns of microglial Trem1 induction and Trem2 suppression to different Toll-like receptor (TLR) ligands were also evident, notably with Trem1 induction restricted to those ligands activating TLRs signaling via TRIF. Our data show co-ordinated but divergent regulation of microglial TREM receptor expression with a central role for NF-κB. Neuroinflammatory conditions that alter the balance in TREM expression could therefore be an important influence on microglial inflammatory and homeostatic activity with implications for neuroinflammatory and neurodegenerative disease.
Introduction
The triggering receptor expressed on myeloid cells (TREM) family of proteins comprises a group of cell surface innate immune receptors of the immunoglobulin superfamily that are expressed on various myeloid cell populations throughout the body, including microglia in the brain (Colonna, 2003; Colonna and Wang, 2016). The TREM gene cluster, located on human chromosome 6 and mouse chromosome 17, includes genes encoding TREM1 and TREM2 (human and mouse), and TREM3 (mouse only). The TREM-like genes, Treml1 and Treml2 which encode the proteins TREM-like transcript-1 (TLT-1) and TLT-2 also form part of this cluster. TREM proteins are structurally related, containing a single extracellular variable-type immunoglobulin domain and a transmembrane domain incorporating a charged lysine residue enabling association with the adaptor protein DAP12 that is obligatory for signal transduction (Klesney-Tait et al., 2006). Growing evidence supports a role for TREMs in the regulation of innate immune responses in various tissues, including the CNS (Sharif and Knapp, 2008). Moreover, despite sharing the requirement for signaling through DAP12 and its ITAM motif, it is becoming clear that TREM1 and TREM2 can have contrasting effects on immune regulation (Sharif and Knapp, 2008). Whereas TREM1, largely studied outside the CNS, has been shown to amplify inflammation in a number of models (Bouchon et al., 2000, 2001; Netea et al., 2006; Hommes et al., 2014, 2015), TREM2 appears to restrain myeloid cell responses to various inflammatory stimuli (Hamerman et al., 2006; Turnbull et al., 2006; Ito and Hamerman, 2012). Accordingly, the balance in signaling through these receptors is likely important for influencing the strength of innate immune activity.
The importance of TREM function in the CNS was first highlighted by the discovery of Nasu-Hakola disease, also known as Polycystic Lipomembranous Osteodysplasia with Sclerosing Leukoencephalopathy (PLOSL) (Hakola, 1972; Nasu et al., 1973). This is a fatal presenile dementia, also presenting with bone pathology, caused by homozygous loss of function mutations in TREM2 (or DAP12) affecting the microglial and ostecoclast myeloid lineages (Paloneva et al., 2000, 2001, 2002). Recent studies have also revealed that homozygous TREM2 mutations cause a frontotemporal dementia-like syndrome in the absence of bone pathology (Giraldo et al., 2013; Guerreiro et al., 2013a; Le Ber et al., 2014). Moreover, TREM2 mutations are associated with an increased risk of developing Alzheimer's disease (Guerreiro et al., 2013b; Jonsson et al., 2013), frontotemporal dementia (Thelen et al., 2014) and amyotrophic lateral sclerosis (Cady et al., 2014). Studies using animal models of neurodegeneration have also suggested disease-modifying effects of TREM2 (Piccio et al., 2007; Jiang et al., 2014; Jay et al., 2015; Wang et al., 2015). Mechanisms underlying TREM2-linked neurodegeneration are unclear but may involve impaired intracellular trafficking of TREM2 and deficiencies in microglial phagocytosis, reactivity and neuro-immune regulation (Colonna and Wang, 2016).
Regulation of TREM gene and protein expression will influence the extent and balance of signaling through these receptors and may be important for their effects on inflammation and disease. Elevated TREM2 gene or protein expression has been reported in animal models of chronic neurodegeneration (Jay et al., 2015; Wang et al., 2015) and in human post-mortem AD tissue (Lue et al., 2015), although the extent to which this simply reflects the marked proliferation of microglia that occurs in these conditions is unknown. In contrast, there is negligible data on TREM1 expression in the CNS. TREM1 is expressed on myeloid cells outside the brain including neutrophils, monocytes, macrophages and dendritic cells (Sharif and Knapp, 2008). Stimulation of macrophages with Toll-like receptor (TLR) ligands caused contrasting changes in TREM1 (increased) (Bouchon et al., 2001; Murakami et al., 2007; Zeng et al., 2007) and TREM2 (decreased) (Turnbull et al., 2006) expression. However, the coordinated regulation of TREM1 and TREM2 expression in microglia under neuroinflammatory conditions has not been studied previously. Furthermore, although signaling pathways triggered by TREM1 or TREM2 receptor binding have been described (Arts et al., 2013; Colonna and Wang, 2016), the intracellular mediators influencing transcriptional regulation of TREM genes are not well understood, particularly in microglia.
In the present study, we sought to determine the comparative regulation of TREM receptor expression in response to microglial activation and the signaling mechanisms involved. We show that microglial TREM1 and TREM2 expression is regulated in an opposing manner in vitro and in vivo and that NF-κB activation is a common intermediate governing this divergent regulation.
Materials and Methods
Mining of Microarray Datasets for Trem Analysis
To assess microglial Trem family expression at baseline in the adult mouse brain, we mined expression data for selected genes from microarray datasets we generated previously from purified microglia or mixed cell brain homogenates (Grabert et al., 2016). Datasets are publicly accessible at the NCBI gene Expression Omnibus (GEO) with accession code GSE62420 (http://www.ncbi.nlm.nih.gov/geo/GSE62420).
Mice
Male 8–12 week old mice (C57BL/6J, Charles River Laboratories) were used in all experiments. Mice were maintained under specific pathogen-free conditions and a standard 12 h light/ dark cycle with unrestricted access to food and water. Mice were housed in individually ventilated cages in groups of up to five mice and were acclimatized for a minimum of 1 week prior to procedures. All procedures involving live animals were carried out under the authority of a UK Home Office Project License in accordance with the “Animals (Scientific Procedures) Act 1986” and Directive 2010/63/EU and were approved by The Roslin Institute's Animal Welfare and Ethics Committee.
Adult Mouse Microglial Isolation and Culture
Microglia were isolated and cultured as described previously (Grabert et al., 2016). Briefly, mice were perfused transcardially with saline and the brain finely minced by scalpel blade in ice-cold Hanks Balanced Salt Solution HBSS (Sigma-Aldrich), centrifuged (400 g, 5 min, 4°C) resuspended and incubated for 1 h at 37°C in digestion cocktail (50 U/ml collagenase, 8.5 U/ml dispase, 100 ug/ml Nα-Tosyl-L-lysine chloromethyl ketone hydrochloride, 5 U/ml DNaseI in HBSS). Tissue was dissociated using a Dounce homogeniser and the enzymatic reaction terminated by addition of equal volume HBSS containing 10% fetal bovine serum. Homogenates were centrifuged (400 g, 5 min, 4°C) and pellets resuspended in 35% Percoll (GE Healthcare, Sweden), overlaid with HBSS then centrifuged (800 g, 45 min, 4°C). The cell pellet enriched with microglia was resuspended in separation buffer (0.5% bovine serum albumin, 2 mM EDTA in PBS). The cell suspension was incubated with anti-CD11b microbeads (Miltenyi Biotec, UK) for 15 min at 4°C then applied to a magnetic LS column (Miltenyi Biotec) and cells retained on the column (microglia) were flushed. The microglial suspension was centrifuged (400 g, 5 min, 4°C) and resuspended in DMEM/F12 (Invitrogen) containing 10% FBS and 1% penicillin/streptomycin. Cells were seeded in wells pre-coated with poly-L-lysine at a density of 2 × 10⁵ cells/ml and cultured at 37°C in a humidified incubator under 5% CO2. Media was replaced after 48 h in culture and cell stimulations performed after 72 h in culture by which time cells developed a more ramified morphology characteristic of microglia. Cells were stimulated for 24 h with LPS (1 μg/ml), IL-4 (20 ng/ml) or DPBS.
BV2 Microglia Culture
Although there are limitations of using any cell line, the utility of immortalized BV2 microglia as a suitable substitute for primary microglia has been shown (Henn et al., 2009). BV2 cells were cultured in DMEM (Invitrogen) supplemented with 5% fetal bovine serum and 1% penicillin/streptomycin at 37°C in a humidified incubator under 5% CO2. Cells were seeded at a density of 2.5 × 10⁵ cells/ml 24 h before stimulations at which point cells were >90% confluent. Prior to stimulation, cells were washed twice with DPBS (Invitrogen) and cultured in serum-free DMEM for at least 1 h. Cells were stimulated for 24 h with one of the following: LPS (E. coli 0127:B8 1 μg/ml; Sigma-Aldrich); recombinant mouse IL-4 (20 ng/ml; R&D Systems); Pam3CSK4 (5 μg/ml; Invivogen); polyinosinic-polycytidylic acid (poly(I:C)) (50 μg/ml; Sigma-Aldrich); CpG oligodeoxynucleotides (CpG ODN) (1 μM; Enzo Life Sciences); or DPBS. In certain experiments, cells were pre-incubated with inhibitors (Merck Millipore) of IκB kinase (BMS-345541, 1 or 10 μM), PI3 kinase (LY294002, 10 μM), ERK1/2 kinase (MEK1/2) (PD98059, 10 μM), p38 MAP kinase (SB203580, 10 μM), c-Jun N-terminal kinase (SP600125, 20 μM) or equivalent volume of DMSO for 30 min prior to LPS stimulation.
Human Microglial Isolation and Culture
Human microglia were isolated from adult brain tissue using previously described protocols (Durafourt et al., 2013) under ethical approval by the McGill University Health Center Research Ethics Board (protocol ANTJ2001/1). Briefly, normal appearing cortical tissue was resected from pharmacologically intractable non-malignant cases of temporal lobe epilepsy. Tissue was cleaned extensively and mechanically dissociated. A single cell suspension was generated following gentle enzymatic digestion using trypsin and DNAse prior to passing through a nylon mesh filter. Single cell suspension underwent a Ficoll ultracentrifugation step to remove myelin. Dissociated cells were centrifuged, counted, and plated at 2 × 10⁶ cells/mL in MEM supplemented with 5% FBS, 0.1% penicillin/streptomycin and 0.1% glutamine. Microglia were grown for 3 days, collected and plated at 1 × 10⁵ cells/mL and maintained in culture for 6 d during which time cells were left untreated or stimulated. Cells were treated with IFN-γ (20 ng/ml) for 1 h followed by a 48 h treatment with LPS (E coli 0127:B8, 100 ng/ml) or with IL-4 (20 ng/ml) and IL-13 (20 ng/ml) together for 48 h.
Human Microglial Gene Expression Analysis
Microglia gene expression profiles was measured using a Human Gene ST 2.0 Microarray Chip (Affymetrix). Raw intensity data files were normalized using the Robust Multichip Average (RMA) algorithm, averaged with Tukey's bi-weight average algorithm, and transformed to the log2 scale using the Affymetrix Expression Console. Data was exported from Expression Console into Affymetrix Transcriptome Analysis Console (TAC) software. GraphPad Prism 5 was used to perform statistical analyses (ANOVA and Bonferroni's multiple comparison Test) and plot individual gene expression. Data are expressed as Tukey's bi-weight average ± SD. The dataset is publicly accessible in NCBI's GEO with accession number GSE76737 (https://www.ncbi.nlm.nih.gov/geo/GSE76737).
Intracerebral Inflammation Model
Mice were positioned in a stereotaxic frame (Stoelting, USA) under isoflurane anesthesia (with 0.2 L/min O2 and 0.5 L/min N2O). The skull was exposed via a midline incision and a small craniotomy was made overlying the left hemisphere 2 mm lateral to Bregma using an Ideal micro drill (tip diameter 0.8 mm) (Stoelting). Stereotaxic injections were performed using pre-calibrated glass microcapillary pipettes (Drummond Scientific, USA), previously pulled using a vertical electrode puller (Model PP830, Japan). Co-ordinates for intrastriatal injection were 2 mm lateral to Bregma (left hemisphere) and 2.5 mm below the brain surface (Franklin and Paxinos, 2007). One microliter LPS (E. coli 0127:B8, 5 mg/ml) or PBS was injected at a rate of 0.5 μL/min. The wound was sutured and topical local anaesthetic (EMLA lidocaine/prilocaine) applied. Mice were recovered for 24 h.
Middle Cerebral Artery Occlusion Experimental Stroke Model
Middle cerebral artery occlusion (MCAO) was performed under isoflurane anesthesia (with 0.2 L/min O2 and 0.5 L/min N2O) by insertion of a 6-0 nylon monofilament with a 2 mm coated tip (210 μm diameter; Doccol, USA) through the external carotid artery and advanced through the internal carotid artery to occlude the middle cerebral artery (MCA). The filament was withdrawn after 40 min to allow reperfusion, the neck wound sutured and the animals recovered. Topical local anaesthetic (EMLA lidocaine/prilocaine) was applied to the wound. For sham surgery, the filament was advanced to the MCA and immediately retracted. Sham-operated animals remained anaesthetized for 40 min and recovered as above. Core body temperature was maintained at 37 ± 0.5°C throughout the procedure with a feedback controlled heating blanket (Harvard Apparatus, UK). Mice were recovered for 24 h.
Brain Cell Suspension Preparation
24 h after intracerebral LPS injection or MCAO, mice were perfused transcardially under isoflurane anesthesia as above with DEPC-treated (0.1%) saline to remove blood and the hemisphere ipsilateral to intracerebral injection or MCAO was dissected. Brain cell suspensions were prepared as above for microglial isolation except after Percoll centrifugation cell pellets were resuspended in FACS buffer for immediate flow cytometry staining or in RNAprotect Cell Reagent (Qiagen) for storage at −80°C.
RNA Extraction and cDNA Synthesis
For RNA extractions from BV2 cells and isolated adult mouse microglia, media was removed and cells incubated with Trizol for 2 min at room temperature and mixed by pipetting then incubated for a further 5 min. For brain cell suspensions prepared after intracerebral inflammation and stored in RNAprotect Cell Reagent (Qiagen), cell suspensions were thawed and centrifuged (5,000 g, 5 min, 4°C). The supernatant was discarded and the cell pellet incubated with Trizol as above. Lysates were incubated with 1-bromo-3-chloropropane (BCP) for 2 min and centrifuged (12,000 g, 5 min, 4°C) then the upper aqueous phase was removed and the previous step repeated. The aqueous phase was then incubated with 1 μl co-precipitant linear acrylamide and 250 μl isopropanol before centrifugation (12,000 g, 10 min, 4°C). The supernatant was removed and the RNA pellet washed in 75% ethanol. The RNA suspension was then centrifuged (7,500 g, 5 min, 4°C), air-dried and resuspended in DNase/RNase-free water. For brain homogenates prepared after MCAO, RNA was extracted using the RNEasy Mini Kit (Qiagen) according to manufacturer's instructions. DNase treatment of all RNA samples was performed using the DNA-free kit (Ambion) according to manufacturer's instructions. Concentration of RNA samples was determined by Nanodrop 1000 (Thermo Fisher Scientific) measurement. cDNA was synthesized from DNase-treated RNA samples using Superscript III Reverse Transcriptase (Life Technologies) according to manufacturer's instructions.
Quantitative PCR
Primers were designed using Primer BLAST (http://www.ncbi.nlm.nih.gov/tools/primer-blast/) and validated to ensure adequate efficiencies. Primer sequences were as follows: Arg1 forward 5′-GGAGACCACAGTCTGGCAGTTGGA-3′; Arg1 reverse 5′-GGACACAGGTTGCCCATGCAGA-3′; Gapdh forward 5′-TGCATCCACTGGTGCTGCCAA-3′; Gapdh reverse 5′-ACTTGGCAGGTTTCTCCAGGCG-3′; Nos2 forward 5′-GGAGACCACAGTCTGGCAGTTGGA-3′; Nos2 reverse 5′-AGGTCGATGCACAACTGGGTGAAC-3′; Trem1 forward CTGGTGGTGACCAAGGGTTC; Trem1 reverse CTTGGGTAGGGATCGGGTTG; Trem2 forward 5′-CTGCTGATCACAGCCCTGTCCCAA-3′; Trem2 reverse 5′-CCCCCAGTGCTTCAAGGCGTCATA-3′; Gapdh was used as the housekeeping gene. cDNA was mixed with forward and reverse primers, ROX reference dye and Platinum SYBR Green qPCR Supermix-UDG in DNase/RNase-free water and qPCR cycles performed on a Stratagene Mx3005P thermocycler (Agilent) as follows: hot-start denaturation cycle 95°C for 10 min, 40 cycles of amplification at 95°C for 15 s, 60°C for 20 s and 72°C for 1 min, followed by one cycle of 95°C for 1 min, 55°C for 30 s and 95°C for 30 s. Cycle threshold (Ct) values of target genes were normalized to Gapdh and data are expressed as fold change relative to control group using the 2∧ΔΔCt method.
Flow Cytometry
Media was removed from cultured BV2 cells and cells washed with DPBS then detached by incubation with trypsin for 30 s at 37°C. DMEM was added to neutralize trypsin and samples were centrifuged (400 g, 5 min) then pellets resuspended in FACS buffer (DPBS containing 0.1% low endotoxin BSA). Cell suspensions were added to a 96-well plate and low affinity Fc receptors blocked by incubation of cells with anti-CD16/32 antibody for 30 min. Plates were centrifuged (400 g, 5 min), supernatants discarded and cell pellets disrupted by gentle agitation of plates. Cells were incubated with the following fluorochrome-conjugated rat monoclonal antibodies for 30 min: anti-mouse F4/80-PerCP (clone BM8, 1 μg/ml, BioLegend); anti-mouse/human CD11b-APC-Cy7 (clone M1/70, 1 μg/ml, BioLegend); anti-mouse TREM2-FITC (clone 78.18, 1 μg/ml, Abd Serotec); anti-mouse TREM1-Alexa Fluor 647 (clone L5-B8.2A12.3A12, 5 μg/ml, Abd Serotec). Plates were centrifuged (400 g, 5 min), supernatants discarded and cells resuspended in FACS buffer. For flow cytometric analysis after MCAO, brain cell suspensions were added to a 96-well plate and stained with anti-mouse CD45-PE-Cy (clone 30-F11, 1 μg/ml, BioLegend), anti-mouse Ly6C-PerCP-Cy5.5 (clone HK1.4, 1 μg/ml, BioLegend) and anti-mouse TREM1-Alexa Fluor 647 (clone L5-B8.2A12.3A12, 5 μg/ml, Abd Serotec) following the above procedure. Data were acquired using a LSR Fortessa (BD Biosciences) and analyzed using Summit (Dako) or FlowJo software. Compensation was performed using single-labeled samples as references and positive regions of staining were defined based on unstained and/or isotype-stained controls.
Experimental Design and Statistical Analysis
Data from BV2 and adult mouse microglial are representative of at least three independent experiments each containing a minimum of triplicate technical replicates. Data from MCAO (n = 6 mice per group) and intracerebral inflammation models (n = 6 mice per group) are from a single experiment containing independent biological replicates (i.e., mice). One sample t-test was used to assess effects of microglial stimulation, MCAO or intracerebral inflammation on Trem1 and Trem2 expression by qPCR using the reference value of 1 for the PBS or sham control groups. One-way ANOVA with Bonferroni correction was used to assess effects of microglial stimulation on TREM2 protein expression by flow cytometry. Effects of IKK inhibition on Trem1 and Trem2 expression were assessed using one-way ANOVA with Dunnett's correction (LPS + DMSO as reference group). Effects of MCAO on microglial TREM1 expression after MCAO measured by flow cytometry were assessed using unpaired Student's t-test. Analysis was performed blinded to experimental treatment. Data were analyzed using GraphPad Prism and show mean ± SEM unless stated otherwise. P ≤ 0.05 was considered statistically significant.
Results
Steady-State Microglial Trem family Expression
To gain an initial understanding of steady-state microglial expression of Trem family members we first examined the pattern of gene expression in purified adult mouse microglia. Trem2 expression was abundant in microglia from all forebrain regions examined and at markedly greater levels than Trem1 and Trem3, both of which were expressed at negligible levels (Figure 1A). Comparison to established genes highly expressed in microglia (e.g., Csf1r, Cx3cr1, Itgam, Tmem119) gave an indication of the extent of microglial Trem2 expression levels (Figure 1B). To assess if microglia are the predominant cellular source of Trem2 expression in the brain, we compared expression in purified microglia and mixed brain cell lysates. Expression was substantially enriched in purified microglia and negligible expression was observed in mixed cell lysates (Figure 1C) thus showing that microglia are the predominant source of Trem2 expression in the steady-state young adult brain. There is no functional ortholog of Trem3 in humans where it is a pseudogene (TREM3 has similar actions to TREM1 in mice; Chung et al., 2002; Colonna, 2003) therefore we limited analysis in the remainder of the study to Trem1 and Trem2.
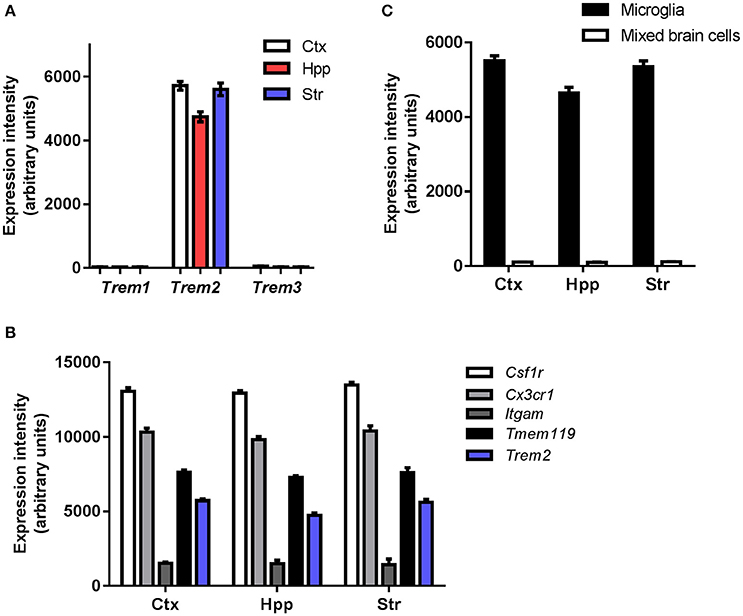
Figure 1. Steady-state expression of Trem family genes in microglia. (A) Microarray expression intensities of Trem family genes in freshly isolated adult murine microglia extracted from different forebrain regions. (B) Microarray expression intensities of Trem2 in isolated microglia and mixed cell brain homogenates from different forebrain regions. (C) Microarray expression intensities of Trem2 relative to other established genes highly expressed in microglia. Microarray data were re-analyzed from publicly available datasets (GSE62420) we generated previously (Grabert et al., 2016). Ctx, cerebral cortex; Hpp, hippocampus; Str, striatum.
Polarization of Mouse and Human Microglia Differentially Regulates Trem Expression
Next we examined the effect of in vitro activation of purified adult microglia on Trem expression. We chose lipopolysaccharide (LPS) and interleukin (IL)-4 as stimuli to induce contrasting states of activation. Marked induction of Nos2 expression in response to LPS and Arg1 expression in response to IL-4 validated that purified adult microglia could be polarized in the expected manner (Figure 2A). Trem1 expression was significantly increased (~10-fold) in response to LPS but was unaffected by IL-4 stimulation (Figure 2A). In contrast, Trem2 expression was suppressed by ~90% in response to LPS stimulation. Similarly to Trem1 expression, Trem2 was unaffected by IL-4 stimulation (Figure 2A). A similar pattern of responses of Trem1 and Trem2 to LPS and IL-4 stimulation were observed in the murine BV2 microglial cell line (Figure 2B), although we note the generally more responsive nature of the isolated adult microglia. These data indicate opposing regulation of Trem1 and Trem2 genes by LPS-induced microglial activation and more generally that the conditions under which microglia become activated differentially affect Trem responses.
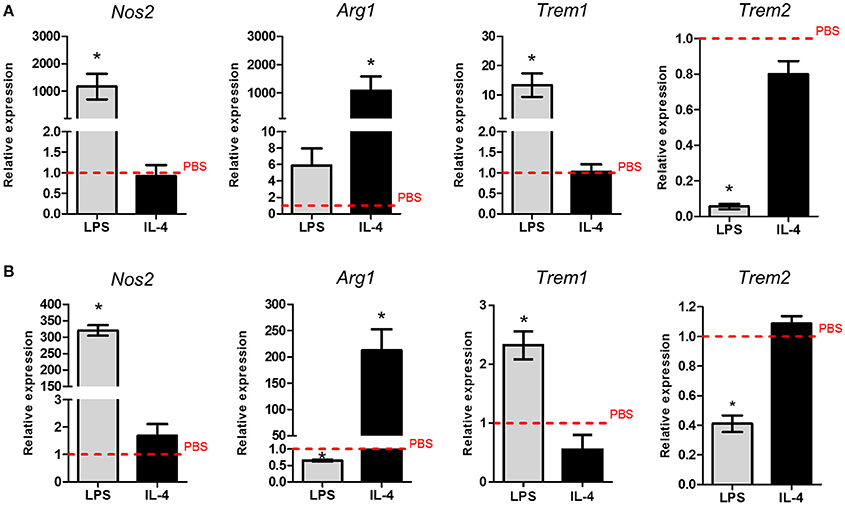
Figure 2. Effects of polarized activation of murine microglia on Trem1 and Trem2 expression. (A) Microglia were extracted from the adult mouse brain then cultured and stimulated for 24 h with lipopolysaccharide (LPS) or (IL-4) and gene expression measured by qPCR. (B) BV2 microglia were cultured and stimulated for 24 h with LPS or IL-4 and gene expression measured by qPCR. Data show mean ± SEM and are representative of three independent cultures each performed in triplicate. Data are expressed as fold-change in expression vs. PBS treatment (dashed red line). *P < 0.05, one-sample t-test. LPS, lipopolysaccharide; IL-4, interleukin-4.
We next tested if the pattern of TREM regulation was also observed in freshly isolated adult human microglia. Human microglia were activated using comparable stimulation protocols to mouse microglia that were previously validated (Durafourt et al., 2013). As in mouse microglia, we found that TREM1 expression was significantly increased and TREM2 expression significantly decreased in response to combined stimulation with LPS and interferon-γ (IFNγ) whereas there were no changes in response to combined IL-4 and IL-13 stimulation (Figures 3A,B).
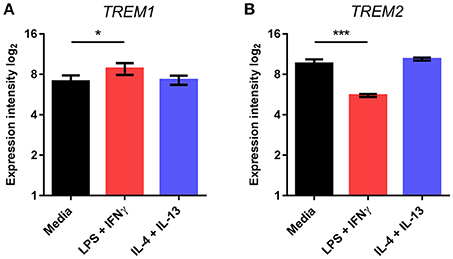
Figure 3. Effects of polarized activation of human microglia on Trem1 and Trem2 expression. Microglia were extracted from resected human brain samples then cultured and stimulated for 48 h with lipopolysaccharide (LPS) and interferon-γ in combination or interleukin-4 (IL-4) and IL-13 in combination. Expression of (A) TREM1 and (B) TREM2 were measured by microarray. Data are displayed as log2 values and show mean ± SD. *P < 0.05, ***P < 0.001 one-way ANOVA with Dunnett's correction. LPS, lipopolysaccharide; IFNγ, interferon-γ; IL-13, interleukin-13; IL-4, interleukin-4.
Differential Effects of Microglial Polarization on TREM2 Protein Expression
Given the marked suppression of Trem2 gene expression by LPS stimulation, we assessed if this effect extended to altered protein expression. Previous studies have shown that TREM2 protein is predominantly localized within intracellular vesicles of non-activated microglial cell lines (Sessa et al., 2004; Prada et al., 2006). Consistent with these data, using flow cytometry staining of non-permeabilised cells we found that only a small proportion (3–6%) of freshly isolated adult mouse microglia (Figure 4A) or cultured BV2 cells (Figure 4B) stained positively for TREM2. Stimulation with LPS or IL-4 increased the intensity of surface F4/80 expression (Figure 4B) confirming cells were activated as expected. LPS stimulation caused a significant reduction in the proportion of surface TREM2+ microglia whereas expression was unaffected in response to IL-4 (Figure 4C). Thus, the differential effects of microglial polarization on Trem2 gene expression are also evident at the protein level.
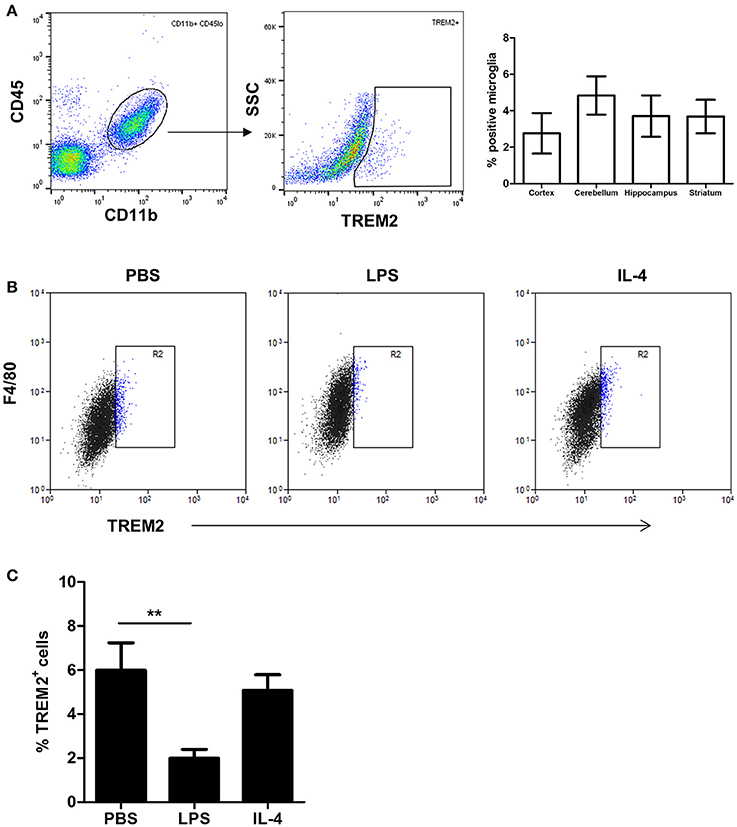
Figure 4. Effects of polarized activation of murine microglia on TREM2 protein expression. (A) Microglia were identified as CD11b+CD45lo cells from murine brain cell suspensions prepared from different brain regions and surface TREM2 expression measured by flow cytometry. Data show proportion of microglia positive for TREM2 immunolabeling. (B) BV2 cells were stimulated with LPS or IL-4 for 24 h and cell surface TREM2 and F4/80 expression measured by flow cytometry. Plots are representative of four independent cultures. (C) Quantification of cell surface TREM2 expression in BV2 cells stimulated with LPS or IL-4 for 24 h by flow cytometry. Data show mean ± SEM and are representative of four independent cultures each performed in triplicate. **P < 0.01 one-way ANOVA with Dunnett's correction. LPS, lipopolysaccharide; IL-4, interleukin-4.
NF-κB Is a Common Mediator of Divergent Microglial Trem1 and Trem2 expression
We next explored the intracellular signaling mechanisms mediating the effect of LPS-induced microglial activation on Trem2 expression. In view of the comparable responses of BV2 cells to freshly isolated adult human and mouse microglia observed above and the difficulties in acquiring large yields of fresh cells we limited the following experiments to BV2 cells. We focused on key components of the TLR signaling cascade activated in response to LPS stimulation. Initial screening using selective inhibitors of p38 MAPK, ERK1/2 kinase (MEK1/2), JNK, and PI3 kinase showed no impact on LPS-induced Trem2 alterations (Figure 5A). In contrast, inhibition of the NF-κB pathway using the highly selective IKK inhibitor BMS-345541 (Burke et al., 2003) markedly attenuated the LPS-stimulated suppression of Trem2 (Figure 5A). We found that LPS stimulation suppressed Trem2 expression at 24 h and at 6 h but not 2 h after stimulation (Figure 5B). There was a concentration-dependent attenuation of the suppressive effects of LPS stimulation on Trem2 expression at 6 h and 24 h with the higher concentration (10 μM) of BMS-345541 restoring expression to near baseline levels. We also determined if there was an important contribution of the NF-κB pathway to microglial Trem1 regulation. IKK inhibition blocked the LPS-induced increase in Trem1 expression 2 h after stimulation in a concentration-dependent manner and this effect was sustained to 6 and 24 h after LPS stimulation (Figure 5C). At 2 and 6 h, the high concentration (10 μM) of BMS-345541 almost completely inhibited the induction of Trem1. We also observed a potent concentration-dependent effect of IKK inhibition on blocking LPS-induced Nos2 expression (Figure 5D). These data show that the NF-kB pathway is a common regulatory mechanism underlying the divergent effects of microglial activation on Trem1 and Trem2 expression.
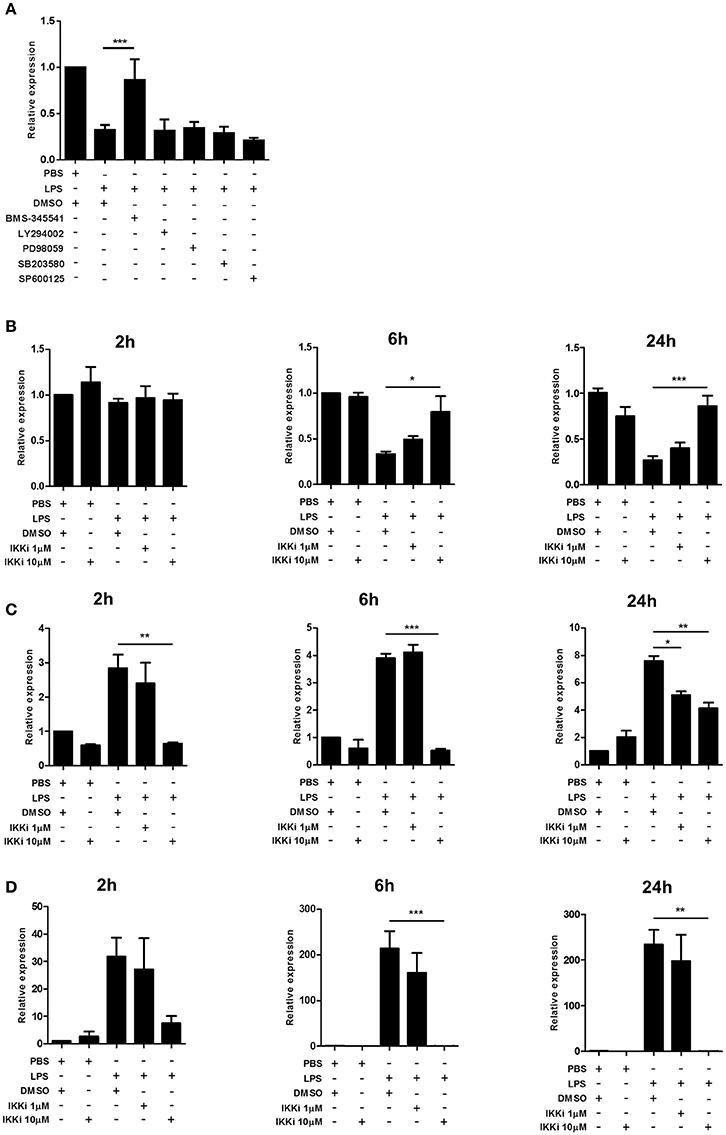
Figure 5. Effects of NF-κB inhibition on Trem1 and Trem2 expression in activated murine microglia. (A) BV2 cells were stimulated with LPS for 24 h with or without co-incubation with inhibitors of IκB kinase (BMS-345541), PI3 kinase (LY294002), ERK1/2 kinase (MEK1/2) (PD98059), p38 MAP kinase (SB203580), or c-Jun N-terminal kinase (SP600125) and expression of Trem2 measured by qPCR. (B-D) BV2 cells were stimulated for indicated duration with LPS with or without co-incubation with the IkB kinase inhibitor (IKKi) BMS-345541 and (B) Trem2, (C) Trem1, and (D) Nos2 measured by qPCR. Data show mean ± SEM and are representative of two (A) or four (B–D) independent cultures each performed in triplicate. Data are expressed as fold-change in expression vs. PBS treatment. *P < 0.05, **P < 0.01, ***P < 0.001 one-way ANOVA with Dunnett's correction. LPS, lipopolysaccharide; IKKi, IκB kinase inhibitor.
Microglial Trem1 and Trem2 Regulation Have Contrasting TLR Sensitivity Profiles
LPS triggers intracellular signaling in microglia through binding to the TLR4 receptor. We next determined if Trem expression was affected in a similar manner when other TLRs were engaged. Pam3CSK, poly (I:C), LPS, and CpG oligodeoxynucleotide (CpG ODN) were used to stimulate TLR2/1, TLR3, TLR4, or TLR9 respectively. Induction of Nos2 by all ligands confirmed biological activity and responsiveness of microglia to each stimulus (Figure 6A). Trem2 expression was significantly suppressed by all TLR ligands although the magnitude varied (Figure 6B). Expression of Trem2 was reduced to the greatest extent by LPS (~80%) and weakest suppression occurred in response to poly (I:C) (~35%) with intermediate effects induced by Pam3CSK and CpG ODN. In contrast to the largely consistent suppression of Trem2 expression by activation of different TLRs, Trem1 expression was affected in a TLR-specific manner. LPS, as observed above, and poly (I:C) both induced a significant increase in Trem1 expression whereas there was no effect of Pam3CSK or CpG ODN (Figure 6C). These data show differences in the regulation of Trem1 and Trem2 dependent on the specific TLR engaged and suggestive of differences in the involvement of signaling intermediates upstream of NF-κB (see Discussion).
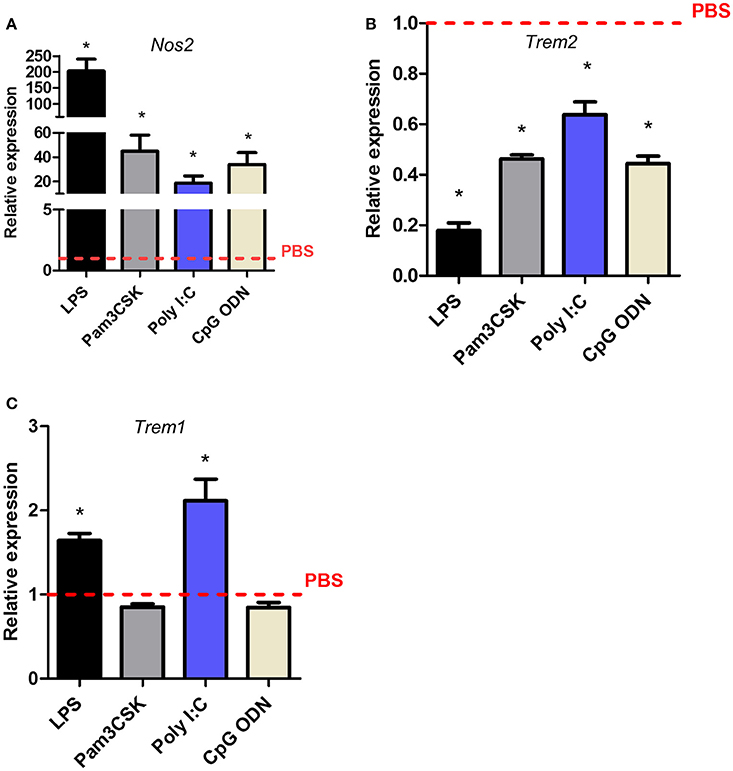
Figure 6. Effects of Toll-like receptor subtype stimulation on Trem1 and Trem2 expression in murine microglia. BV2 cells were stimulated with indicated ligands for 24 h and expression of (A) Nos2, (B) Trem2, and (C) Trem1 measured by qPCR. Data show mean ± SEM and are representative of four independent cultures each performed in triplicate. Data are expressed as fold-change in expression vs. PBS treatment (dashed red line). *P < 0.05, one-sample t-test. LPS, lipopolysaccharide; poly I:C, polyinosinic-polycytidylic acid, CpG ODN, CpG oligodeoxynucleotide.
Acute Brain Inflammation Induces Divergent Changes in Trem Expression In vivo
To test if the divergent regulation of Trem expression described above in vitro was also evident in vivo, we used two models of acute brain inflammation. First, the expression of Trem1 and Trem2 was determined in brain cell extracts 24 h after intracerebral LPS injection in mice, a model that induces a localized intense inflammatory reaction. LPS induced a significant increase in Trem1 expression and a contrasting suppression of Trem2 expression (Figure 7A) thus matching the profile observed in vitro. Our data on Trem2 expression are consistent with a previous study reporting suppressed Trem2 in response to intraperitoneal LPS injection (Zheng et al., 2016). These changes in expression of Trems occurred alongside marked induction of both Nos2 and Arg1 (Figure 7A). We also determined the effects of acute focal transient cerebral ischaemia induced by MCAO, a model causing a prominent inflammatory response and microglial reactivity. Trem1 expression was markedly increased and Trem2 expression significantly suppressed in ipsilateral brain homogenates 24 h after induction of MCAO (Figure 7B). In addition to microglial reactivity, bone marrow-derived myeloid cells, which can express Trem1, infiltrate the brain after acute cerebral ischaemia. Therefore, to assess induction specifically in microglia in this model, we used flow cytometry to selectively identify microglia using their characteristic CD11b+CD45loLy6C− expression profile and measured TREM1 expression intensity on this population (Figure 7C). Expression of TREM1 was significantly increased on microglia in MCAO compared to sham-operated mice confirming induction of microglial TREM1 in vivo.
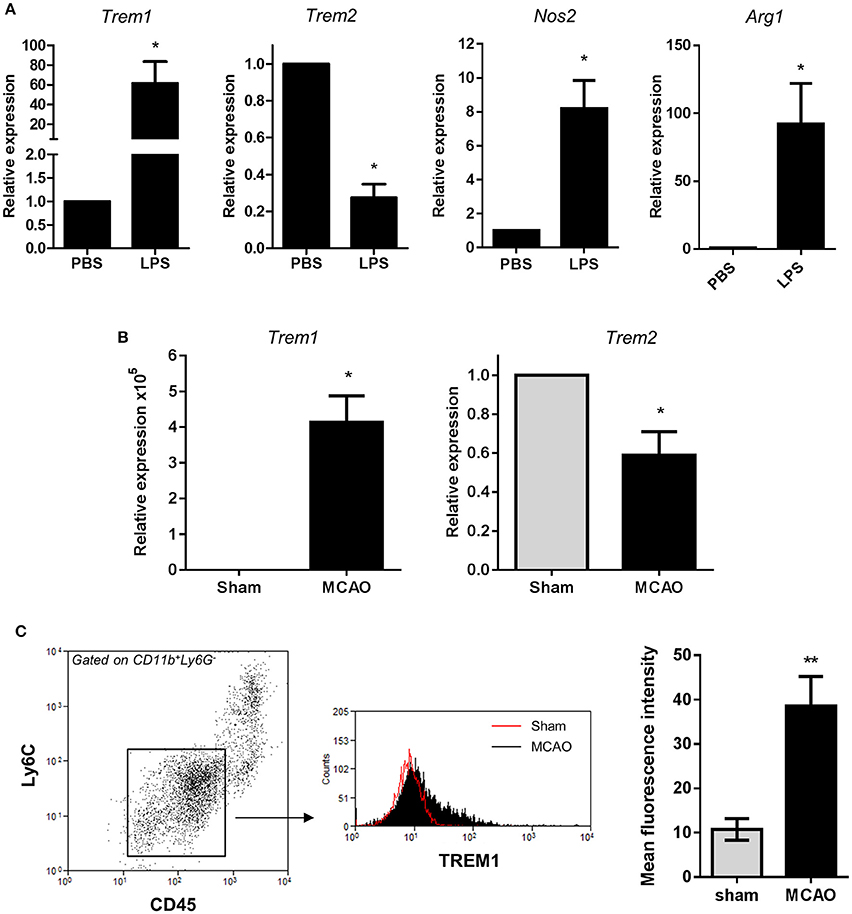
Figure 7. Trem1 and Trem2 expression in vivo in response to acute cerebral inflammatory challenges. (A) Mice were challenged with LPS by intracerebral injection and expression of indicated genes measured in brain cell suspensions 24 h after challenge by qPCR. Data are expressed as fold-change in expression vs. PBS treatment. Data show mean ± SEM. *P < 0.05, one-sample t-test, n = 6 per group (B) Transient focal cerebral ischaemia was induced in mice by middle cerebral artery occlusion (MCAO) and Trem1 and Trem2 expression measured in brain homogenates ipsilateral to occlusion 24 h after MCAO. Data are expressed as fold-change in expression vs. PBS treatment. Data show mean ± SEM. *P < 0.05, one-sample t-test, n = 6 per group (C) Brain cell suspensions were prepared 24 h after MCAO and microglia identified by CD11b+CD45loLy6G−Ly6C− expression. TREM1 cell surface expression was measured on microglia by flow cytometry. Flow cytometry plots are representative of six independent samples. Data show mean ± SEM. **P < 0.01, Student's t-test, n = 6 per group.
Discussion
Our findings in the present study provide new insight to the regulation of TREM family expression in microglia. Key findings include (1) the divergent regulation of the major TREM family receptors, TREM1 and TREM2, under neuroinflammatory conditions in vitro and in vivo, (2) the common role for NF-κB in controlling the divergent responses, and (3) that in the context of TLR stimulation, the regulatory profile varies according to TLR isoform.
We found marked differences in microglial gene expression of the different Trem receptors in the steady-state mouse brain. Expression of Trem2 was abundant (as indicated relative to established highly expressed microglial genes) in all forebrain regions examined in contrast to Trem1 and Trem3. This pattern may reflect the involvement of TREM2 in homeostatic microglial function such that expression and signaling through the TREM2 pathway are important constitutively for normal microglial function. Indeed, the discovery of mutations in TREM2 that impair basic microglial physiological activities such as phagocytosis support the critical role for TREM2 for homeostatic function (Takahashi et al., 2005; Kleinberger et al., 2014). In contrast, TREM1 and TREM3 (mouse only), may play more prominent roles when induced under inflammatory conditions as amplifiers of cytokine responses (Sharif and Knapp, 2008) therefore negligible expression in steady-state microglia is consistent with their quiescent inflammatory phenotype. Our data showed that Trem2 expression was highly enriched in purified microglia compared to brain homogenates which supports microglia as the predominant and possibly sole cellular source of Trem2 in the CNS. Although previous studies have shown immunoreactivity for TREM2 protein on other cells (Giuseppina et al., 2004; Guerreiro et al., 2013b) it is possible this could reflect detection of the soluble ectodomain fragment bound to ligand.
The expression profiles of both Trem1 and Trem2 in response to stimulation were similar in all in vitro systems used and showed marked alterations to LPS but not IL-4 (with or without IL-13) stimulation. IL-4, a key mediator of alternative activation, caused marked induction of the archetypal marker Arg1 indicating cells were generally responsive to IL-4. A previous study showed induction of TREM2 protein by IL-4 stimulation in peritoneal macrophages (Turnbull et al., 2006) suggesting that there could be differences in TREM2 regulation in microglia and macrophages. Nonetheless, we also do not exclude that IL-4 in combination with other ligands in vitro or in vivo might drive TREM2 expression. The contrasting induction of Trem1 and suppression of Trem2 in response to LPS challenge was striking and is comparable with the profiles described in myeloid cells outside the brain, including macrophages and dendritic cells (Bouchon et al., 2000; Turnbull et al., 2006; Ito and Hamerman, 2012). We also observed similar expression responses in two in vivo models of CNS inflammation, intracerebral LPS injection and focal cerebral ischaemia induced by MCAO. The comparable in vivo responses to LPS challenge and MCAO are interesting but not surprising given that sterile inflammation induced by ischaemic hypoxia and cell death trigger the release of damage-associated molecular patterns (DAMPs) or “alarmins” that activate similar receptors to microbial-derived ligands, including TLRs (Rock et al., 2010). TREM1 amplifies TLR-induced cytokine responses and its expression is induced in response to a number of infectious stimuli (Bouchon et al., 2001; Netea et al., 2006; Ornatowska et al., 2007; Hommes et al., 2014). In contrast, TREM2 deficiency in macrophages caused aggravated cytokine responses (Hamerman et al., 2006; Turnbull et al., 2006). Thus, the responses of Trem1 and Trem2 we show in vitro and in vivo highlight the possibility of co-ordinated but divergent regulation of their expression as a potent mechanism to tune the strength of microglial inflammatory responses. Moreover, the potent suppression of Trem2 suggests certain acute inflammatory or injurious conditions in the CNS could impair TREM2-dependent microglial physiological functions. We restricted our analysis to <48 h after challenge, thus the extent to which changes we report are sustained or reversible are unknown (our unpublished data suggests normalization of expression does occur for both Trem1 and Trem2 several days later).
The signaling mechanisms underlying the regulation of microglial TREM expression and whether these mechansims share common elements is not well understood. Here we show that NF-κB is a common transcriptional regulator involved in LPS-induced microglial alterations to both Trem1 and Trem2 supporting the co-ordinated nature of their divergent responses. Consistent with this effect on Trem1 expression, the Trem1 promoter contains consensus binding sites for NF-κB among other inflammation-induced transcription factors and in macrophages NF-κB was shown to bind to the Trem1 promoter (Zeng et al., 2007). The rapid and potent induction of Trem1 we observed after LPS challenge or ischaemia is consistent with the well-established and rapid activation of NF-κB that can occur within 5 min of stimulation (Lei et al., 2014). In contrast, the Trem2 promoter does not contain NF-κB consensus sites and given the normal role of NF-κB is to increase the rate of transcription it is unlikely a direct interaction between NF-κB and Trem2 mediates the suppressive effects of LPS or cerebral ischaemia. A possible mechanism could be through NF-κB-induced micro RNAs (miRNAs) that can negatively regulate gene expression through binding the 3′ untranslated region (UTR) of target genes and inducing mRNA degradation or inhibiting translation (Valencia-Sanchez et al., 2006). Recent studies have identified miRNA-34a as an NF-κB-inducible miRNA upregulated in the diseased brain and this induction correlated with suppressed TREM2 expression (Alexandrov et al., 2013; Zhao et al., 2013). Further work showed that miRNA-34a could interact directly with the 3' UTR of the TREM2 mRNA (Bhattacharjee et al., 2016). We noted that the induction of Trem1 in vitro occurred as early as 2 h after LPS stimulation whereas the suppression of Trem2 was not observed until 6 h. These kinetics are consistent with a rapid and direct transcriptional regulation of Trem1 and a suppressive mechanism on Trem2 involving an intermediate such as a miRNA and subsequent mRNA degradation. Our data demonstrating the non-uniform effects of stimulating different TLR subtypes on microglial Trem1 and Trem2 provides further insight to their regulation. Of particular note is that Trem1 was induced only by ligands (LPS and poly I:C) that activate TLRs capable of signaling via the MYD88-independent TRIF module (i.e., TLR3 and TLR4) (O'Neill et al., 2013). In contrast, Trem2 was suppressed by ligands activating all TLRs we tested including those that can signal via MYD88 only (TLR2/1, TLR9), MYD88 and TRIF (TLR4) or TRIF only (TLR3) although suppressive effects were weakest for TLR3. Both the MYD88 and TRIF pathways can activate NF-κB thus in agreement with the common effects of NF-κB pathway inhibition we found. However, the TLR sensitivity profiles suggest possible differences for Trem1 and Trem2 regulation in signaling upstream of NF-κB. Induction of Trem1 appears to be dependent on the MYD88-independent TRIF pathway whereas suppression of Trem2 could involve either MYD88 or TRIF modules, although further work targeting individual subcomponents of TLR signaling is needed to definitively assess this. Given the interest in immunomodulatory therapeutics targeting TLR signaling (Parker et al., 2005), it may be important to consider that effects on relative Trem1 and Trem2 expression could be variable depending on the specific elements of TLR signaling targeted.
TREM2 mutations have been associated with several neurodegenerative diseases (Colonna and Wang, 2016) and TREM1 variants with cognitive decline and Alzheimer-related amyloid pathology (Replogle et al., 2015). Most, although not all, TREM2 mutations appear to be loss-of-function raising the possibility of augmenting activity in the TREM2 pathway (e.g., via synthetic ligands or activating antibodies) as a potential therapeutic strategy in certain circumstances. Indeed, lentiviral overexpression of TREM2 reduced pathology and improved cognitive performance in a mouse model of AD-like amyloidosis (Jiang et al., 2014). However, the efficacy of pharmacological approaches may depend on the availability of the transmembrane receptor, which will be influenced by transcriptional regulation among other factors. Although our present study was limited to acute neuroinflammatory conditions, our data nonetheless highlight the importance of understanding how the more chronic neuroinflammatory environment in the aging and degenerating brain might influence TREM expression. It is pertinent to note that TREM2 expression was reduced in hippocampus from AD patients compared to controls (Zhao et al., 2013), although increased TREM2 expression has also been shown in AD-like mouse models and models of demyelinating disease (Piccio et al., 2007; Cantoni et al., 2015; Jay et al., 2015; Wang et al., 2015). Thus, a clearer understanding of how TREM expression is regulated in age-related neurological disease will be needed to guide how best to apply TREM-targeted interventions.
Author Contributions
BM conceived study; BM, RO, KG, CD, AA designed and performed mouse studies and analyzed data; JA, LH designed and performed human studies and analyzed data; BM, LH wrote manuscript.
Funding
This work was supported by grants from MRC (MR/L003384/1) and BBSRC (BB/J004332/1) and PhD scholarships from the Darwin Trust of Edinburgh (KG) and BBSRC (CD). The Roslin Institute and Edinburgh Genomics are partly supported through core grants from NERC (R8/H10/56), MRC (MR/K001744/1) and BBSRC (BB/J004243/1, BB/J004332/1).
Conflict of Interest Statement
The authors declare that the research was conducted in the absence of any commercial or financial relationships that could be construed as a potential conflict of interest.
Acknowledgments
We thank staff in The Roslin Institute Biological Research Facility for animal husbandry and technical assistance and Anna Raper for assistance with flow cytometry. We also thank patients and their families for donation of brain samples.
References
Alexandrov, P. N., Zhao, Y., Jones, B. M., Bhattacharjee, S., and Lukiw, W. J. (2013). Expression of the phagocytosis-essential protein TREM2 is down-regulated by an aluminum-induced miRNA-34a in a murine microglial cell line. J. Inorg. Biochem. 128, 267–269. doi: 10.1016/j.jinorgbio.2013.05.010
Arts, R. J. W., Joosten, L. A., van der Meer, J. W., and Netea, M. G. (2013). TREM-1: intracellular signaling pathways and interaction with pattern recognition receptors. J. Leukoc. Biol. 93, 209–215. doi: 10.1189/jlb.0312145
Bhattacharjee, S., Zhao, Y., Dua, P., Rogaev, E. I., and Lukiw, W. J. (2016). microRNA-34a-mediated down-regulation of the microglial-enriched triggering receptor and phagocytosis-sensor TREM2 in age-related macular degeneration. PLoS ONE 11:e0150211. doi: 10.1371/journal.pone.0150211
Bouchon, A., Dietrich, J., and Colonna, M. (2000). Cutting edge: inflammatory responses can be triggered by TREM-1, a novel receptor expressed on neutrophils and monocytes. J. Immunol. 164, 4991–4995. doi: 10.4049/jimmunol.164.10.4991
Bouchon, A., Facchetti, F., Weigand, M. A., and Colonna, M. (2001). TREM-1 amplifies inflammation and is a crucial mediator of septic shock. Nature 410, 1103–1107. doi: 10.1038/35074114
Burke, J. R., Pattoli, M. A., Gregor, K. R., Brassil, P. J., MacMaster, J. F., McIntyre, K. W., et al. (2003). BMS-345541 is a highly selective inhibitor of IκB kinase that binds at an allosteric site of the enzyme and blocks NF-κB-dependent transcription in mice. J. Biol. Chem. 278, 1450–1456. doi: 10.1074/jbc.M209677200
Cady, J., Koval, E. D., Benitez, B. A., Zaidman, C., Jockel-Balsarotti, J., Allred, P., et al. (2014). TREM2 variant p.R47H as a risk factor for sporadic amyotrophic lateral sclerosis. JAMA Neurol. 71, 449–453. doi: 10.1001/jamaneurol.2013.6237
Cantoni, C., Bollman, B., Licastro, D., Xie, M., Mikesell, R., Schmidt, R., et al. (2015). TREM2 regulates microglial cell activation in response to demyelination in vivo. Acta Neuropathol. 129, 429–447. doi: 10.1007/s00401-015-1388-1
Chung, D. H., Seaman, W. E., and Daws, M. R. (2002). Characterization of TREM-3, an activating receptor on mouse macrophages: definition of a family of single Ig domain receptors on mouse chromosome 17. Eur. J. Immunol., 32, 59–66. doi: 10.1002/1521-4141(200201)32:1<59::AID-IMMU59>3.0.CO;2-U
Colonna, M. (2003). TREMs in the immune system and beyond. Nat. Rev. Immunol. 3, 445–453. doi: 10.1038/nri1106
Colonna, M., and Wang, Y. (2016). TREM2 variants: new keys to decipher Alzheimer disease pathogenesis. Nat. Rev. Neurosci. 17, 201–207. doi: 10.1038/nrn.2016.7
Durafourt, B. A., Moore, C. S., Blain, M., and Antel, J. P. (2013). Isolating, culturing, and polarizing primary human adult and fetal microglia. Methods Mol. Biol. 1041, 199–211. doi: 10.1007/978-1-62703-520-0_19
Giraldo, M., Lopera, F., Siniard, A. L., Corneveaux, J. J., Schrauwen, I., Carvajal, J., et al. (2013). Variants in triggering receptor expressed on myeloid cells 2 are associated with both behavioral variant frontotemporal lobar degeneration and Alzheimer's disease. Neurobiol. Aging 34, 2077.e11–e18. doi: 10.1016/j.neurobiolaging.2013.02.016
Giuseppina, S., Paola, P., Margherita, M., Alessandra, M., Roberto, S., Francesco, S., et al. (2004). Distribution and signaling of TREM2/DAP12, the receptor system mutated in human polycystic lipomembraneous osteodysplasia with sclerosing leukoencephalopathy dementia. Eur. J. Neurosci. 20, 2617–2628. doi: 10.1111/j.1460-9568.2004.03729.x
Grabert, K., Michoel, T., Karavolos, M. H., Clohisey, S., Baillie, J. K., Stevens, M. P., et al. (2016). Microglial brain region-dependent diversity and selective regional sensitivities to aging. Nat. Neurosci. 19, 504–516. doi: 10.1038/nn.4222
Guerreiro, R. J., Lohmann, E., Brás, J. M., Gibbs, J. R., Rohrer, J. D., Gurunlian, N., et al. (2013a). Using exome sequencing to reveal mutations in TREM2 presenting as a frontotemporal dementia–like syndrome without bone involvement. JAMA Neurol. 70, 78–84. doi: 10.1001/jamaneurol.2013.579
Guerreiro, R., Wojtas, A., Brás, J., Carrasquillo, M., Rogaeva, E., Majounie, E., et al. (2013b). TREM2 variants in Alzheimer's disease. N. Engl. J. Med. 368, 117–127. doi: 10.1056/NEJMoa1211851
Hakola, H. P. (1972). Neuropsychiatric and genetic aspects of a new hereditary disease characterized by progressive dementia and lipomembranous polycystic osteodysplasia. Acta Psychiatr. Scand. Suppl. 232, 1–173.
Hamerman, J. A., Jarjoura, J. R., Humphrey, M. B., Nakamura, M. C., Seaman, W. E., and Lanier, L. L. (2006). Cutting edge: inhibition of TLR and FcR responses in macrophages by triggering receptor expressed on myeloid cells (TREM)-2 and DAP12. J. Immunol. 177, 2051–2055. doi: 10.4049/jimmunol.177.4.2051
Henn, A., Lund, S., Hedtjärn, M., Schrattenholz, A., Pörzgen, P., and Leist, M. (2009). The suitability of BV2 cells as alternative model system for primary microglia cultures or for animal experiments examining brain inflammation. ALTEX 26, 83–94. doi: 10.14573/altex.2009.2.83
Hommes, T. J., Dessing, M. C., Veer, C., Florquin, S., Colonna, M., de Vos, A. F., et al. (2015). Role of triggering receptor expressed on myeloid cells-1/3 in Klebsiella-derived pneumosepsis. Am. J. Respir. Cell Mol. Biol. 53, 647–655. doi: 10.1165/rcmb.2014-0485OC
Hommes, T. J., Hoogendijk, A. J., Dessing, M. C., Van't Veer, C., Florquin, S., Colonna, M., et al. (2014). Triggering receptor expressed on myeloid cells-1 (TREM-1) improves host defence in pneumococcal pneumonia. J. Pathol. 233, 357–367. doi: 10.1002/path.4361
Ito, H., and Hamerman, J. A. (2012). TREM-2, triggering receptor expressed on myeloid cell-2, negatively regulates TLR responses in dendritic cells. Eur. J. Immunol. 42, 176–185. doi: 10.1002/eji.201141679
Jay, T. R., Miller, C. M., Cheng, P. J., Graham, L. C., Bemiller, S., Broihier, M. L., et al. (2015). TREM2 deficiency eliminates TREM2+ inflammatory macrophages and ameliorates pathology in Alzheimer's disease mouse models. J. Exp. Med. 212, 287–295. doi: 10.1084/jem.20142322
Jiang, T., Tan, L., Zhu, X.-C., Zhang, Q.-Q., Cao, L., Tan, M.-S., et al. (2014). Up-regulation of TREM2 ameliorates neuropathology and rescues spatial cognitive impairment in a transgenic mouse model of Alzheimer/'s disease. Neuropsychopharmacology 39, 2949–2962. doi: 10.1038/npp.2014.164
Jonsson, T., Stefansson, H., Steinberg, S., Jonsdottir, I., Jonsson, P. V., Snaedal, J., et al. (2013). Variant of TREM2 associated with the risk of Alzheimer's disease. N. Engl. J. Med. 368, 107–116. doi: 10.1056/NEJMoa1211103
Kleinberger, G., Yamanishi, Y., Suárez-Calvet, M., Czirr, E., Lohmann, E., Cuyvers, E., et al. (2014). TREM2 mutations implicated in neurodegeneration impair cell surface transport and phagocytosis. Sci. Transl. Med. 6:243ra86. doi: 10.1126/scitranslmed.3009093
Klesney-Tait, J., Turnbull, I. R., and Colonna, M. (2006). The TREM receptor family and signal integration. Nat. Immunol. 7, 1266–1273. doi: 10.1038/ni1411
Le Ber, I., De Septenville, A., Guerreiro, R., Bras, J., Camuzat, A., Caroppo, P., et al. (2014). Homozygous TREM2 mutation in a family with atypical frontotemporal dementia. Neurobiol. Aging 35, 2419.e23-2419.e25. doi: 10.1016/j.neurobiolaging.2014.04.010
Lei, B., Mace, B., Dawson, H. N., Warner, D. S., Laskowitz, D. T., and James, M. L. (2014). Anti-inflammatory effects of progesterone in lipopolysaccharide-stimulated BV-2 microglia. PLoS ONE 9:e103969. doi: 10.1371/journal.pone.0103969
Lue, L. F., Schmitz, C. T., Serrano, G., Sue, L. I., Beach, T. G., and Walker, D. G. (2015). TREM2 protein expression changes correlate with Alzheimer's disease neurodegenerative pathologies in post-mortem temporal cortices. Brain Pathol. 25, 469–480. doi: 10.1111/bpa.12190
Murakami, Y., Kohsaka, H., Kitasato, H., and Akahoshi, T. (2007). Lipopolysaccharide-induced up-regulation of triggering receptor expressed on myeloid cells-1 expression on macrophages is regulated by endogenous prostaglandin E2. J. Immunol. 178, 1144–1150. doi: 10.4049/jimmunol.178.2.1144
Nasu, T., Tsukahara, Y., and Terayama, K. (1973). A lipid metabolic disease-“membranous lipodystrophy”-an autopsy case demonstrating numerous peculiar membrane-structures composed of compound lipid in bone and bone marrow and various adipose tissues. Acta Pathol. Jpn.,23, 539–558. doi: 10.1111/j.1440-1827.1973.tb01223.x
Netea, M. G., Azam, T., Ferwerda, G., Girardin, S. E., Kim, S. H., and Dinarello, C. A. (2006). Triggering receptor expressed on myeloid cells-1 (TREM-1) amplifies the signals induced by the NACHT-LRR (NLR) pattern recognition receptors. J. Leukoc. Biol. 80, 1454–1461. doi: 10.1189/jlb.1205758
O'Neill, L. A. J., Golenbock, D., and Bowie, A. G. (2013). The history of Toll-like receptors [mdash] redefining innate immunity. Nat. Rev. Immunol. 13, 453–460. doi: 10.1038/nri3446
Ornatowska, M., Azim, A. C., Wang, X., Christman, J. W., Xiao, L., Joo, M., et al. (2007). Functional genomics of silencing TREM-1 on TLR4 signaling in macrophages. Am. J. Physiol. Lung Cell. Mol. Physiol. 293, L1377–L1384. doi: 10.1152/ajplung.00140.2007
Paloneva, J., Autti, T., Raininko, R., Partanen, J., Salonen, O., Puranen, M., et al. (2001). CNS manifestations of Nasu-Hakola disease: a frontal dementia with bone cysts. Neurology 56, 1552–1558. doi: 10.1212/WNL.56.11.1552
Paloneva, J., Kestila, M., Wu, J., Salminen, A., Bohling, T., Ruotsalainen, V., et al. (2000). Loss-of-function mutations in TYROBP (DAP12) result in a presenile dementia with bone cysts. Nat. Genet. 25, 357–361. doi: 10.1038/77153
Paloneva, J., Manninen, T., Christman, G., Hovanes, K., Mandelin, J., Adolfsson, R., et al. (2002). Mutations in two genes encoding different subunits of a receptor signaling complex result in an identical disease phenotype. Am. J. Hum. Genet. 71, 656–662. doi: 10.1086/342259
Parker, L. C., Whyte, M. K., Dower, S. K., and Sabroe, I. (2005). The expression and roles of Toll-like receptors in the biology of the human neutrophil. J. Leukoc. Biol. 77, 886–892. doi: 10.1189/jlb.1104636
Piccio, L., Buonsanti, C., Mariani, M., Cella, M., Gilfillan, S., Cross, A. H., et al. (2007). Blockade of TREM-2 exacerbates experimental autoimmune encephalomyelitis. Eur. J. Immunol. 37, 1290–1301. doi: 10.1002/eji.200636837
Prada, I., Ongania, G. N., Buonsanti, C., Panina-Bordignon, P., and Meldolesi, J. (2006). Triggering receptor expressed in myeloid cells 2 (TREM2) trafficking in microglial cells: continuous shuttling to and from the plasma membrane regulated by cell stimulation. Neuroscience 140, 1139–1148. doi: 10.1016/j.neuroscience.2006.03.058
Replogle, J. M., Chan, G., White, C. C., Raj, T., Winn, P. A., Evans, D. A., et al. (2015). A TREM1 variant alters the accumulation of Alzheimer-related amyloid pathology. Ann. Neurol. 77, 469–477. doi: 10.1002/ana.24337
Rock, K. L., Latz, E., Ontiveros, F., and Kono, H. (2010). The Sterile Inflammatory Response. Annu. Rev. Immunol. 28, 321–342. doi: 10.1146/annurev-immunol-030409-101311
Sessa, G., Podini, P., Mariani, M., Meroni, A., Spreafico, R., Sinigaglia, F., et al. (2004). Distribution and signaling of TREM2/DAP12, the receptor system mutated in human polycystic lipomembraneous osteodysplasia with sclerosing leukoencephalopathy dementia. Eur. J. Neurosci. 20, 2617–2628. doi: 10.1111/j.1460-9568.2004.03729.x
Sharif, O., and Knapp, S. (2008). From expression to signaling: roles of TREM-1 and TREM-2 in innate immunity and bacterial infection. Immunobiology 213, 701–713. doi: 10.1016/j.imbio.2008.07.008
Takahashi, K., Rochford, C., D. P., and Neumann, H. (2005). Clearance of apoptotic neurons without inflammation by microglial triggering receptor expressed on myeloid cells-2. J. Exp. Med. 201, 647–657. doi: 10.1084/jem.20041611
Thelen, M., Razquin, C., Hernandez, I., Gorostidi, A., Sanchez-Valle, R., Ortega-Cubero, S., et al. (2014). Investigation of the role of rare TREM2 variants in frontotemporal dementia subtypes. Neurobiol. Aging 35, 2657.e13–e19. doi: 10.1016/j.neurobiolaging.2014.06.018
Turnbull, I. R., Gilfillan, S., Cella, M., Aoshi, T., Miller, M., Piccio, L., et al. (2006). Cutting edge: TREM-2 attenuates macrophage activation. J. Immunol. 177, 3520–3524. doi: 10.4049/jimmunol.177.6.3520
Valencia-Sanchez, M. A., Liu, J., Hannon, G. J., and Parker, R. (2006). Control of translation and mRNA degradation by miRNAs and siRNAs. Genes Dev. 20, 515–524. doi: 10.1101/gad.1399806
Wang, Y., Cella, M., Mallinson, K., Ulrich, J. D., Young, K. L., Robinette, M. L., et al. (2015). TREM2 lipid sensing sustains the microglial response in an Alzheimer's disease model. Cell 160, 1061–1071. doi: 10.1016/j.cell.2015.01.049
Zeng, H., Ornatowska, M., Joo, M. S., and Sadikot, R. T. (2007). TREM-1 expression in macrophages is regulated at transcriptional level by NF-κB and PU.1. Eur. J. Immunol. 37, 2300–2308. doi: 10.1002/eji.200737270
Zhao, Y., Bhattacharjee, S., Jones, B. M., Dua, P., Alexandrov, P. N., Hill, J. M., et al. (2013). Regulation of TREM2 expression by an NF-small ka, CyrillicB-sensitive miRNA-34a. Neuroreport 24, 318–323. doi: 10.1097/WNR.0b013e32835fb6b0
Zheng, H., Liu, C. C., Atagi, Y., Chen, X. F., Jia, L., Yang, L., et al. (2016). Opposing roles of the triggering receptor expressed on myeloid cells 2 and triggering receptor expressed on myeloid cells-like transcript 2 in microglia activation. Neurobiol. Aging 42, 132–141. doi: 10.1016/j.neurobiolaging.2016.03.004
Keywords: microglia, neuroinflammation, myeloid cells, NF-κB, TREM2, lipopolysaccharide (LPS), microglial activation
Citation: Owens R, Grabert K, Davies CL, Alfieri A, Antel JP, Healy LM and McColl BW (2017) Divergent Neuroinflammatory Regulation of Microglial TREM Expression and Involvement of NF-κB. Front. Cell. Neurosci. 11:56. doi: 10.3389/fncel.2017.00056
Received: 30 September 2016; Accepted: 15 February 2017;
Published: 02 March 2017.
Edited by:
Alessandro Tozzi, University of Perugia, ItalyReviewed by:
Hilary Victoria Carswell, University of Strathclyde, UKEmmanuel Pinteaux, University of Manchester, UK
Marie-Eve Tremblay, Laval University, Canada
Copyright © 2017 Owens, Grabert, Davies, Alfieri, Antel, Healy and McColl. This is an open-access article distributed under the terms of the Creative Commons Attribution License (CC BY). The use, distribution or reproduction in other forums is permitted, provided the original author(s) or licensor are credited and that the original publication in this journal is cited, in accordance with accepted academic practice. No use, distribution or reproduction is permitted which does not comply with these terms.
*Correspondence: Barry W. McColl, YmFycnkubWNjb2xsQHJvc2xpbi5lZC5hYy51aw==
†These authors have contributed equally to this work.