
95% of researchers rate our articles as excellent or good
Learn more about the work of our research integrity team to safeguard the quality of each article we publish.
Find out more
ORIGINAL RESEARCH article
Front. Cell. Infect. Microbiol. , 07 March 2025
Sec. Intestinal Microbiome
Volume 15 - 2025 | https://doi.org/10.3389/fcimb.2025.1477699
 Zhenjun Yu1,2†
 Jie Chen2†
 Mengdie Chen3†Qiaoling Pan2Yaojian Shao1,2Xiaolong Jin1,2Chaohui Wang1,2Yuetao Zhang2Gang Lin1,2*Ping Feng3*Xiaosheng Teng1,2*
Objective: Helicobacter pylori (H. pylori) represents a significant chronic health concern, affecting approximately half of the global population. While H. pylori infection has been closely linked to numerous extradigestive diseases, the relationship between H. pylori and lesions in the gallbladder and biliary tract remains under debate.
Method: We retrospectively collected data from patients who underwent H. pylori tests at the Physical Examination Center of Taizhou Central Hospital (Taizhou University Hospital) between 2018 and 2022. Logistic regression analysis and restricted cubic spline analysis were employed to investigate the correlation between parameters and H. pylori. Additionally, we utilized population data from the National Health and Nutrition Examination Survey (NHANES) database as an external validation cohort.
Results: A total of 30,612 patients were included in the training set, with 22,296 (72.8%) belonging to the H. pylori non-infection group and 8,316 (27.2%) to the H. pylori infection group. Compared to the non-infection group, patients in the infection group exhibited a significant decrease in albumin levels and a notable increase in total cholesterol and erythrocyte sedimentation rate levels. Furthermore, the infection group demonstrated significantly higher occurrences of gallbladder cholesterol crystals (6.0%), gallbladder polyps (20.2%), and atherosclerosis (25.6%) compared to the non-infection group, with respective rates of 5.1%, 19.1%, and 21.4% (average p < 0.05). However, no significant differences were observed between the two groups in terms of fatty liver, intrahepatic inflammation, gallstones, or cholecystitis. Additional regression analysis revealed that H. pylori, age, BMI, albumin, and total cholesterol were independent risk factors for the cholesterol crystals and atherosclerosis.
Conclusion: H. pylori infection is closely associated with the gallbladder cholesterol crystals and atherosclerosis, albeit not with conditions such as fatty liver, gallbladder stones, or cholecystitis. Future research necessitates multi-center, prospective studies to corroborate these findings.
Helicobacter pylori (H. pylori), a flagellated gram-negative bacterium (Sharndama and Mba, 2022), is a highly prevalent pathogen that colonizes the human stomach. According to data collected from 73 countries between January 2000 and June 2017, the infection rate of H. pylori stands at 44.3%, with a higher prevalence in developing countries compared to developed ones (50.8% vs. 34.7%) (Zamani et al., 2018). It is well-established that H. pylori infection suppresses gastric acid secretion and triggers chronic inflammation of the gastric mucosa, subsequently altering the gastric microenvironment and leading to extensive modifications in the gastric microbiota. This infection is intimately linked to various gastrointestinal diseases, including chronic gastritis, peptic ulcers, gastric polyps or atypical hyperplasia, gastric cancer, and mucosa-associated lymphoid tissue lymphoma (Makola et al., 2007). Furthermore, recent studies have revealed a strong association between H. pylori and a range of disorders beyond the digestive tract (Santos et al., 2020), encompassing diabetes mellitus (DM), non-alcoholic fatty liver disease (NAFLD), osteoporosis, Alzheimer’s disease, and autoimmune thyroid disease (Upala et al., 2016).
Multiple studies have reported an association between H. pylori and fatty liver, yet this linkage remains controversial. Amer et al (Abo-Amer et al., 2020). conducted a study on 646 patients from four university hospitals and two research centers, utilizing H. pylori antigen detection in stool samples. Their analysis revealed that H. pylori infection serves as an independent risk factor for NAFLD and exhibiting a correlation with the increasing severity of steatosis. A study conducted in China emphasized that among diabetic individuals, H. pylori infection indeed elevates the risk of NAFLD. Therefore, managing glucose and eradicating H. pylori could potentially contribute to reducing the prevalence of NAFLD (Chen et al., 2023). However, opposing viewpoints have also emerged. For instance, Liu et al. employed a bidirectional MR approach (a natural RCT) to investigate the potential link between H. pylori and NAFLD, leveraging publicly accessible large-scale GWAS data. Nevertheless, their findings did not yield a significant causal relationship (Liu et al., 2022). Additionally, there have been reports linking H. pylori to cholelithiasis, cholecystitis, and gallbladder polyps (Cen et al., 2023; Lim et al., 2023). Due to the limited availability of literature, the exact association between H. pylori and gallbladder/biliary tract pathologies remains unclear.
To further assess the association between H. pylori and hepatobiliary diseases, this study conducted retrospective cohorts, and comprehensively analyzed various laboratory indicators and a range of conditions, including fatty liver, intrahepatic inflammation, gallstones, cholecystitis, gallbladder cholesterol crystals, and gallbladder polyps.
In the training set, we gathered comprehensive data on 54,563 individuals who underwent H. pylori testing (C13/C14) at the Physical Examination Center of Taizhou Central Hospital (Taizhou University Hospital) between May 1, 2018, and December 31, 2022. This compilation encompassed information on patients’ age, gender, height, weight, blood pressure, as well as laboratory indicators, such as triglycerides (TG), total cholesterol (TC), glucose (GLU), glycosylated hemoglobin (HbA1c), albumin (ALB), creatinine (Cr), uric acid (UA), alanine aminotransferase (ALT), aspartate aminotransferase (AST), white blood cells (WBC), mean corpuscular volume (MCV), hemoglobin (Hb), platelets (PLT), and erythrocyte sedimentation rate (ESR). During screening, 233,816 patients with extensive missing data were excluded from the analysis. Furthermore, 84 patients with chronic liver disease, 30 patients with cirrhosis, and 21 patients with a history of malignant tumors were also excluded, ultimately leading to the inclusion of 30,612 patients in our analysis (Figure 1). It is noteworthy that all research procedures adhered strictly to the ethical principles outlined in the Declaration of Helsinki, and the study received approval from the ethics committees of all participating institutions.
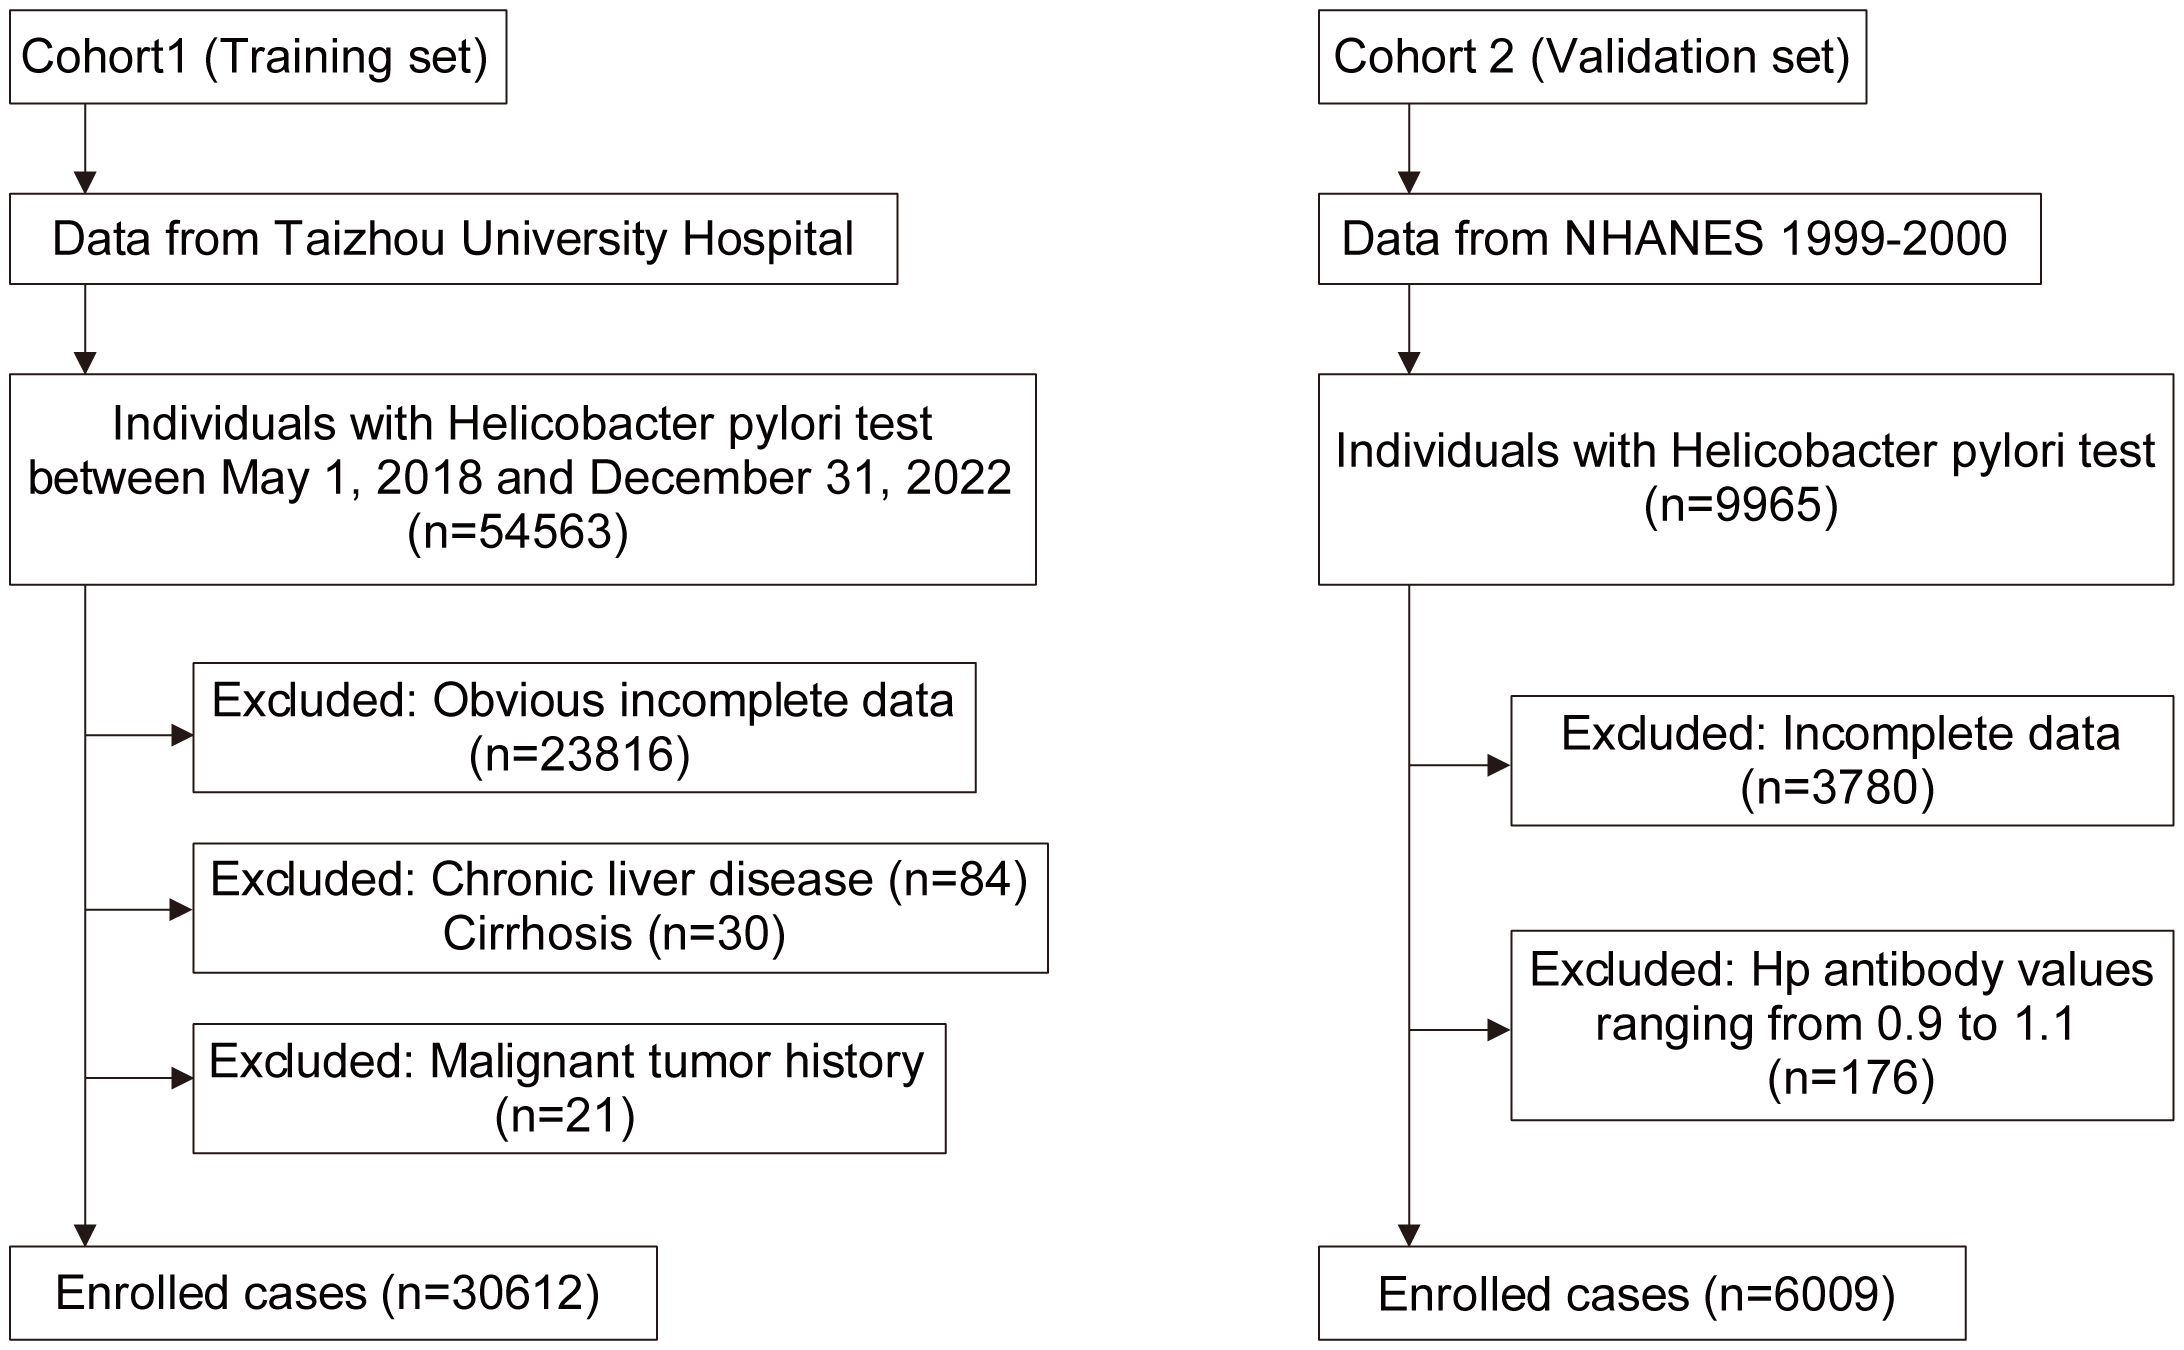
Figure 1. Flowchart of the physical examination population and NHANES population.
Obtained the patient’s age and gender, and measured their diastolic blood pressure (DBP), systolic blood pressure (SBP), height, and weight while they were in a calm and relaxed state. After an overnight fasting period of at least 8 hours, ultrasonography of the hepatobiliary system and arteries was performed, and venous blood samples were collected for laboratory parameter analysis. Additionally, a glycated hemoglobin analyzer was used to measure HbA1c levels.
H. pylori is detected through the C13 or C14 urea breath test (Fischbach and Malfertheiner, 2018). Initially, a breath sample is collected from an individual in a fasting state. Subsequently, the individual orally administers the C13 capsule and waits for 30 minutes before collecting another breath sample to complete the C13 test. Alternatively, the individual orally ingests the C14 urea capsule along with warm water, waits for 15 minutes, and then blows air evenly through the tube for 1-3 minutes. Finally, the gas collection card is inserted into the detector to finalize the C14 test.
The NHANES database (https://wwwn.cdc.gov/nchs/nhanes/) served as the validation set. NHANES, a public database, employs a cross-sectional, stratified, multistage probability design to capture a representative sample of the civilian, non-hospitalized population in the United States. Specifically, we chose the population from the 1999-2000 cycle, as it was the only cycle that included IgG results for H. pylori. Out of the total 9,965 individuals, we excluded 2,472 individuals who lacked H. pylori data and another 1,308 individuals with incomplete data. The ELISA optical density values for all subjects ranged from 0 to 5.73. Drawing from previous research criteria (Meier et al., 2020), we classified individuals with H. pylori antibody values below 0.9 as negative for H. pylori infection and those with values exceeding 1.1 as positive. Additionally, we excluded 176 individuals with the values falling within the range of 0.9 to 1.1, ultimately including a total of 6,009 individuals in our study (Figure 1).
Continuous data are reported as mean ± standard deviation, with inter-group differences evaluated using t-tests. For data that deviate from normal distribution, they are presented as median (interquartile range), and inter-group disparities are assessed via the Mann-Whitney U test. Categorical variables are reported in terms of frequency (%), and chi-square tests are employed to assess inter-group differences. Restricted cubic spline (RCS) curves are utilized to explore the nonlinear relationship. Additionally, univariate and multivariate logistic regression analyses are conducted to identify independent risk factors, and the regression equation is constructed utilizing the forward likelihood ratio. The model’s fitting effect and clinical utility are evaluated through the receiver operating characteristic curve (ROC), area under curve (AUC), calibration curve, and decision curve analysis (DCA). A two-tailed p-value <0.05 is deemed statistically significant. Statistical analysis is performed using SPSS Statistics 22.0 (IBM Corp., Armonk, New York, USA) and R (version 4.3, Statistical Computing Foundation, Vienna, Austria, https://www.R-project.org). The rms, mice, rcssci, and nhanesR packages are utilized for comprehensive statistical analysis and graphical representation.
Based on the results of the C13 or C14 tests, patients were categorized into two groups: the H. pylori infection group, consisting of 22,296 individuals (72.8%), and the H. pylori non-infection group, encompassing 8,316 individuals (27.2%). Upon examination of the compiled data, it was observed that a minimal portion of the information was missing (Supplementary Figure S1). Then the mice package was utilized to perform multiple imputation for the incomplete data points. The comparative analysis revealed that the H. pylori infection group exhibited significantly higher levels of age, weight, and BMI compared to the non-infection group (average p < 0.001). There were no significant differences in gender and height between the two groups (Table 1).
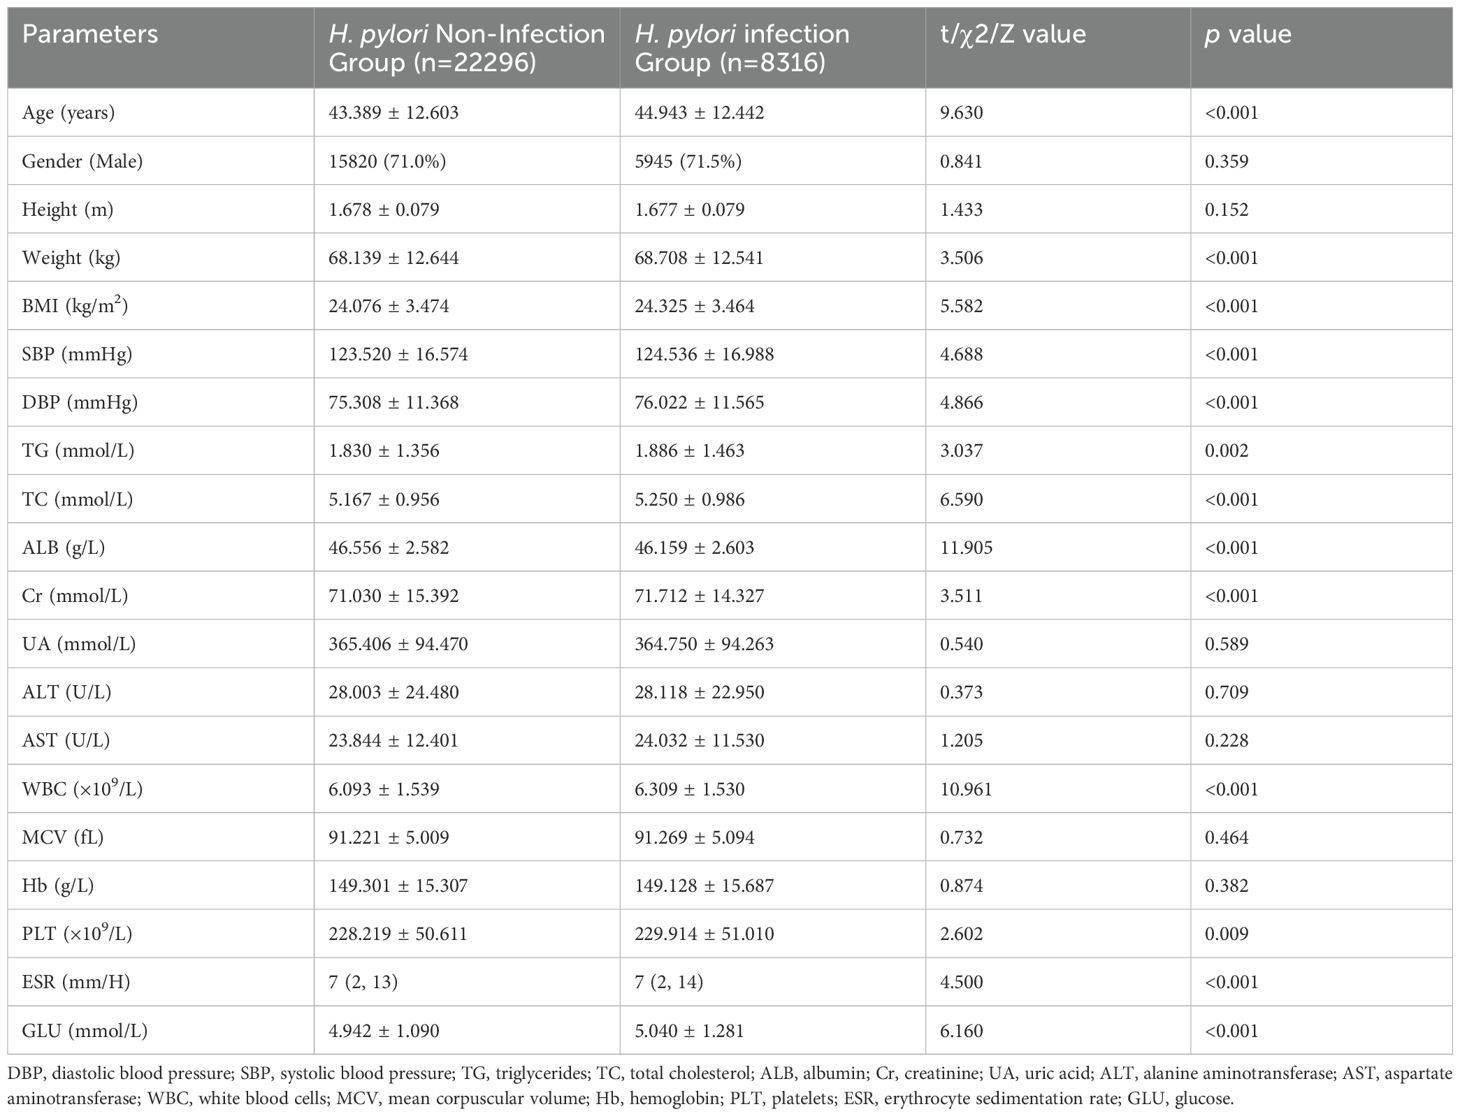
Table 1. Comparative analysis of clinical parameters in the total population: H. pylori infection group versus non-infection group.
The blood tests revealed significantly higher levels of TG, TC, Cr, Glu, WBC, and PLT in the H. pylori infection group compared to the non-infection group (average p < 0.01). On the contrary, the ALB level in the infection group was significantly lower (p < 0.01). The ESR levels did not adhere to a normal distribution, with the Mann-Whitney U test revealing a significantly elevated ESR level in the infection group (p < 0.001). However, no significant differences were observed in other laboratory parameters, including UA, ALT, and AST, between the two groups (Table 1).
The ultrasound features of coarse or dense liver echo were utilized to assess the intrahepatic inflammation, while gallbladder wall thickening or roughness were utilized to assess the cholecystitis. Further comparison revealed significantly higher occurrences of fatty liver (42.4%), gallbladder cholesterol crystals (6.0%), gallbladder polyps (20.2%), and atherosclerosis (25.6%) in the H. pylori infection group compared to the non-infection group, with respective rates of 41.1%, 5.1%, 19.1%, 21.4% (average p < 0.01). However, no significant differences were observed between the two groups in terms of other features, including intrahepatic inflammation, gallstones, cholecystitis (Table 2).
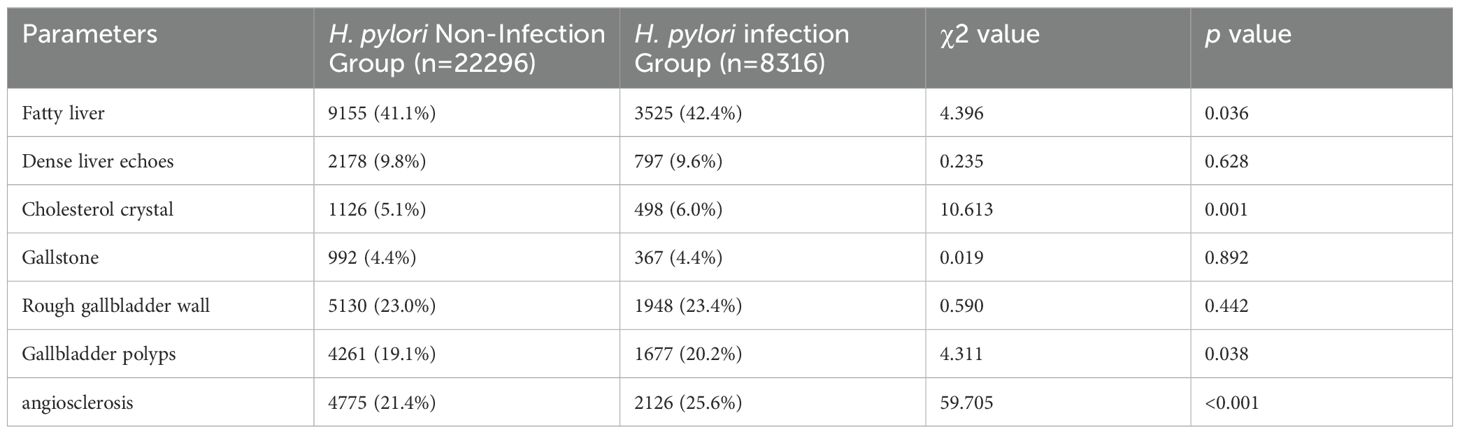
Table 2. Comparative analysis of ultrasonic features in the total population: H. pylori infection group versus non-infection group.
Logistic regression and RCS were employed to assess the association between the aforementioned parameters and H. pylori. The analysis revealed that individuals aged below 56 years exhibited an increasing risk of H. pylori infection with advancing age, whereas those over 56 years displayed a decreasing risk. Within the BMI range of 19.8-27.8, a significant elevation in the risk of H. pylori infection was observed with a rise in BMI index, whereas the risk decreased in individuals with a BMI exceeding 27.8. Notably, a significant negative correlation was observed between the ALB level and H. pylori infection, whereas the positive correlation was evident in TC. Furthermore, within the GLU range of >4.18mmol/L, a marked increase in the risk of H. pylori infection was observed with elevated glucose levels (Figure 2). These findings suggest a potential association between H. pylori infection and metabolic abnormalities such as glucose, cholesterol, and albumin. Additionally, a significant increase in the risk of H. pylori infection was observed with an elevation in ESR levels within the ESR range of <21.1 mm/H (Figure 2), indicating a potential link between H. pylori and the inflammatory state.
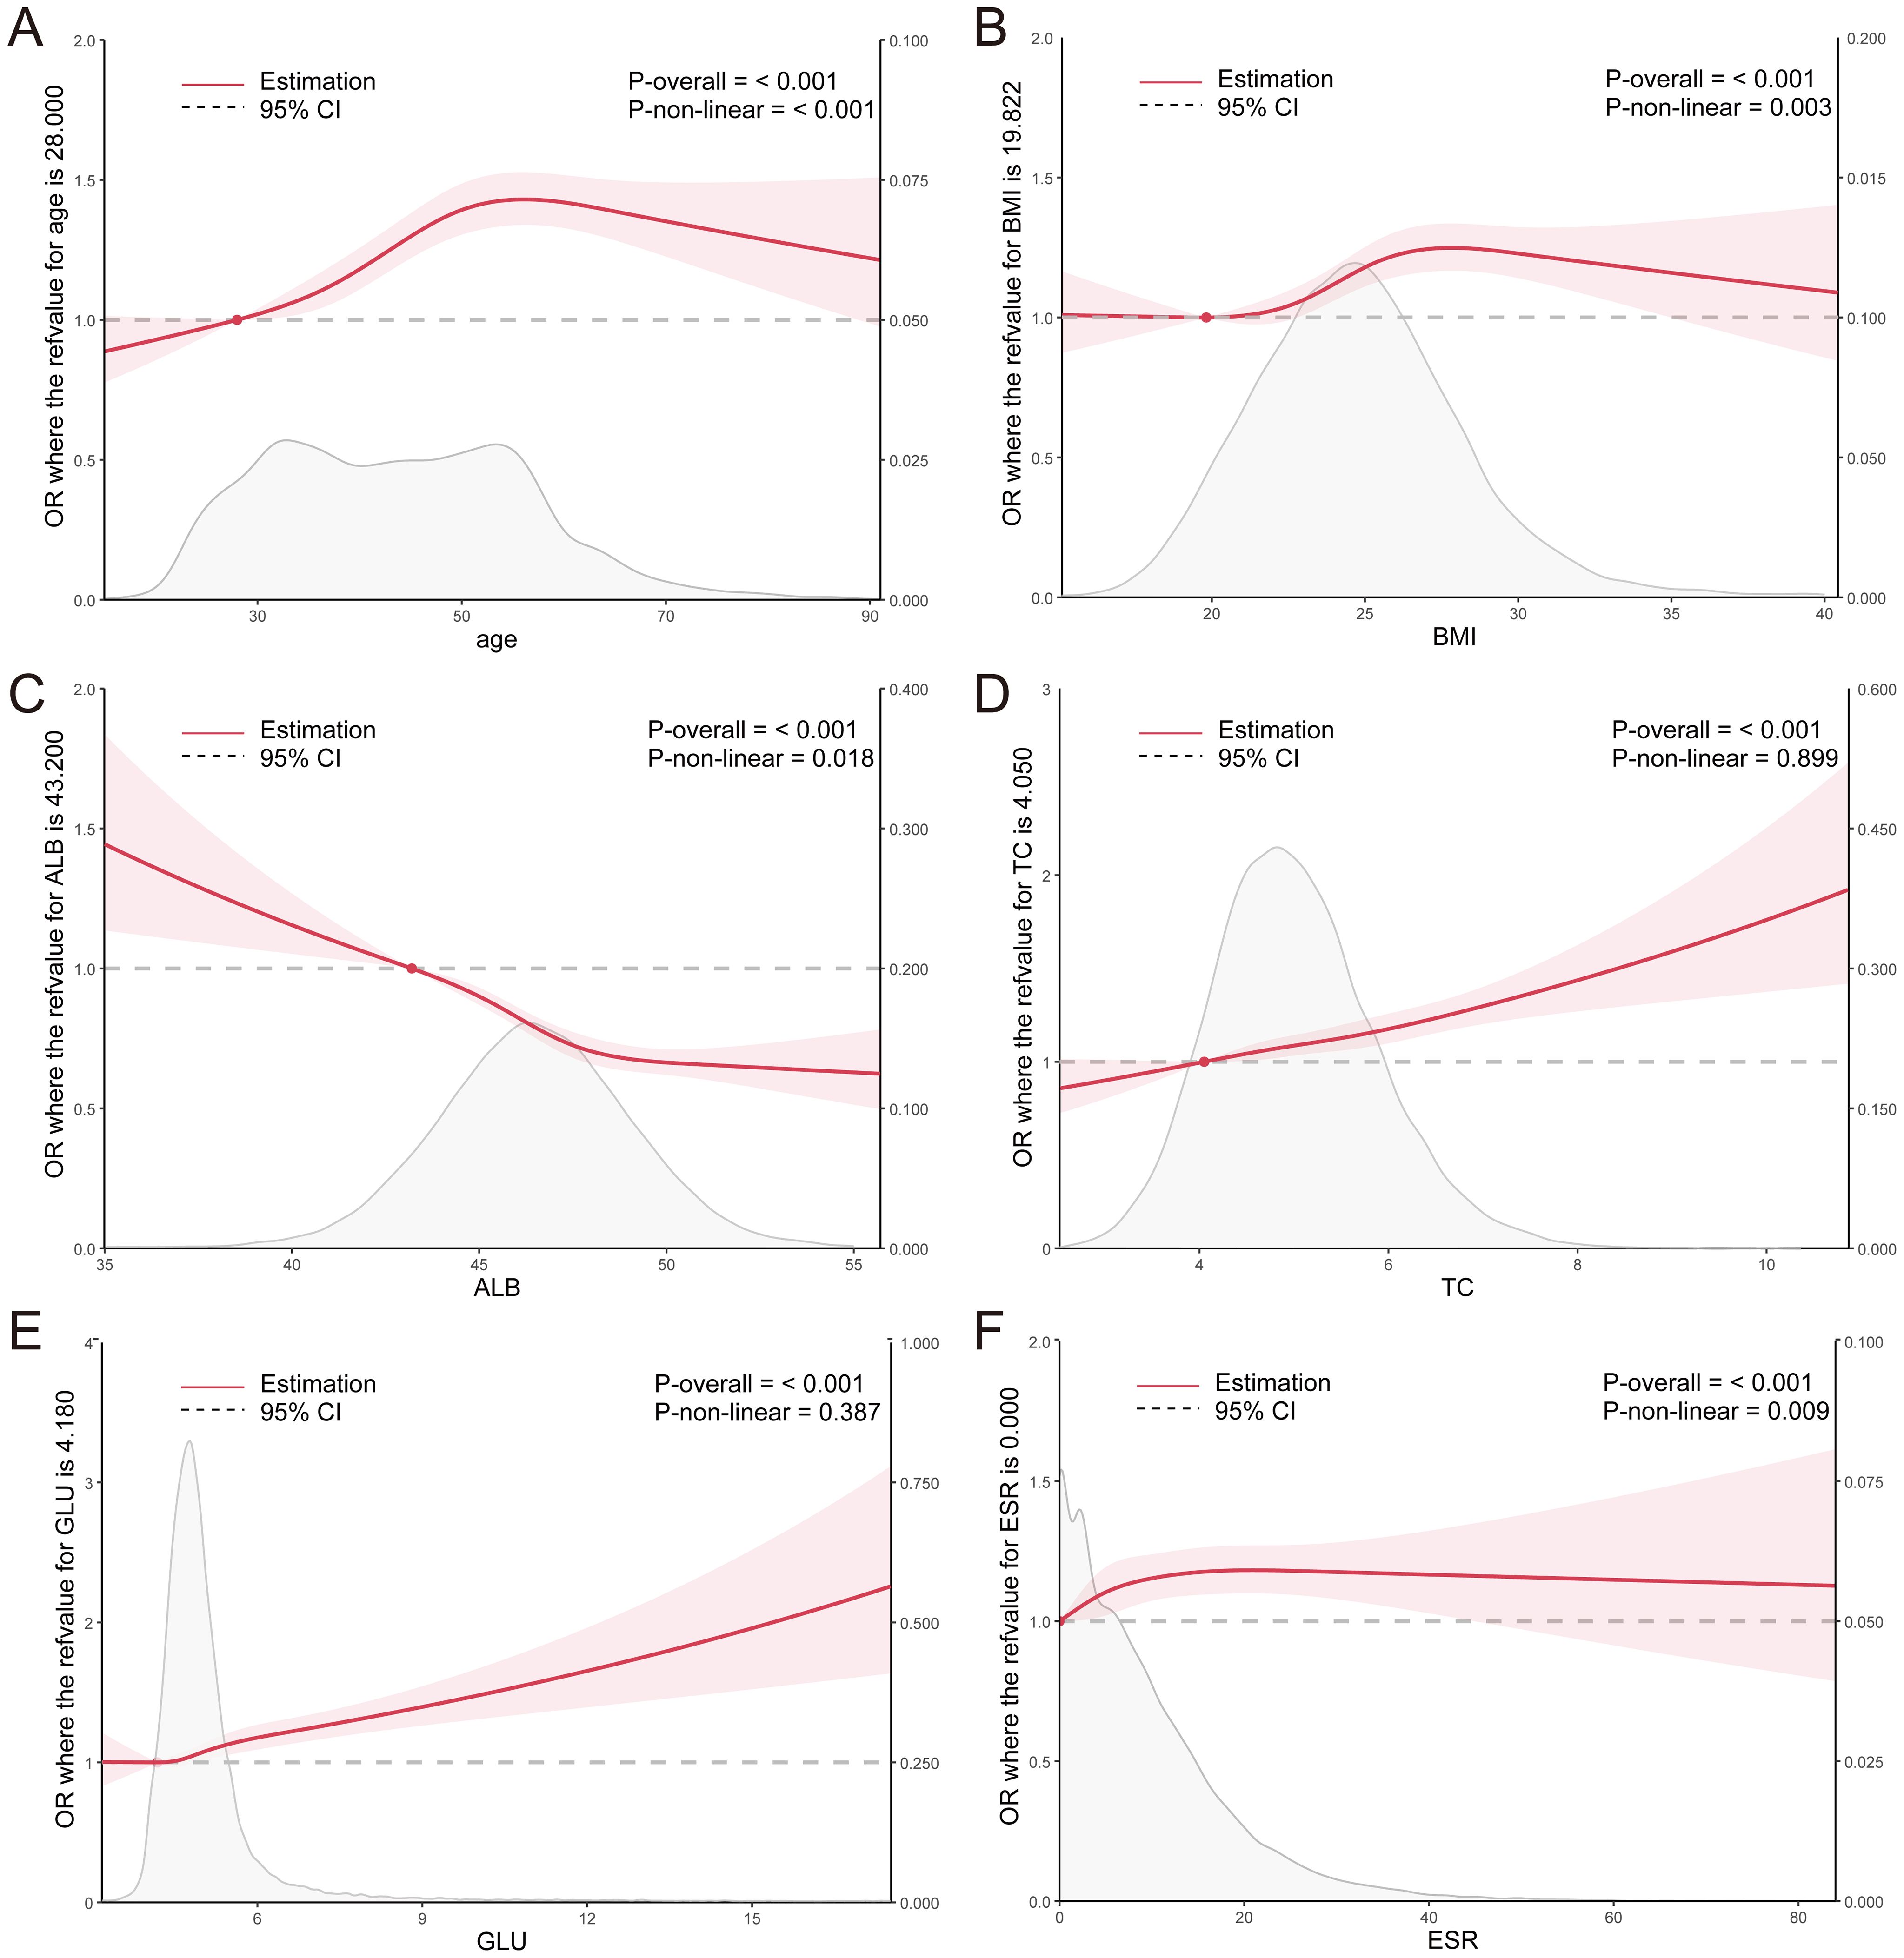
Figure 2. (A–F) RCS curves for clinical parameters and the OR value of H. pylori infection in the total population. ALB, albumin; TC, total cholesterol; GLU, glucose; ESR, erythrocyte sedimentation rate.
The association between H. pylori and metabolism may be influenced, to some extent, by abnormal glucose metabolism. Consequently, we conducted a focused analysis on the correlation between the aforementioned parameters and H. pylori in both diabetic and non-diabetic individuals. We further narrowed down our analysis to 18,887 individuals who had undergone HbA1c testing. Based on their medical histories and HbA1c tests, we identified 15,525 non-diabetic individuals and 3,362 diabetic individuals. Compared to the diabetic population, the trend of increasing risk of H. pylori infection with advancing age was more pronounced in the non-diabetic population. Similarly, the trend of elevated risk associated with decreasing ALB levels was also more evident in the non-diabetic group. More noteworthy, the significant associations between the risk of H. pylori infection and BMI, TC, and ESR were exclusively observed in non-diabetic individuals, excluding those with diabetes (Figure 3).
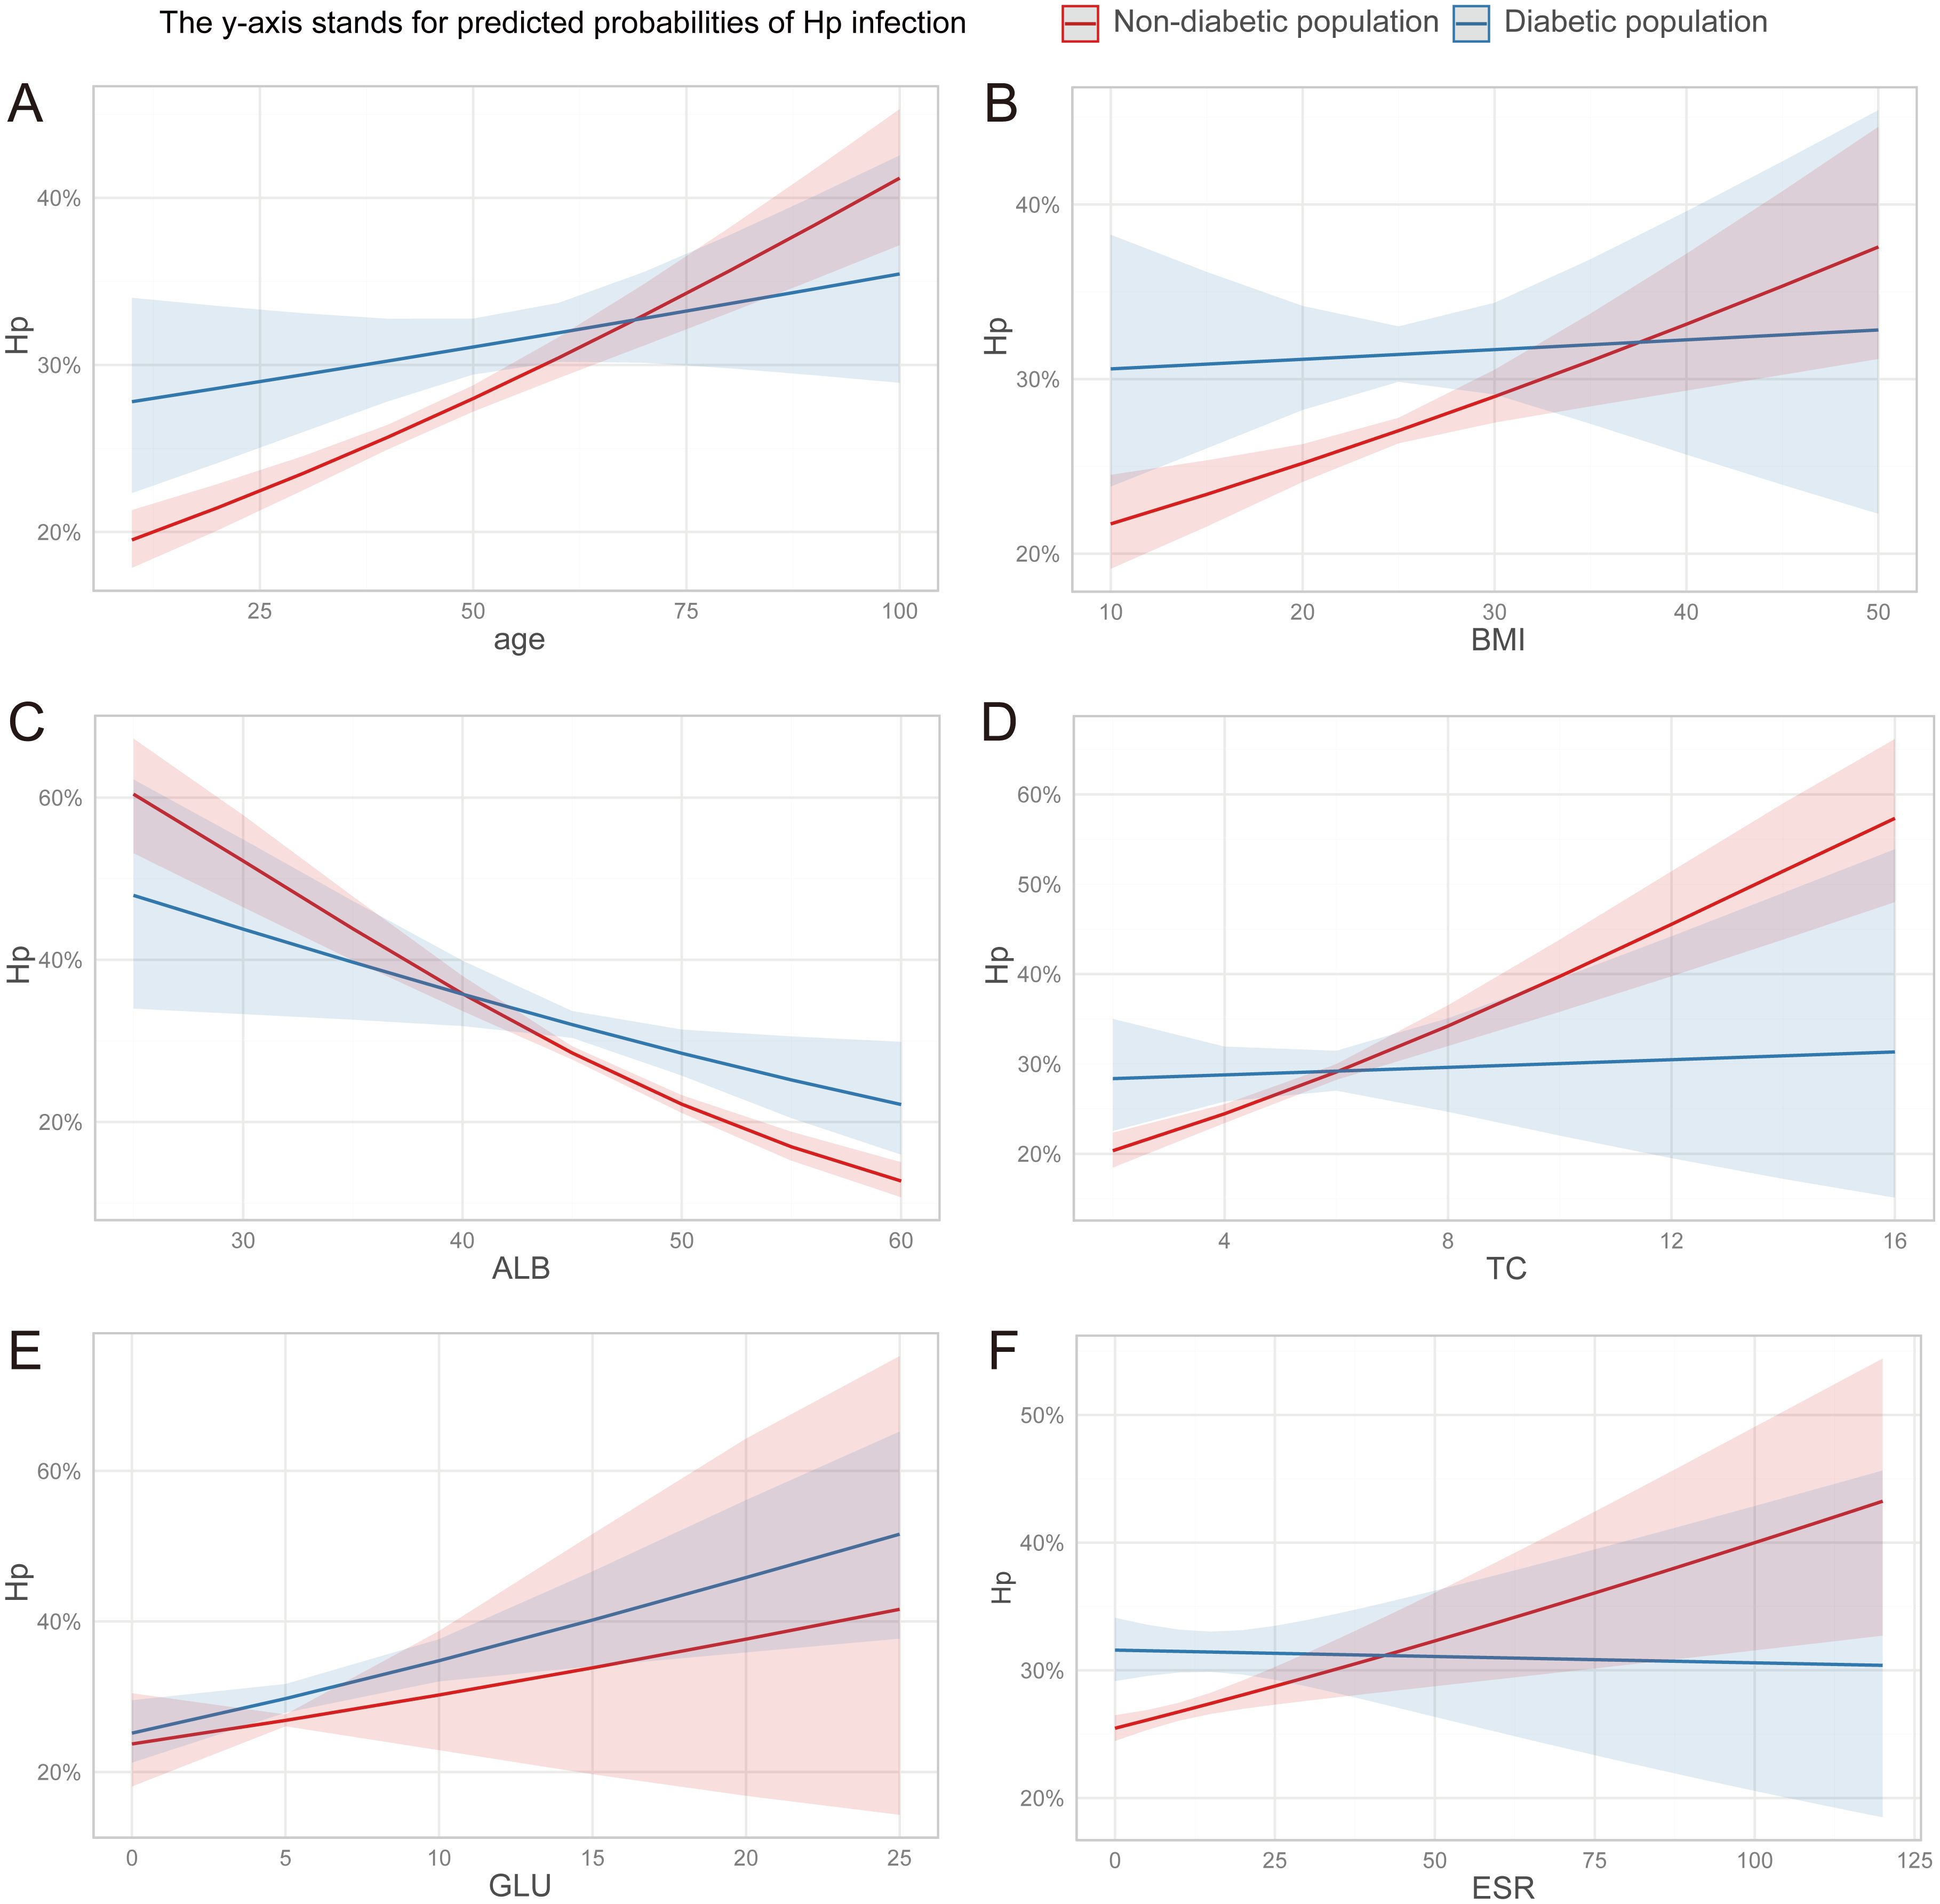
Figure 3. (A–F) The discrepancy in the association between clinical parameters and H. pylori infection risk among diabetic and non-diabetic individuals. ALB, albumin; TC, total cholesterol; GLU, glucose; ESR, erythrocyte sedimentation rate.
Consistent with the findings from the overall population, significant differences were observed in age, BMI, TC, ALB, WBC, ESR, and HbA1c levels between the H. pylori-infection and non-infection groups among non-diabetic individuals (Table 3). Similarly, the prevalence of cholesterol crystals (6.9%), gallbladder polyps (22.5%), and atherosclerosis (28.5%) was significantly higher in the infection group compared to the non-infection group, with respective rates of 5.9%, 20.5%, and 24.6% (average p<0.05) (Table 4). However, among diabetic individuals, due to the limited sample size, only ALB, WBC, HbA1c, and gallbladder polyps exhibited significant differences between the two groups (Supplementary Tables S1, S2).
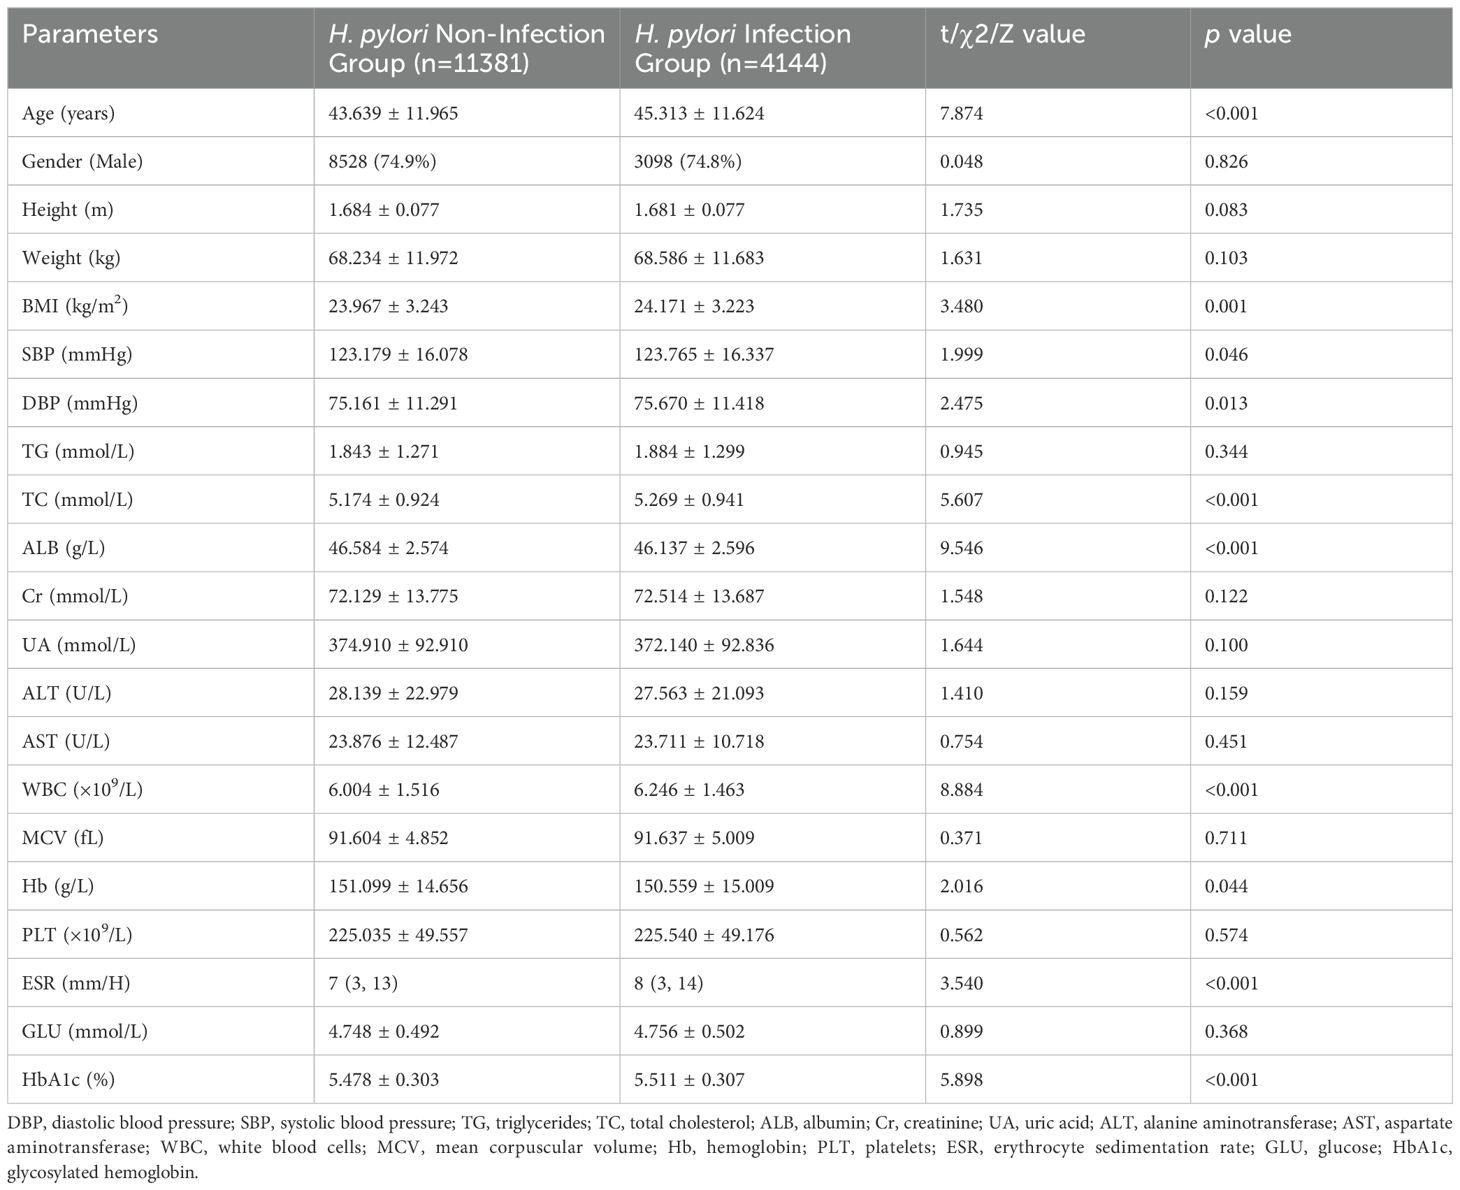
Table 3. Comparative analysis of clinical parameters in the non-diabetic population: H. pylori infection group versus non-infection group.
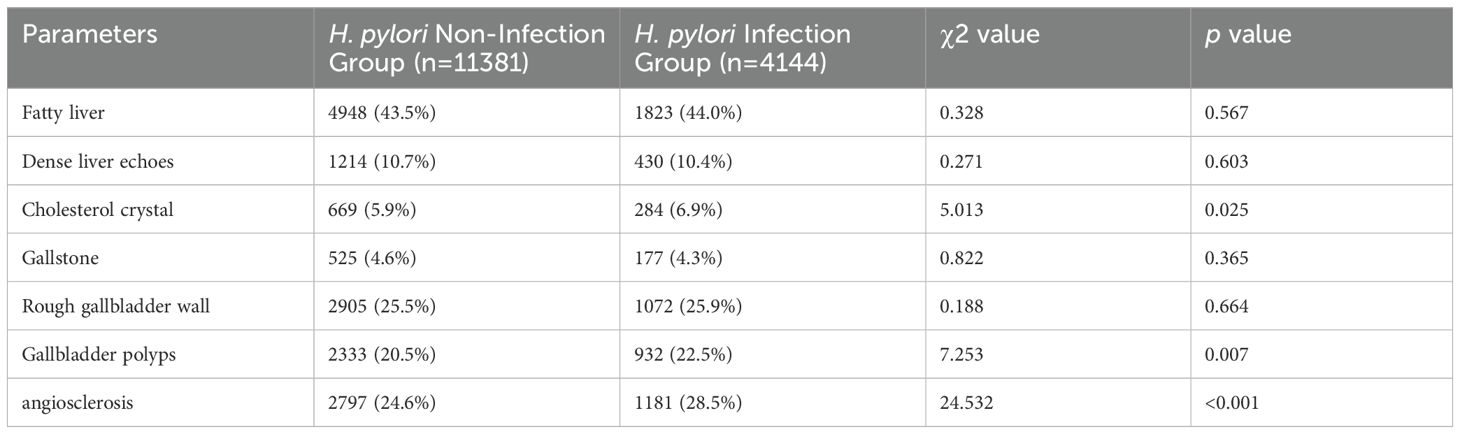
Table 4. Comparative analysis of ultrasonic features in the non-diabetic population: H. pylori infection group versus non-infection group.
Similarly, the RCS curve plotted for the non-diabetic population revealed that the risk of H. pylori infection increased with age among individuals younger than 55 years, whereas it decreased among those older than 55 years. Within the BMI range of 20.0-27.4, a significant elevation in the risk of H. pylori infection was observed with an increase in BMI. Notably, ALB levels exhibited a significant negative correlation with the risk of H. pylori infection, whereas TC and ESR levels demonstrated a significant positive correlation. Furthermore, within the HbA1c range of >5.1%, a marked increase in the risk of H. pylori infection was observed with a rise in HbA1c levels (Figure 4). These findings further underscore the association between H. pylori and abnormal metabolism of glucose, cholesterol, and albumin.
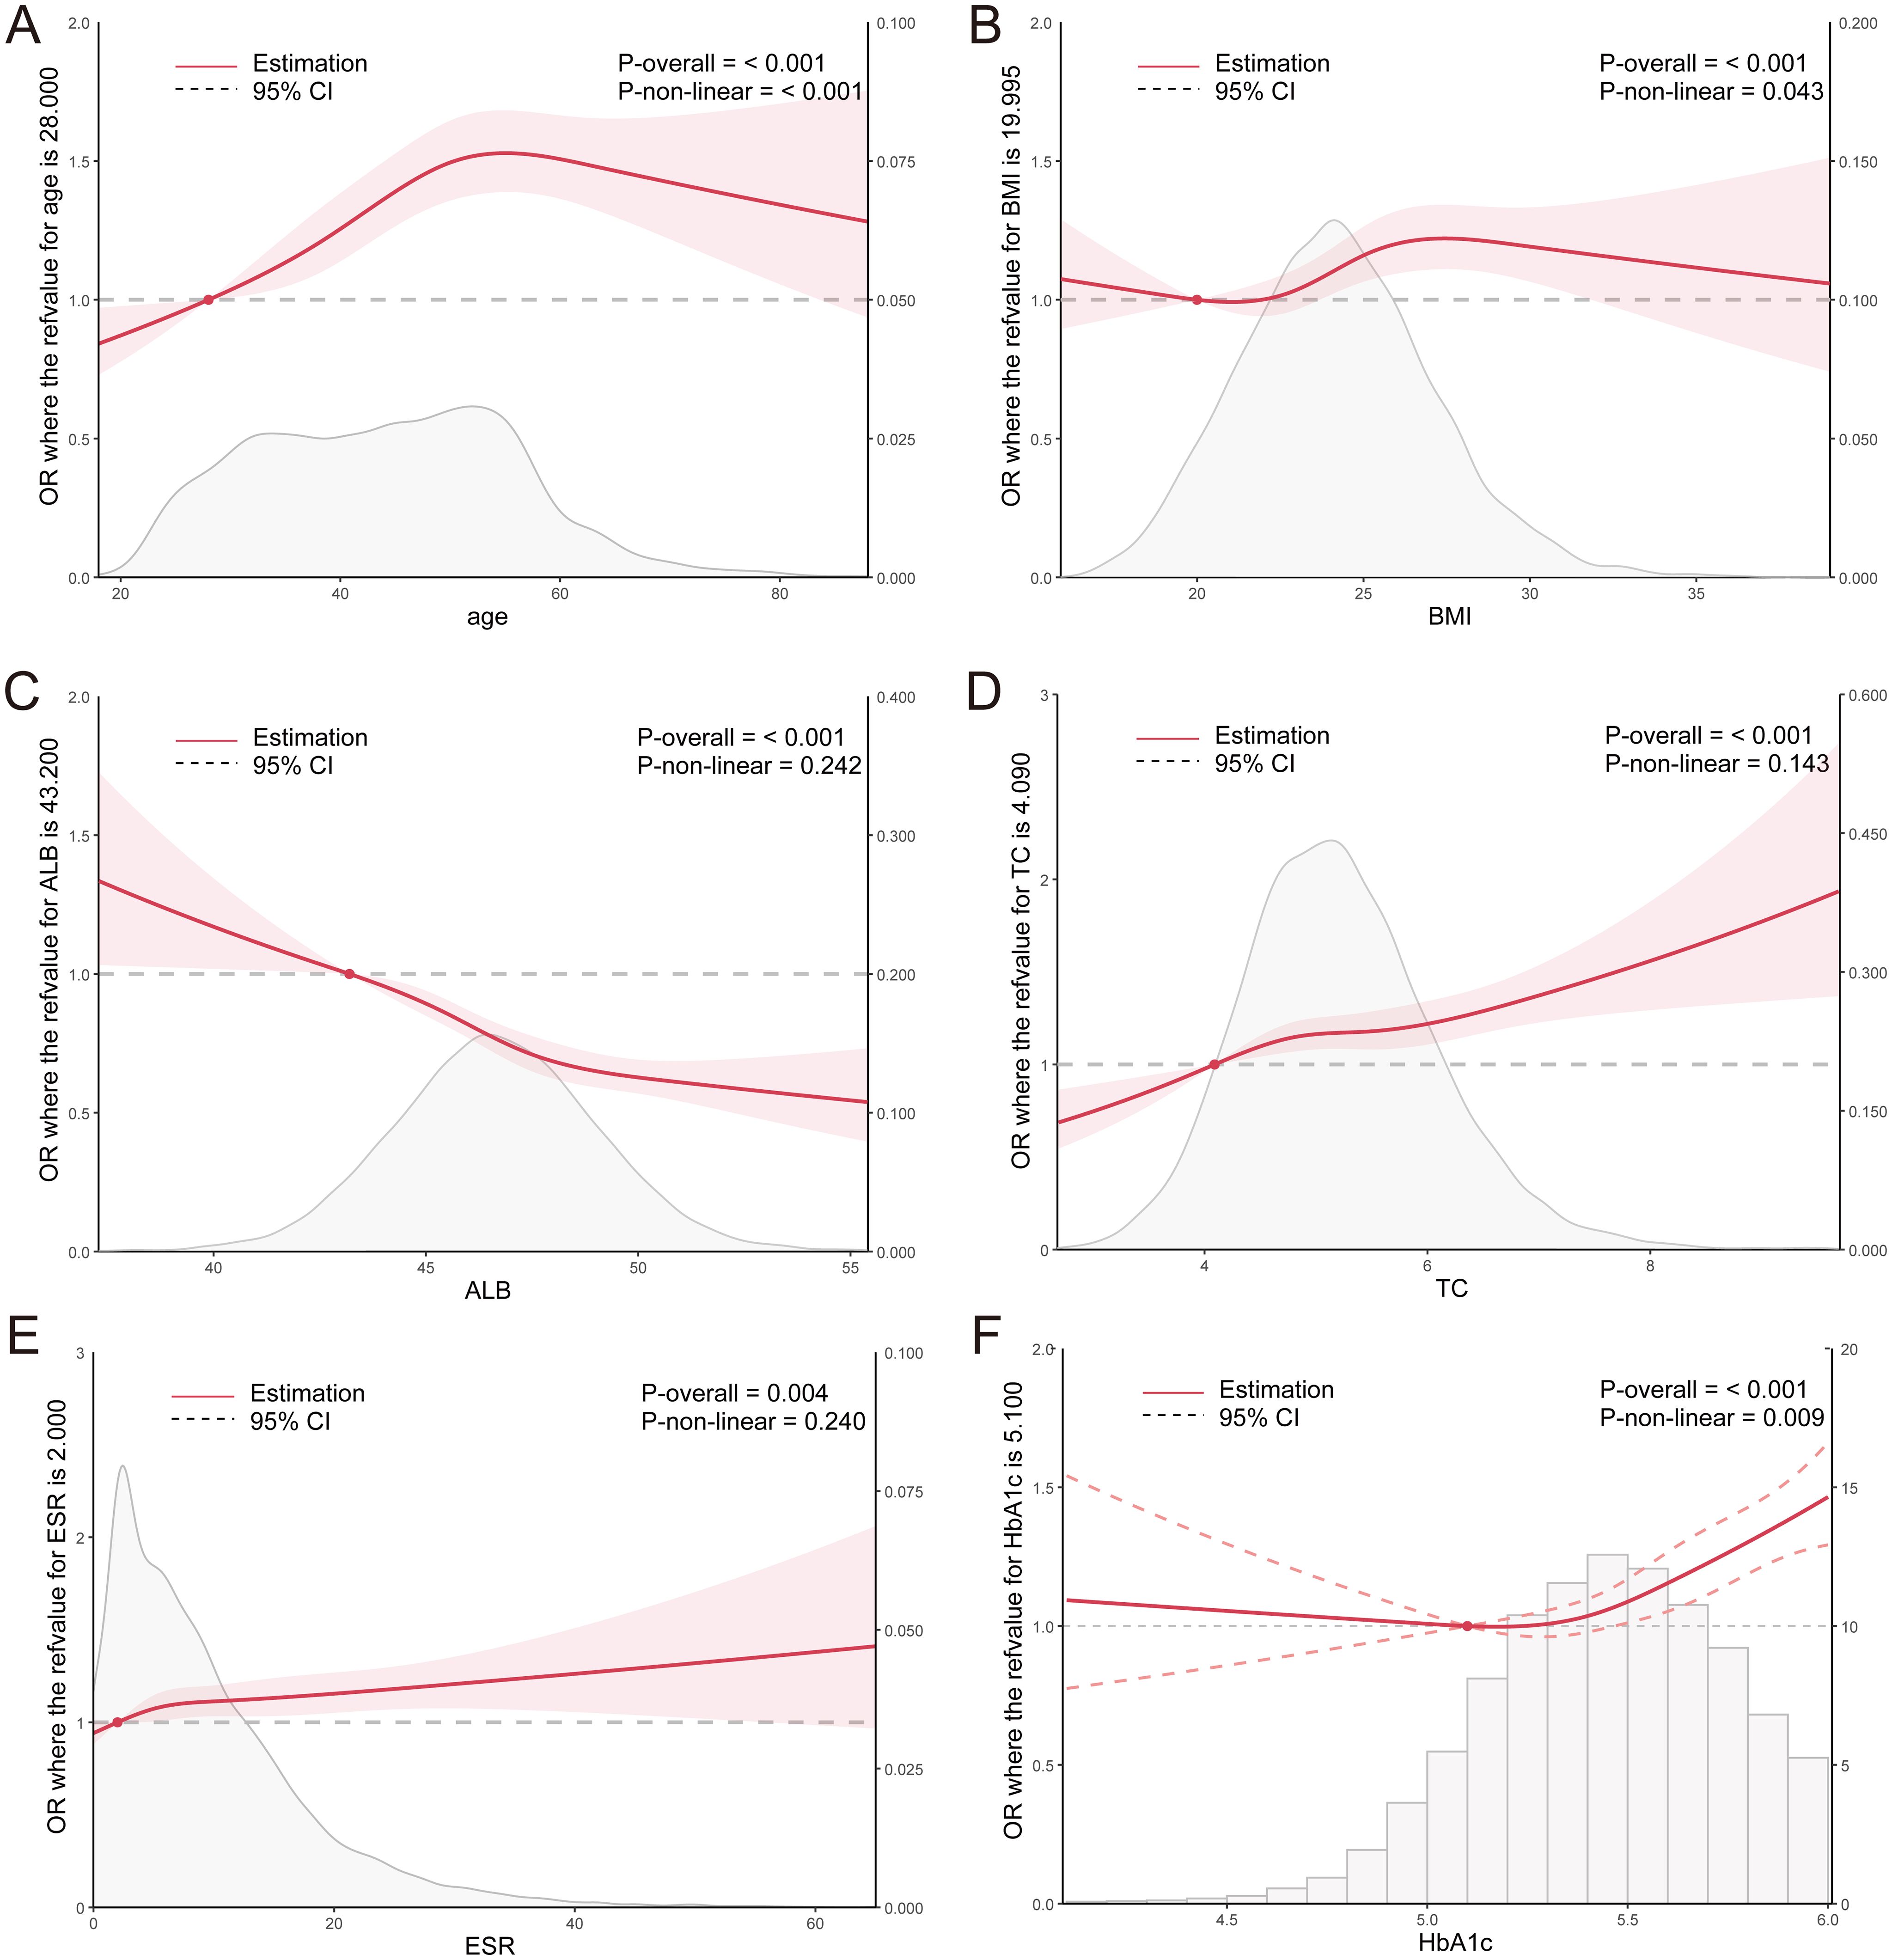
Figure 4. (A–F) RCS curves for clinical parameters and the OR value of H. pylori infection in the non-diabetic population. ALB, albumin; TC, total cholesterol; ESR, erythrocyte sedimentation rate; HbA1c, glycosylated hemoglobin.
Multivariate regression analysis revealed that H. pylori infection, age, BMI, ALB, and TC were independent risk factors for cholesterol crystals (average p < 0.1, Table 5). Utilizing these parameters, a predictive model for cholesterol crystals centered on H. pylori was developed, formulated as follows: Y=0.112*H. pylori (yes=1, no=0) + 0.032*Age (years) + 0.049*BMI - 0.024*ALB (g/L) + 0.049*TC (mmol/L). This model exhibited an AUC value of 0.650 (95% CI: 0.644-0.655), with a statistical Z-score of 23.519 (p < 0.001). It demonstrated good sensitivity of 75.1% but relatively poor specificity of 48.6% (Figure 5A). Calibration curve analysis revealed a moderate alignment with the ideal state, yielding a Brier score of 0.05 (Figure 5B). DCA indicated moderate clinical utility for the model (Figure 5C). Additionally, H. pylori emerged as an independent risk factor for gallbladder polyps, albeit with a low predictive value (Supplementary Table S3, Supplementary Figure S2).
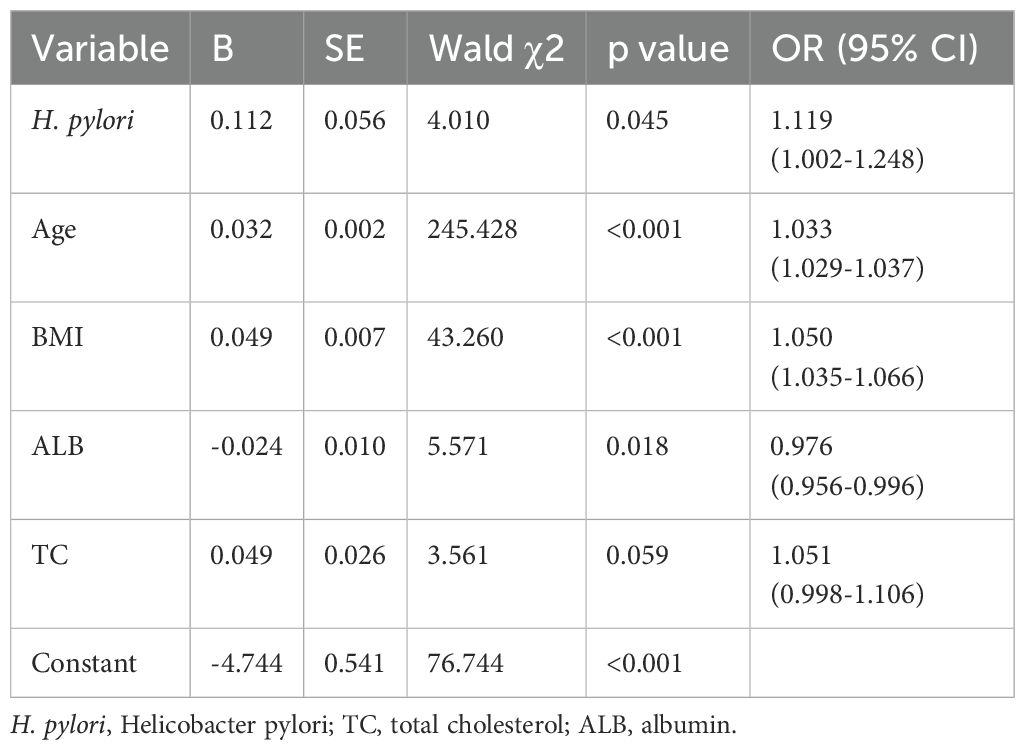
Table 5. Multivariable logistic regression for gallbladder cholesterol crystal.
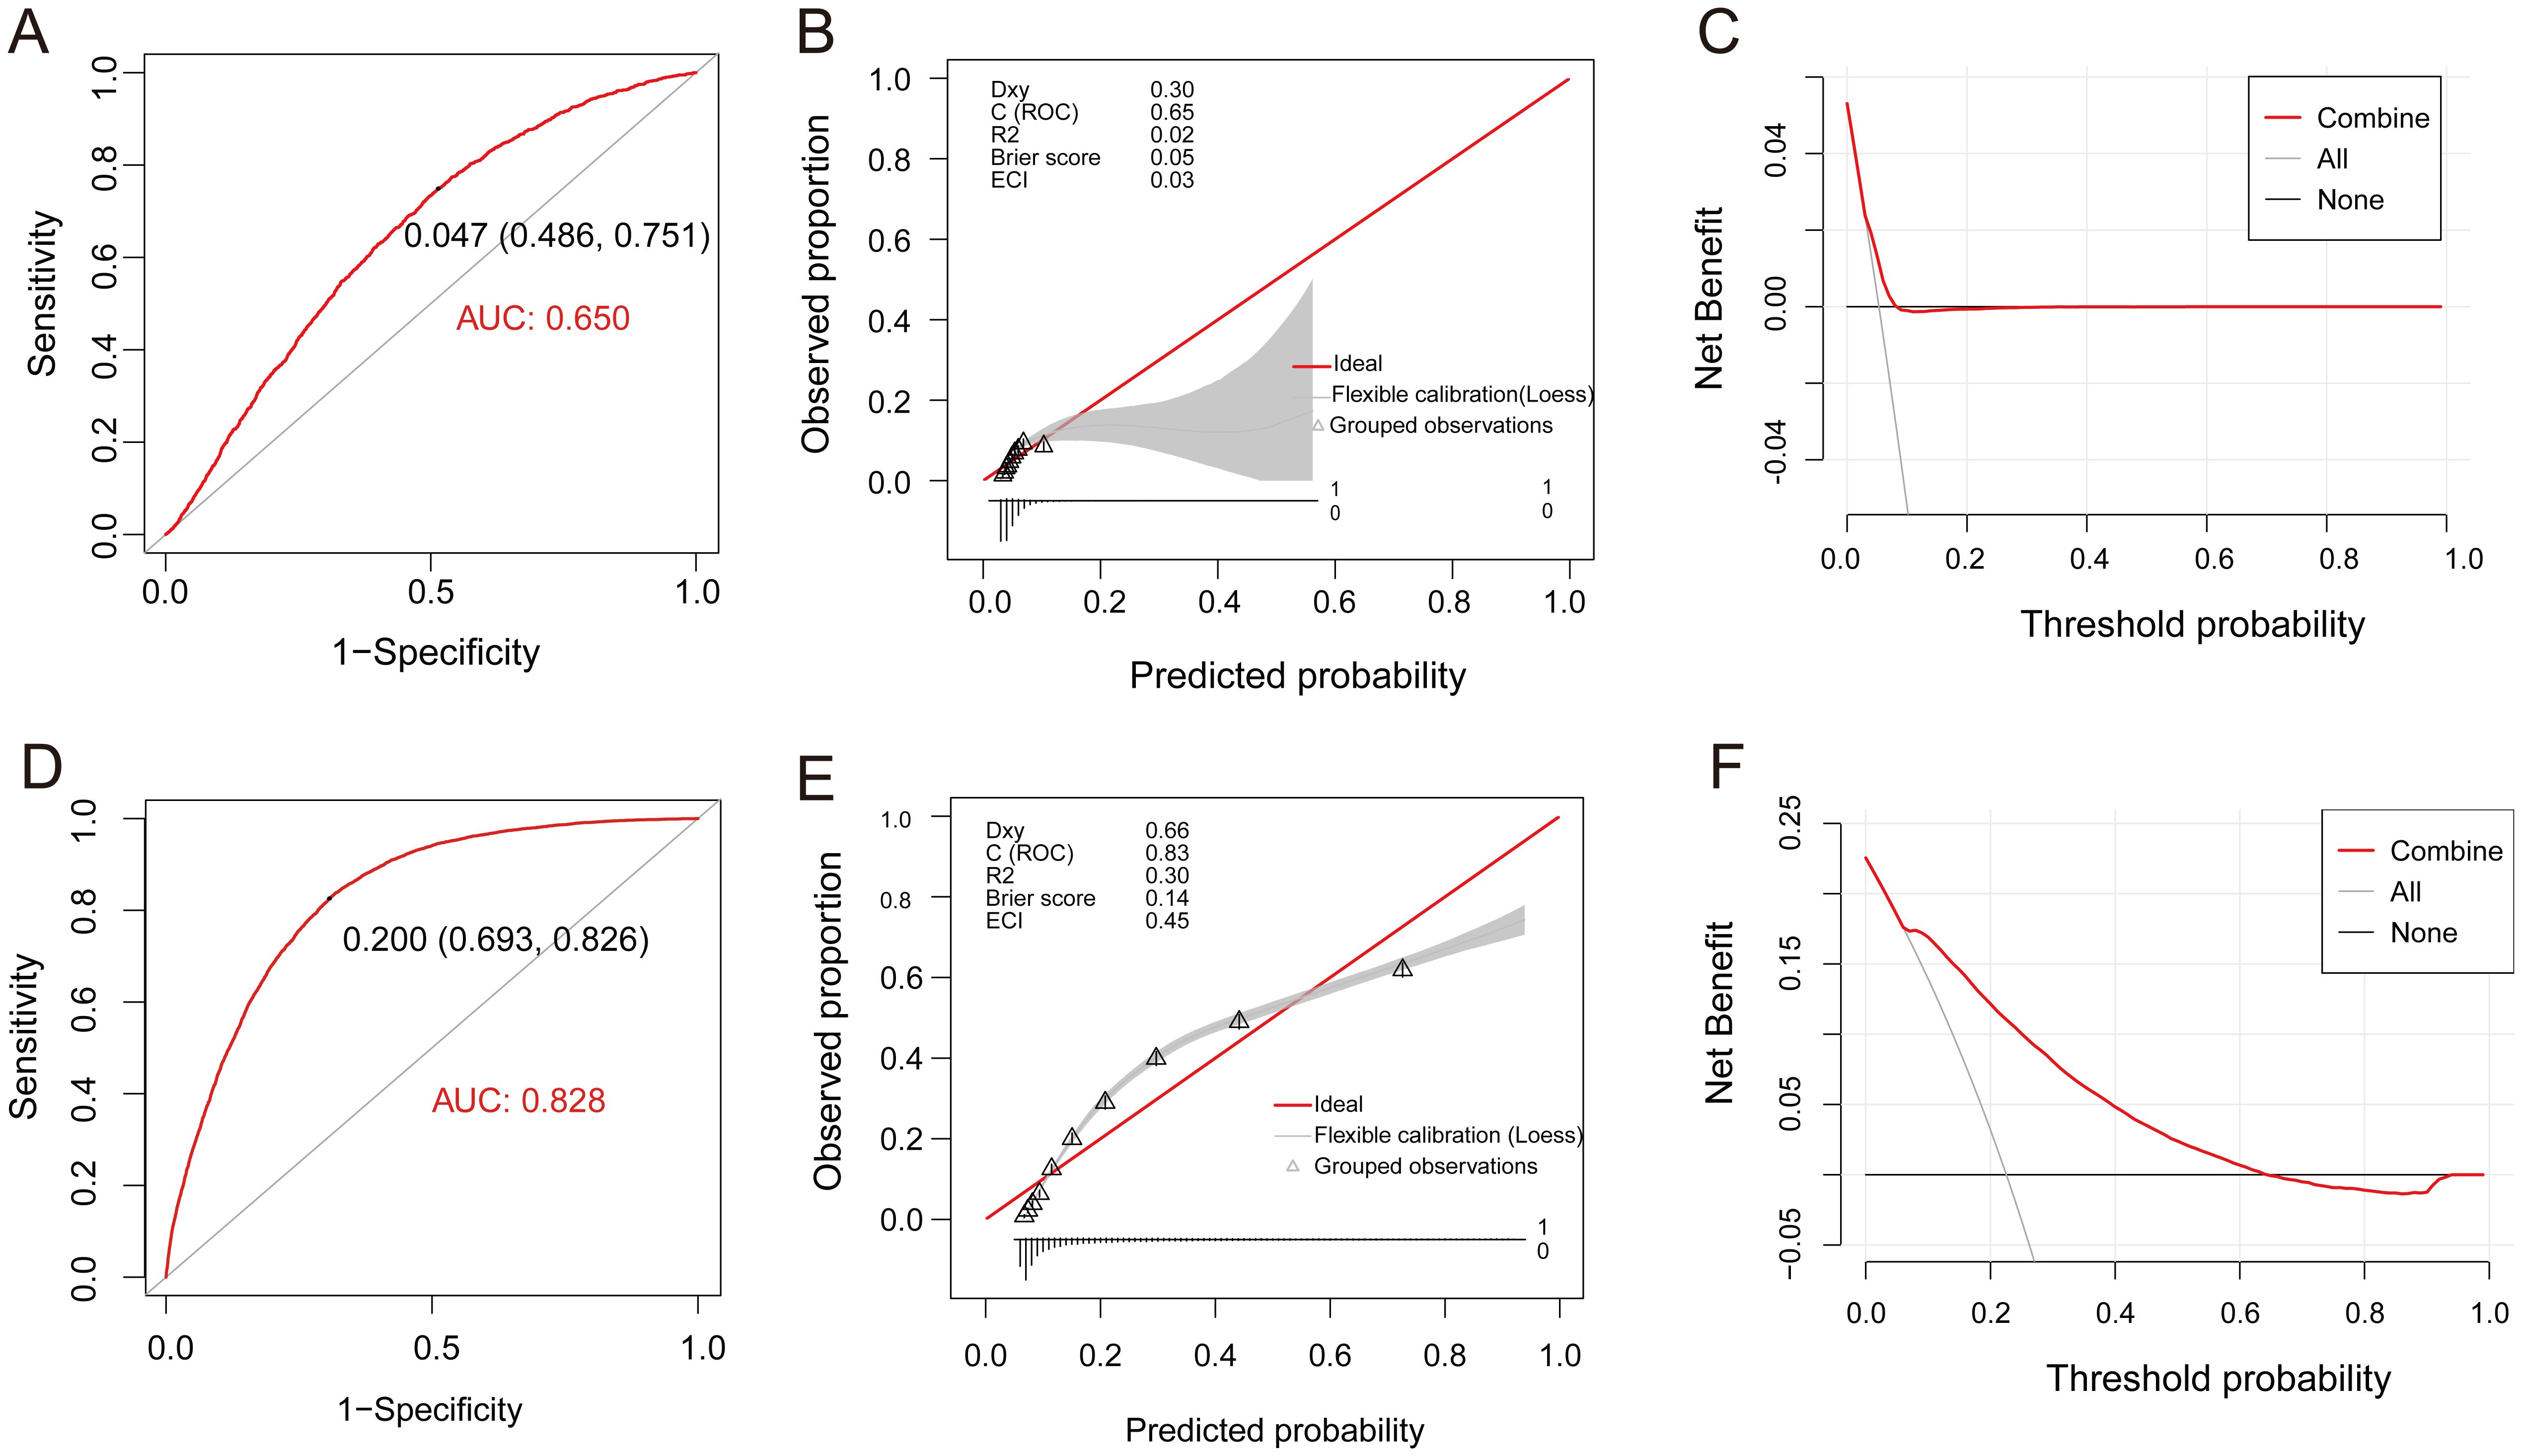
Figure 5. Assessment of the fit and value of the logistic regression equation model. (A-C), ROC curves, calibration curve, and DCA for the model of Gallbladder Cholesterol Crystal in the total population. (D-F), ROC curves, calibration curve, and DCA for the model of Atherosclerosis in the total population. ROC, receiver operating characteristic curve; DCA, decision curve analysis (DCA).
Subsequently, multivariate regression analysis revealed that H. pylori infection, age, BMI, ALB, TC, GLU, and ESR are independent risk factors for atherosclerosis (average p < 0.01, Table 6). Leveraging these parameters, a predictive model for atherosclerosis centered on H. pylori was formulated: Y=0.094* H. pylori (yes=1, no=0) + 0.096*Age (years) + 0.064*BMI - 0.034ALB (g/L) + 0.16*TC (mmol/L) + 0.205*GLU (mmol/L) + 0.013*ESR (mm/H). This model exhibited an AUC value of 0.828 (95% CI: 0.824-0.832), a statistical Z-score of 127.825 (p < 0.001), demonstrating high sensitivity (82.6%) and specificity (69.3%) (Figure 5D). Calibration curve analysis revealed a strong alignment with the ideal state, scoring a Brier of 0.14 (Figure 5E). Furthermore, DCA underscored the model’s significant clinical application value (Figure 5F).
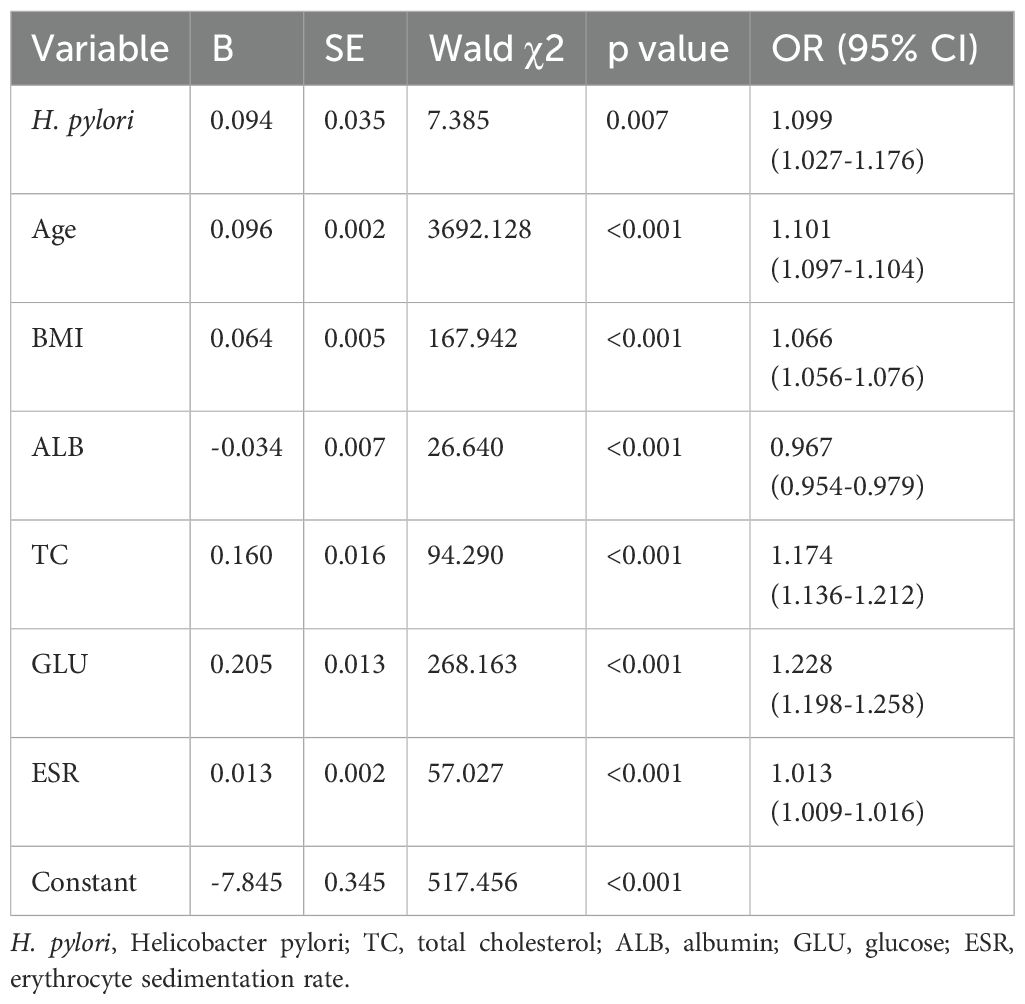
Table 6. Multivariable logistic regression for atherosclerosis.
The NHANES dataset comprised 3,718 individuals in the H. pylori non-infection group and 2,291 in the infection group. Consistent with the findings from the training set, the H. pylori infection group exhibited significantly higher ages and BMI indices compared to the non-infection group (average p < 0.001). Additionally, the levels of TC, Cr, GLU, and HbA1c were notably elevated, and the levels of ALB and HDL were significantly reduced in the infection group (average p < 0.01) (Supplementary Table S3). Given the absence of ESR data, we resorted to the non-normally distributed C reactive protein (CRP). The Mann-Whitney U test revealed that the ESR level in the infection group was significantly elevated compared to the non-infection group (p < 0.001) (Supplementary Table S3).
The RCS curve demonstrates that the risk of H. pylori infection rises with age among individuals younger than 55 years old. Within the BMI range of less than 28, a significant elevation in the risk of H. pylori infection is observed as the BMI index increases. Furthermore, in the ALB range exceeding 41g/L, there is a notable negative correlation between ALB and the risk of H. pylori infection. Additionally, TC and GLU levels exhibit a significant positive correlation with the risk of H. pylori infection. Within the CRP range below 1.2mmol/L, a marked increase in the risk of H. pylori infection is observed with rising CRP levels (average p<0.01) (Figure 6). These findings align closely with the results of the training set, further corroborating the association between H. pylori infection and metabolic abnormalities in glucose, cholesterol, and albumin.
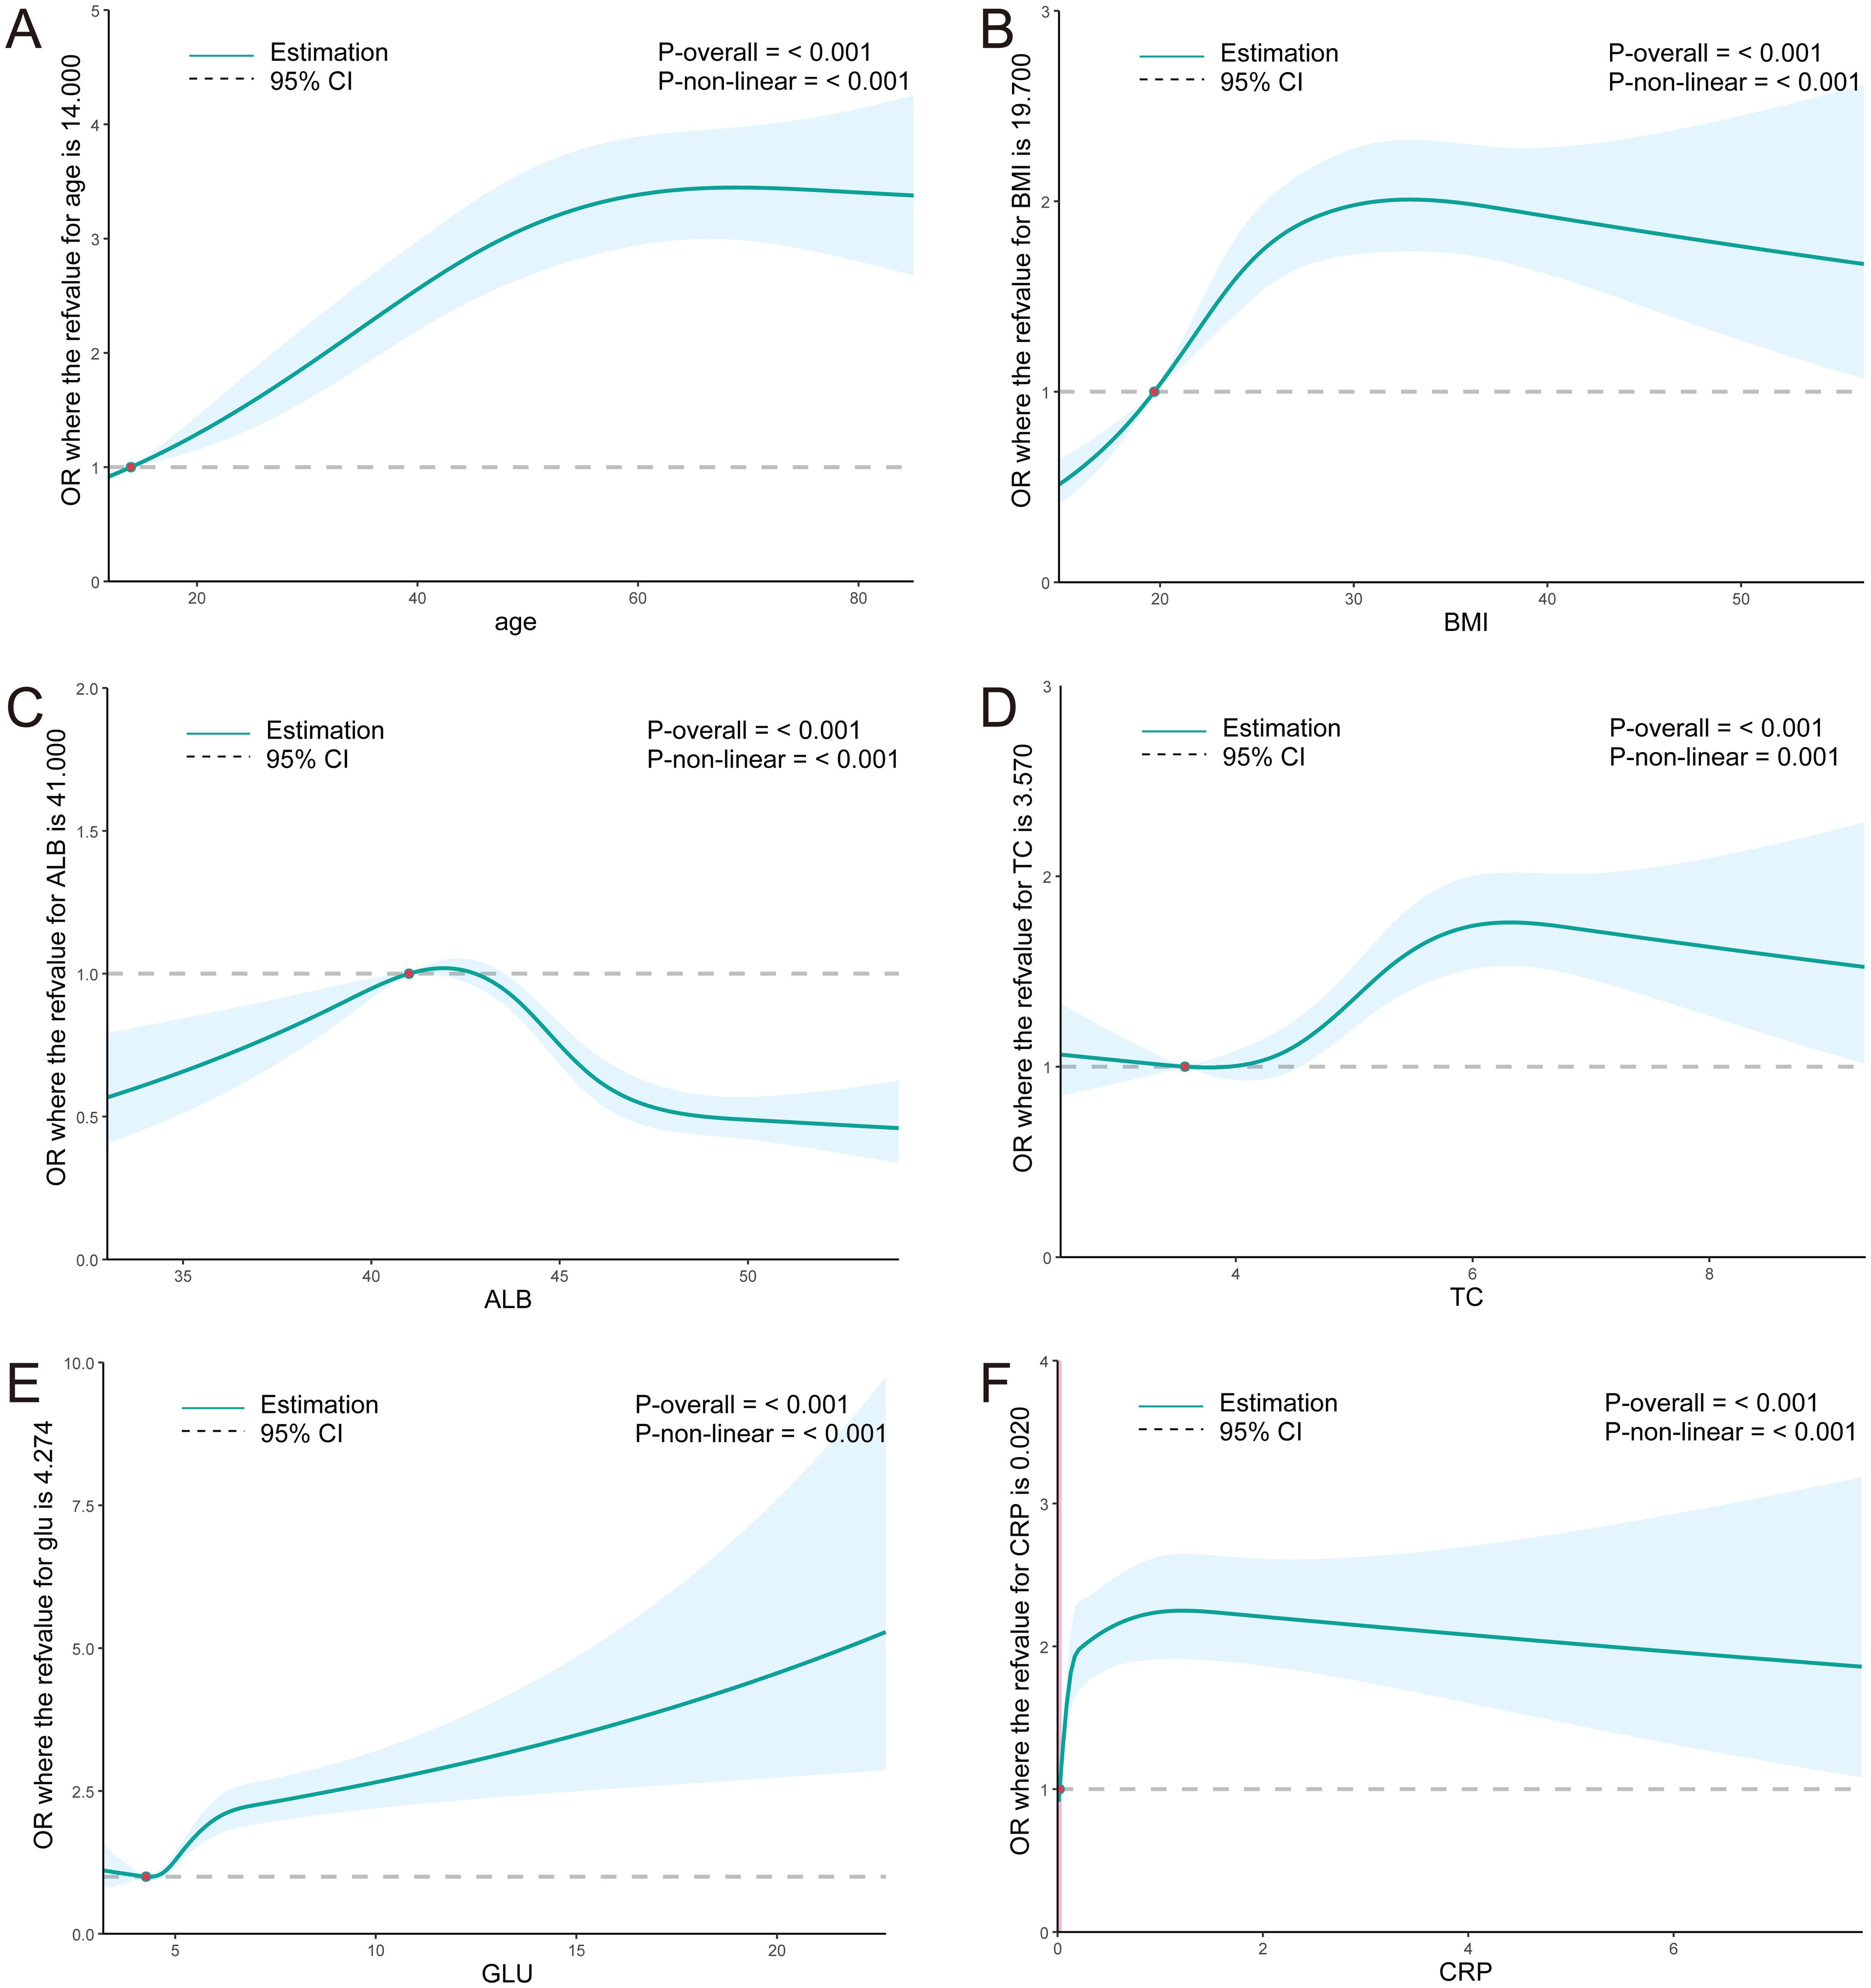
Figure 6. (A–F) RCS curves for clinical parameters and the OR value of H. pylori infection in the NHANES population. ALB, albumin; TC, total cholesterol; GLU, glucose; ESR, erythrocyte sedimentation rate; CRP, C reactive protein.
H. pylori poses a significant chronic health concern, infecting approximately half of the global population (Xiong et al., 2023). Our study reveals a correlation between active H. pylori infection and metabolic abnormalities in glucose, cholesterol, and albumin. This association has been externally validated using the NHANES database. Previous studies have reported a higher incidence of H. pylori infection among patients with diabetes. For instance, the reduced secretion of hydrochloric acid in diabetic patients, often attributed to diabetes-induced dysbiosis, may create favorable conditions for the colonization of H. pylori (Anastasios et al., 2002). Additionally, diabetic patients with autonomic neuropathy often experience delayed gastric emptying, which not only contributes to gastrointestinal symptoms but also facilitates the occurrence of bacterial infections (Sahoo et al., 2023). A comprehensive survey of literature and meta-analysis spanning from 1996 to 2022 has revealed a trend toward more frequent H. pylori infection in diabetic individuals (Sahoo et al., 2023). The association between H. pylori and metabolism is likely influenced by abnormal glucose. To mitigate the potential confounding effect of diabetes, this study further clarified that in non-diabetic populations, ALB exhibits a significant negative correlation with H. pylori infection, whereas TC demonstrates a significant positive correlation. These findings align with previous research, in which Li et al. observed that for every unit increase in glucose, the prevalence of H. pylori increases by 6.9%, whereas for every unit increase in albumin, the prevalence decreases by 3.7% (Li et al., 2022). H. pylori cholesterol-α-glucosyltransferase (CGT) catalyzes the conversion of membrane cholesterol into cholesterol glucoside, which can be integrated into the bacterial membrane, thereby facilitating evasion of immune defense and colonization within the host (Hsu et al., 2021). This provides further insight into the pathophysiological mechanisms underlying the interplay between H. pylori and cholesterol metabolism.
In this study, both the general population and non-diabetic individuals demonstrated a close association between H. pylori infection and gallbladder polyps, as well as gallbladder cholesterol crystals. Notably, H. pylori infection emerges as an independent risk factor for the cholesterol crystals, of which the prediction model, formulated on the basis of H. pylori and other clinical indicators, holds significant clinical application value. Currently, there is a paucity of literature reporting on the linkage between H. pylori and the cholesterol crystals. We hypothesize that this association may be attributed to the impact of H. pylori infection on cholesterol metabolism. Furthermore, in alignment with our findings, a study encompassing 17,971 participants revealed a positive correlation between H. pylori and gallbladder polyps, emphasizing the likelihood of local inflammatory processes triggered by H. pylori, ultimately leading to an elevated incidence of gallbladder polyps (Xu et al., 2018). Nevertheless, there are also studies reporting negative outcomes, and conclusive evidence is yet to emerge to firmly establish the causal relationship between them (Lim et al., 2023).
Surprisingly, our study revealed no significant association between H. pylori and conditions such as fatty liver, intrahepatic inflammation, cholecystitis, and gallstones. As previously mentioned, prior research has presented contrasting views on the link between H. pylori and fatty liver. Similarly, conflicting findings have been reported, with one study showing that the prevalence of gallstones among H. pylori-positive, H. pylori-eradicated, and H. pylori-negative subjects was 9.47%, 9.02%, and 8.46% respectively. Matching analysis revealed that the incidence of gallstones was significantly lower in H. pylori-eradicated group, indicating a significant positive correlation between H. pylori infection and gallstones (Zhang et al., 2015). However, another matched case-control study focusing on Chinese patients found no significant difference in the rate of H. pylori infection among patients with gallstones and gallbladder polyps, suggesting that H. pylori infection may not be a causative factor for these conditions (Zhang et al., 2020). Our findings further underscore the uncertainty surrounding these associations and highlight the need for future multi-center, prospective studies and fundamental research to clarify these relationships.
Previous studies have extensively reported the correlation between H. pylori and atherosclerosis, as well as cardiovascular and cerebrovascular diseases (Saijo et al., 2005; Shi et al., 2022). Specifically, Helicobacter pylori infection has been linked to an increase in carotid intima-media thickness, particularly in CagA+ strains (Shi et al., 2022). Chen et al (Chen et al., 2024). discovered in a subgroup analysis that there exists a notable positive correlation between abdominal obesity and seropositivity for H. pylori antibodies in individuals less than 50 years old. These correlations are attributed to the profound influence of H. pylori on glucose and lipid metabolism, as well as the inflammatory status (Xie et al., 2023). H. pylori can trigger inflammatory reactions through diverse mechanisms. LPS, a component of the outer membrane in Gram-negative bacteria, is capable of activating the Th1 response (Candelli et al., 2023). Vacuolating cytotoxin (VacA) serves as another pivotal component in regulating the immune response to H. pylori infection. On the one hand, it triggers the production of cytokines, including TNF-α, MIP-1α, IL-1, IL-6, IL-10, and IL-13, by activating mast cells. On the other hand, it suppresses the proliferation and differentiation of T lymphocytes (Foegeding et al., 2016). Furthermore, a study conducted by Amedei et al. emphasized that CagA+ strains of H. pylori, characterized by their cytotoxin-associated gene antigen, possess a superior ability to induce the production of IL-6. Notably, IL-6 is implicated in the aging of vascular and myeloid cells, potentially leading to a mutual reinforcement that promotes atherosclerosis (Pandolfi et al., 2020). Remarkably consistent with these findings, H. pylori exhibited a strong positive correlation with the inflammation markers CRP and ESR in our study. Furthermore, H. pylori emerged as an independent risk factor for atherosclerosis, and the atherosclerotic model formulated on the basis of H. pylori demonstrated exceptional fitting accuracy and significant clinical application value.
Certainly, our study is not without limitations. Firstly, selection bias is inherent in our retrospective approach. Secondly, the urease breath test results solely suggest the existence of an active infection, thus rendering it impossible to ascertain the duration of the infection. It is noteworthy that cholesterol crystallization and atherosclerosis formation are protracted processes, necessitating long-term follow-up studies to yield more credible conclusions.
H. pylori infection is associated with abnormalities in glucose, glycosylated hemoglobin, cholesterol, and albumin. Additionally, H. pylori poses as a risk factor for the gallbladder cholesterol crystals and atherosclerosis. However, no significant association has been observed between H. pylori and fatty liver, gallstones, or cholecystitis. Future multicenter, prospective, and fundamental researches are warranted to validate these findings.
The raw data supporting the conclusions of this article will be made available by the authors, without undue reservation.
The studies involving humans were approved by Institutional Review Board of Taizhou Central Hospital (Taizhou University Hospital). The studies were conducted in accordance with the local legislation and institutional requirements. Written informed consent for participation in this study was provided by the participants’ legal guardians/next of kin.
ZY: Data curation, Formal Analysis, Funding acquisition, Methodology, Writing – original draft, Writing – review & editing. JC: Data curation, Formal Analysis, Writing – original draft. MC: Data curation, Formal Analysis, Writing – original draft. QP: Data curation, Formal Analysis, Validation, Writing – original draft. YS: Data curation, Formal Analysis, Validation, Writing – original draft. XJ: Data curation, Formal Analysis, Writing – original draft. CW: Data curation, Formal Analysis, Writing – original draft. YZ: Data curation, Formal Analysis, Writing – original draft. GL: Data curation, Formal Analysis, Validation, Writing – review & editing. PF: Data curation, Formal Analysis, Validation, Writing – review & editing. XT: Data curation, Formal Analysis, Methodology, Validation, Writing – review & editing.
The author(s) declare that financial support was received for the research, authorship, and/or publication of this article. This research was funded by the Zhejiang Natural Science Fund (Q23H030007) and the Taizhou Science and Technology Plan Project (22ywb27).
We extend our gratitude to the NHANES team for providing the data. Thanks to Zhang Jing (Shanghai Fifth People’s Hospital, Fudan University) for his work on the NHANES database (including the nhanesR package and webpage).
The authors declare that the research was conducted in the absence of any commercial or financial relationships that could be construed as a potential conflict of interest.
All claims expressed in this article are solely those of the authors and do not necessarily represent those of their affiliated organizations, or those of the publisher, the editors and the reviewers. Any product that may be evaluated in this article, or claim that may be made by its manufacturer, is not guaranteed or endorsed by the publisher.
The Supplementary Material for this article can be found online at: https://www.frontiersin.org/articles/10.3389/fcimb.2025.1477699/full#supplementary-material
H. pylori, Helicobacter pylori; NHANES, National Health and Nutrition Examination Survey; DM, diabetes mellitus; NAFLD, non-alcoholic fatty liver disease; TG, triglycerides; TC, total cholesterol; GLU, glucose; HbA1c, glycosylated hemoglobin; ALB, albumin; Cr, creatinine; UA, uric acid; ALT, alanine aminotransferase; AST, aspartate aminotransferase; WBC, white blood cells; MCV, mean corpuscular volume; Hb, hemoglobin; PLT, platelets; ESR, erythrocyte sedimentation rate; DBP, diastolic blood pressure; SBP, systolic blood pressure; RCS, restricted cubic spline; ROC, receiver operating characteristic curve; AUC, Area under curve; DCA, decision curve analysis (DCA); GGT, cholesterol-α-glucosyltransferase (CGT); VacA, Vacuolating cytotoxin (VacA); CRP, C reactive protein.
Abo-Amer, Y. E.-E., Sabal, A., Ahmed, R., Hasan, N. F. E., Refaie, R., Mostafa, S. M., et al. (2020). Relationship between Helicobacter pylori infection and nonalcoholic fatty liver disease (NAFLD) in a developing country: a cross-sectional study. Diabetes Metab. Syndrome Obes. 13, 619–625. doi: 10.2147/DMSO.S237866
Anastasios, R., Goritsas, C., Papamihail, C., Trigidou, R., Garzonis, P., Ferti, A. (2002). Helicobacter pylori infection in diabetic patients: prevalence and endoscopic findings. Eur. J. Internal Med. 13, 376–379. doi: 10.1016/S0953-6205(02)00094-8
Candelli, M., Franza, L., Cianci, R., Pignataro, G., Merra, G., Piccioni, A., et al. (2023). The interplay between helicobacter pylori and gut microbiota in non-gastrointestinal disorders: A special focus on atherosclerosis. Int. J. Mol. Sci. 24, 17520. doi: 10.3390/ijms242417520
Cen, L., Wu, J., Zhu, S., Pan, J., Zhou, T., Yan, T., et al. (2023). The potential bidirectional association between Helicobacter pylori infection and gallstone disease in adults: A two-cohort study. Eur. J. Clin. Invest. 53, e13879. doi: 10.1111/eci.13879
Chen, D., Wang, S., Yang, W., Lu, H., Ren, Q. (2024). Obesity, abdominal obesity, metabolic obesity phenotypes, and Helicobacter pylori infection: results from NHANES 1999–2000. BMC Infect. Dis. 24, 676. doi: 10.1186/s12879-024-09409-7
Chen, Y., You, N., Shen, C., Wu, J., Zhang, J. (2023). Helicobacter pylori infection increases the risk of nonalcoholic fatty liver disease in diabetic population. Front. Nutr. 10, 1076579. doi: 10.3389/fnut.2023.1076579
Fischbach, W., Malfertheiner, P. (2018). Helicobacter Pylori infection: when to eradicate, how to diagnose and treat. Deutsches Ärzteblatt Int. 115, 429. doi: 10.3238/arztebl.2018.0429
Foegeding, N. J., Caston, R. R., McClain, M. S., Ohi, M. D., Cover, T. L. (2016). An overview of Helicobacter pylori VacA toxin biology. Toxins 8, 173. doi: 10.3390/toxins8060173
Hsu, C.-Y., Yeh, J.-Y., Chen, C.-Y., Wu, H.-Y., Chiang, M.-H., Wu, C.-L., et al. (2021). Helicobacter pylori cholesterol-α-glucosyltransferase manipulates cholesterol for bacterial adherence to gastric epithelial cells. Virulence 12, 2341–2351. doi: 10.1080/21505594.2021.1969171
Li, C., Yue, J., Ding, Z., Zhang, Q., Xu, Y., Wei, Q., et al. (2022). Prevalence and predictors of Helicobacter pylori infection in asymptomatic individuals: a hospital-based cross-sectional study in Shenzhen, China. Postgraduate Med. 134, 686–692. doi: 10.1080/00325481.2022.2085950
Lim, K. P. K., Lee, A. J. L., Jiang, X., Teng, T. Z. J., Shelat, V. G. (2023). The link between Helicobacter pylori infection and gallbladder and biliary tract diseases: A review. Ann. Hepato-biliary-pancreatic Surg. 27, 241–250. doi: 10.14701/ahbps.22-056
Liu, Y., Xu, H., Zhao, Z., Dong, Y., Wang, X., Niu, J. (2022). No evidence for a causal link between Helicobacter pylori infection and nonalcoholic fatty liver disease: A bidirectional Mendelian randomization study. Front. Microbiol. 13, 1018322. doi: 10.3389/fmicb.2022.1018322
Makola, D., Peura, D. A., Crowe, S. E. (2007). Helicobacter pylori infection and related gastrointestinal diseases. J. Clin. Gastroenterol. 41, 548–558. doi: 10.1097/MCG.0b013e318030e3c3
Meier, H., Miller, F., Dinse, G., Weinberg, C., Cho, C., Parks, C. (2020). Helicobacter pylori seropositivity is associated with antinuclear antibodies in US adults, NHANES 1999–2000. Epidemiol. Infection 148, e20. doi: 10.1017/S0950268820000126
Pandolfi, F., Franza, L., Carusi, V., Altamura, S., Andriollo, G., Nucera, E. (2020). Interleukin-6 in rheumatoid arthritis. Int. J. Mol. Sci. 21, 5238. doi: 10.3390/ijms21155238
Sahoo, O. S., Mitra, R., Bhattacharjee, A., Kar, S., Mukherjee, O. (2023). Is Diabetes mellitus a predisposing factor for Helicobacter pylori infections? Curr. Diabetes Rep. 23, 195–205. doi: 10.1007/s11892-023-01511-5
Saijo, Y., Utsugi, M., Yoshioka, E., Horikawa, N., Sato, T., Gong, Y., et al. (2005). Relationship of Helicobacter pylori infection to arterial stiffness in Japanese subjects. Hypertension Res. 28, 283–292. doi: 10.1291/hypres.28.283
Santos, M. L. C., de Brito, B. B., da Silva, F. A. F., Sampaio, M. M., Marques, H. S., Oliveira, N., et al. (2020). Helicobacter pylori infection: Beyond gastric manifestations. World J. Gastroenterol. 26, 4076. doi: 10.3748/wjg.v26.i28.4076
Sharndama, H. C., Mba, I. E. (2022). Helicobacter pylori: an up-to-date overview on the virulence and pathogenesis mechanisms. Braz. J. Microbiol. 53, 33–50. doi: 10.1007/s42770-021-00675-0
Shi, H., Li, Y., Dong, C., Si, G., Xu, Y., Peng, M., et al. (2022). Helicobacter pylori infection and the progression of atherosclerosis: A systematic review and meta−analysis. Helicobacter 27, e12865. doi: 10.1111/hel.12865
Upala, S., Sanguankeo, A., Wijarnpreecha, K., Jaruvongvanich, V. (2016). Association between Helicobacter pylori infection and osteoporosis: a systematic review and meta-analysis. J. Bone mineral Metab. 34, 482–483. doi: 10.1007/s00774-015-0703-1
Xie, J., Wang, J., Zeng, R., Xie, Y. (2023). Association between Helicobacter pylori infection and triglyceride levels: a nested cross-sectional study. Front. Endocrinol. 14, 1220347. doi: 10.3389/fendo.2023.1220347
Xiong, Y.-J., Du, L.-L., Diao, Y.-L., Wen, J., Meng, X.-B., Gao, J., et al. (2023). Association of dietary inflammatory index with helicobacter pylori infection and mortality among US population. J. Trans. Med. 21, 538. doi: 10.1186/s12967-023-04398-8
Xu, M. Y., Ma, J. H., Yuan, B. S., Yin, J., Liu, L., Lu, Q. B. (2018). Association between Helicobacter pylori infection and gallbladder diseases: A retrospective study. J. Gastroenterol. Hepatol. 33, 1207–1212. doi: 10.1111/jgh.2018.33.issue-6
Zamani, M., Ebrahimtabar, F., Zamani, V., Miller, W., Alizadeh-Navaei, R., Shokri-Shirvani, J., et al. (2018). Systematic review with meta-analysis: the worldwide prevalence of Helicobacter pylori infection. Alimentary Pharmacol. Ther. 47, 868–876. doi: 10.1111/apt.2018.47.issue-7
Zhang, F.-M., Yu, C.-H., Chen, H.-T., Shen, Z., Hu, F.-L., Yuan, X.-P., et al. (2015). Helicobacter pylori infection is associated with gallstones: Epidemiological survey in China. World J. Gastroenterology: WJG 21, 8912.
Keywords: Helicobacter pylori, fatty liver, gallstone, gallbladder polyp, cholesterol crystal
Citation: Yu Z, Chen J, Chen M, Pan Q, Shao Y, Jin X, Wang C, Zhang Y, Lin G, Feng P and Teng X (2025) Analysis between Helicobacter pylori infection and hepatobiliary diseases. Front. Cell. Infect. Microbiol. 15:1477699. doi: 10.3389/fcimb.2025.1477699
Received: 08 August 2024; Accepted: 06 February 2025;
Published: 07 March 2025.
Edited by:
Yolanda López-Vidal, National Autonomous University of Mexico, MexicoCopyright © 2025 Yu, Chen, Chen, Pan, Shao, Jin, Wang, Zhang, Lin, Feng and Teng. This is an open-access article distributed under the terms of the Creative Commons Attribution License (CC BY). The use, distribution or reproduction in other forums is permitted, provided the original author(s) and the copyright owner(s) are credited and that the original publication in this journal is cited, in accordance with accepted academic practice. No use, distribution or reproduction is permitted which does not comply with these terms.
*Correspondence: Xiaosheng Teng, dGVuZ3hpYW9zaGVuZ0AxNjMuY29t; Ping Feng, ZmVuZ3AxMDI4QHR6enh5eS5jb20=; Gang Lin, bGluZzEwOTNAdHp6eHl5LmNvbQ==
†These authors have contributed equally to this work
Disclaimer: All claims expressed in this article are solely those of the authors and do not necessarily represent those of their affiliated organizations, or those of the publisher, the editors and the reviewers. Any product that may be evaluated in this article or claim that may be made by its manufacturer is not guaranteed or endorsed by the publisher.
Research integrity at Frontiers
Learn more about the work of our research integrity team to safeguard the quality of each article we publish.