 Pulin Li
 Jiling Wang2†
 Rui Han
 Sijing Zhou
 Ran Wang
- 1Department of Respiratory and Critical Care Medicine, The First Affiliated Hospital of Anhui Medical University, Hefei, China
- 2Department of Infectious Disease, Hefei Second People’s Hospital, Hefei, China
- 3Department of Oncology, The First Affiliated Hospital of Anhui Medical University, Hefei, China
- 4Department of Occupational Disease, Hefei Third Clinical College of Anhui Medical University, Hefei, China
- 5Department of Radiology, The First Affiliated Hospital of Anhui Medical University, Hefei, China
Purpose: To develop a predictive nomogram based on computed tomography (CT) radiomics to distinguish pulmonary tuberculosis (PTB) from community-acquired pneumonia (CAP).
Methods: A total of 195 PTB patients and 163 CAP patients were enrolled from three hospitals. It is divided into a training cohort, a testing cohort and validation cohort. Clinical models were established by using significantly correlated clinical features. Radiomics features were screened by the least absolute shrinkage and selection operator (LASSO) algorithm. Radiomics scores (Radscore) were calculated from the formula of radiomics features. Clinical radiomics conjoint nomogram was established according to Radscore and clinical features, and the diagnostic performance of the model was evaluated by receiver operating characteristic (ROC) curve analysis.
Results: Two clinical features and 12 radiomic features were selected as optimal predictors for the establishment of clinical radiomics conjoint nomogram. The results showed that the predictive nomogram had an outstanding ability to discriminate between the two diseases, and the AUC of the training cohort was 0.947 (95% CI, 0.916-0.979), testing cohort was 0.888 (95% CI, 0.814-0.961) and that of the validation cohort was 0.850 (95% CI, 0.778-0.922). Decision curve analysis (DCA) indicated that the nomogram has outstanding clinical value.
Conclusions: This study developed a clinical radiomics model that uses radiomics features to identify PTB from CAP. This model provides valuable guidance to clinicians in identifying PTB.
Introduction
Tuberculosis is a chronic respiratory infection caused by Mycobacterium tuberculosis, among which pulmonary tuberculosis (PTB) is the most common, accounting for more than 80% of tuberculosis (Dheda et al., 2016; Drain et al., 2018). In general, the early symptoms of PTB are not obvious and often go unnoticed, thus accelerating the progress of the disease. Therefore, early diagnosis is crucial to the treatment of tuberculosis (Walzl et al., 2018). At present, the diagnosis of tuberculosis mainly depends on sputum smear and culture, and the gold standard for diagnosis is sputum bacteriological detection. However, bacteriological detection of sputum takes longer time, usually more than four weeks (Schito et al., 2015; Suárez et al., 2019). As a result, the source of infection cannot be controlled, leading to an increase in the incidence of tuberculosis and mortality. Secondary tuberculosis is the most common type of PTB in adults, and its imaging manifestations are varied and often confused with other pulmonary infections, especially community-acquired pneumonia (CAP) (Lyon and Rossman, 2017; Nachiappan et al., 2017).
CAP is pneumonia acquired outside a hospital. The most common pathogens are Streptococcus pneumoniae, Hemophilus Influenza, and atypical bacteria (e.g. Chlamydia pneumoniae, Mycoplasma pneumoniae, Legionella, and the virus). CAP often manifests as fever, cough, excessive phlegm, chest pain, dyspnea, tachypnea, and tachycardia. Secondary tuberculosis also has some of the same symptoms (Qi et al., 2021), but they are treated with different drugs (Modi and Kovacs, 2020; Peloquin and Davies, 2021). The incidences of PTB and CAP in the world is increasing year by year, and many patients are not treated in time, often resulting in serious complications. Therefore, a simple and noninvasive method to quickly distinguish PTB from CAP is necessary for later treatment of the disease.
Radiomics is a computational, noninvasive method for extracting quantitative features from images and transforming the information into a mineable database (Mayerhoefer et al., 2020). Radiomics can provide multitudes of information that cannot be found by the naked eye, and can sensitively judge the subtle changes of morphology and function in different parts of the lesion (Moon et al., 2019; Han et al., 2023). This approach has been widely used not only in lung cancer (He et al., 2020; Kirienko et al., 2021; Tunali et al., 2021), but now in COVID-19 as well (Bouchareb et al., 2021). but it is seldom studied in PTB and CAP.
Our study aims to develop a predictive nomogram based on computed tomography (CT) radiomics. It is used early to distinguish PTB from CAP so that these patients can receive timely treatment.
Method
Patients
We collected patients with pulmonary tuberculosis or community-acquired pneumonia from June 2018 to May 2023 from three medical centres. There were 195 PTB patients and 163 CAP patients who met the inclusion and exclusion criteria. Clinical characteristics collected included sex, age, white blood cell count (WBC), neutrophil ratio (NEUT%), neutrophil to lymphocyte ratio (LYMPH%), C-reactive protein (CRP), Hemoglobin (HGB), platelets (PLT), albumin (ALB), glucose (GLU), T-SPOT result, fever (body temperature ≥37.3°C), cough, expectoration, and hemoptysis. This retrospective study was approved by the Research Ethics Committee of the First Affiliated Hospital of Anhui Medical University (Hospital I), Hefei Second People’s Hospital (Hospital II) and the First Affiliated Hospital of Soochow University (Hospital III).
Inclusion criteria
1.Patients with PTB and CAP, and CT imaging data before anti-tuberculosis and anti-infective treatment; 2. The CT imaging data is clear and can be extracted for interpretation. 3. There was no complication of respiratory diseases with pulmonary imaging features (such as lung cancer, interstitial lung disease, and so on).
Exclusion criteria
1. Under 18 years of age; 2. Insufficient clinical information to provide; 3. CT showed no obvious lung lesions.
Diagnostic criteria for patients with PTB
Patients with PTB were diagnosed with having a positive smear or tuberculosis culture in at least one respiratory tract sample (sputum or alveolar lavage fluid or lung puncture fluid).
Diagnostic criteria for patients with CAP
Adults over 18 years of age with clinical signs suggestive of CAP, acquired outside the hospital or less than 48 hours after admission, meet CAP criteria (Cao et al., 2018).
CT examinations
All enrolled patients underwent plain chest CT scans before antibiotic or anti tuberculous medication. The CT scanning equipment and parameters of the three hospitals are shown in supplementary document Supplementary Table S1. Scan range from the apex of both lungs to the bottom of the lungs. All chest CT parameters were fixed according to the guidelines of the CT scanning protocol.
CT image segmentation and radiomic feature extraction
A radiologist with 10 years of experience in radiology used ITK-SNAP 3.8.0 (ITK-SNAP Home (itksnap.org)) manually segmented the lung window of all CT images. The same window parameters were selected for all CT images (window width 2000HU, window level-400HU). Because of the diffuse and multiple manifestations of inflammatory lesions, it is difficult to accurately delineate all lesions. Therefore, we selected the maximum level of ground-glass attenuation and outlined all the lesions in this level as a volume of interest (VOI), then sketch layer by layer to form the 3D VOI. Another radiologist with more than 10 years of experience reviewed the imaging features of the lesion as well as the VOI. The two radiologists worked independently. The consistency and repeatability of the results were evaluated by inter-class and intra-class correlation coefficients (ICCs). The higher the ICC value, the higher the reproducibility. Features with ICC below 0.75 are considered to have poor feature consistency, so they will be removed. Before extracting radiomic features, all images were resampled and image normalized to achieve zero mean and unit variance (Zhu et al., 2021; Yang et al., 2022). All radiomics features were extracted from VOIs using PyRadiomics (van Griethuysen et al., 2017).
Radiomic signature construction
First, the dataset of hospital I and hospital II is randomly assigned to the training and testing cohort in a 8:2 ratio, and the dataset of hospital III is validation cohort. The training cohort is used to predict the model. The testing cohort and validation cohort are used to independently evaluate the performance of the model. Finally, Z-score is used to standardize the training cohort data, and use it to normalize the test and validation cohorts. Then, the features with ICCs >0.75 were retained, and the features with P <0.05 were screened by univariate logistic analysis. A least absolute shrinkage and selection operator (LASSO) and multivariate logistic analysis were used for further screening, and independent risk predictors were retained (P <0.05). Finally, Radscore was calculated by using the formula based on radiomics characteristics. We used the support vector machine (SVM) algorithm to construct the radiomics prediction model. SVM is a large-margin classification model. Its basic model is a linear classifier defined in the feature space with the maximum interval (Valkenborg et al., 2023).
Construction of the clinical model
Univariate analysis was performed according to the included clinical characteristics with CAP and PTB in training cohort. Multivariate logistic regression analysis was performed for the clinical factors with P < 0.05. The clinical model was predicted according to the results of multivariate logistic regression analysis (P < 0.05) and variance inflation factor.
Establishment of a clinical radiomics conjoint nomogram
The clinical radiomics conjoint nomogram was constructed by combining the clinical factors related to the clinical model with Radscore in the radiomics model. receiver operating characteristic (ROC) curve and Decision curve analysis (DCA) were used to compare the diagnostic and predictive performance of the clinical model, radiomics model, and clinical radiomics conjoint model in the training and test cohorts.
Statistical analyses
All radiomics analyses were conducted using Python version 3.5.6. Statistical analysis was performed using R 4.1.2 (R: The R Project for Statistical Computing (r-project.org)). Continuous variables with normal distribution were expressed as mean ± standard deviation. Data that are not normally distributed were expressed as median (range interquartile) and analyzed using the rank-sum test. Independent samples t-test or Mann-Whitney U test were used to compare continuous variables. The Chi-square test or Fisher exact test was used for categorical variables. A two-sided p-value < 0.05 was used to indicate statistical significance.
Results
Basic clinical characteristics
After the screening, a total of 358 patients were included in this study, including 195 PTB patients and 163 CAP patients. Among them, 170 patients were trained, 73 patients were tested and 115 patients were verified. The study flow diagram is shown in Supplementary Figure S1. Table 1 shows the clinical features of patients. In the all cohort, univariate and multivariate logistic regression showed that T-SPOT.TB result (P < 0.001) and fever (P < 0.001) were two independent predictors in the clinical model (Supplementary Table S2).
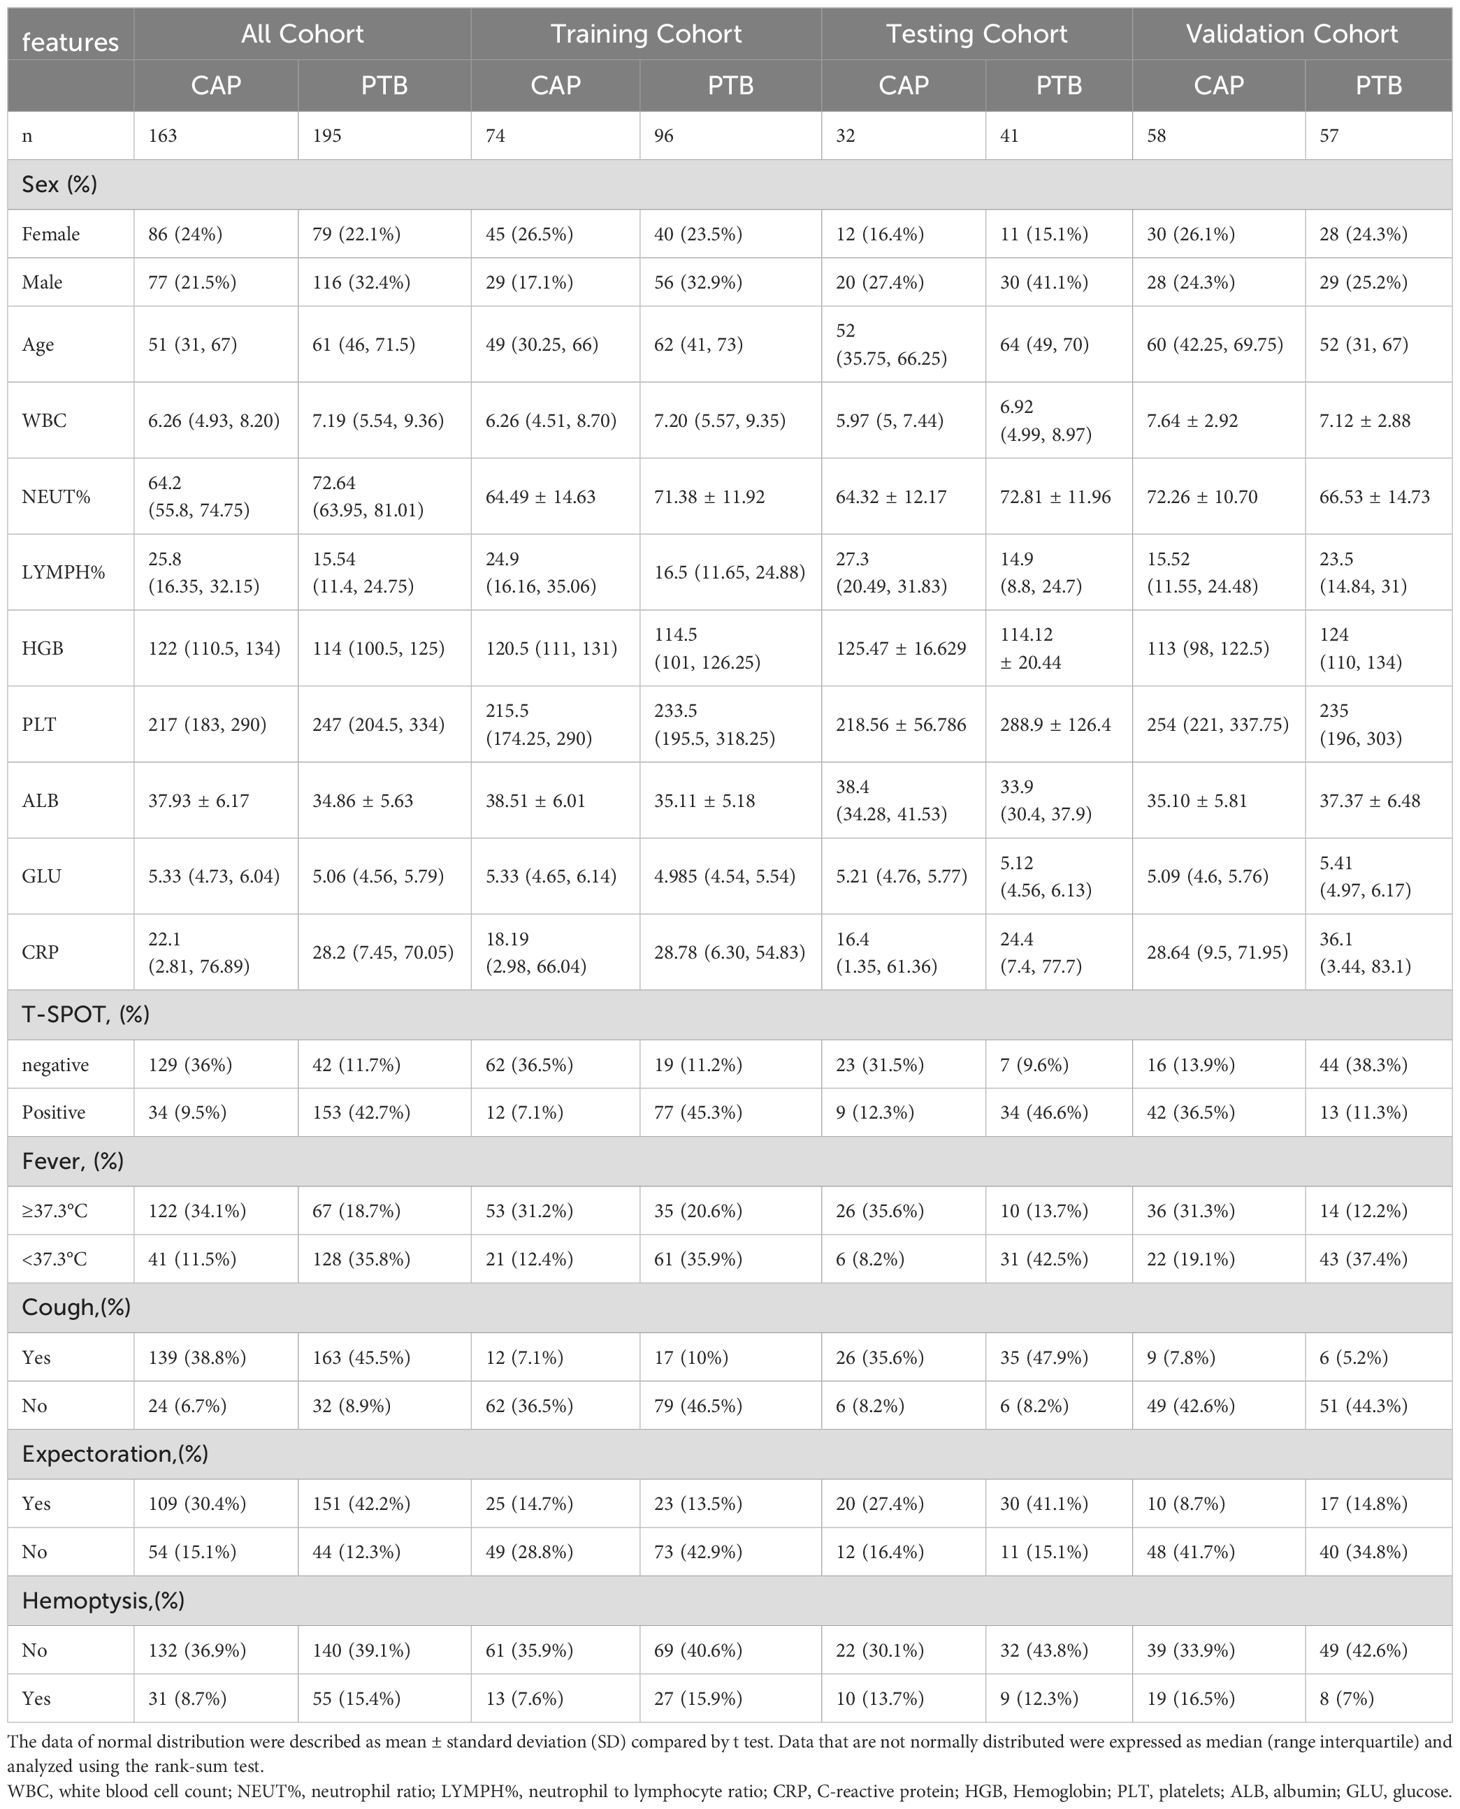
Table 1. Clinical features of Patients with PTB and CAP.
Constructed radiomics model
A total of 1557 radiomics features were extracted from each VOI, and a total of 12 different features were screened out by LASSO (Table 2). The details of the radiomics feature screening process are shown in Figure 1. The Radscore formula showed in Appendix S1.

Table 2. Radiomic Features Selection from the CT in the Training Cohort.
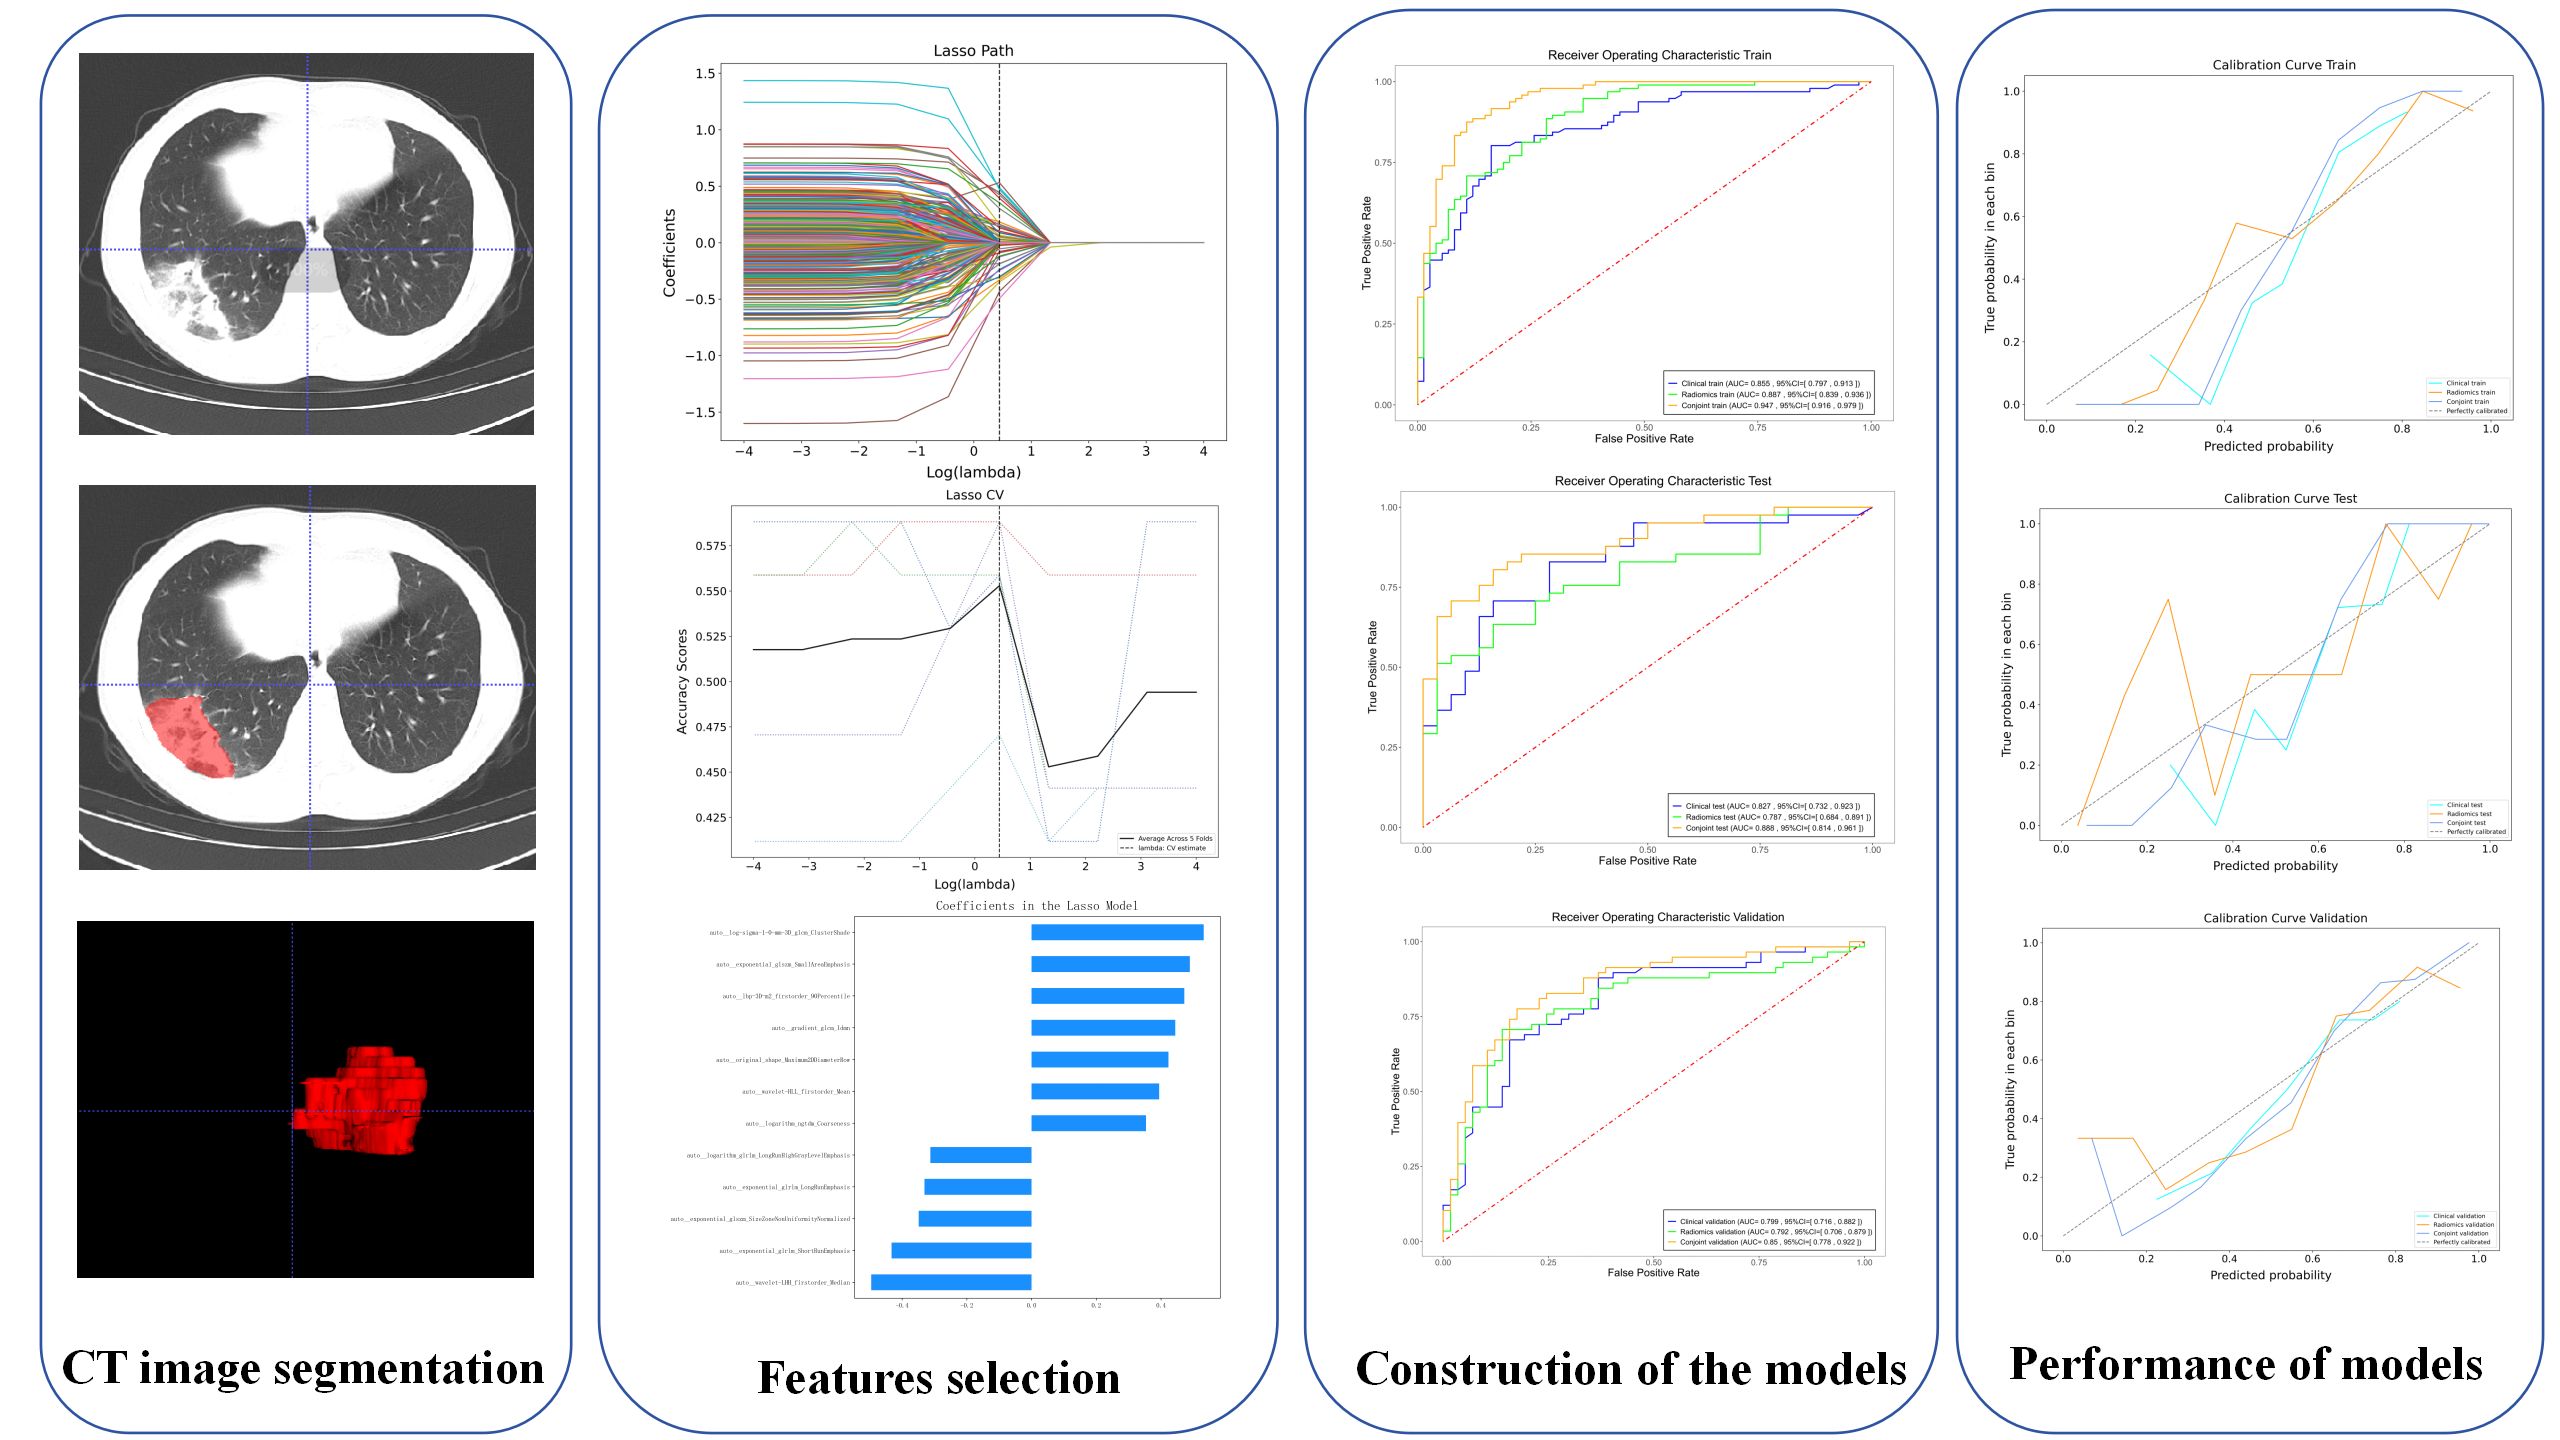
Figure 1. The radiomics flow chart of the study.
In the identification of PTB and CAP in radiomics model, the AUC of the training cohort was 0.887 (95%CI: 0.839- 0.936), the AUC of the testing cohort was 0.787 (95%CI:0.684-0.891) and the AUC of the validation cohort was 0.792 (95%CI:0.706-0.879) (Figure 2).
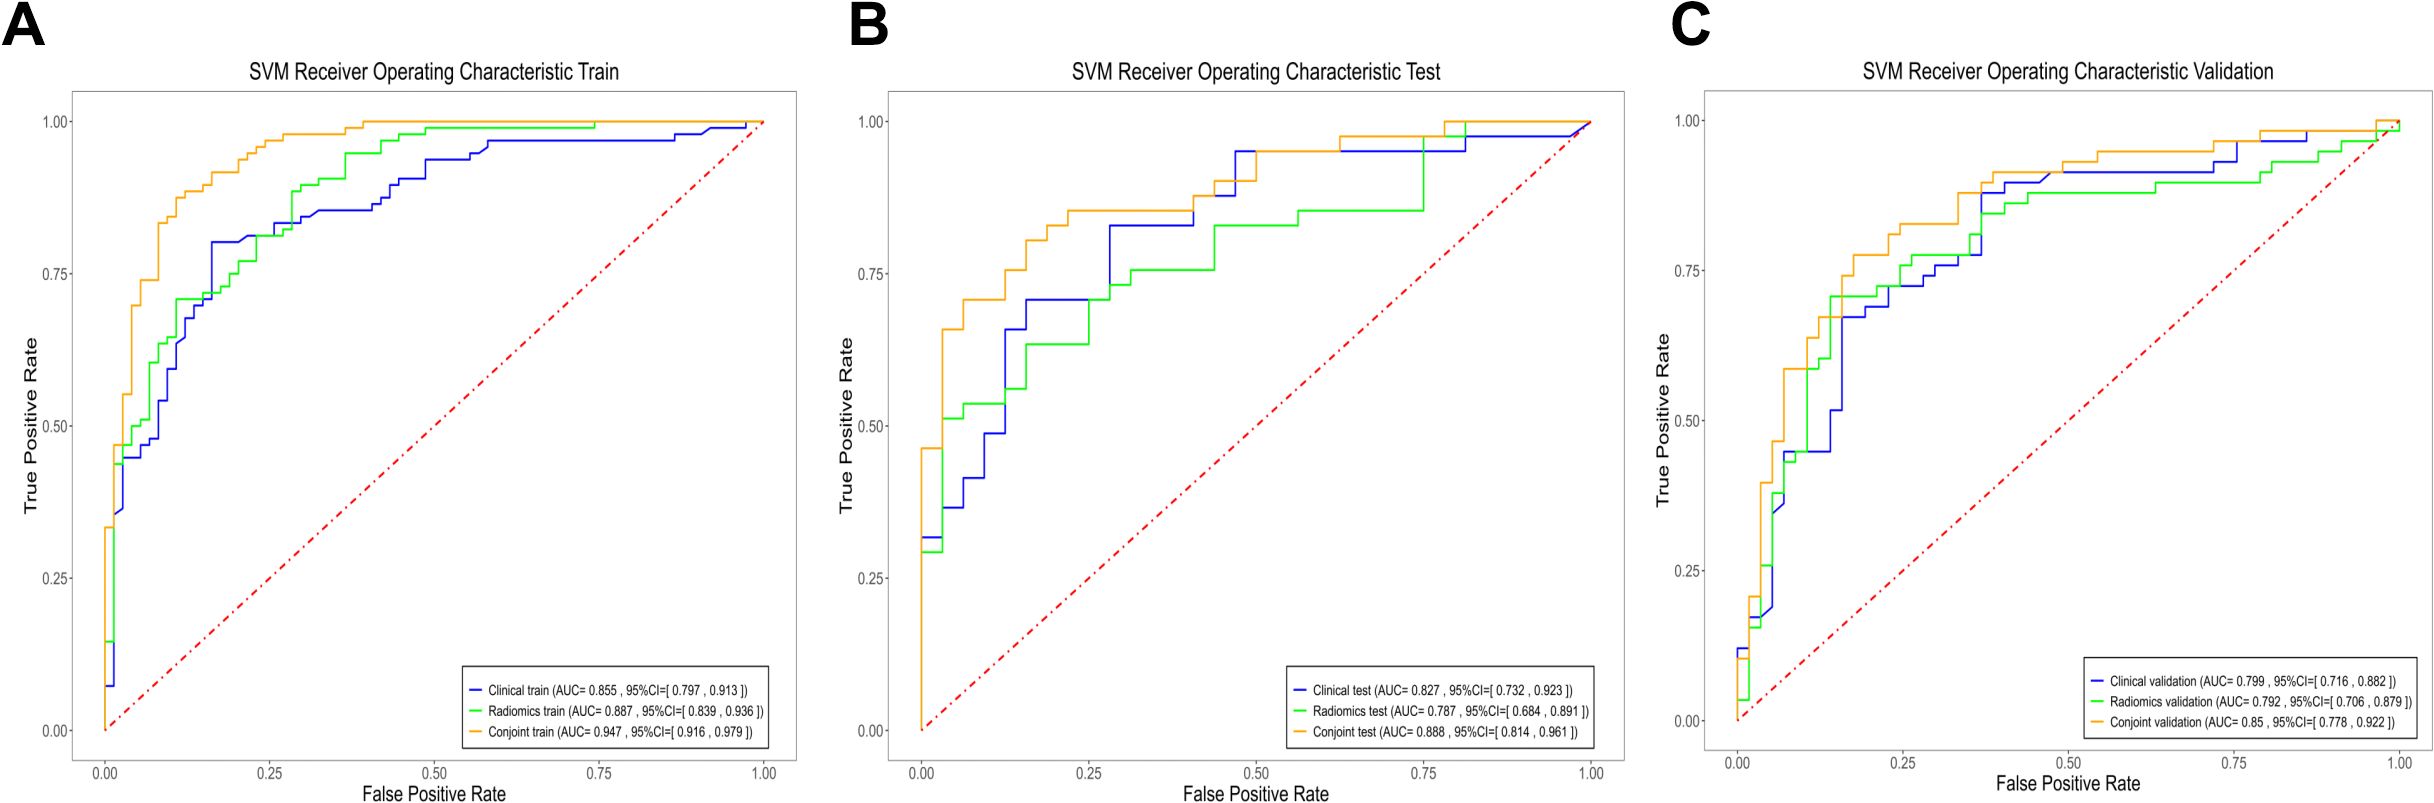
Figure 2. The ROC curves of the three models. (A) Three models of ROC curves in the training cohort. (B) Three models of ROC curves in the testing cohort. (C) Three models of ROC curves in the validation cohort.
Establishment of a clinical radiomics conjoint nomogram
Based on the data of the training cohort, a clinical radiomics conjoint nomogram was established combined with the radiomics score, T-SPOT result, and fever, as shown in Figure 3. The C index of the nomogram is 0.955 (95%CI, 0.926 - 0.984).
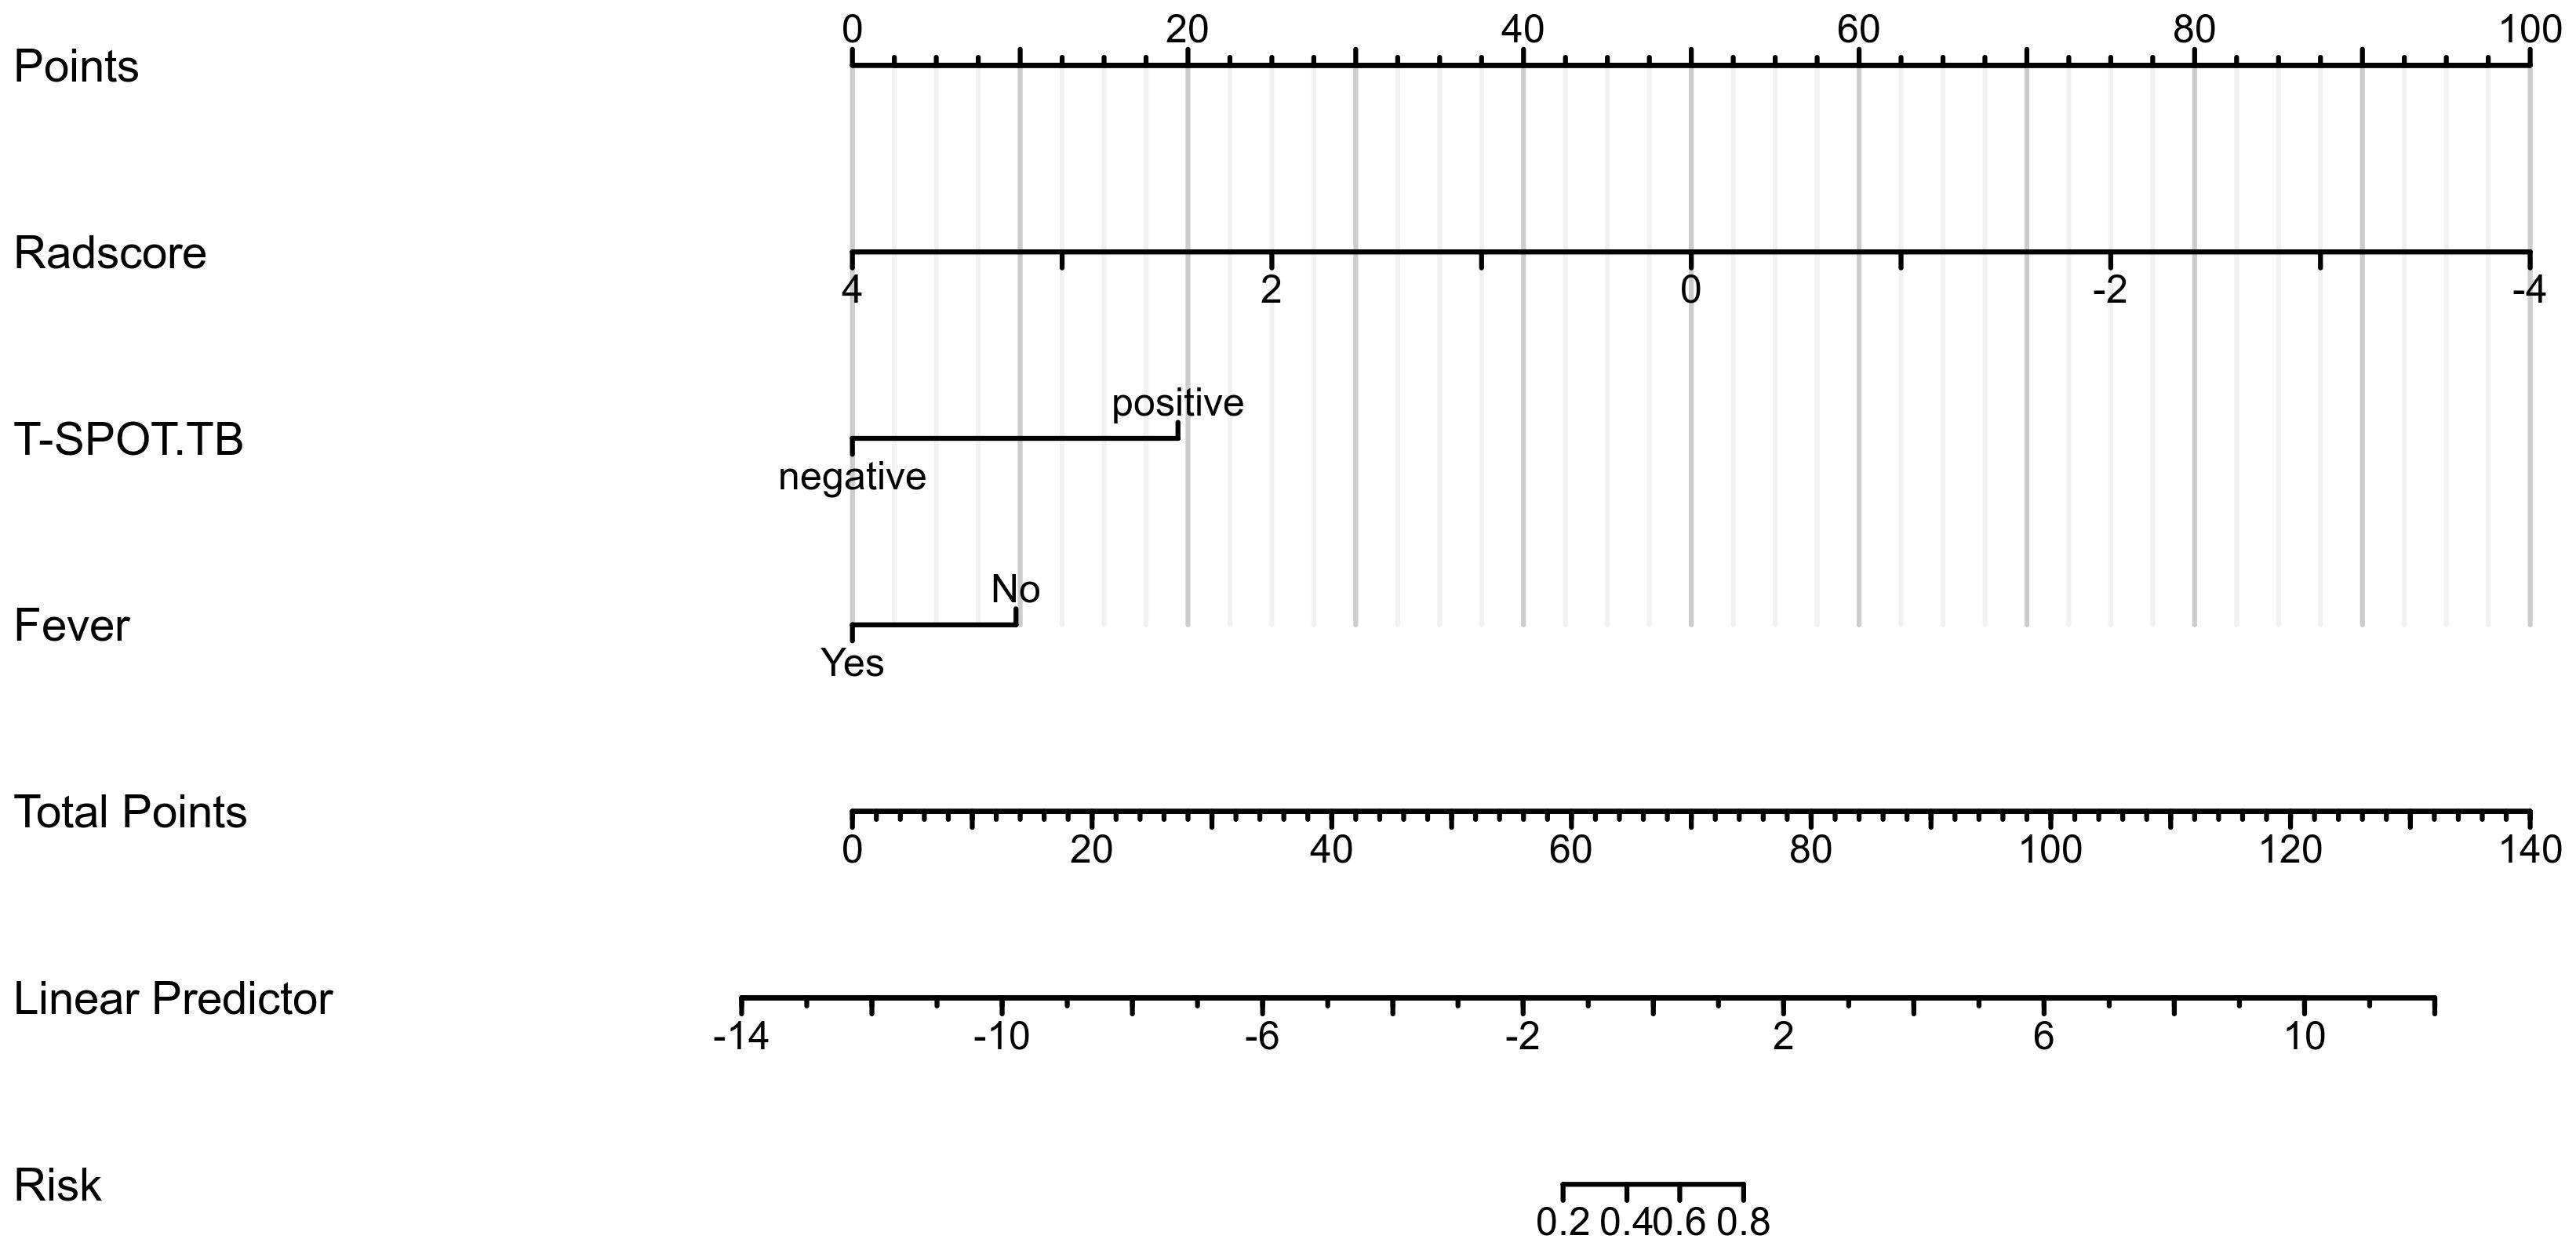
Figure 3. The clinical radiomics conjoint nomogram.
Assessment of the performance of the established model
The results showed that the predictive nomogram had an outstanding ability to discriminate between the two diseases, with an AUC of 0.947 (95%CI, 0.916-0.979) on the training cohort, 0.888 (95%CI, 0.814-0.961) on the testing cohort and 0.850 (95%CI, 0.778-0.922) on the validation cohort. The discriminative power of the clinical model, radiomics model, and clinical radiomics model in the training and test cohorts is shown in Figure 3. The results showed that the clinical radiomics conjoint model was superior to the clinical model and the radiomics model. The calibration curve and precision-recall curve of the three models in the training cohort, test cohort and validation cohort are shown in Figure 4. Table 3 provides a summary of the sensitivity, specificity, accuracy, positive predictive value, negative predictive value, false negative rate, false discovery rate, and false positives rate for all three models across the three cohort.
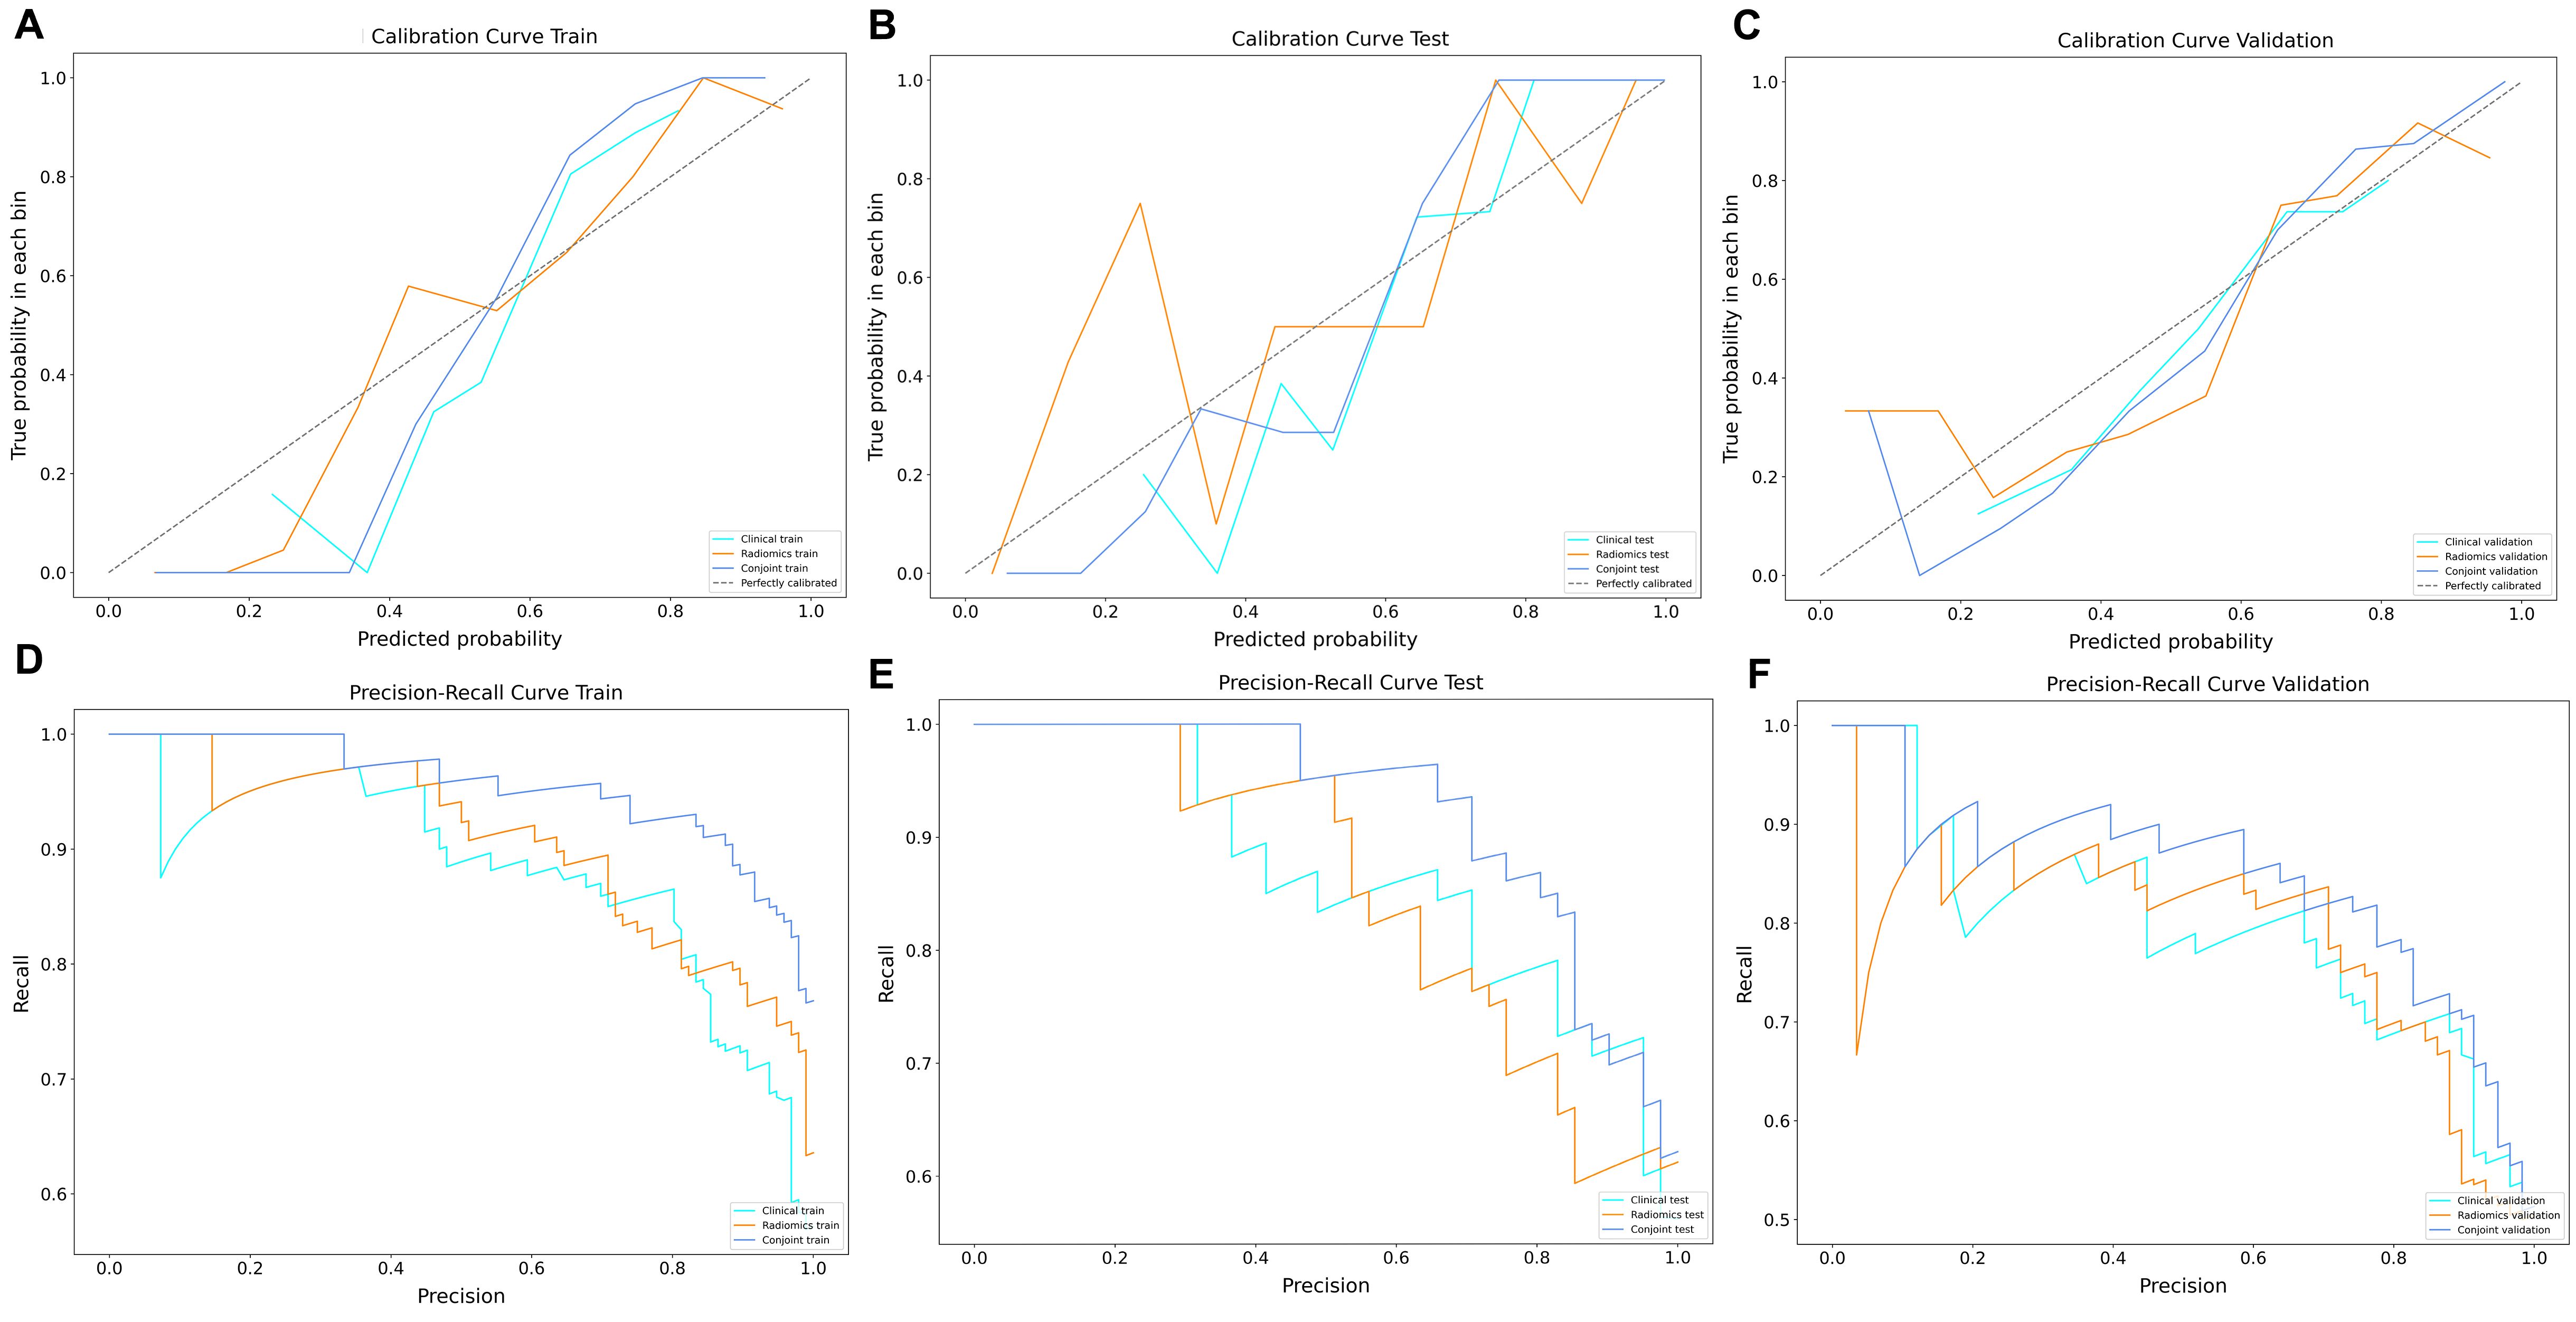
Figure 4. The decision curve and precision-recall curve analysis for three models. (A) Three models of decision curve in the training cohort. (B) Three models of decision curve in the testing cohort. (C) Three models of decision curve in the validation cohort. (D) Three models of precision-recall curve in the training cohort. (E) Three models of precision-recall curve in the testing cohort. (F) Three models of precision-recall curve in the validation cohort.
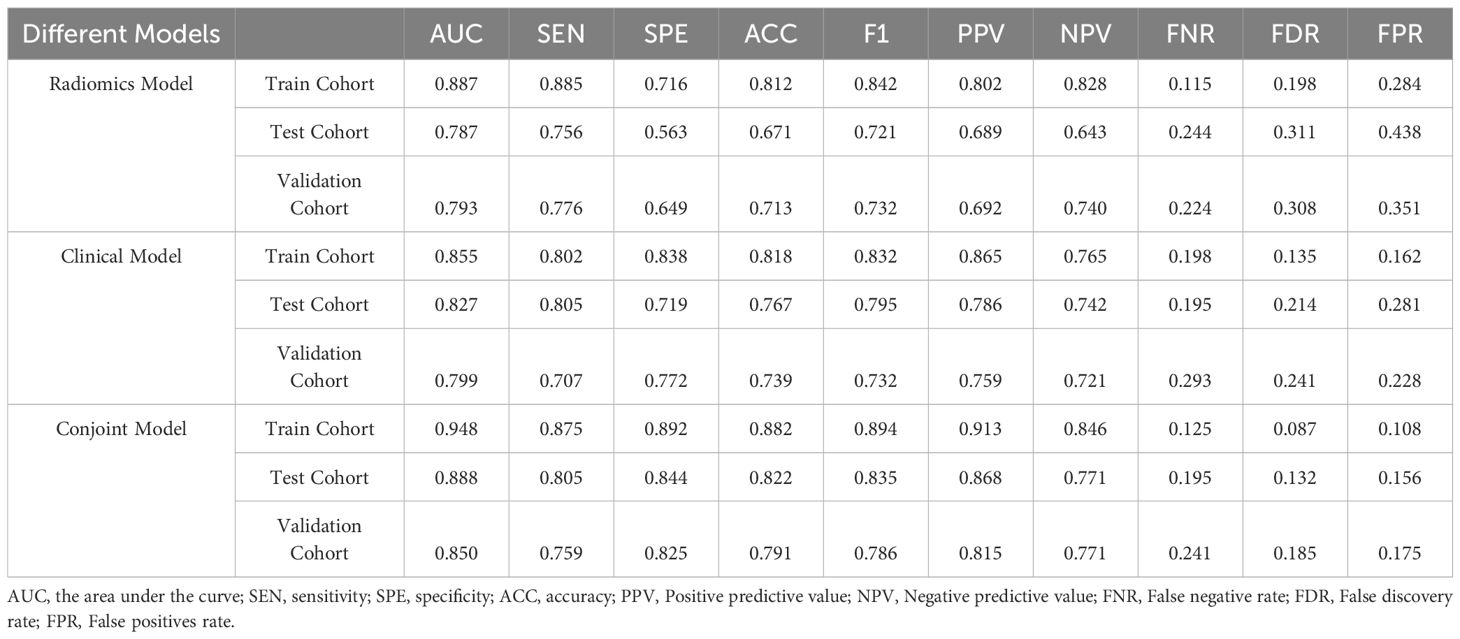
Table 3. Performance of the Clinical Model, Radiomics Model, and Clinical Model in the Training Cohort, Test Cohort and validation Cohort.
Discussion
At present, the clinical manifestations and CT imaging manifestations of PTB and CAP are similar. Clinically, it is difficult to distinguish between these two diseases. Previous studies have shown that solitary pulmonary tuberculosis and lung cancer can be effectively distinguished by combining CT imaging features and clinical variables (Yang et al., 2018; Feng et al., 2020; Hu et al., 2021). However, there are few studies on using radiomics to identify PTB from CAP. Our study used the methods to develop a model to more accurately identify PTB from CAP. Our results show that radiomic features can accurately differentiate between these two diseases both in a training and test cohort. Clinical radiomics nomogram can further improve its prediction efficiency, and DCA confirmed its clinical application value.
China is a region with high incidence of PTB, and the clinical manifestations of PTB are very similar to those of CAP. Moreover, CT findings of PTB are varied (Skoura et al., 2015). Typical CT findings include central lobular nodules, cavities, calcification, and caseous necrosis (Wang et al., 2021). However, an increasing number of patients with PTB have atypical manifestations, often presenting only as lung consolidation or ground glass shadow, which is easily confused with CAP (Yeh et al., 2014; Zeng et al., 2021). But the treatment is completely different. Clinically, the failure to identify PTB patients and CAP patients at an early stage is often one of the causes of tuberculosis transmission.
To distinguish PTB from CAP, we observed in univariate analysis of clinical characteristics that male, T-SPOT positivity, absence of fever, hemoptysis, and increased lymphocyte percentage were more common in patients with tuberculosis, consistent with previous findings (Jolobe, 2012; Yoon et al., 2013; Cavallazzi et al., 2014b; Cavallazzi et al., 2014a). Multivariate logistic analysis showed that among clinical factors, T-SPOT results and fever could be used as independent predictors to distinguish these two diseases. The T-SPOT assay is an interferon (IFN)-γ release assay. It is based on detecting secreted IFN-γ in M. tuberculosis-specific T-cells stimulated by Mycobacterium-specific antigens (Ma et al., 2019). Previous studies have shown that T-SPOT results have some power in the diagnosis of active pulmonary tuberculosis, but results are also affected by the state of the subjects (Zhu et al., 2014; Uda et al., 2020). Fever, especially hyperpyrexia, is more common in patients with CAP. Patients with PTB usually present with low-grade fever or even most do not present with fever (Chon et al., 2013), which is consistent with our findings. But on the whole, the clinical manifestations of the two diseases are similar, but the drugs used for treatment are different.
Our results revealed 12 radiomic features that differed significantly between PTB and CAP. These features typically capture texture variations to quantify the spatial relationships of voxels in an image (Pantic et al., 2014; Rios Velazquez et al., 2017). It is difficult for radiologists’ eyes alone to find these changes, so radiomic features can pick up subtle changes that are not discernible to the naked eye.
Therefore, we combined T-SPOT results and fever with the Radscore of 12 radiomics features selected by us to establish a clinical radiomics conjoint model in the training cohort. At the same time, the performance of the model is verified in the test cohort and the validation cohort respectively. The results showed that the clinical radiomics conjoint model is more advantages than the single radiomics model and clinical model. This indicates that the application of the clinical radiomics model is an efficient method that can help clinicians accurately distinguish PTB from CAP at an early stage.
There are some limitations in our study. First, this study is a retrospective study, and the error caused by confounding factors cannot be controlled. Secondly, although the study included three different medical centers, the overall sample size was small. Finally, the nomogram works best with linear models. If the model was complicated and non-linear, a standard nomogram would result in error. Therefore, we look forward to conducting a large prospective study to validate our preliminary results.
Conclusions
In conclusion, this study developed a clinical radiomics conjoint model that uses radiomics features to identify PTB from CAP. Compared with the single radiomics model and clinical model, this model is more accurate, sensitive and specific. This model is of great value for the early detection, diagnosis and treatment of PTB.
Data availability statement
The original contributions presented in the study are included in the article/Supplementary Material. Further inquiries can be directed to the corresponding authors.
Ethics statement
This retrospective study was approved by the Research Ethics Committee of the First Affiliated Hospital of Anhui Medical University, Hefei Second People’s Hospital and the First Affiliated Hospital of Soochow University. The studies were conducted in accordance with the local legislation and institutional requirements. The ethics committee/institutional review board waived the requirement of written informed consent for participation from the participants or the participants’ legal guardians/next of kin because this was a retrospective study, and the ethics Committee exempted informed consent.
Author contributions
PL: Conceptualization, Writing – original draft. JW: Investigation, Writing – original draft. ML: Data curation, Formal Analysis, Investigation, Methodology, Writing – original draft. MT: Conceptualization, Data curation, Validation, Writing – review & editing. RH: Formal Analysis, Methodology, Writing – review & editing. SZ: Investigation, Resources, Supervision, Writing – review & editing. XW: Formal Analysis, Investigation, Resources, Writing – review & editing. RW: Formal Analysis, Investigation, Writing – original draft.
Funding
The author(s) declare financial support was received for the research, authorship, and/or publication of this article. This research was supported by Young Jianghuai famous medical training project, Research Fund project of Anhui Medical University (2023xkj144), Excellent physician Training program of Anhui Medical University, Construction projects of key disciplines in Hefei (Occupational medicine), Health Research Project of Anhui Province(AHWJ2023A30009) and the Applied Medical Research Project of Hefei Health Commission (Hwk2021zd008, Hwk2022zd013) and Research Fund of Anhui Institute of translational medicine (2023zhyx-C40).
Acknowledgments
Thanks for help from the First Affiliated Hospital of Soochow University.
Conflict of interest
The authors declare that the research was conducted in the absence of any commercial or financial relationships that could be construed as a potential conflict of interest.
Publisher’s note
All claims expressed in this article are solely those of the authors and do not necessarily represent those of their affiliated organizations, or those of the publisher, the editors and the reviewers. Any product that may be evaluated in this article, or claim that may be made by its manufacturer, is not guaranteed or endorsed by the publisher.
Supplementary material
The Supplementary Material for this article can be found online at: https://www.frontiersin.org/articles/10.3389/fcimb.2024.1388991/full#supplementary-material
References
Bouchareb, Y., Moradi Khaniabadi, P., Al Kindi, F., Al Dhuhli, H., Shiri, I., Zaidi, H., et al. (2021). Artificial intelligence-driven assessment of radiological images for COVID-19. Comput. Biol. Med. 136, 104665. doi: 10.1016/j.compbiomed.2021.104665
Cao, B., Huang, Y., She, D. Y., Cheng, Q. J., Fan, H., Tian, X. L., et al. (2018). Diagnosis and treatment of community-acquired pneumonia in adults: 2016 clinical practice guidelines by the Chinese Thoracic Society, Chinese Medical Association. Clin. Respir. J. 12, 1320–1360. doi: 10.1111/crj.2018.12.issue-4
Cavallazzi, R., Wiemken, T., Christensen, D., Peyrani, P., Blasi, F., Levy, G., et al. (2014a). Predicting Mycobacterium tuberculosis in patients with community-acquired pneumonia. Eur. Respir. J. 43, 178–184. doi: 10.1183/09031936.00017813
Cavallazzi, R., Wiemken, T., Ramirez, J. (2014b). Risk factors for pulmonary tuberculosis in community-acquired pneumonia. Eur. Respir. J. 43, 1214. doi: 10.1183/09031936.00167113
Chon, S. B., Kim, T. S., Oh, W. S., Lee, S. J., Han, S. S., Kim, W. J. (2013). Pulmonary tuberculosis among patients hospitalised with community-acquired pneumonia in a tuberculosis-prevalent area. Int. J. Tuberculosis. Lung Dis. 17, 1626–1631.
Dheda, K., Barry, C. E., 3rd, Maartens, G. (2016). Tuberculosis. Lancet (London. England). 387, 1211–1226. doi: 10.1016/S0140-6736(15)00151-8
Drain, P. K., Bajema, K. L., Dowdy, D., Dheda, K., Naidoo, K., Schumacher, S. G., et al. (2018). Incipient and subclinical tuberculosis: a clinical review of early stages and progression of infection. Clin. Microbiol. Rev. 31, e00021–e00018. doi: 10.1128/CMR.00021-18
Feng, B., Chen, X., Chen, Y., Lu, S., Liu, K., Li, K., et al. (2020). Solitary solid pulmonary nodules: a CT-based deep learning nomogram helps differentiate tuberculosis granulomas from lung adenocarcinomas. Eur. Radiol. 30, 6497–6507. doi: 10.1007/s00330-020-07024-z
Han, R., Huang, L., Zhou, S., Shen, J., Li, P., Li, M., et al. (2023). Novel clinical radiomic nomogram method for differentiating Malignant from non-malignant pleural effusions. Heliyon 9, e18056. doi: 10.1016/j.heliyon.2023.e18056
He, B., Dong, D., She, Y., Zhou, C., Fang, M., Zhu, Y., et al. (2020). Predicting response to immunotherapy in advanced non-small-cell lung cancer using tumor mutational burden radiomic biomarker. J. Immunother. Cancer 8, jitc–2020-000550. doi: 10.1136/jitc-2020-000550
Hu, Y., Zhao, X., Zhang, J., Han, J., Dai, M. (2021). Value of (18)F-FDG PET/CT radiomic features to distinguish solitary lung adenocarcinoma from tuberculosis. Eur. J. Nucl. Med. Mol. Imaging 48, 231–240. doi: 10.1007/s00259-020-04924-6
Jolobe, O. M. (2012). Pulmonary tuberculosis in the differential diagnosis of community-acquired pneumonia. Eur. Respir. J. 40, 279. doi: 10.1183/09031936.00004312
Kirienko, M., Sollini, M., Corbetta, M., Voulaz, E., Gozzi, N., Interlenghi, M., et al. (2021). Radiomics and gene expression profile to characterise the disease and predict outcome in patients with lung cancer. Eur. J. Nucl. Med. Mol. Imaging 48, 3643–3655. doi: 10.1007/s00259-021-05371-7
Lyon, S. M., Rossman, M. D. (2017). Pulmonary tuberculosis. Microbiol. Spectr. 5, TNMI7–0032-2016. doi: 10.1128/microbiolspec
Ma, Y., Li, R., Shen, J., He, L., Li, Y., Zhang, N., et al. (2019). Clinical effect of T-SPOT.TB test for the diagnosis of tuberculosis. BMC Infect. Dis. 19, 993. doi: 10.1186/s12879-019-4597-8
Mayerhoefer, M. E., Materka, A., Langs, G., Häggström, I., Szczypiński, P., Gibbs, P., et al. (2020). Introduction to radiomics. J. Nucl. Med. 61, 488–495. doi: 10.2967/jnumed.118.222893
Modi, A. R., Kovacs, C. S. (2020). Community-acquired pneumonia: Strategies for triage and treatment. Cleveland. Clin. J. Med. 87, 145–151. doi: 10.3949/ccjm.87a.19067
Moon, S. H., Kim, J., Joung, J. G., Cha, H., Park, W. Y., Ahn, J. S., et al. (2019). Correlations between metabolic texture features, genetic heterogeneity, and mutation burden in patients with lung cancer. Eur. J. Nucl. Med. Mol. Imaging 46, 446–454. doi: 10.1007/s00259-018-4138-5
Nachiappan, A. C., Rahbar, K., Shi, X., Guy, E. S., Mortani Barbosa, E. J., Jr., Shroff, G. S., et al. (2017). Pulmonary tuberculosis: role of radiology in diagnosis and management. Radiograph.: Rev. Publ. Radiol. Soc. North America. Inc. 37, 52–72. doi: 10.1148/rg.2017160032
Pantic, I., Dacic, S., Brkic, P., Lavrnja, I., Pantic, S., Jovanovic, T., et al. (2014). Application of fractal and grey level co-occurrence matrix analysis in evaluation of brain corpus callosum and cingulum architecture. Microscopy. Microanalysis. 20, 1373–1381. doi: 10.1017/S1431927614012811
Peloquin, C. A., Davies, G. R. (2021). The treatment of tuberculosis. Clin. Pharmacol. Ther. 110, 1455–1466. doi: 10.1002/cpt.v110.6
Qi, M., Li, P. J., Wang, Y., Liang, Z. A. (2021). Clinical features of atypical tuberculosis mimicking bacterial pneumonia. Open Med. (Warsaw. Poland). 16, 1608–1615. doi: 10.1515/med-2021-0349
Rios Velazquez, E., Parmar, C., Liu, Y., Coroller, T. P., Cruz, G., Stringfield, O., et al. (2017). Somatic Mutations Drive Distinct Imaging Phenotypes in Lung Cancer. Cancer Res. 77, 3922–3930. doi: 10.1158/0008-5472.CAN-17-0122
Schito, M., Migliori, G. B., Fletcher, H. A., McNerney, R., Centis, R., D’Ambrosio, L., et al. (2015). Perspectives on advances in tuberculosis diagnostics, drugs, and vaccines. Clin. Infect. Dis. 61Suppl 3, S102–S118. doi: 10.1093/cid/civ609
Skoura, E., Zumla, A., Bomanji, J. (2015). Imaging in tuberculosis. Int. J. Infect. Dis.: IJID. 32, 87–93. doi: 10.1016/j.ijid.2014.12.007
Suárez, I., Fünger, S. M., Kröger, S., Rademacher, J., Fätkenheuer, G., Rybniker, J. (2019). The diagnosis and treatment of tuberculosis. Deutsches. Arzteblatt. Int. 116, 729–735. doi: 10.3238/arztebl.2019.0729
Tunali, I., Gillies, R. J., Schabath, M. B. (2021). Application of radiomics and artificial intelligence for lung cancer precision medicine. Cold Spring Harbor Perspect. Med. 11, a039537. doi: 10.1101/cshperspect.a039537
Uda, S., Ono, S., Yuba, T., Tachibana, Y., Goda, S., Matsuyama, A., et al. (2020). Clinical features in active tuberculosis patients with effects on T-SPOT.TB assay results. Infect. Dis. (London. England). 52, 58–60. doi: 10.1080/23744235.2019.1663363
Valkenborg, D., Rousseau, A. J., Geubbelmans, M., Burzykowski, T. (2023). Support vector machines. Am. J. Orthod. Dentofacial. Orthop. 164, 754–757. doi: 10.1016/j.ajodo.2023.08.003
van Griethuysen, J. J. M., Fedorov, A., Parmar, C., Hosny, A., Aucoin, N., Narayan, V., et al. (2017). Computational radiomics system to decode the radiographic phenotype. Cancer Res. 77, e104–e107. doi: 10.1158/0008-5472.CAN-17-0339
Walzl, G., McNerney, R., du Plessis, N., Bates, M., McHugh, T. D., Chegou, N. N., et al. (2018). Tuberculosis: advances and challenges in development of new diagnostics and biomarkers. Lancet Infect. Dis. 18, e199–e210. doi: 10.1016/S1473-3099(18)30111-7
Wang, Y., Shang, X., Wang, L., Fan, J., Tian, F., Wang, X., et al. (2021). Clinical characteristics and chest computed tomography findings related to the infectivity of pulmonary tuberculosis. BMC Infect. Dis. 21, 1197. doi: 10.1186/s12879-021-06901-2
Yang, X., He, J., Wang, J., Li, W., Liu, C., Gao, D., et al. (2018). CT-based radiomics signature for differentiating solitary granulomatous nodules from solid lung adenocarcinoma. Lung Cancer (Amsterdam. Netherlands). 125, 109–114. doi: 10.1016/j.lungcan.2018.09.013
Yang, F., Zhang, J., Zhou, L., Xia, W., Zhang, R., Wei, H., et al. (2022). CT-based radiomics signatures can predict the tumor response of non-small cell lung cancer patients treated with first-line chemotherapy and targeted therapy. Eur. Radiol. 32, 1538–1547. doi: 10.1007/s00330-021-08277-y
Yeh, J. J., Chen, S. C., Chen, C. R., Yeh, T. C., Lin, H. K., Hong, J. B., et al. (2014). A high-resolution computed tomography-based scoring system to differentiate the most infectious active pulmonary tuberculosis from community-acquired pneumonia in elderly and non-elderly patients. Eur. Radiol. 24, 2372–2384. doi: 10.1007/s00330-014-3279-6
Yoon, N. B., Son, C., Um, S. J. (2013). Role of the neutrophil-lymphocyte count ratio in the differential diagnosis between pulmonary tuberculosis and bacterial community-acquired pneumonia. Ann. Lab. Med. 33, 105–110. doi: 10.3343/alm.2013.33.2.105
Zeng, Y., Zhai, X. L., Wáng, Y. X. J., Gao, W. W., Hu, C. M., Lin, F. S., et al. (2021). Illustration of a number of atypical computed tomography manifestations of active pulmonary tuberculosis. Quantitative. Imaging Med. Surg. 11, 1651–1667. doi: 10.21037/qims-20-1323
Zhu, C., Liu, Z., Li, Z., Mei, S., Hu, Z. (2014). The performance and limitation of T-SPOT.TB for the diagnosis of TB in a high prevalence setting. J. Thorac. Dis. 6, 713–719. doi: 10.3978/j.issn.2072-1439.2014.04.38
Keywords: pulmonary tuberculosis, community-acquired pneumonia, computed tomography, radiomics, nomogram
Citation: Li P, Wang J, Tang M, Li M, Han R, Zhou S, Wu X and Wang R (2024) A CT-based radiomics predictive nomogram to identify pulmonary tuberculosis from community-acquired pneumonia: a multicenter cohort study. Front. Cell. Infect. Microbiol. 14:1388991. doi: 10.3389/fcimb.2024.1388991
Received: 20 February 2024; Accepted: 30 August 2024;
Published: 19 September 2024.
Edited by:
Nahed Ismail, University of Illinois Chicago, United StatesReviewed by:
Khashayar Namdar, University of Toronto, CanadaZhaoming Li, First Affiliated Hospital of Zhengzhou University, China
Copyright © 2024 Li, Wang, Tang, Li, Han, Zhou, Wu and Wang. This is an open-access article distributed under the terms of the Creative Commons Attribution License (CC BY). The use, distribution or reproduction in other forums is permitted, provided the original author(s) and the copyright owner(s) are credited and that the original publication in this journal is cited, in accordance with accepted academic practice. No use, distribution or reproduction is permitted which does not comply with these terms.
*Correspondence: Sijing Zhou, emhvdXNpamluZ0B5ZWFoLm5ldA==; Xingwang Wu, d3V4aW5nd2FuZ2FobXVAMTYzLmNvbQ==; Ran Wang, d2FuZ3JhbkBhaG11LmVkdS5jbg==
†These authors have contributed equally to this work