 Jingwen Zhou
 Huanqiang Zhao
 Han Yang
 Chunyan He
 Wen Shu
 Zelin Cui1
 Qingzhong Liu
- 1Department of Clinical Laboratory, Shanghai General Hospital, Shanghai Jiaotong University School of Medicine, Shanghai, China
- 2Obstetrics and Gynaecology Hospital, Fudan University, Shanghai, China
- 3The Shanghai Key Laboratory of Female Reproductive Endocrine-Related Diseases, Shanghai, China
- 4Department of Clinical Laboratory, Shanghai Municipal Hospital of Traditional Chinese Medicine, Shanghai University of Traditional Chinese Medicine, Shanghai, China
Aim: Our previous proteomic analysis showed that small RNA SprC (one of the small pathogenicity island RNAs) of Staphylococcus aureus possesses the ability to regulate the expression of multiple bacterial proteins. In this study, our objective was to further provide insights into the regulatory role of SprC in gene transcription and metabolism of S. aureus.
Methods: Gene expression profiles were obtained from S. aureus N315 wild-type and its sprC deletion mutant strains by RNA-sequencing (RNA-seq), and differentially expressed genes (DEGs) were screened by R language with a |log2(fold change)| ≥1 and a false discovery rate (FDR) ≤ 0.05. Gene Ontology (GO) and Kyoto Encyclopedia of Genes and Genomes (KEGG) pathway analysis were carried out to understand the significance of the DEGs. The quality of RNA-seq was further verified by quantitative real-time PCR (qRT-PCR), mRNA target prediction, metabolomics analysis and transcript-level expression analysis of genes of sprC complementation strain.
Results: A total of 2497 transcripts were identified, of which 60 transcripts expressions in sprC knockout strain were significantly different (37 up-regulated and 23 down-regulated DEGs). GO analysis showed that the functions of these DEGs were mainly concentrated in the biological process and molecular function related to metabolism and pathogenesis, and a higher number of genes were involved in the oxidation-reduction process, catalytic activity and binding. KEGG pathways enrichment analysis demonstrated that metabolism and pathogenesis were the most affected pathways, such as metabolic pathways, biosynthesis of secondary metabolites, purine metabolism, fructose and mannose metabolism and S. aureus infection. The qRT-PCR results of the DEGs with defined functions in the sprC deletion and complementation strains were in general agreement with those obtained by RNA-seq. Metabolomics analysis revealed 77 specific pathways involving metabolic pathways. Among them, many, such as metabolic pathways, biosynthesis of secondary metabolites and purine metabolism, were consistent with those enriched in the RNA-seq analysis.
Conclusion: This study offered valuable and reliable information about the regulatory roles of SprC in S. aureus biology through transcriptomics and metabolomics analysis. These results may provide clues for new potential targets for anti-virulence adjuvant therapy on S. aureus infection.
Introduction
Staphylococcus aureus (S. aureus) is a common pathogenic Gram-positive bacterium that produces a plethora of virulence factors (Tong et al., 2015; Lee et al., 2018). S. aureus can get access to the tissues or the bloodstream under the skin and cause severe infections through wounds on the skin or mucosa (Lee et al., 2018). Besides, its pathogenicity is closely related to the adaptability of this pathogen in the host, which results from changes in bacterial metabolism and virulence (Balasubramanian et al., 2017; Richardson, 2019). Therefore, studying the regulatory mechanism underlying the virulence and metabolism of S. aureus is of infinite significance.
Previous studies showed that small regulatory RNAs (sRNAs) help S. aureus adapt to the environment quickly, which has a strong relationship with bacterial pathogenicity (Caldelari et al., 2013; Desgranges et al., 2019; Georg et al., 2020). Hundreds of sRNAs have been identified, of which 8 small pathogenicity island (SaPIn) RNAs (SprA-G and X) were verified and several were studied in detail (Pichon and Felden, 2005; Eyraud et al., 2014). For example, SprA1AS can intercept the translation initiation signal (Sayed et al., 2011), SprD suppresses the expression of Sbi protein and promotes the virulence of S. aureus (Chabelskaya et al., 2010), and SprX is involved in glycopeptides resistance and the regulation of virulence factors (Eyraud et al., 2014; Kathirvel et al., 2016). Gene sprC is located next to gene lukD and lukE on SaPIn3 (Pichon and Felden, 2005), and is named srn_3610 in the staphylococcal regulatory RNA database established by Sassi et al. (2015). Le Pabic et al. (2015) reported that SprC weakened the virulence and leukocytic phagocytosis of S. aureus, which in turn attenuated the pathogenicity of the bacteria. In an early study, we reported the significantly influence of SprC on the expressions of proteins involving in metabolic process, cellular process, biological modulation and catalytic activity in S. aureus by proteomics analysis (Zhao et al., 2017). In addition, it was reported that sRNAs modulate various targets, including RNA, protein and DNA, thereby controlling gene transcription and translation, mRNA stability, and DNA maintenance or silencing (Diallo and Provost, 2020). To further understand the influence of SprC on bacterial gene expression and metabolism, in this study, we analyzed the differences in the transcriptional and metabolic profiles in the sprC deletion mutant of S. aureus N315 by using RNA sequencing (RNA-seq) and liquid chromatography tandem-mass spectrometry (LC-MS/MS), respectively. The results will enrich the knowledge about the physiological regulation networks of S. aureus.
Materials and Methods
Strains, Plasmids and Culture Conditions
Bacterial strains used in this study were S. aureus N315, N315ΔsprC (sprC deletion mutant) (Zhao et al., 2017), and S. aureus R4220. The plasmid pOS1 was a gift from Associate Professor Qian Liu. Bacteria were cultured at 37°C in tryptic soy broth medium (TSB; Oxoid), rotating at 200 revolutions per minute under aerobic conditions, with a volume to tube ratio of 1/3 according to our early study (Zhao et al., 2017).
Total RNA Extraction and Qualification
Bacterial cultures that grew for 4 h to early logarithmic growth phase (OD600 = 0.5) were centrifuged at 13,000×g for 10 min at 4°C. The cell pellets were resuspended in 1 ml of TE buffer (10 mM Tris HCl, 1 mM EDTA, pH 8.0) supplemented with lysostaphin (1 mg/ml, Sangon Biotech) and proteinase K (20 mg/ml, TaKaRa), and incubated for 1 h at 56°C. Total RNA extraction was performed using a MiniBEST Universal RNA Extraction Kit (TaKaRa) according to the manufacturer’s protocol, including an optional on-column DNase treatment procedure (TianGen). RNA degradation and contamination were detected using 1% agarose gel electrophoresis. The purity and concentration of RNA were analyzed by a Nanodrop spectrometer (Thermo Fisher Scientific). The integrity of RNA was precisely measured using the RNA Nano 6000 Assay Kit, and quantified by the Agilent 2100 bioanalyzer (Agilent Technologies Inc.).
RNA Sequencing (RNA-Seq) Library Construction
Bacterial mRNA was isolated with the MICROBExpress™ kit (Invitrogen) by removing ribosomal RNA (rRNA) from total RNA according to the manufacturer’s instructions. The mRNA was fragmented and reverse transcribed with random hexamer primers (5’-d(NNNNNN)-3’ (N=G, A, T or C)) (Thermo Fisher Scientific) by using the Superscript™ Double-Stranded cDNA synthesis kit (Invitrogen). After repairing the cDNA ends using NEBNext End repair/dA-tailing module (New England Biolabs), sequencing adapter ligation was performed. Then, polymerase chain reaction (PCR) was carried out to generate the cDNA library. AMPure XP beads (Beckman Coulter Inc.) were utilized for purification after each enzymatic reaction. Following the construction of the cDNA library, preliminary quantification and the detection of the insert size were conducted by qubit 2.0 (Life Tech Invitrogen) and Agilent 2100, and the effective concentration of the library (> 2 nM) was accurately quantified by quantitative real-time PCR (qRT-PCR) to ensure the quality of the library. The cDNA library was established using NEBNext® UltraTM II RNA Library Prep Kit (New England Biolabs).
RNA Sequencing and Bioinformatics Analysis
The prepared cDNA Library was sequenced on Illumina HiSeq 4000 sequencing platform (Illumina) to generate 2 × 150 bp paired-end reads. Quality of RNA-seq data was comprehensively evaluated using RseQC package (version 2.6.3) (Wang et al., 2012). Raw data were aligned to the S. aureus NCTC 8325 genome sequence (GenBank accession number NC_007795). The quantitative expression level of each gene was represented by expected number of fragments per kilobase transcript sequence per million base pairs sequenced (FPKM), which was calculated using Cufflinks software (version 2.2.1). DESeq2 v 1.10.1 package was used to identify differentially expressed genes (DEGs) (with a |log2(fold change)| ≥1 and a false discovery rate (FDR) ≤ 0.05). Kyoto Encyclopedia of Genes and Genomes (KEGG) pathway enrichment analysis and Gene Ontology (GO) functional annotation on the DEGs were conducted based on the KEGG and GO databases (R package GOseq v 1.18) (Ashburner et al., 2000; Kanehisa and Goto, 2000).
Quantitative Real-Time Polymerase Chain Reaction for DEGs Verification
In order to appraise the RNA-seq data, quantitative real-time polymerase chain reaction (qRT-PCR) was performed to quantify the level of the DEGs. Total RNA was extracted and reverse transcribed into cDNA using the Takara RNA PCR kit (AMV) ver.3.0 kit (TaKaRa), according to the manufacturer’s protocol. Then qRT-PCR was carried out in a 20 μL volume using SYBR Premix Ex Taq™ (Tli RNaseH Plus) kit (TaKaRa) as recommended by the manufacturer. Primers used are listed in Supplementary Table 1. Thermal cycling profile was as follows: 95°C for 30 sec, followed by 40 cycles of 95°C for 5 sec, 60°C for 34 sec; and 95°C for 15 sec, 60°C for 1 min, and 95°C for 15 sec. The 16S rRNA was used as the reference gene for normalization. Three independent experiments were run in triplicate. Relative gene expression was assessed by the 2-ΔΔCT method (Yang et al., 2020). Melting curve analysis was performed for gene amplification to analyze the primer efficiency.
In order to further confirm the influence of SprC on the expressions of DEGs, a complementation strain of sprC was constructed. Briefly, using DNA from strain N315 as a template, sprC gene was amplified by PCR with primer sprC-up-Nhel (CCGGCTAGCAAGTATTGAAAAATAAAATATTT) and sprC-down-BamHI (CGCGGATCCAACATATATATATTTACTATGAAC). SprC complementation plasmid was generated by cloning the sprC gene into the vector pOS1. The recombinant plasmid pOS1-sprC was first transferred into S. aureus RN4220 and then transformed into strain N315ΔsprC via electroporation (electrotransformation conditions: 1.8 kv, 2.5 ms). According to the methods described above, qRT-PCR was performed to check whether the expression levels of the DEGs (10 randomly selected genes) in the complementation strain (named N315ΔsprC-C) were backfilled to those in the wild-type N315 strain.
Prediction of Binding Between DEGs-Transcribed mRNA and SprC
To validate that the mRNAs transcribed by DEGs could act as the targets of SprC, we calculated the thermodynamic stability of SprC:mRNA duplex using a bioinformatics tool “standalone algorithm RNAhybrid” on Bielefeld Bioinformatics Service website (https://bibiserv.cebitec.uni-bielefeld.de/). On this website, the molecular free energy (Mfe, kcal/mol) between the two molecules can be obtained. According to the description of Akhtar (Akhtar et al., 2019), a value of Mfe less than 0 indicated that SprC and mRNA could bind spontaneously with a good affinity.
Metabolomic Analysis
Strain N315 and N315ΔsprC were collected at logarithmic growth phase and centrifuged at 14,000×g for 10 minutes at 4°C. The cell pellets were washed with phosphate-buffered saline (PBS) twice, then flash-frozen in liquid nitrogen, and stored at -80°C. The collected samples were thawed on ice, and metabolites were extracted by vortexing with 50% methanol buffer for 1 min, and incubating at room temperature for 10 min. The extraction mixtures were stored overnight at -20°C, then centrifugated for 20 min at 4,000×g. The supernatants were transferred into new 96-well plates and stored at -80°C prior to metabolomic analysis. The data of non-targeted metabolomic profiling were assembled in both positive ion (pos) and negative ion (neg) modes using LC-MS/MS technique (high-resolution mass spectrometer (Q Exactive), Thermo Fisher Scientific) to probe into the metabolomic compositions and their biofunctions (data from both groups, 6 biological repeats for each). Based on partial least squares method-discriminant analysis (PLS-DA) and variable importance in projection (VIP) value, the fold changes were used to identify differential metabolites. The differential ion defined needed to meet 3 conditions: (1) ratio ≥ 2 or ≤ 1/2; (2) P-value ≤ 0.05; (3) VIP ≥ 1. Compound Discoverer 3.1.0 software (Thermo Fisher Scientific) was used to identify statistically different metabolites. KEGG pathway database was utilized to annotate the different metabolites and exhibit the pathways with differential metabolite enrichment.
Statistical Analysis
All statistical analyses were performed with SAS 9.3 for Windows software (SAS Institute Inc.) and R language. Data comparisons were performed using Student’s t-test. A P-value < 0.05 was considered a statistically significant difference.
Results
General Features of the Transcriptome Profile
Six cDNA libraries constructed based on samples of S. aureus N315 and N315ΔSprC (3 for each) were sequenced. The gene expression results of the three biological replicates obtained from the RNA-seq were highly consistent, which was more conducive to the subsequent transcriptome analysis. A total of 50,637,714 raw reads were generated. After quality control, 47,575,359 reads (24,279,637 and 23,295,722 for wild-type and knockout groups, respectively) were produced. The quality indicators of Q20 and Q30 were > 98% and > 95%, respectively, suggesting successful sequencing of the S. aureus transcriptome. Then the qualified reads were utilized for mapping to the reference genome of S. aureus NCTC 8325 for subsequent analysis. A detailed analysis of the RNA-seq on the six samples is represented in Table 1.
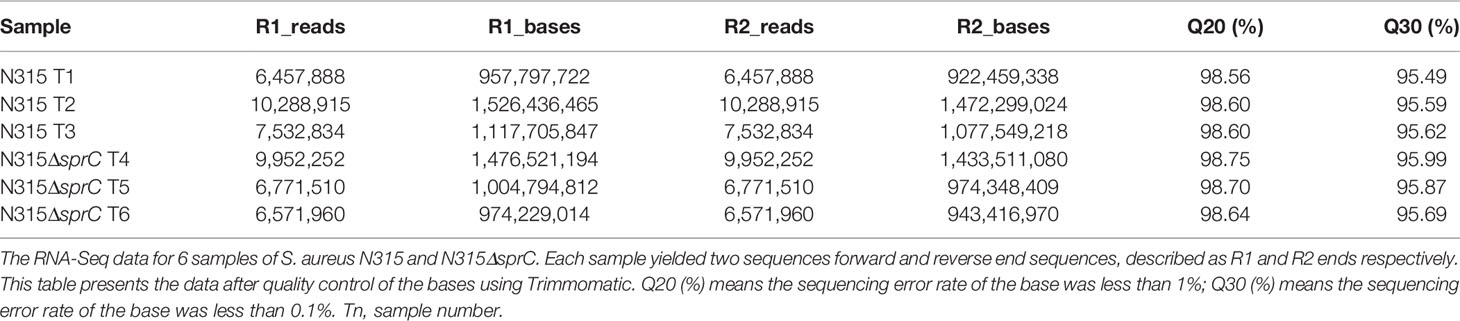
Table 1 The RNA-seq data after quality checking for 6 samples of S. aureus N315 and N315ΔsprC.
Analysis of DEGs
To identify DEGs in S. aureus N315 following sprC knockout, we utilized DESeq2 program to yield S. aureus gene expression profiles. The program identified a total of 2497 genes expressed, among which 60 (2.4%) were differentially regulated, including 37 (1.5%) significantly up-regulated and 23 (0.9%) distinctly down-regulated DEGs (Figure 1A). The scatter plot revealed the expression discrepancies of genes between the wild-type strain and the knockout strain (Figure 1B). In addition, a volcano plot was created to picture the DEGs intuitively between both groups (Figure 1C). The heat map visualized the global expression changes of 60 DEGs between N315 and N315ΔsprC (Figure 1D). From the heat map, we apparently recognized that the expressions of the genes encoding leucocidin ED (SAOUHSC_01955 and SAOUHSC_01954) were markedly up-regulated in N315ΔsprC, which were associated with impetigo, antibiotic-associated diarrhea, and bloodstream infections (Yang et al., 2020). Detailed information about each DEG is available in Supplementary Table 2. The representatives of the significant DEGs involved in metabolism and virulence are listed in Table 2.
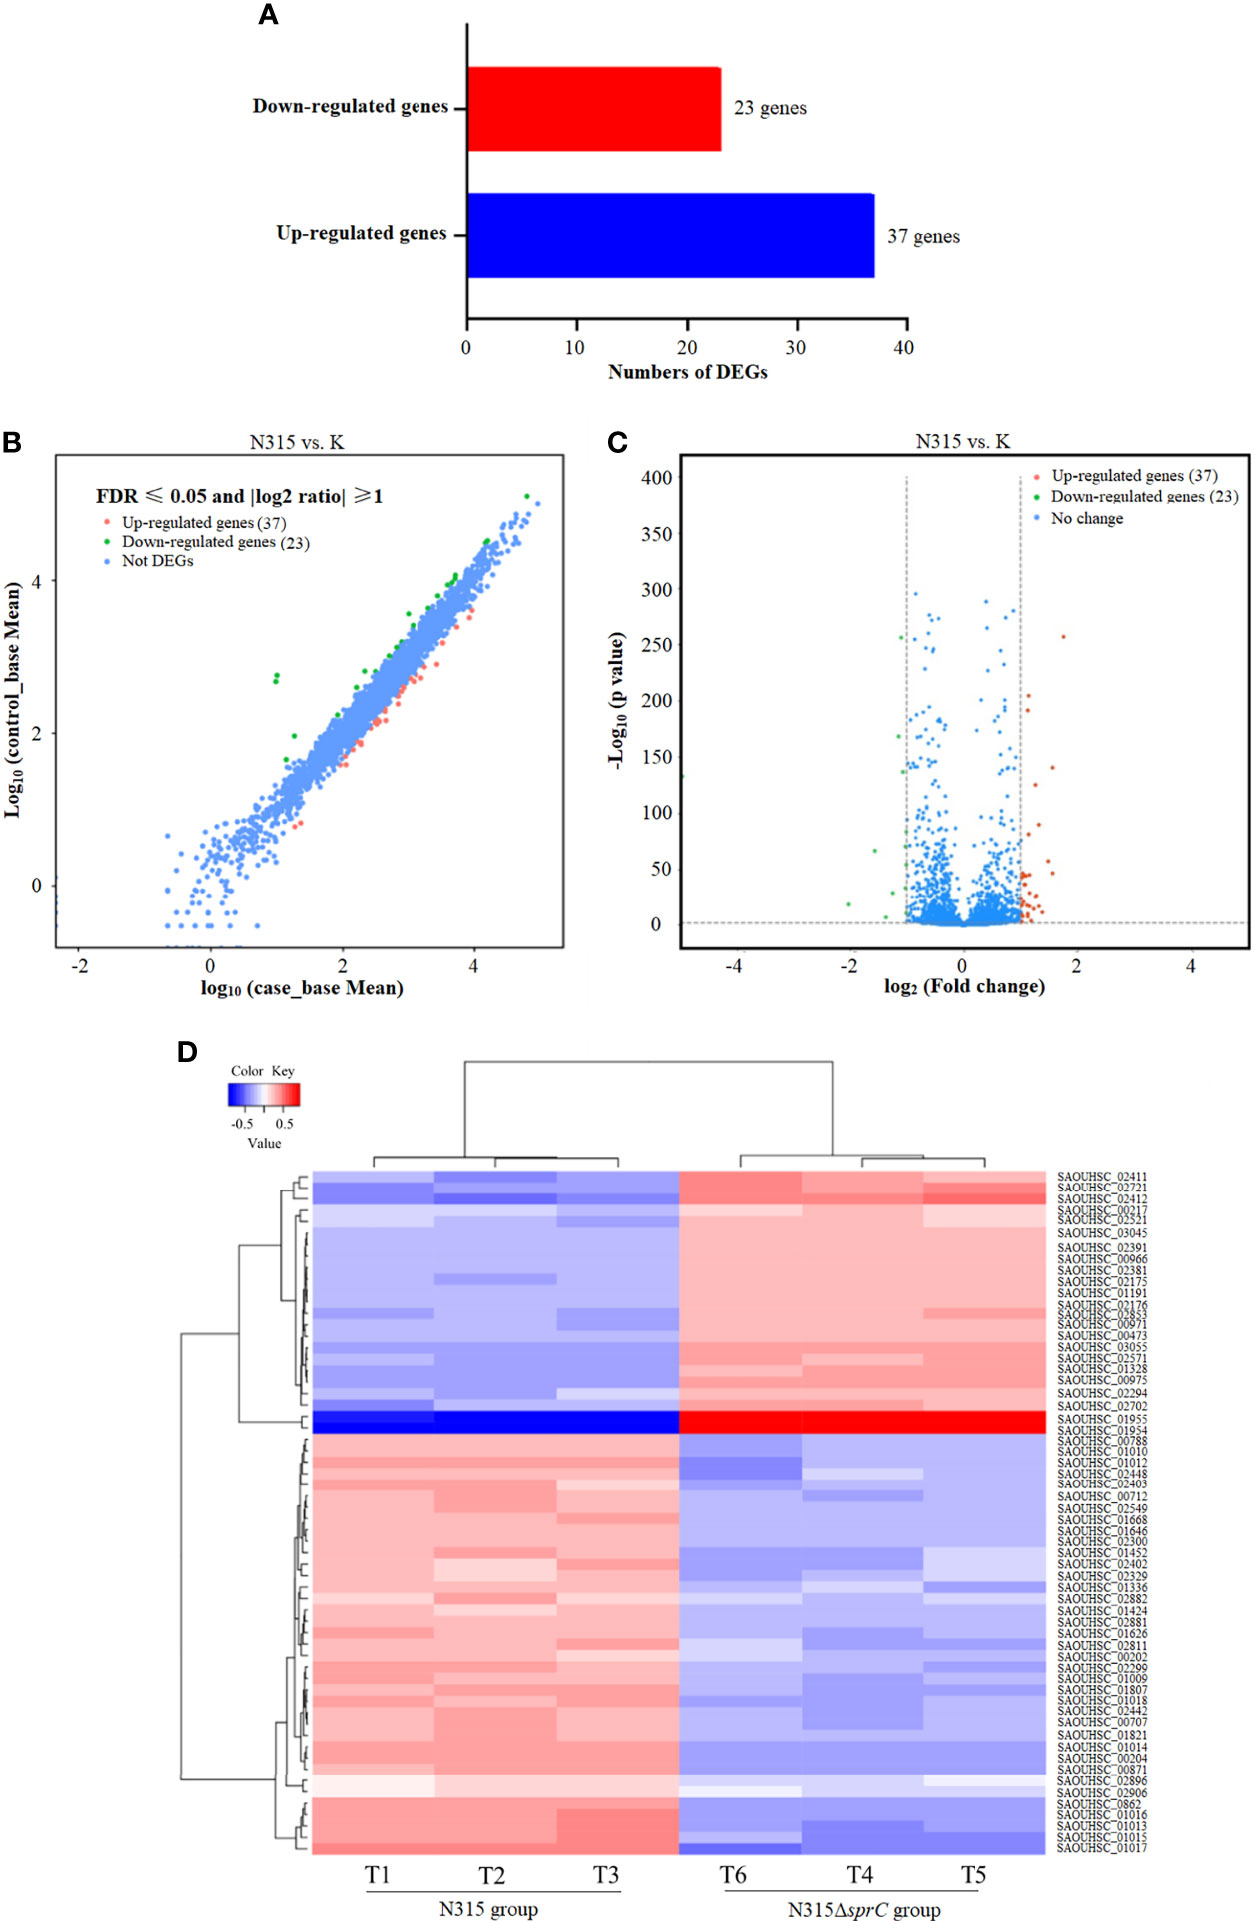
Figure 1 RNA-seq analysis of DEGs between wild-type S. aureus N315 and its sprC knockout mutant (N315ΔSprC). DESeq2 v 1.10.1 package was used to identify the DEGs (with a |log2(fold change)| ≥1 and a false discovery rate (FDR) ≤ 0.05). (A) A bar graph visualizing the number of up-regulated (blue color histogram) and down-regulated (red color histogram) genes. The x-axis indicates gene number. (B) A scatter plot revealing the expression discrepancies of genes in two groups. The values of x- and y-axes are the normalized signal values of samples in two groups. Red, the significantly upregulated genes; green, the markedly downregulated genes. (C) A volcano plot demonstrating the DEGs in two groups with P value ≤ 0.05 and |log2(fold change)| ≥ 1 as the threshold. The red dots represent 37 upregulated genes and the green dots show 23 downregulated genes in the N315 group compared with their expression levels in the N315ΔSprC group. Each dot represents one gene. (D) A heat map of DEGs. T1-T3 are wild-type N315 samples and T4-T6 are N315ΔSprC samples. Euclidean distances between samples are used, and each sample value is chosen to plot the DEseq2 rlog-transformed value. Red, upregulated genes; blue, downregulated genes. Each line represents one gene. DEGs, differentially expressed genes.
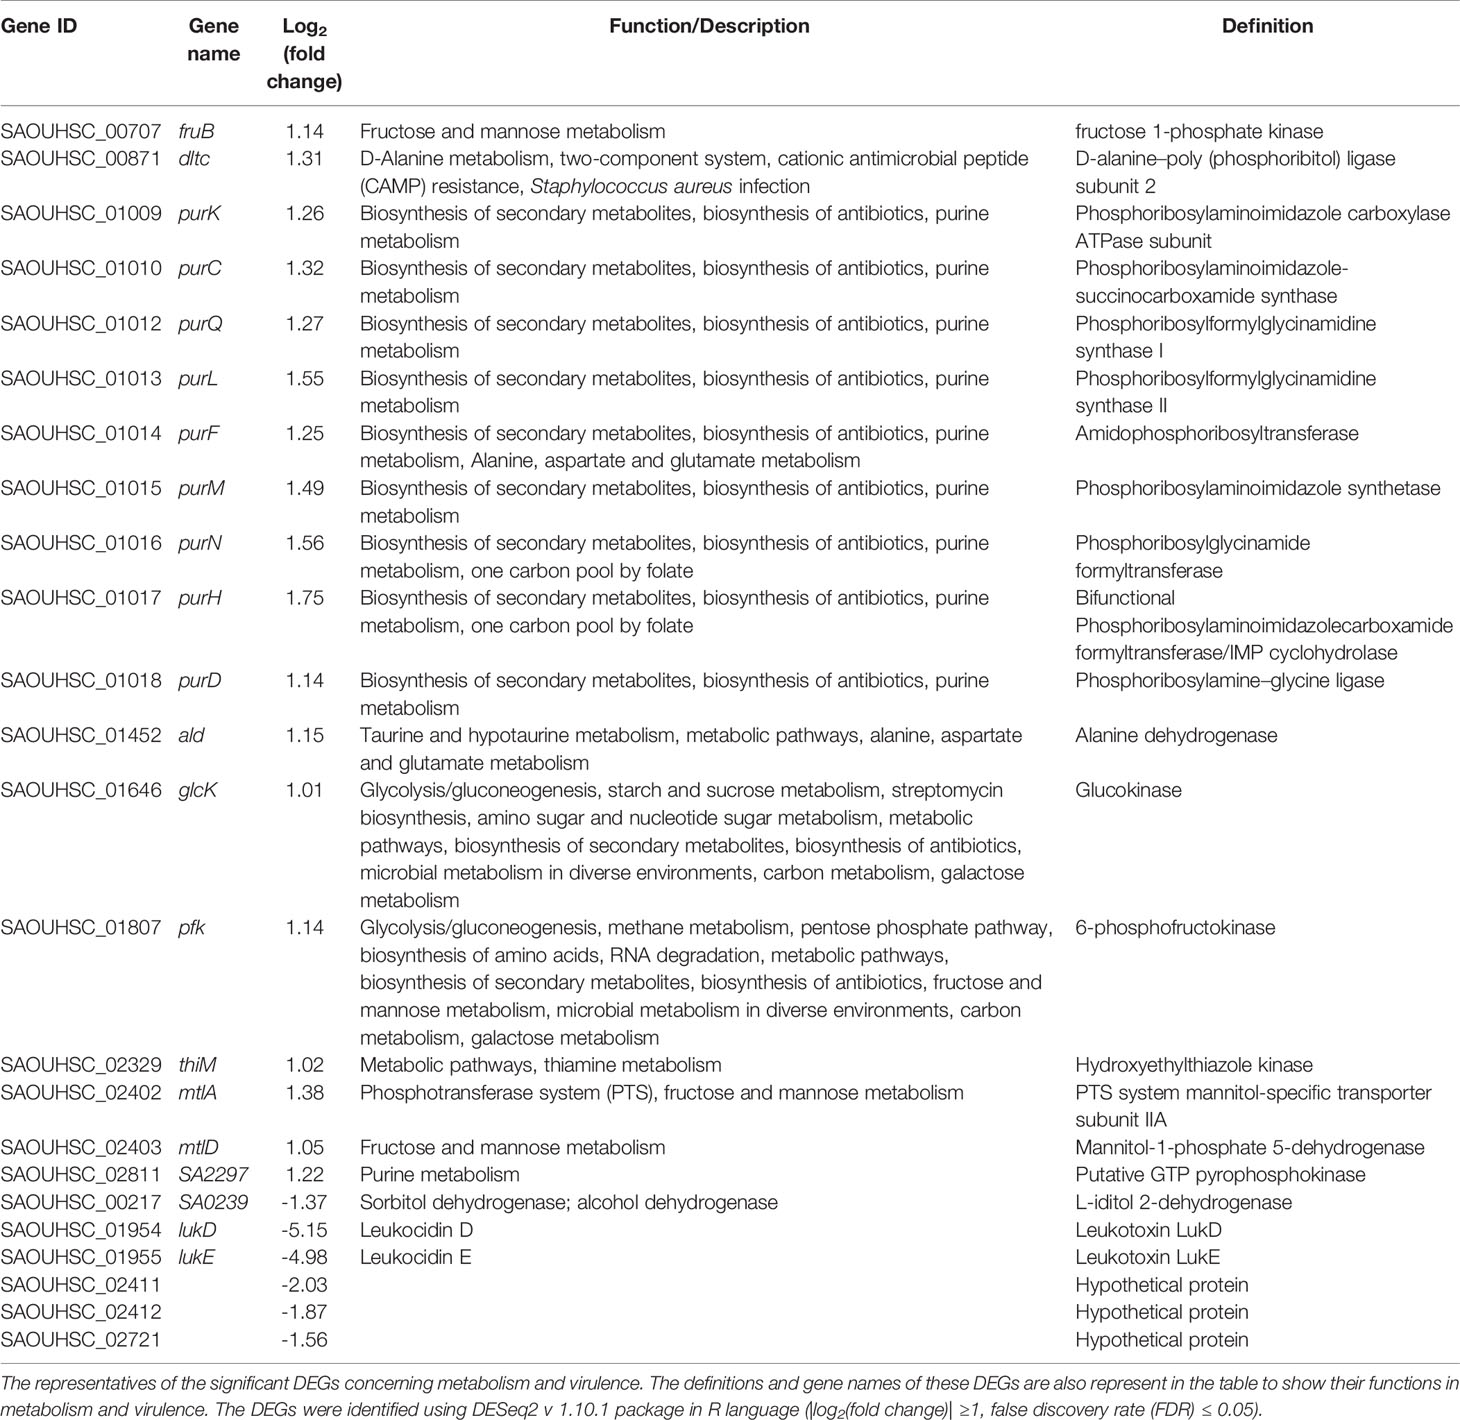
Table 2 The representatives of the significant differentially expression genes (DEGs) concerning metabolism and virulence in S. aureus sprC mutant compared with wild-type strain.
Go Functional Enrichment Analysis
To further understand the possible effects of SprC on DEGs, GO functional enrichment analysis was conducted. Our results displayed that the significantly enriched annotations were related to three GO domains: biological process [15 terms, such as oxidation-reduction process (8 genes), translation (3 genes), regulation of transcription (2 genes) and pathogenesis (2 genes)], molecular function [24 terms, most involved in catalytic activity (13 genes) and binding (15 genes)], and cellular component [4 terms, most belonging to intracellular (4 genes) and ribosomal components (3 genes)] (Figure 2). Discrepant transcription profiles acquired from the DEGs in wild-type and knockout strains indicated a potential effect of SprC on S. aureus metabolism and pathogenicity.
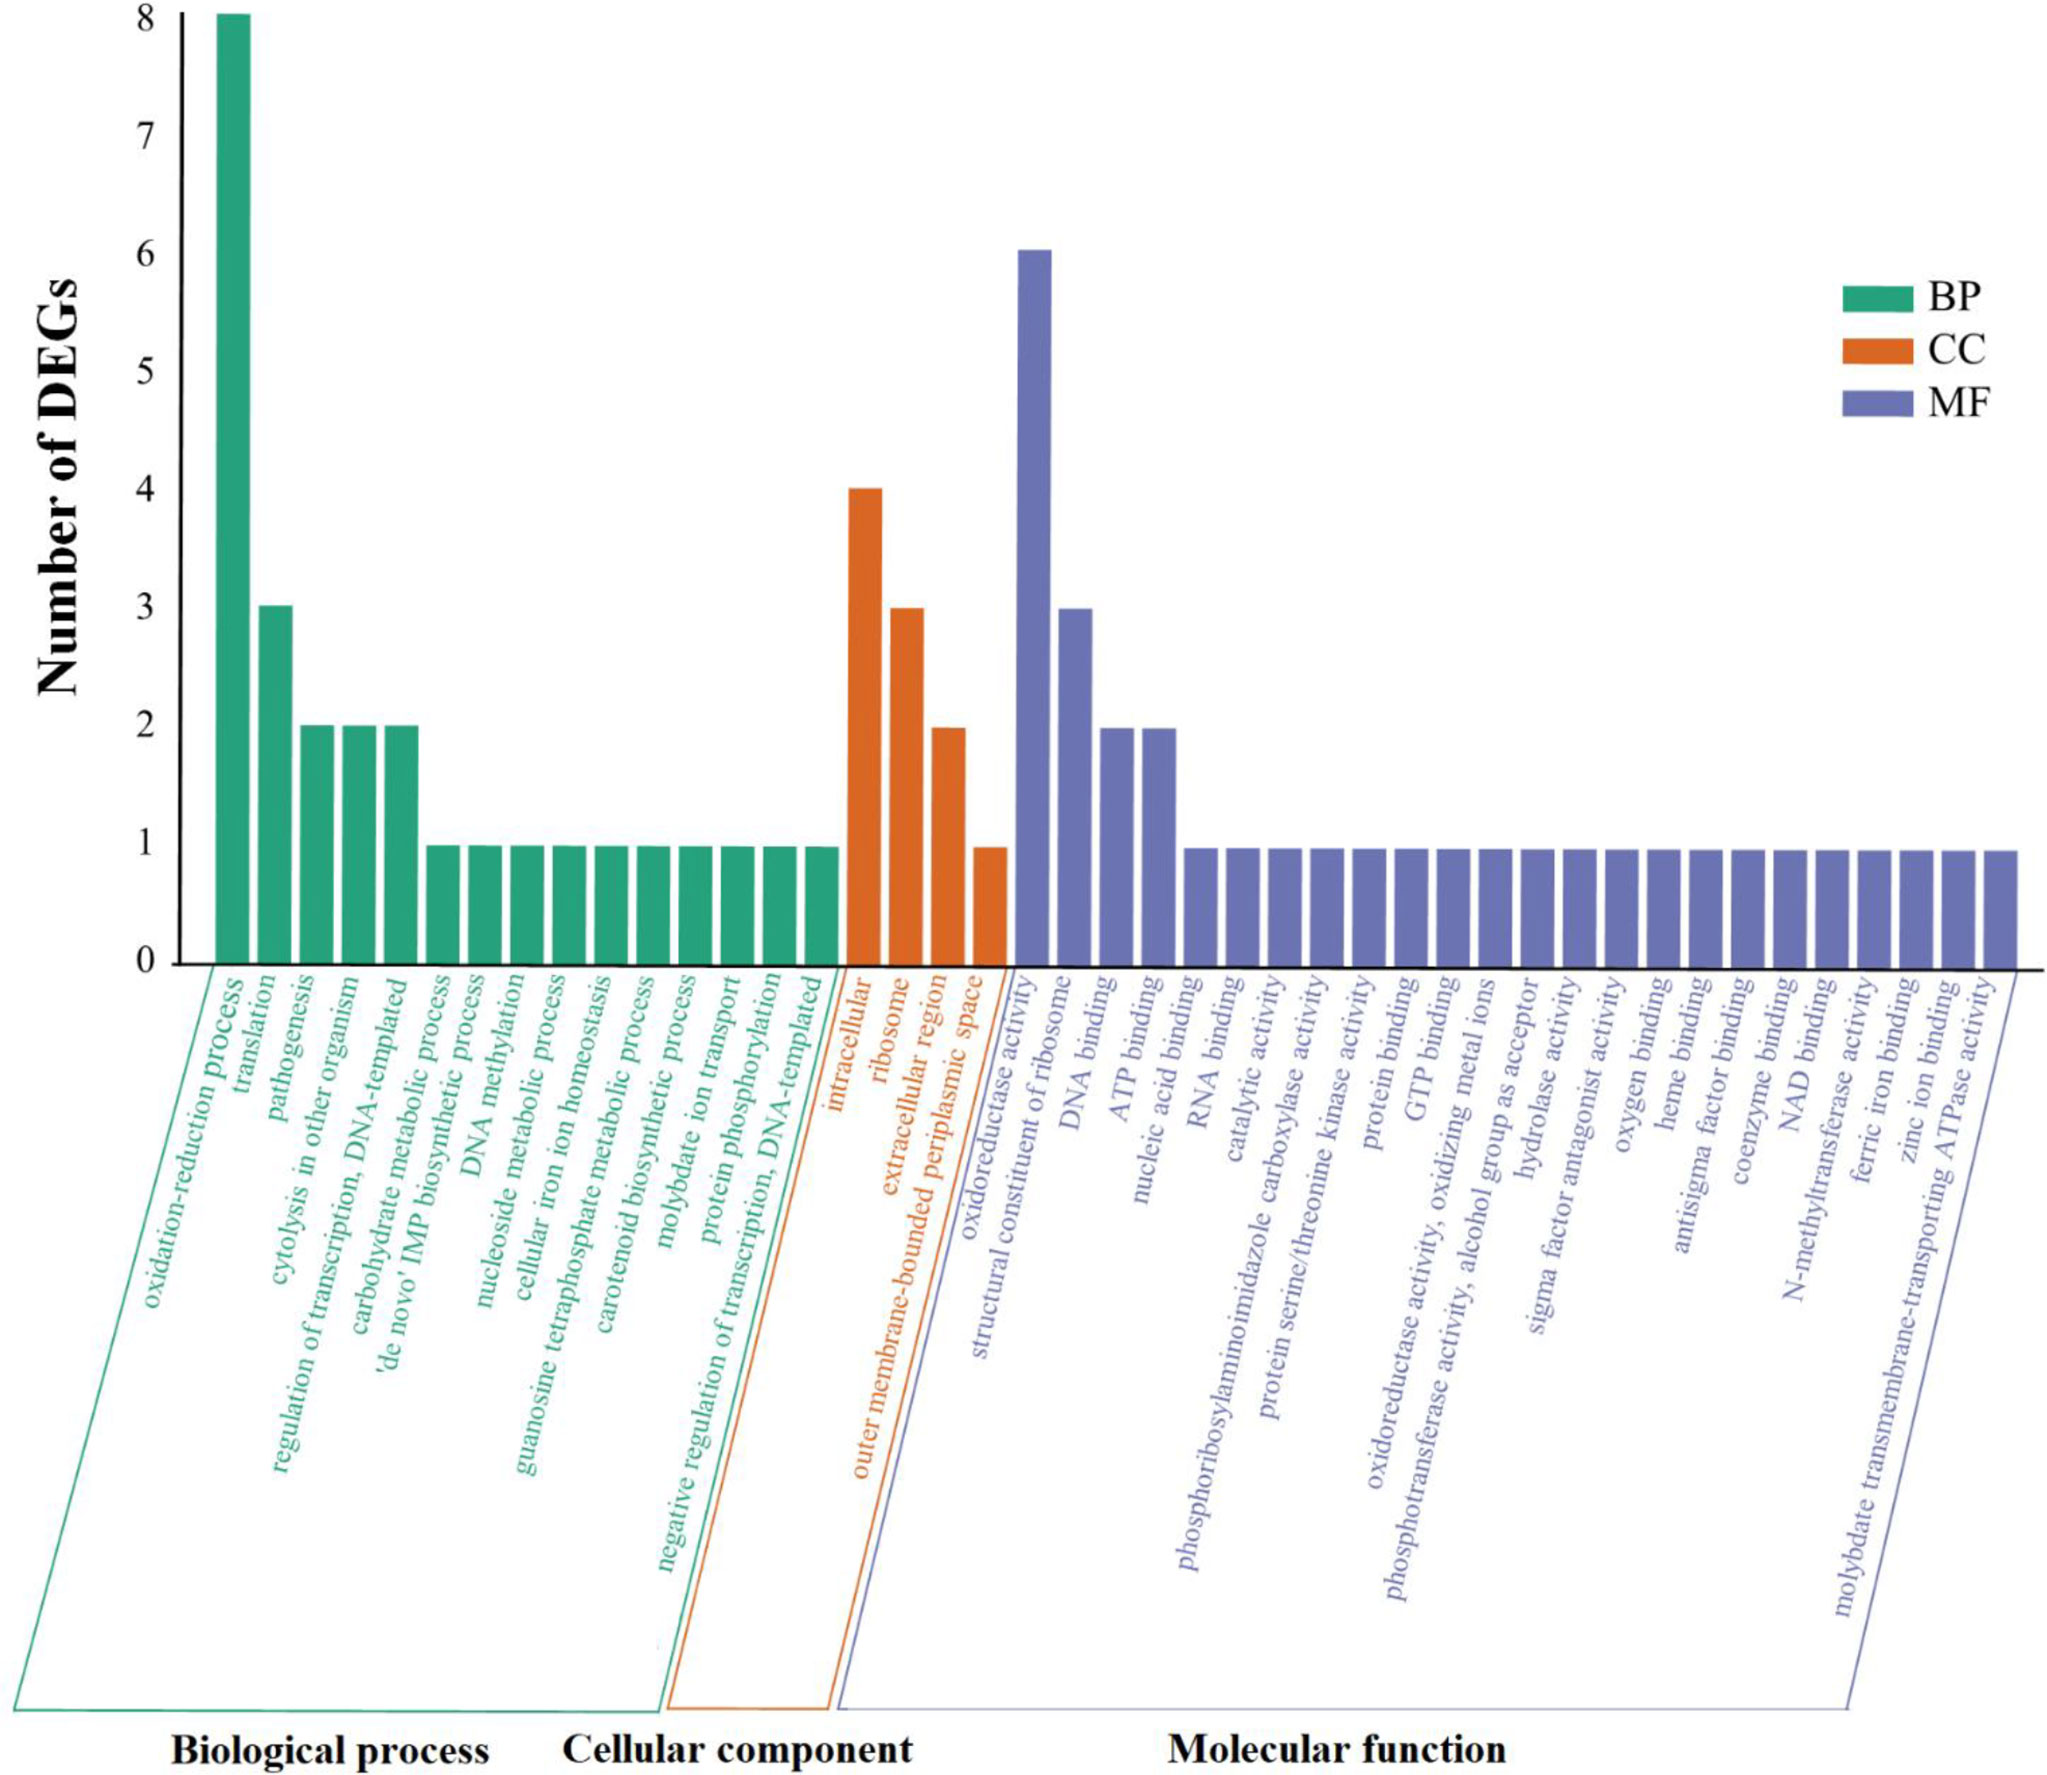
Figure 2 All the GO terms enriched among the DEGs. Go databases were used to conduct GO functional annotation on the DEGs by R package GOseq v 1.18. All annotated determinants (x-axis) are divided into 3 GO domains: biological process (15 terms), molecular function (4 terms) and cellular component (24 terms). The y-axis suggests the number of DEGs. Green histogram stands for the biological process (BP), the orange histogram indicates cellular component (CC), and the purple histogram represents molecular function (MF). Differential expression profiles are acquired from DEGs in the wild-type and mutant strains, disclosing the impact of SprC on S. aureus metabolism, physiology and pathogenesis. GO, Gene Ontology; DEGs, differentially expressed genes.
KEGG Pathway Enrichment Analysis
In order to further identify the functions of DEGs, all DEGs were mapped to KEGG database for the KEGG pathway enrichment analysis. Totally, 32 pathways were enriched, and the detailed information was presented in Supplementary Table 2. From Supplementary Table 2, we observed that some determinants were involved in several biological activities, and some were limited to a single pathway. The top four clearly enriched pathways, namely metabolic pathways, biosynthesis of antibiotics, biosynthesis of secondary metabolites and purine metabolism were shown in Figure 3A. In addition, data represented in Figure 3A reflected that there were 15 genes mapped to metabolic pathways, 11 genes involved in the pathways of biosynthesis of antibiotics, 11 genes mapped to biosynthesis of secondary metabolites, and 10 genes related to purine metabolism pathway. Besides, the pathways involving fructose and mannose metabolism (5 genes), Staphylococcus aureus infection and ribosome (3 genes each) were also remarkedly enriched (Figure 3A). A bubble chart (Figure 3B) generated with factors of enrichment factor, P value and numbers of DEGs revealed the 20 most significant pathways, among which the above mainly pathways were included.
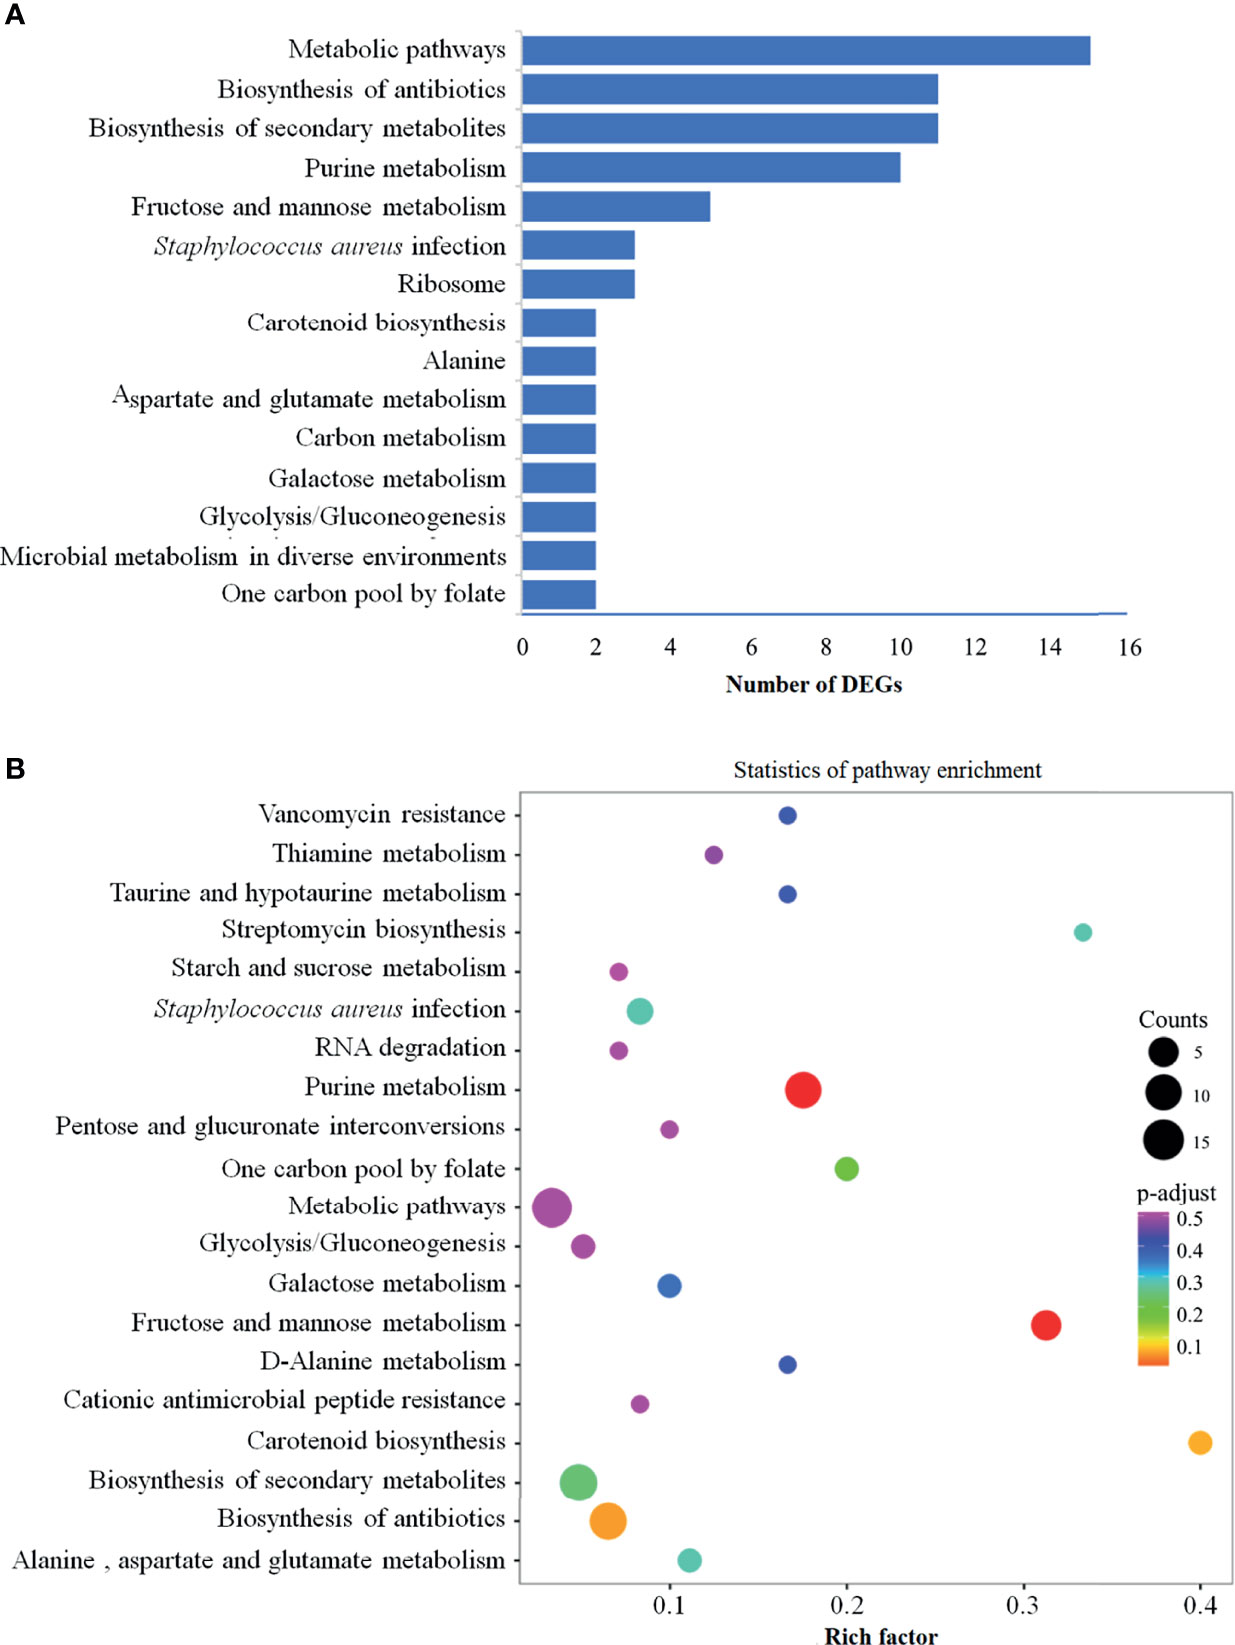
Figure 3 KEGG pathway enrichment analysis of DEGs. KEGG pathway enrichment analysis was conducted based on the KEGG database (R package GOseq v 1.18). (A) Top 15 enriched KEGG pathways among DEGs. These 15 pathways are arranged in the order of number of DEGs, and the pathways enriched the most DEGs are metabolic pathways, followed by biosynthesis of antibiotics, biosynthesis of secondary metabolites and purine metabolism. (B) Visualization of the 20 most significant KEGG enrichment pathway. The 20 most significant pathways were selected by combining three factors: enrichment factor (x-axis), P value (color of the dots) and number of genes enriched (size of the dots). KEGG, Kyoto Encyclopedia of Genes and Genomes; DEGs, differentially expressed genes.
Validation of Differential Expression Genes
To confirm the accuracy of gene expression detected by RNA-seq, the DEGs with a defined function including 32 up-regulated genes and 11 down-regulated genes were reanalyzed using qRT-PCR. As indicated in Figure 4, the mRNA levels of 35 of 43 DEGs (81.4%) assessed by qRT-PCR were congruent with the results of RNA-seq (a consistent trend for two genes with no significant difference). However, opposite results were shown for the remaining 8 genes (dltc, purC, purL, SA0231, modA, glcK, SA1360 and pfk) (Figure 4E). Although there were several contradictory results obtained by both methods, the data from RNA-seq were generally reliable.
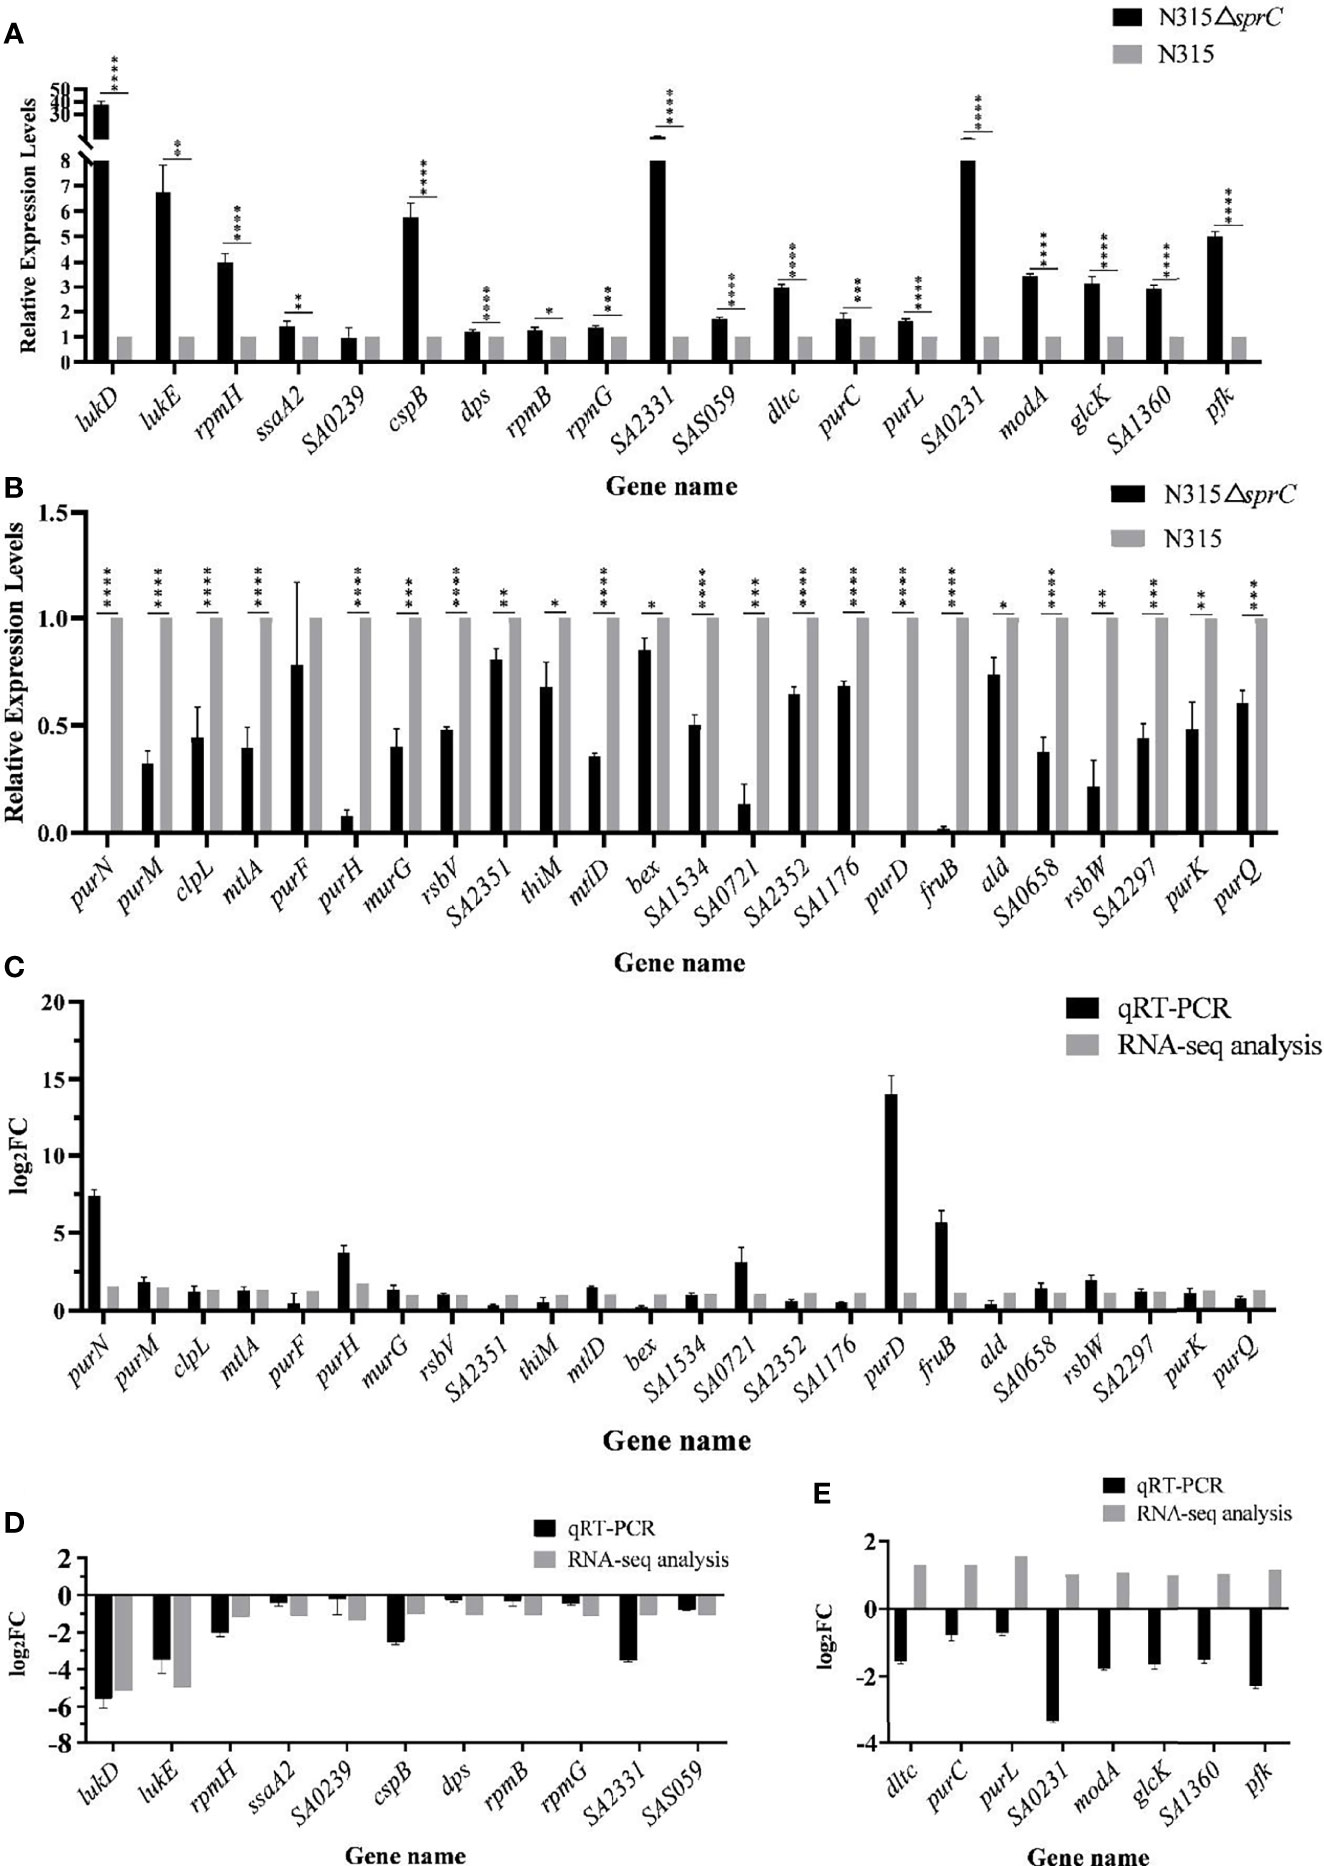
Figure 4 qRT-PCR analysis for validation of expression levels of 43 DEGs with defined function between N315 and N315ΔSprC strains. (A) 19 DEGs were up-regulated after the sprC knockout analyzed by qRT-PCR. (B) 24 DEGs were down-regulated after the sprC deletion. Black bar, strain N315ΔsprC; gray bar, strain N315 *P < 0.05, **P < 0.01, ***P < 0.001, ****P < 0.0001. The consistence of the results between RNA-seq and qRT-PCR analyzed with log2(Fold change) (log2FC) (y-axis) was shown in (C–E). (C, D) 24 up-regulated and 11 down-regulated genes by SprC were validated consistent between both methods. (E) The expressions of 8 genes detected by qRT-PCR were validated opposite to those of RNA-seq. Black bar, qRT-PCR; gray bar, RNA-seq; qRT-PCR, quantitative real-time polymerase chain reaction; DEGs, differentially expressed genes.
In order to further verify the influence of SprC on gene expression, the complementation strain N315ΔsprC-C was constructed, screened and verified (Supplementary Figure 1 and Supplementary Sequencing Data). The result of qRT-PCR showed that the expression level of sprC in the complementation strain was returned to that in the wild-type N315 strain (Figure 5). Further analysis discovered that the mRNA levels of the 10 randomly selected DEGs in the complementation strain were also restored to those in the wild-type strain (Supplementary Figure 2).
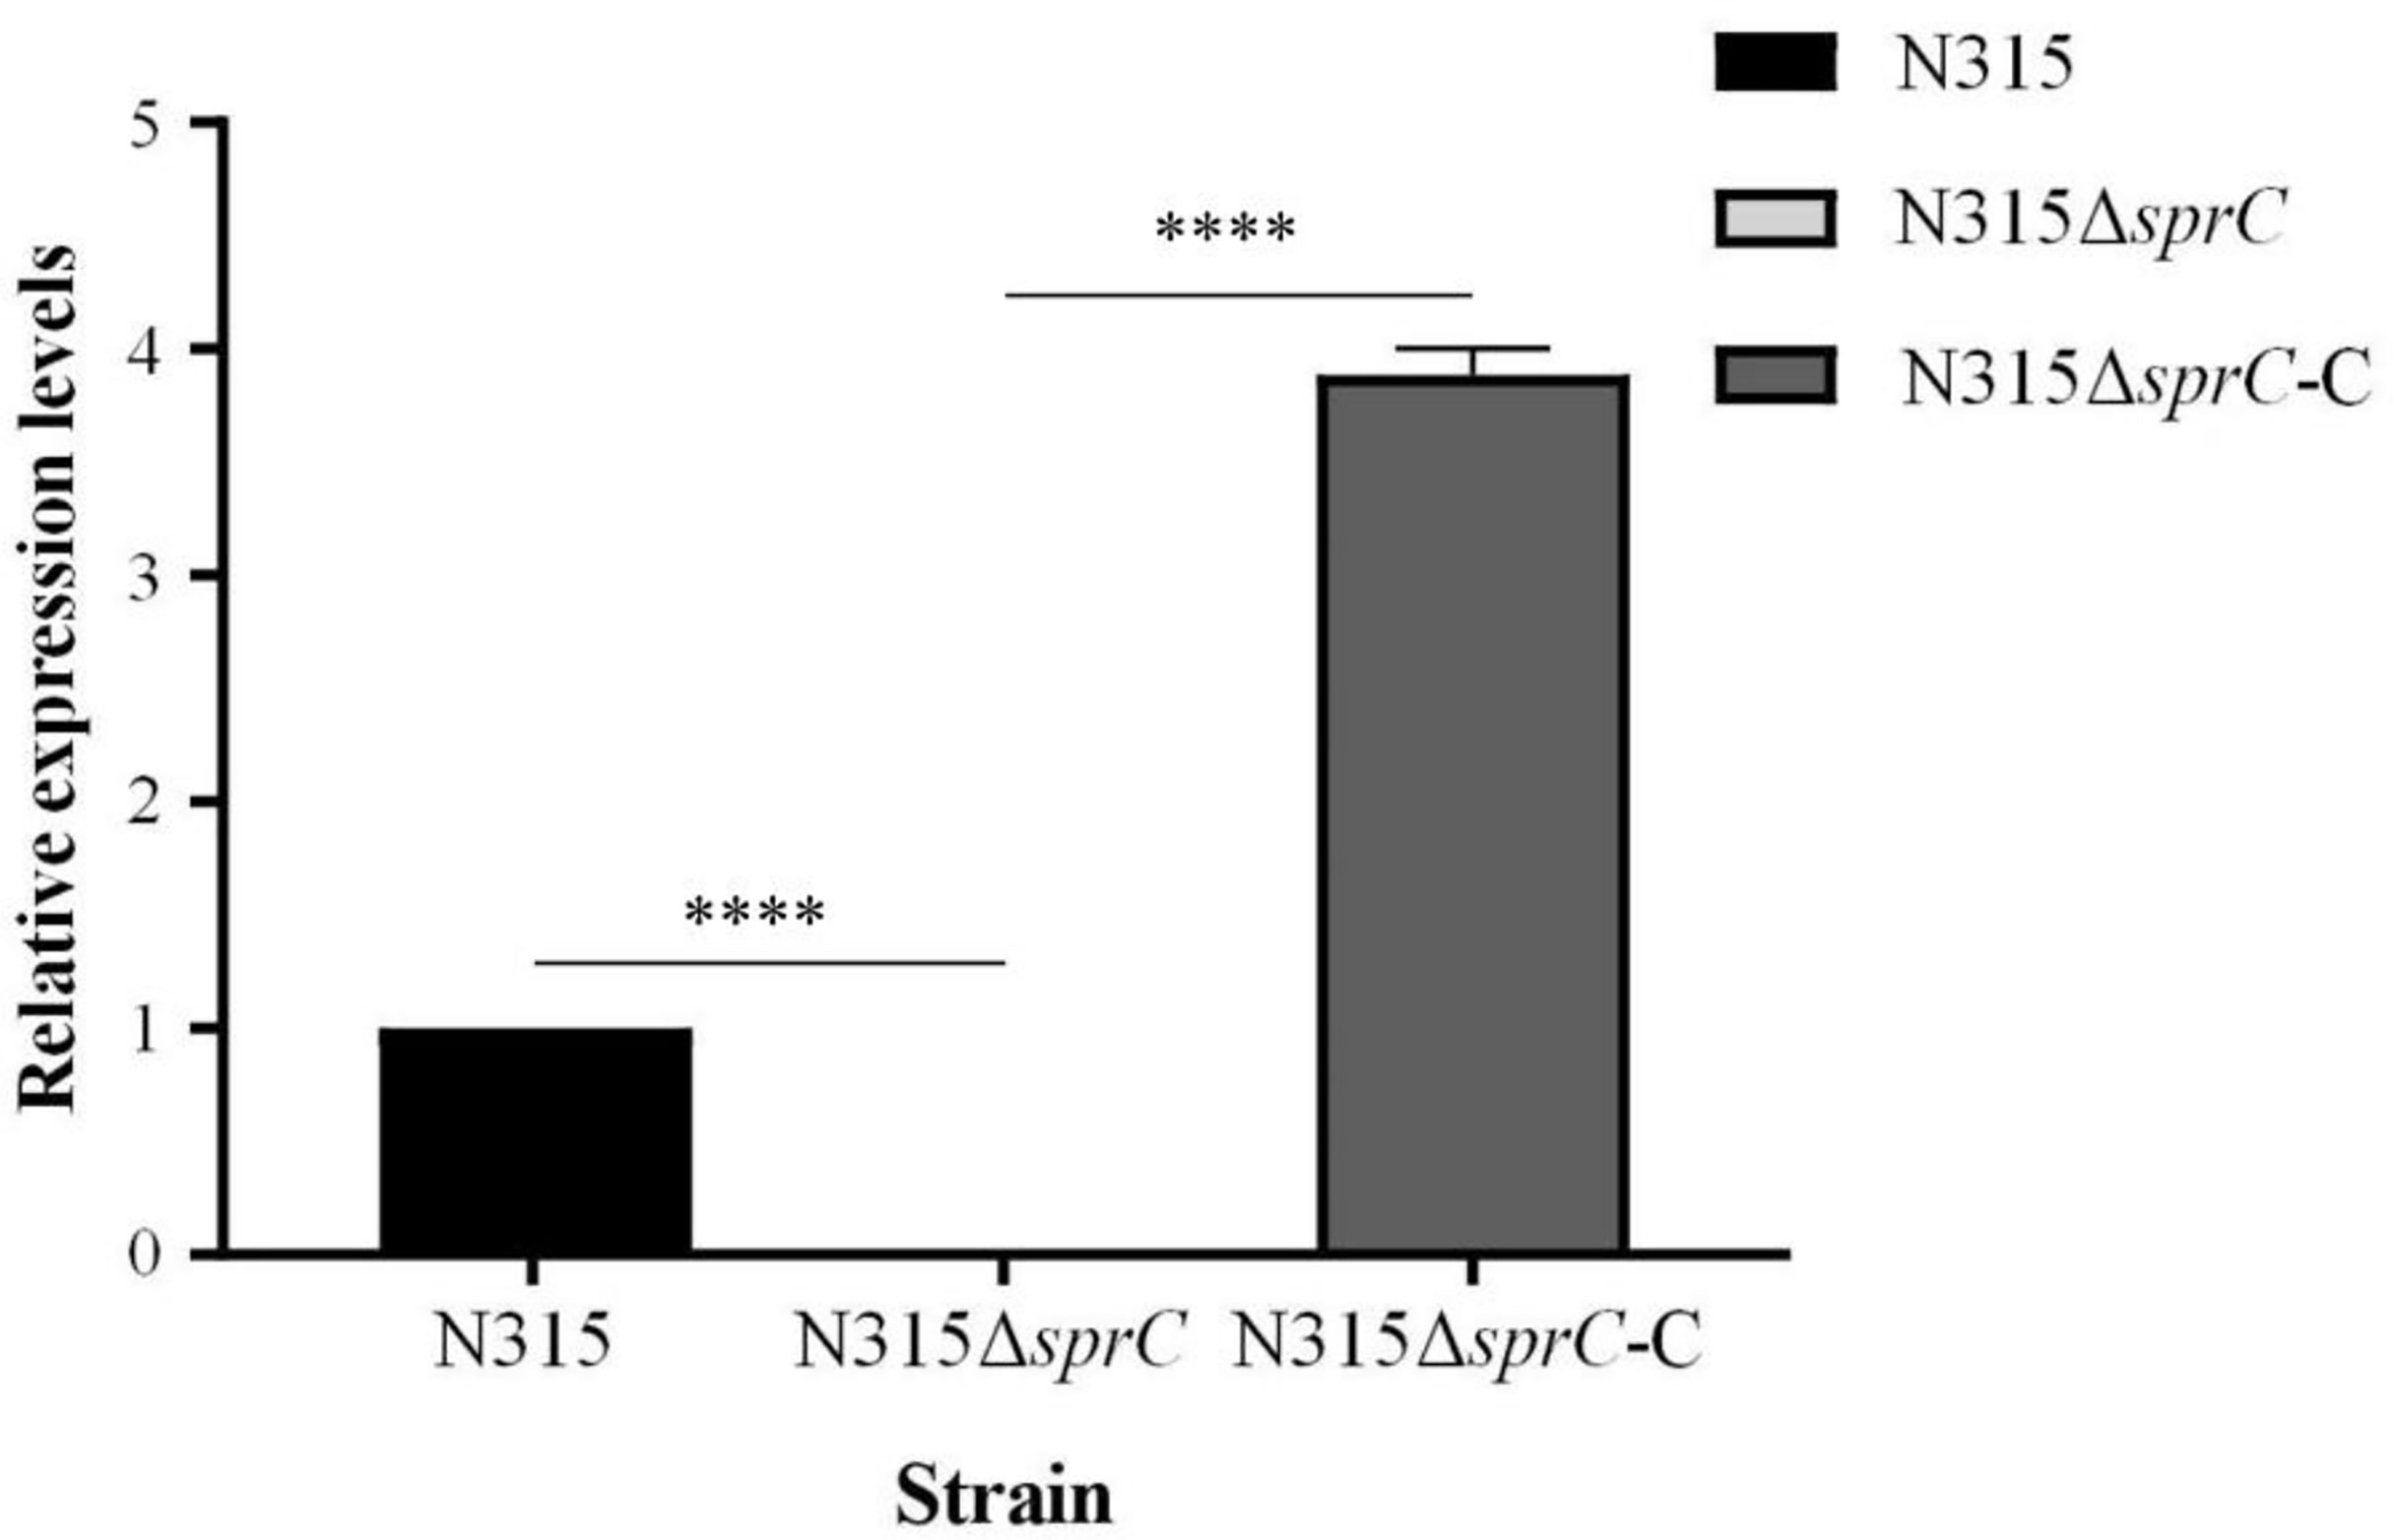
Figure 5 Relative expression of sprC in N315 wild-type, knockout and complementation strains. The knockout strain (N315ΔsprC) was constructed via temperature-sensitive plasmid pKOR1 by homologous recombination. The complementation strain (N315ΔsprC-C) was constructed by transferring recombinant plasmid pOS1-sprC into strain N315ΔsprC via electroporation. The levels of expression of sprC in the three strains were detected by qRT-PCR. The sprC is barely expressed in the knock out strain N315ΔsprC, and restored to the level of wild-type strain in the complementation strain N315ΔsprC-C. black bar, N315, the wild-type strain; gray bar, N315ΔsprC, the knock out strain; deep gray bar, N315ΔsprC-C, the complementation strain. ****P < 0.0001.
Prediction of Putative Targets of SprC
We predicted the binding of SprC with the mRNA transcribed from the DEGs, except for genes encoding hypothetical proteins. The Mfes of SprC:target mRNA are listed in Table 3. According to Akhtar et al. (2019), low level of Mfe means that an RNA-RNA duplex is thermodynamically stable and it is more difficult to break up the base-paring between RNA strands. A tight RNA-RNA combination is more likely to be viewed as a real target (Akhtar et al., 2019). As shown in Table 3, the predicted Mfes of SprC:mRNA were exceptionally low (-95.5 to-54.4), signaling that SprC and the mRNAs predicted could bind spontaneously with a good affinity. The predicted diagram of the secondary structure of the binding between SprC and mRNA is given in Supplementary Figure 3.

Table 3 Molecular free energy (Mfe) obtained by SprC:mRNA of DEGs prediction.
Differential Metabolites Analysis
With the raw mass spectrometry data imported from the LC-MS/MS acquisition, 7123 metabolites were identified. Compared with the wild-type strain N315, 256 differential ions (3.6%) were screened based on the conditions of ratio ≥ 2 or ≤ 1/2, P value ≤ 0.05 and VIP ≥ 1 in sprC deletion mutant strain (N315ΔsprC), including 187 (2.6%) up-regulated ions and 69 (1.0%) down-regulated ions. All the differentially regulated metabolites are available in Supplementary Table 3. KEGG pathways analysis indicated that these differential metabolites were enriched in various KEGG pathways of level 1, including cellular processes, environmental information processing, genetic information processing, human diseases, metabolism and organismal system, and the pathways of metabolism enriched the maximum amount of differential metabolites (Figure 6). Among the level 2 pathways of metabolism, we observed that global and overview maps enriched the most differential metabolites (25 metabolites), and amino acid metabolism and metabolism of other amino acid each enriched 10 metabolites (Figure 6). Specific pathway enrichment derived from level 2 pathways using the compounds in the KEGG database was presented as a bubble chart in Supplementary Figure 4, in which 77 specific pathways were identified and many, such as metabolic pathways (the most significantly enriched pathways, including 28 metabolites), biosynthesis of secondary metabolites and purine metabolism, were consistent with those enriched in the RNA-seq data.
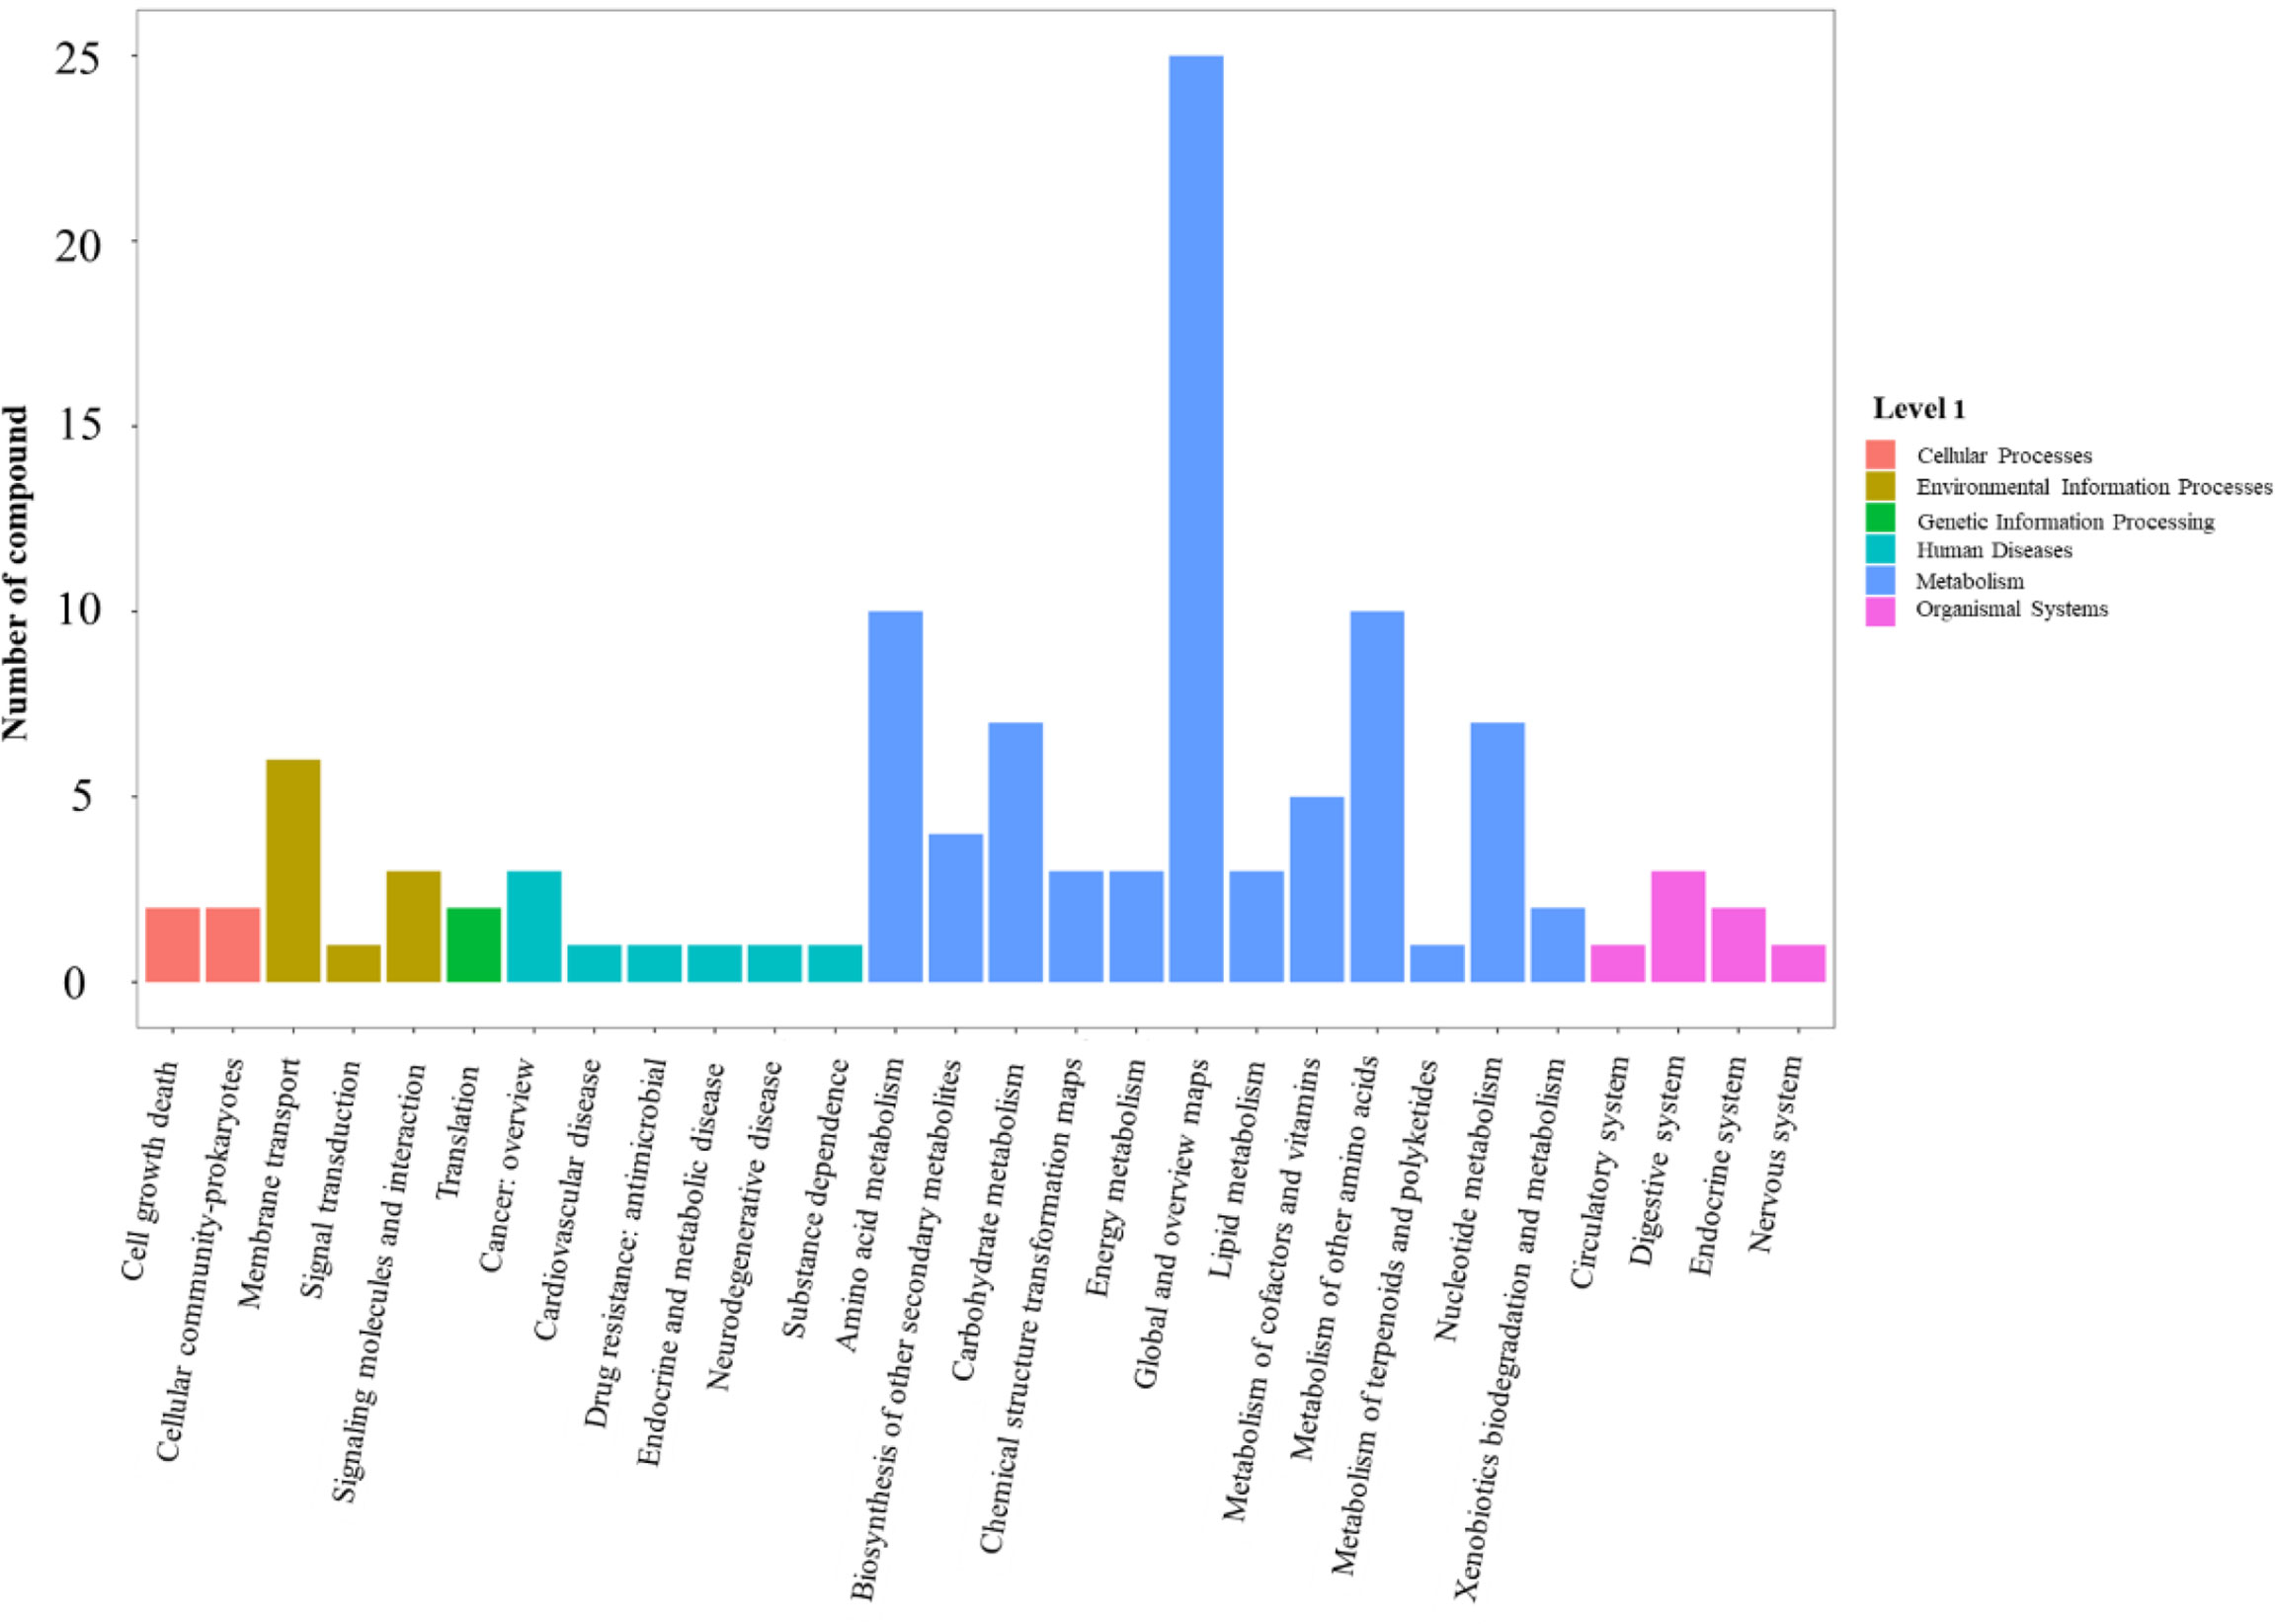
Figure 6 Histogram of ions and metabolites annotated to KEGG pathways. The fold changes were used to identify differential metabolites based on partial least squares method-discriminant analysis (PLS-DA) and variable importance in projection (VIP) value. Pathways with differential metabolite were enriched using KEGG pathway database. X-axis shows the pathways of level 2 derived from pathways of level 1 (cellular processes, environmental information processing, genetic information processing, human diseases, metabolism and organismal system) in KEGG database. Y-axis shows the number of compounds enriched in the pathway. The significantly enriched pathways (such as global and overview maps, amino acid metabolism and metabolism of other amino acid) are pathways from metabolism (blue bar). KEGG, Kyoto Encyclopedia of Genes and Genomes.
Discussion
S. aureus possesses complex regulatory circuits, which enable the survival and proliferation of the pathogen after infecting the host. sRNAs, also known as noncoding RNAs, act primarily as a moderator of translation and mRNA stability (Jørgensen et al., 2020). The majority of sRNAs are predominantly encoded in the core genome, with a few localized in mobile elements, pathogenicity islands or plasmids (Pichon and Felden, 2005). Recent studies have enriched the regulatory mechanisms employed by sRNAs in S. aureus, among which the regulation function based on base pairing is the most commonly demonstrated (Caldelari et al., 2013; Jørgensen et al., 2020). In view of the significance of sRNAs, we constructed the isogenic sprC deletion mutant strain of S. aureus N315 in order to uncover the impact of this sRNA on bacterial gene expression. RNA-seq is a crucial tool in the study of transcriptomics (Stark et al., 2019), so this technology was used by us to acquire the differential gene expression data, which were further analyzed to reveal the functions related to these genes by GO and KEGG pathway analysis.
The discoveries that SprC attenuates the virulence, leukocytic phagocytosis of S. aureus and anti-oxidative stress have been confirmed (Le Pabic et al., 2015). Proteomics analysis showed that the proteins modulated by SprC are mainly connected to metabolic and cellular processes, biological regulation and catalytic activity (Zhao et al., 2017). In this study, the transcriptome data also exhibited the regulatory functions of SprC on metabolism, enzymatic activity and virulence of S. aureus. In line with the above two omics analysis, metabolomics revealed that the differential metabolites affected by SprC were also mainly related to metabolism, environmental information processing and cellular processes.
It is well known that biofilm is an essential part contributing to the virulence of S. aureus (Schilcher and Horswill, 2020). Moreover, the formation of biofilm has much to do with the surface compositions of bacteria (Moormeier and Bayles, 2017). D-alanyl carrier protein plays an important role in the biosynthesis of lipoteichoic acid (LTA), which is able to modulate the properties of the cell wall of gram-positive bacteria and inhibit biofilm formation of S. aureus (Rajagopal and Walker, 2017; Ahn et al., 2018). Our findings showed that dltC gene encoding D-alanyl carrier protein was remarkably up-regulated by SprC. Therefore, we speculated that SprC could exert an influence on the inhibition of the biofilm formation of S. aureus. Based on the transcriptome and metabolome analysis, we found that many genes and metabolites were affected by SprC to varying degrees, especially those related to ABC transporters. ABC transporter is closely associated with the formation of S. aureus biofilm and is also involved in drug resistance of bacteria (McCarthy et al., 2015). According to the DEGs data, we found that some classical virulence or regulation factors, such as lukD (SAOUHSC_01954) and lukE (SAOUHSC_01955), were significantly down-regulated in N315 strain compared with N315ΔsprC strain. LukED belongs to the family of synergohymenotropic toxins that can harm host cells and play a key role in modulating the progress of S. aureus infection (Ahn et al., 2018; Yang et al., 2020). sprC gene is located next to lukE/D, and they have good spontaneous binding affinity according to our SprC:mRNA prediction results. Therefore, it is rational to infer that SprC could modulate the expression of LukED by directly binding to its mRNA. However, this speculation, which was also applied to other identified DEGs, needs to be further validated.
The determinants involved in sugar metabolism were also found in the DEGs. Sugars are the main source of carbohydrates used by bacteria. Bacteria can bind several sugars in the cytoplasm and utilize these sugars to produce ATP through glycolysis or generate polysaccharides by polymerization (Komatsuzawa et al., 2004). Study showed that there are tight links between the regulation of sugar metabolism and the virulence of S. aureus (Seidl et al., 2008). Carbohydrate phosphotransferase system (PTS), a major carbohydrate active transport system, is found only in bacteria. This system can catalyze the phosphorylation of sugars, concomitantly transport the sugars across the cell membrane, and interfere with bacterial virulence (Postma et al., 1993; Deutscher et al., 2006). This study showed that SprC could impact PTS by regulating mtlA (SAOUHSC_02402) encoding one PTS enzyme. ATP-dependent 6-phosphofructokinase encoded by SAOUHSC_01807 (pfkA) is the key enzyme in the first committing step of glycolysis (Tian et al., 2018). However, whether SprC has the function of regulating the expression of this enzyme remains to be confirmed, because in this study there were inconclusive results on the expression of pfkA (Figure 4). Additionally, genes SAOUHSC_00707, SAOUHSC_01807, SAOUHSC_02402 and SAOUHSC_02403 up-regulated by SprC, as shown in Supplementary Table 2, might result in an increased expressions of β-D-fructose 1, 6-bisphosphate and enhanced glycolysis (Deng et al., 2014; Gong et al., 2017; Li et al., 2018; Chen et al., 2019). Luo et al. demonstrated that the growth rate of S. aureus was reduced under high glucose conditions due to impairment of the pentaglycine bridge contributing to the bacterial cell wall structure (Luo et al., 2020). Therefore, SprC might provide one approach to maintain cell stability by increasing the expression of genes related to upgraded glycolysis. Metabolomics results also revealed some enriched pathways in glucose and carbon metabolism, such as C5-branched dibasic acid metabolism. Previous studies suggested that multiple factors in amino acid metabolism moonlight as regulators in the expressions of genes regulating bacterial virulence (Lomas-Lopez et al., 2007; Frank et al., 2021). Our findings also showed that amino acid metabolism was significantly enriched according to KEGG analysis of metabolome and transcriptome data. As a result, SprC could influence the virulence of S. aureus by regulating nutritional conditions, such as amino acid metabolism.
Purines, required for the synthesis of nucleic acids and adenosine triphosphate (ATP), are essential to the intracellular growth of S. aureus (Goncheva et al., 2020). The production and metabolism of purines in cells is a very complex process in which a variety of enzymes and physiological conditions are involved to maintain cellular homeostasis (Maiuolo et al., 2016). As presented in Supplementary Table 2, the expressions of ten determinants (SAOUHSC_01009, 01010, 01012-01018 and 02811) associated with the “purine metabolism” were up-regulated by SprC. These genes (except SAOUHSC_02811) encode the catalytic enzymes in the hypoxanthine nucleotide (IMP) biosynthesis via de novo pathway that would consume ATP (Schultheisz et al., 2008). The decline in ATP may induce resistance to antibiotics (Conlon et al., 2016). Furthermore, previous investigations showed that the transcription levels of all genes in the purine (pur) operon are much higher in vancomycin-resistant S. aureus strains than in vancomycin-sensitive strains (Mongodin et al., 2003; Fox et al., 2007). Based on the metabolomics data, differential metabolites were also enriched in energy metabolism and purine metabolism pathways. For example, adenosine, a component of purine metabolism, was down-regulated in N315ΔsprC strain. In addition, some metabolites related to pyrimidine metabolism and intermediate products of pyrimidine metabolism including uridine and thymidine were also decreased in N315ΔsprC strain. Evidence of vancomycin resistance variability due to gene deletion was also provided by our metabolomics data (Figure 3B). Together, our data suggested that SprC might also impact the properties of S. aureus by regulating nucleotide metabolism.
Numerous early studies elucidated the complex relationships between metabolism and virulence regulation in S. aureus and revealed that alterations in virulence may be induced by changes in metabolism (Somerville and Proctor, 2009; Balasubramanian et al., 2017; Richardson, 2019). In this study, the observation of the effects of SprC on the expression of S. aureus metabolism-related genes might provide an interpretation for the ability of SprC to reduce the virulence of S. aureus. And our results of both metabolomics and complementation strain construction analysis also demonstrated the correctness of this conclusion.
In conclusion, 60 DEGs were discovered to be affected by SprC. Analyzed by GO annotation and KEGG pathway, these influenced determinants were mainly associated with metabolic processes (such as sugar and purine metabolism), catalytic functions, substrate binding and S. aureus infection. These findings were similar to our previous proteomic data on the effects of SprC (Zhao et al., 2017). Additionally, in this study that SprC affected the metabolism of S. aureus further supported the viewpoint of SprC regulating the virulence of S. aureus. Based on all these findings, SprC, a multifaceted RNA, might be identified as a metabolic signature and a potential target, which can be employed for drug discovery and development for the adjuvant treatment of drug-resistant bacterial infections. Nevertheless, there were several limitations in our study. For the first, no experiments were performed to verify whether sRNA SprC directly or indirectly regulated the expression of the identified DEGs. Second, we did not conduct further research to elucidate the mechanisms underlying the regulatory function of SprC.
Data availability statement
The datasets presented in this study can be found in online repositories. The names of the repository/repositories and accession number(s) can be found in the article/Supplementary Material.
Author Contributions
JZ and HZ carried out the experiments and wrote the manuscript; they contributed equally to this work and shared first authorship. HY, CH, WS and ZC analyzed the data and interpreted the results. QL designed the experiments and corrected the manuscript. All authors contributed to the article and approved the submitted version.
Funding
This work was supported by grants from the National Natural Science Foundation of China (No. 81772247 and No. 81371872) and Natural Science Foundation, Science and Technology Commission of Shanghai (20ZR1444800).
Conflict of Interest
The authors declare that the research was conducted in the absence of any commercial or financial relationships that could be construed as a potential conflict of interest.
Publisher’s Note
All claims expressed in this article are solely those of the authors and do not necessarily represent those of their affiliated organizations, or those of the publisher, the editors and the reviewers. Any product that may be evaluated in this article, or claim that may be made by its manufacturer, is not guaranteed or endorsed by the publisher.
Acknowledgments
We would like to thank Associate Professor Q Liu for the gift of plasmid pOS1.
Supplementary Material
The Supplementary Material for this article can be found online at: https://www.frontiersin.org/articles/10.3389/fcimb.2022.746746/full#supplementary-material
Supplementary Figure 1 | Agarose gel electrophoresis of double-digested plasmids. The recombinant plasmid was digested with endonucleases Nhel and BamHI, and 2 fragments of DNA, namely plasmid vector pOS1 and sprC, were produced. M1 and M2, DNA markers; lanes 1 and 2, results of enzymatic digestion of plasmids (pOS1-sprC) extracted from the complementation strain N315ΔsprC-C; lanes 3 and 4, results of enzymatic digestion of the recombinant plasmid pOS1-sprC.
Supplementary Figure 2 | Relative expression of 10 randomly selected DEGs. 5 up-regulated and 5 down-regulated DEGs from RNA-seq data were evaluated in wild-type, knockout and complementation strains by qRT-PCR. The results showed that the expression of the selected DEGs detected by both methods was consistent, indicating the accuracy of the RNA-seq results. N315, wild-type strain; N315DsprC, the knock out strain; N315DsprC-C, the complementation strain; DEG, selected differentially expressed genes.
Supplementary Figure 3 | Predicted secondary structure of the binding of mRNA transcribed by DEGs with defined function and SprC. The prediction was performed based on the bioinformatics tools on Bielefeld Bioinformatics Service (https://bibiserv.cebitec.uni-bielefeld.de/). The thermodynamic stability of SprC:mRNA duplex is calculated using a standalone algorithm RNAhybrid. Molecular free energy (Mfe) of < 0 indicates that SprC and mRNA can bind spontaneously with good affinity. Bases marked in red are SprC; green bases belong to DEGs.
Supplementary Figure 4 | Bubble chart of metabolite specific pathway enrichment using the compounds in the KEGG database. All pathways were classified into 6 items, namely, cellular processes, environmental information processing, genetic information processing, human diseases, metabolism and organismal system. In the picture, a total of 52 pathways enriched in metabolism part are mainly related to nutrient metabolism. A total of 8 pathways involved in cellular processes (3 pathways) and environmental information processing (5 pathways) mainly focus on signaling systems. One Pathway from genetic information processing is centered on tRNA biosynthesis. 8 pathways from human diseases have a strong connection with drug resistance. The most significantly enrich pathway of 8 pathways in organismal systems is protein digestion and absorption.
Supplementary Table 1 | The primer pairs used for the validation of DEGs expression.
Supplementary Table 2 | DEGs in N315ΔsprC and N315 strains.
Supplementary Table 3 | Statistical analysis of differential ions quantification data.
Supplementary Sequencing Data | Partial sequence of pOS1-sprC.
References
Ahn, K. B., Baik, J. E., Yun, C.-H., Han, S. H. (2018). Lipoteichoic Acid Inhibits Biofilm Formation. Front. Microbiol. 9, 327. doi: 10.3389/fmicb.2018.00327
Akhtar, M. M., Micolucci, L., Islam, M. S., Olivieri, F., Procopio, A. D. (2019). A Practical Guide to miRNA Target Prediction. Methods Mol. Biol. 1970, 1–13. doi: 10.1007/978-1-4939-9207-2_1
Ashburner, M., Ball, C. A., Blake, J. A., Botstein, D., Butler, H., Cherry, J. M., et al. (2000). Gene Ontology: Tool for the Unification of Biology. The Gene Ontology Consortium. Nat. Genet. 25 (1), 25–29. doi: 10.1038/75556
Balasubramanian, D., Harper, L., Shopsin, B., Torres, V. J. (2017). Staphylococcus Aureus Pathogenesis in Diverse Host Environments. Pathog. Dis. 75 (1), ftx005. doi: 10.1093/femspd/ftx005
Caldelari, I., Chao, Y., Romby, P., Vogel, J. (2013). RNA-Mediated Regulation in Pathogenic Bacteria. Cold Spring Harb. Perspect. Med. 3 (9), a010298. doi: 10.1101/cshperspect.a010298
Chabelskaya, S., Gaillot, O., Felden, B. (2010). A Staphylococcus Aureus Small RNA Is Required for Bacterial Virulence and Regulates the Expression of an Immune-Evasion Molecule. PLoS Pathog. 6 (6), e1000927. doi: 10.1371/journal.ppat.1000927
Chen, H., Li, Y., Li, T., Sun, H., Tan, C., Gao, M., et al. (2019). Identification of Potential Transcriptional Biomarkers Differently Expressed in Both - and -Induced Sepsis. via Integr. Anal. BioMed. Res. Int. 2019, 2487921. doi: 10.1155/2019/2487921
Conlon, B. P., Rowe, S. E., Gandt, A. B., Nuxoll, A. S., Donegan, N. P., Zalis, E. A., et al. (2016). Persister Formation in Staphylococcus Aureus Is Associated With ATP Depletion. Nat. Microbiol. 1, 16051. doi: 10.1038/nmicrobiol.2016.51
Deng, X., Liang, H., Ulanovskaya, O. A., Ji, Q., Zhou, T., Sun, F., et al. (2014). Steady-State Hydrogen Peroxide Induces Glycolysis in Staphylococcus Aureus and Pseudomonas Aeruginosa. J. Bacteriol. 196 (14), 2499–2513. doi: 10.1128/JB.01538-14
Desgranges, E., Marzi, S., Moreau, K., Romby, P., Caldelari, I. (2019). Noncoding RNA. Microbiol. Spectr. 7 (2), GPP3-038-2018. doi: 10.1128/microbiolspec.GPP3-0038-2018
Deutscher, J., Francke, C., Postma, P. W. (2006). How Phosphotransferase System-Related Protein Phosphorylation Regulates Carbohydrate Metabolism in Bacteria. Microbiol. Mol. Biol. Rev. MMBR 70 (4), 939–1031. doi: 10.1128/MMBR.00024-06
Diallo, I., Provost, P. (2020). RNA-Sequencing Analyses of Small Bacterial RNAs and Their Emergence as Virulence Factors in Host-Pathogen Interactions. Int. J. Mol. Sci. 21 (5), 1627. doi: 10.3390/ijms21051627
Eyraud, A., Tattevin, P., Chabelskaya, S., Felden, B. (2014). A Small RNA Controls a Protein Regulator Involved in Antibiotic Resistance in Staphylococcus Aureus. Nucleic Acids Res. 42 (8), 4892–4905. doi: 10.1093/nar/gku149
Fox, P. M., Climo, M. W., Archer, G. L. (2007). Lack of Relationship Between Purine Biosynthesis and Vancomycin Resistance in Staphylococcus Aureus: A Cautionary Tale for Microarray Interpretation. Antimicrob. Agents Chemother. 51 (4), 1274–1280. doi: 10.1128/AAC.01060-06
Frank, M. W., Whaley, S. G., Rock, C. O. (2021). Branched-Chain Amino Acid Metabolism Controls Membrane Phospholipid Structure in Staphylococcus Aureus. J. Biol. Chem. 297 (5), 101255. doi: 10.1016/j.jbc.2021.101255
Georg, J., Lalaouna, D., Hou, S., Lott, S. C., Caldelari, I., Marzi, S., et al. (2020). The Power of Cooperation: Experimental and Computational Approaches in the Functional Characterization of Bacterial sRNAs. Mol. Microbiol. 113 (3), 603–612. doi: 10.1111/mmi.14420
Goncheva, M. I., Flannagan, R. S., Heinrichs, D. E. (2020). Purine Biosynthesis Is Required for Intracellular Growth of Staphylococcus Aureus and for the Hypervirulence Phenotype of a Mutant. Infect. Immun. 88 (5), e00104–20. doi: 10.1128/IAI.00104-20
Gong, Y., Lan, H., Yu, Z., Wang, M., Wang, S., Chen, Y., et al. (2017). Blockage of Glycolysis by Targeting PFKFB3 Alleviates Sepsis-Related Acute Lung Injury via Suppressing Inflammation and Apoptosis of Alveolar Epithelial Cells. Biochem. Biophys. Res. Commun. 491 (2), 522–529. doi: 10.1016/j.bbrc.2017.05.173
Jørgensen, M. G., Pettersen, J. S., Kallipolitis, B. H. (2020). sRNA-Mediated Control in Bacteria: An Increasing Diversity of Regulatory Mechanisms. Biochimica Et Biophysica Acta. Gene Regul. Mech. 1863 (5), 194504. doi: 10.1016/j.bbagrm.2020.194504
Kanehisa, M., Goto, S. (2000). KEGG: Kyoto Encyclopedia of Genes and Genomes. Nucleic Acids Res. 28 (1), 27–30. doi: 10.1093/nar/28.1.27
Kathirvel, M., Buchad, H., Nair, M. (2016). Enhancement of the Pathogenicity of Staphylococcus Aureus Strain Newman by a Small Noncoding RNA Sprx1. Med. Microbiol. Immunol. 205 (6), 563–574. doi: 10.1007/s00430-016-0467-9
Komatsuzawa, H., Fujiwara, T., Nishi, H., Yamada, S., Ohara, M., McCallum, N., et al. (2004). The Gate Controlling Cell Wall Synthesis in Staphylococcus Aureus. Mol. Microbiol. 53 (4), 1221–1231. doi: 10.1111/j.1365-2958.2004.04200.x
Lee, A. S., de Lencastre, H., Garau, J., Kluytmans, J., Malhotra-Kumar, S., Peschel, A., et al. (2018). Methicillin-Resistant Staphylococcus Aureus. Nat. Rev. Dis. Primers 4, 18033. doi: 10.1038/nrdp.2018.33
Le Pabic, H., Germain-Amiot, N., Bordeau, V., Felden, B. (2015). A Bacterial Regulatory RNA Attenuates Virulence, Spread and Human Host Cell Phagocytosis. Nucleic Acids Res. 43 (19), 9232–9248. doi: 10.1093/nar/gkv783
Li, F. L., Liu, J. P., Bao, R. X., Yan, G., Feng, X., Xu, Y. P., et al. (2018). Acetylation Accumulates PFKFB3 in Cytoplasm to Promote Glycolysis and Protects Cells From Cisplatin-Induced Apoptosis. Nat. Commun. 9 (1), 508. doi: 10.1038/s41467-018-02950-5
Lomas-Lopez, R., Paracuellos, P., Riberty, M. N., Cozzone, A. J., Duclos, B. (2007). Several Enzymes of the Central Metabolism Are Phosphorylated Instaphylococcus Aureus. FEMS Microbiol. Lett. 272 (1), 35–42. doi: 10.1111/j.1574-6968.2007.00742.x
Luo, Z., Yue, S., Chen, T., She, P., Wu, Y., Wu, Y. (2020). Reduced Growth of Under High Glucose Conditions Is Associated With Decreased Pentaglycine Expression. Front. Microbiol. 11, 537290. doi: 10.3389/fmicb.2020.537290
Maiuolo, J., Oppedisano, F., Gratteri, S., Muscoli, C., Mollace, V. (2016). Regulation of Uric Acid Metabolism and Excretion. Int. J. Cardiol. 213, 8–14. doi: 10.1016/j.ijcard.2015.08.109
McCarthy, H., Rudkin, J. K., Black, N. S., Gallagher, L., O’Neill, E., O’Gara, J. P. (2015). Methicillin Resistance and the Biofilm Phenotype in Staphylococcus Aureus. Front. Cell Infect. Microbiol. 5, 1. doi: 10.3389/fcimb.2015.00001
Mongodin, E., Finan, J., Climo, M. W., Rosato, A., Gill, S., Archer, G. L. (2003). Microarray Transcription Analysis of Clinical Staphylococcus Aureus Isolates Resistant to Vancomycin. J. Bacteriol. 185 (15), 4638–4643. doi: 10.1128/jb.185.15.4638-4643.2003
Moormeier, D. E., Bayles, K. W. (2017). Staphylococcus Aureus Biofilm: A Complex Developmental Organism. Mol. Microbiol. 104 (3), 365–376. doi: 10.1111/mmi.13634
Pichon, C., Felden, B. (2005). Small RNA Genes Expressed From Staphylococcus Aureus Genomic and Pathogenicity Islands With Specific Expression Among Pathogenic Strains. Proc. Natl. Acad. Sci. U. S. A. 102 (40), 14249–14254. doi: 10.1073/pnas.0503838102
Postma, P. W., Lengeler, J. W., Jacobson, G. R. (1993). Phosphoenolpyruvate:carbohydrate Phosphotransferase Systems of Bacteria. Microbiol. Rev. 57 (3), 543–594. doi: 10.1128/mr.57.3.543-594.1993
Rajagopal, M., Walker, S. (2017). Envelope Structures of Gram-Positive Bacteria. Curr. Top. Microbiol. Immunol. 404, 1–44. doi: 10.1007/82_2015_5021
Richardson, A. R. (2019). Virulence and Metabolism. Microbiol. Spectr. 7 (2), 1–14. doi: 10.1128/microbiolspec.GPP3-0011-2018
Sassi, M., Augagneur, Y., Mauro, T., Ivain, L., Chabelskaya, S., Hallier, M., et al. (2015). SRD: A Staphylococcus Regulatory RNA Database. RNA 21 (5), 1005–1017. doi: 10.1261/rna.049346.114
Sayed, N., Jousselin, A., Felden, B. (2011). A Cis-Antisense RNA Acts in Trans in Staphylococcus Aureus to Control Translation of a Human Cytolytic Peptide. Nat. Struct. Mol. Biol. 19 (1), 105–112. doi: 10.1038/nsmb.2193
Schilcher, K., Horswill, A. R. (2020). Staphylococcal Biofilm Development: Structure, Regulation, and Treatment Strategies. Microbiol. Mol. Biol. Rev. MMBR 84 (3), e00026–19. doi: 10.1128/MMBR.00026-19
Schultheisz, H. L., Szymczyna, B. R., Scott, L. G., Williamson, J. R. (2008). Pathway Engineered Enzymatic De Novo Purine Nucleotide Synthesis. ACS Chem. Biol. 3 (8), 499–511. doi: 10.1021/cb800066p
Seidl, K., Goerke, C., Wolz, C., Mack, D., Berger-Bächi, B., Bischoff, M. (2008). Staphylococcus Aureus CcpA Affects Biofilm Formation. Infect. Immun. 76 (5), 2044–2050. doi: 10.1128/IAI.00035-08
Somerville, G. A., Proctor, R. A. (2009). At the Crossroads of Bacterial Metabolism and Virulence Factor Synthesis in Staphylococci. Microbiol. Mol. Biol. Rev. MMBR 73 (2), 233–248. doi: 10.1128/MMBR.00005-09
Stark, R., Grzelak, M., Hadfield, J. (2019). RNA Sequencing: The Teenage Years. Nat. Rev. Genet. 20 (11), 631–656. doi: 10.1038/s41576-019-0150-2
Tian, T., Wang, C., Wu, M., Zhang, X., Zang, J. (2018). Structural Insights Into the Regulation of Staphylococcus Aureus Phosphofructokinase by Tetramer-Dimer Conversion. Biochemistry 57 (29), 4252–4262. doi: 10.1021/acs.biochem.8b00028
Tong, S. Y. C., Davis, J. S., Eichenberger, E., Holland, T. L., Fowler, V. G. (2015). Staphylococcus Aureus Infections: Epidemiology, Pathophysiology, Clinical Manifestations, and Management. Clin. Microbiol. Rev. 28 (3), 603–661. doi: 10.1128/CMR.00134-14
Wang, L., Wang, S., Li, W. (2012). RSeQC: Quality Control of RNA-Seq Experiments. Bioinf. (Oxford Engl.) 28 (16), 2184–2185. doi: 10.1093/bioinformatics/bts356
Yang, H., Xu, S., Huang, K., Xu, X., Hu, F., He, C., et al. (2020). Anti-Staphylococcus Antibiotics Interfere With the Transcription of Leucocidin ED Gene in Strain Newman. Front. Microbiol. 11, 265. doi: 10.3389/fmicb.2020.00265
Keywords: Staphylococcus aureus, SprC, small RNA, transcriptome, regulation role, metabolomics
Citation: Zhou J, Zhao H, Yang H, He C, Shu W, Cui Z and Liu Q (2022) Insights Into the Impact of Small RNA SprC on the Metabolism and Virulence of Staphylococcus aureus. Front. Cell. Infect. Microbiol. 12:746746. doi: 10.3389/fcimb.2022.746746
Received: 24 July 2021; Accepted: 31 January 2022;
Published: 23 February 2022.
Edited by:
Ghassan M. Matar, American University of Beirut, LebanonReviewed by:
Andrés González, Institute for Health Research Aragón (IIS Aragón), SpainMerve Suzan Zeden, National University of Ireland Galway, Ireland
Copyright © 2022 Zhou, Zhao, Yang, He, Shu, Cui and Liu. This is an open-access article distributed under the terms of the Creative Commons Attribution License (CC BY). The use, distribution or reproduction in other forums is permitted, provided the original author(s) and the copyright owner(s) are credited and that the original publication in this journal is cited, in accordance with accepted academic practice. No use, distribution or reproduction is permitted which does not comply with these terms.
*Correspondence: Qingzhong Liu, amlhb2RhbWVkaWNpbmVAZm94bWFpbC5jb20=