 Xvwen Zhai1†
 Min Feng2†
 Hui Guo3,4†
 Zhaojun Liang2
 Yanlin Wang2
 Yan Qin2
 Yanyao Wu2
 Xiangcong Zhao2
 Chong Gao5
 Jing Luo2*
- 1Clinical Skills Teaching Simulation Hospital, Shanxi Medical University, Jinzhong, China
- 2Department of Rheumatology, The Second Hospital of Shanxi Medical University, Taiyuan, China
- 3Division of Nephrology, Department of Medicine, The Second Hospital of Shanxi Medical University, Taiyuan, China
- 4Division of Nephrology, Department of Medicine, The Shenzhen Baoan Shiyan People’s Hospital, Shenzhen, China
- 5Department of Pathology, Brigham and Women’s Hospital and Harvard Medical School, Boston, MA, United States
Objectives: Distinguishing flares from bacterial infections in systemic lupus erythematosus (SLE) patients remains a challenge. This study aimed to build a model, using multiple blood cells and plasma indicators, to improve the identification of bacterial infections in SLE.
Design: Building PLS-DA/OPLS-DA models and a bioscore system to distinguish bacterial infections from lupus flares in SLE.
Setting: Department of Rheumatology of the Second Hospital of Shanxi Medical University.
Participants: SLE patients with flares (n = 142) or bacterial infections (n = 106) were recruited in this retrospective study.
Outcome: The peripheral blood of these patients was collected by the experimenter to measure the levels of routine examination indicators, immune cells, and cytokines. PLS-DA/OPLS-DA models and a bioscore system were established.
Results: Both PLS-DA (R2Y = 0.953, Q2 = 0.931) and OPLS-DA (R2Y = 0.953, Q2 = 0.942) models could clearly identify bacterial infections in SLE. The white blood cell (WBC), neutrophile granulocyte (NEUT), erythrocyte sedimentation rate (ESR), C-reactive protein (CRP), procalcitonin (PCT), interleukin-6 (IL-6), IL-10, interferon-γ (IFN-γ), and tumor necrosis factor α (TNF-α) levels were significantly higher in bacteria-infected patients, while regulatory T (Treg) cells obviously decreased. A multivariate analysis using the above 10 dichotomized indicators, based on the cut-off value of their respective ROC curve, was established to screen out the independent predictors and calculate their weights to build a bioscore system, which exhibited a strong diagnosis ability (AUC = 0.842, 95% CI 0.794–0.891). The bioscore system showed that 0 and 100% of SLE patients with scores of 0 and 8–10, respectively, were infected with bacteria. The higher the score, the greater the likelihood of bacterial infections in SLE.
Conclusions: The PLS-DA/OPLS-DA models, including the above biomarkers, showed a strong predictive ability for bacterial infections in SLE. Combining WBC, NEUT, CRP, PCT, IL-6, and IFN-γ in a bioscore system may result in faster prediction of bacterial infections in SLE and may guide toward a more appropriate, timely treatment for SLE.
Introduction
Systemic lupus erythematosus (SLE) is a chronic autoimmune and multisystemic inflammatory disorder, which is characterized by multiple organ involvement and autoantibody secretion. Although both external factors, such as estrogenic hormones, pollution, and microorganisms, and internal factors, such as genes, have been investigated in the pathogenesis of SLE, the etiology of SLE remains to be elucidated (Illescas-Montes et al., 2019). The unbalanced autoimmune background and predominant immunosuppressive therapy give rise to susceptibility for infections in SLE (Wang et al., 2019). Approximately half of SLE patients develop infections during their disease progression, and bacterial infections remain the leading cause of morbidity and mortality in SLE (Allen et al., 2002; Furst et al., 2007; Feng et al., 2019). Distinguishing flares from bacterial infections in SLE remains a common dilemma for health care workers, in view of the clinical signs and symptoms of bacterial infections, such as fever, joint pain, and shortness of breath, mimicking those of flares in SLE. The empirical use of broad-spectrum antibiotics results in antibiotic resistance (Soni et al., 2013). Owing to the therapeutic regimens for bacterial infections being different from those for flares in SLE, timely diagnosis and correct treatment are crucial, and an improper treatment strategy may be fatal (Echeverri et al., 2018). Moreover, infections may contribute to the onset and exacerbations of SLE (Esposito et al., 2014).
While several biomarkers have been well demonstrated to differentiate bacterial infections and lupus flares in SLE (Hussein et al., 2010; Yang et al., 2010; Serio et al., 2014; Ajmani et al., 2019), there is a paucity of studies establishing integrated models or bioscore systems to effectively differentiate the two populations. Microorganism isolation serves as the confirmatory process for the detection of bacterial infections but has a long turn-around time and is susceptible to many factors, resulting in low sensitivity (Yang et al., 2016; Ye et al., 2016). Routine blood tests and serological indicators, such as white blood cells (WBC), the erythrocyte sedimentation rate (ESR), C-reactive protein (CRP), procalcitonin (PCT), interleukin-6 (IL-6), interleukin-10 (IL-10), and tumor necrosis factor α (TNF-α), have been assessed to diagnose bacterial infections in a short period (Marshall et al., 2003; Ospina et al., 2017; Thamphiwatana et al., 2017). A review by Baicus C concluded that the ratio of ESR/CRP >15 suggests lupus flares, while a ratio of less than 2 may indicate the occurrence of bacterial infections (Dima et al., 2016). However, no single biomarker has exhibited adequate sensitivity and specificity to serve as a standard tool for identifying bacterial infections (Holmes et al., 2003; Pierrakos and Vincent, 2010; Faix, 2011). Hence, the complexity of effectively distinguishing bacterial infections from lupus flares in SLE presents the need for an integrated method combining multiple biomarkers, or a more appropriate scoring system that can provide better insights into the diagnosis of bacterial infections in SLE.
In this study, we developed a novel, simple, and relatively accurate method to observe its capacity to distinguish bacterial infections from flares in SLE, by simultaneously integrating routine examination biomarkers, immune cell subpopulations, and serum cytokines, which were reported to be efficient in discovering the truth of bacterial infections.
Methods
Study Participants
In this retrospective study, 248 SLE patients were recruited, of which 221 were females and 27 males, with a median age of 38.00 years. They were diagnosed and admitted to the Second Hospital of Shanxi Medical University from January 2018 to December 2019, according to the American College of Rheumatology 1997 revised classification criteria for SLE. The disease activity of patients was evaluated based on Systemic Lupus Erythematosus Disease Activity Index (SLEDAI) (Bombardier et al., 1992), and a flare was regarded as three points higher than their previous SLEDAI (Bador et al., 2012). Out of the 248 SLE patients, 106 were thought to be infected by bacteria, and the criteria for bacterial infections were: 1) positive bacterial isolation in suspected infection sites; 2) typical clinical symptoms and signs of bacterial infections, such as fever, cough, sore throat, expectoration, diarrhea, pus discharge, dysuria, frequent and urgent urination; 3) imaging-positive results, including ultrasound, X-ray, and computed tomography; and 4) positive feedback on antibacterial treatment. Patients who were younger than 18 years of age, treated with antibiotics prior to admission, pregnant, or suffering from viral and fungal infections, cancer, or other autoimmune diseases were excluded. The ethics committee of the Second Hospital of Shanxi Medical University has approved our study (2016KY007), and all patients signed the informed consent.
Routine Examination Biomarker
Peripheral blood samples were collected immediately after admission and before drug administration. Blood routine examination, including WBC, red blood cells (RBC), hemoglobin (Hb), platelet (PLT), lymphocyte (LYMP), and neutrophile granulocyte (NEUT), was performed using the Sysmex XN-9000 automated hematology analyzer. Complements 3 and 4 (C3, C4) and CRP were evaluated using the Beckman Coulter IMMAGE800 automatic protein analyzer. The levels of PCT and immunoglobulin (IgM, IgA, and IgG) were measured using the Beckman Coulter AU680 biochemical analyzer and ELISA, respectively.
Immune Cell Subpopulations
For analyzing peripheral immune cell subpopulations, including CD3+T, CD4+T, CD8+T, B, and NK cells, we first added 50 μl EDTA-anticoagulated blood into Trucount tubes A and B (Becton-Dickinson, USA) respectively, whose own beads could eliminate the variation caused by manually adding reference beads before. CD3+T, CD4+T, and CD8+T cells were labeled with anti-CD3/CD4/CD8/CD45 antibodies in tube A. B and NK cells were identified by anti-CD3/CD16/CD56/CD45/CD19 antibodies in tube B. We collected these cells using flow cytometry (BD FACSCanto II) and analyzed them using the FACSCanto software. For Th1, Th2, and Th17 cells in the CD4+T subpopulation, we first used Ionomycin, PMA, and GolgiStop to stimulate the cells. Th1, Th2, and Th17 cells were then labeled by anti-CD4 and anti-IFN-γ/IL-4/IL-17 antibodies, respectively. Treg cells were identified with anti-CD4/CD25/FoxP3 antibodies. Finally, cells were collected using flow cytometry (BD FACSCalibur) and analyzed using the MultiSET software. Number of CD4+T subpopulations = the percentage of CD4+T subpopulations * the number of CD4+T cells.
Cytokines
The concentrations of serum IL-2, IL-4, IL-6, IL-10, IL-17, TNF-α, and IFN-γ were detected using magnetic bead-based multiplex assays (Human Th1/Th2/Th17 subpopulation test kit: JIANGXI CELLGENE BIOTECH CO., LTD) following the manufacturer’s instructions. In brief, 25 μl of fluorescence detection reagent was incubated with an equivalent amount of EDTA anticoagulant plasma for 2.5 h at room temperature. We then used 1 ml of phosphate-buffered saline (PBS) to wash the mixture, and discarded the supernatant. The BD FACSDiva software was used to measure the levels of cytokines, and experimental data were analyzed using the FCAP software.
Statistical Analysis
All data were analyzed using the SPSS22.0, SIMCA 14.1, and MedCalc softwares. Data were recorded as mean ± SD or median (Q25, Q75) for continuous variables, which were compared using the independent samples t-test or the Mann-Whitney U test. The Chi-square test was used to compare the difference between dichotomous variables. Partial least square discriminant analysis (PLS-DA) and supervised orthogonal PLS-DA (OPLS-DA) were conducted using the SIMCA 14.1 software to perform multivariate analysis of the data and further group the SLE patients with bacterial infections and lupus flares. Biomarkers containing more than 50% losing values were excluded. We normalized the data by mean centering and variance scaling. The seven-fold cross-validation (CV) approach was used to validate the multivariate models, and the R2Y, i.e., the explained ability of the model and Q2, i.e., the predictive power of the model, were calculated. Receiver operating characteristic (ROC) curves were drawn for the calculated significant indicators, to investigate their identification ability for bacterial infections in SLE. The cut-off value was selected by determining the point on the ROC curve closest to the ideal test of 100% sensitivity and specificity. The area under the ROC curve (AUC), sensitivity, specificity, positive likelihood ratio (PLR), negative likelihood ratio (NLR), positive predictive value (PPV), negative predictive value (NPV), and comparisons of these AUC were performed by MedCalc software. Significant indicators, based on the cut-off value of their respective ROC curve, were dichotomized to complete a multivariate analysis, which could screen out independent predictors and give different weights. Radar charts of the six independent predictors were drawn to characterize the bioscore distribution of SLE patients with bacterial infections and with lupus flares, visually demonstrating the advantage of the bioscore system in identifying bacterial infections in SLE. A two-sided P-value <0.05 was considered statistically significant.
Results
Demographic Data
Between January 2018 and December 2019, a total of 503 SLE patients were diagnosed and admitted to the Second Hospital of Shanxi Medical University. Figure 1 showed the inclusion and exclusion criteria for SLE patients in the study. In total, 248 SLE patients were recruited in the study. Out of these, 142 (124 females and 18 males with a median age of 36.50 years) had lupus flares and 106 (97 females and 9 males with a median age of 39.00 years) were infected with bacteria, of which 78 presented respiratory infections, 8 presented urinary tract infections, 7 presented digestive tract infections, 5 presented soft tissue infections, and 8 presented bacteremia. No significant difference was found in age (P = 0.291) and sex distribution (P = 0.295) between the two groups. The demographic data and experimental results of patients were summarized in Table 1.
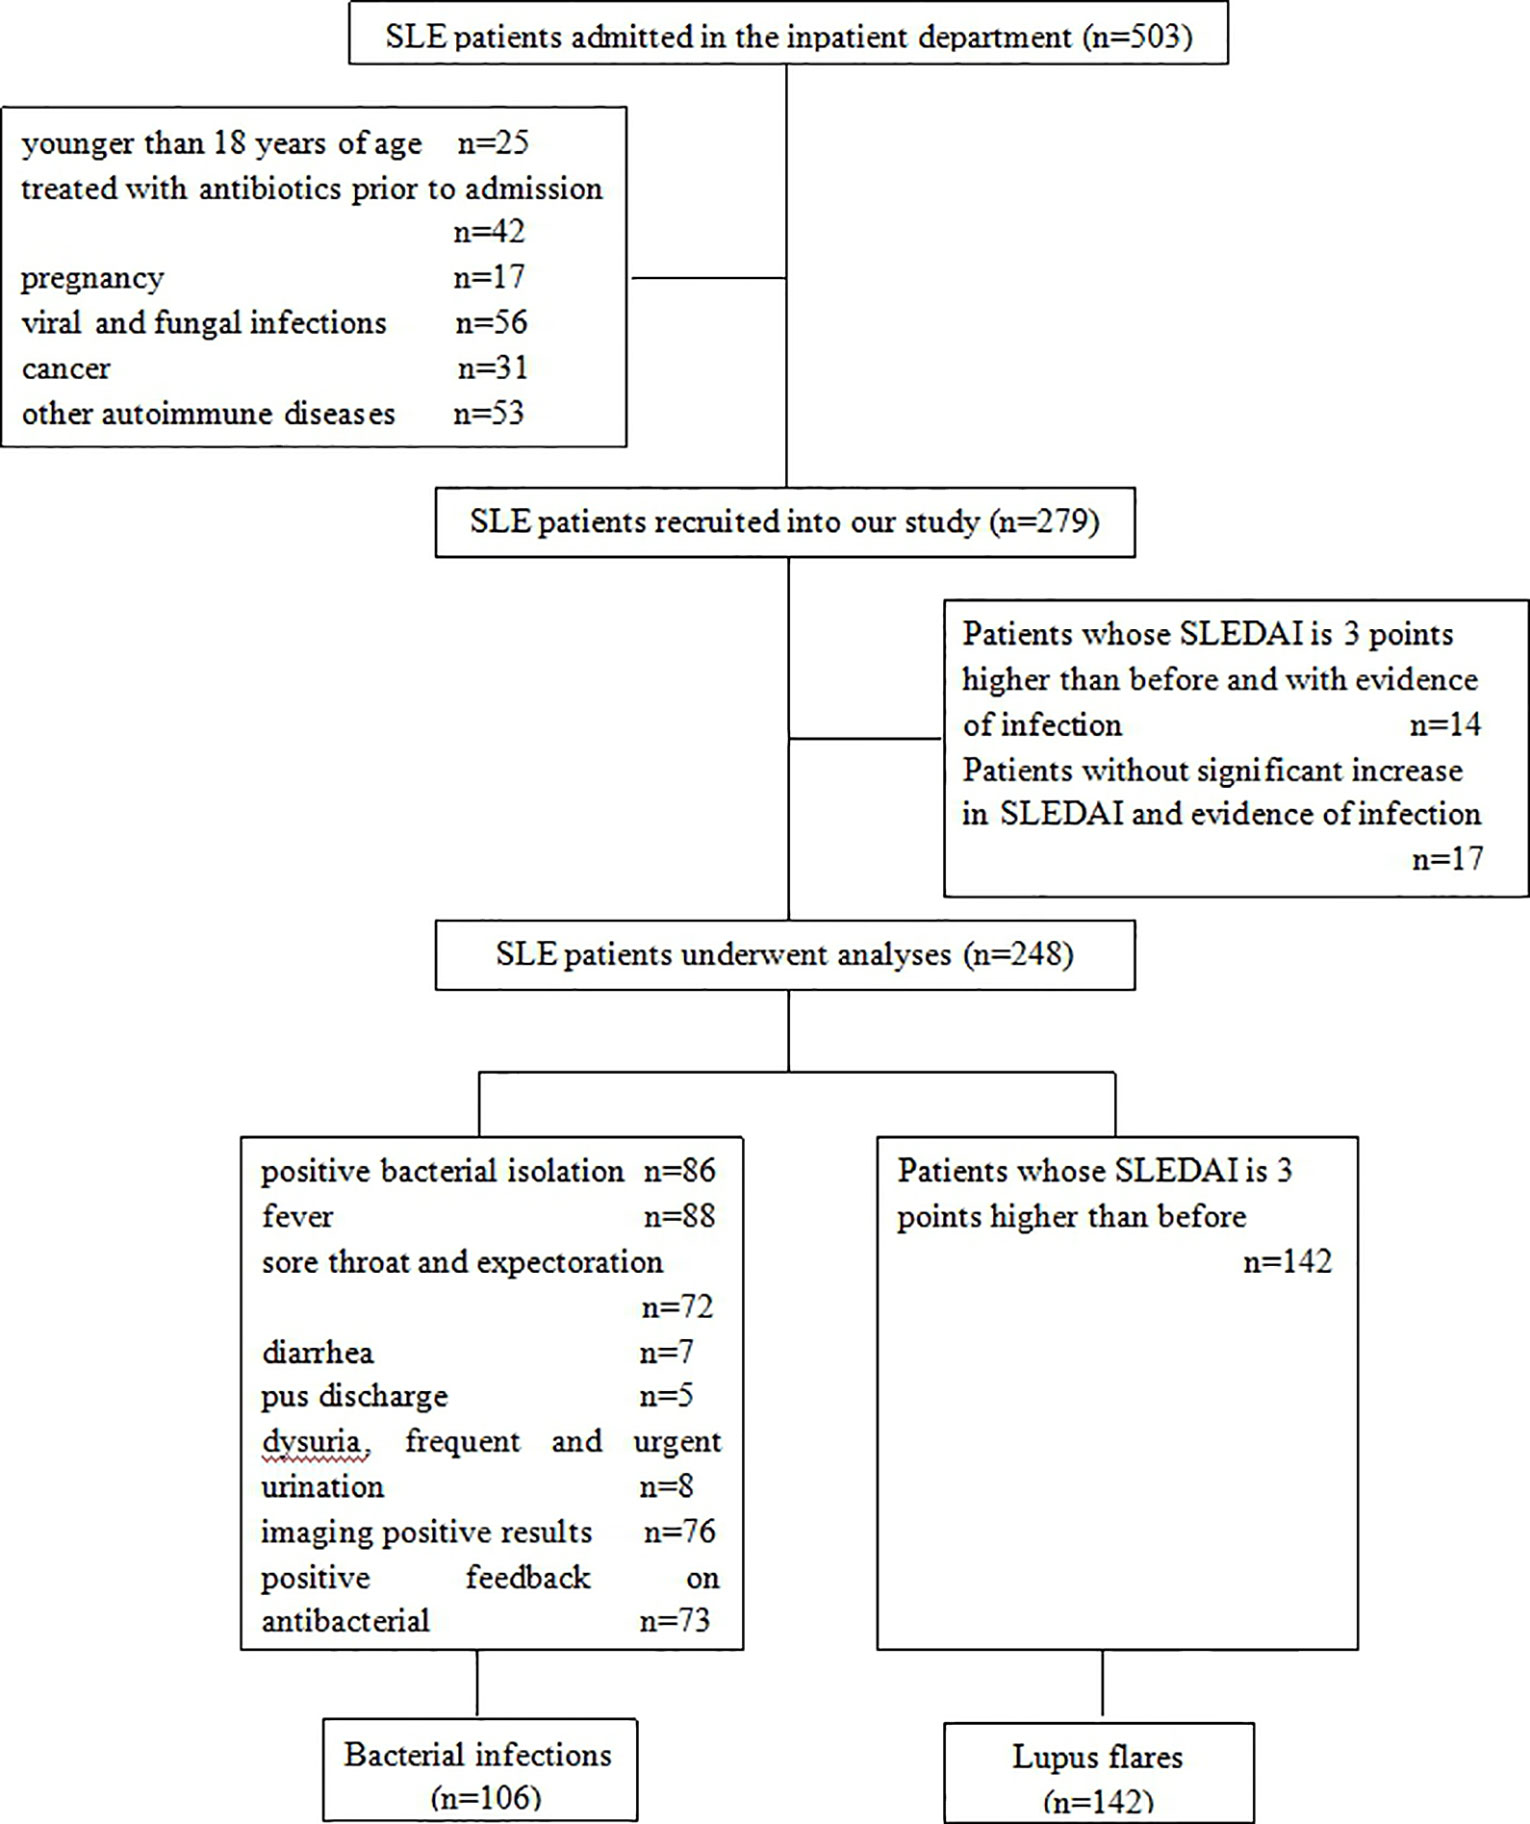
Figure 1 Flowchart for the inclusion and exclusion of SLE patients in the study.
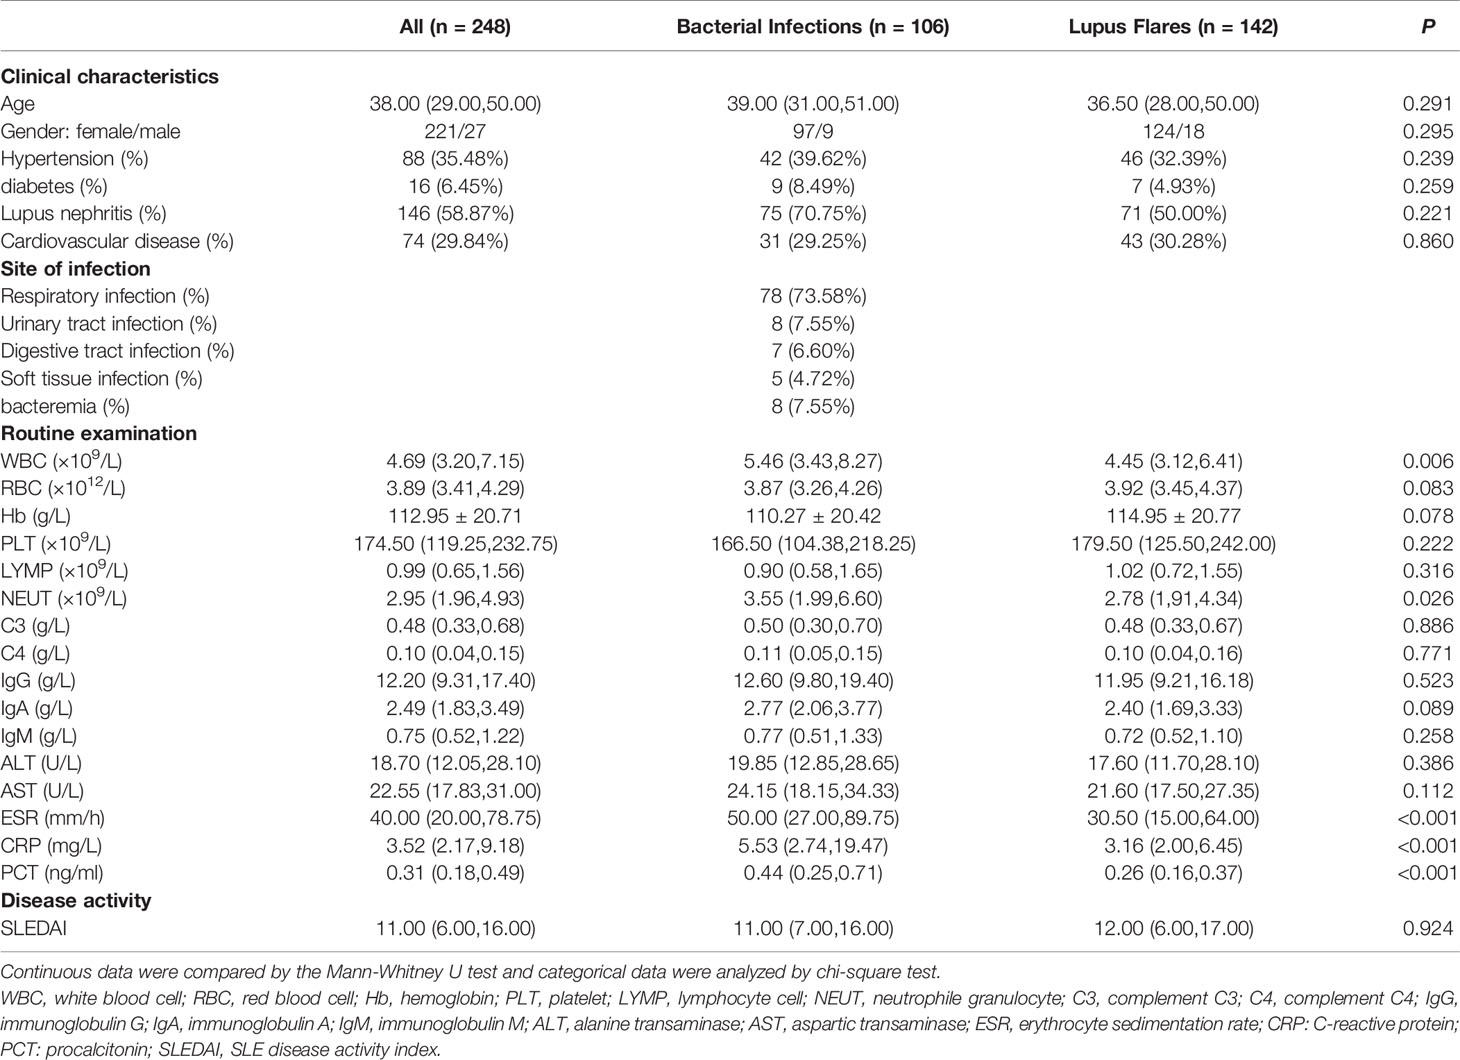
Table 1 Clinical characteristics and routine examination results of SLE patients.
Predictive Models for Distinguishing Bacterial Infections From Lupus Flares in SLE
Both PLS-DA and OPLS-DA models, including the whole indicators to distinguish bacterial infections from lupus flares in SLE, were constructed. The following results were obtained in the PLS-DA model: R2Y = 0.996 and Q2 = 0.989 when the four major components were extracted; R2Y = 0.978 and Q2 = 0.963 when the three major components were extracted; and R2Y = 0.953 and Q2 = 0.931 when two major components were extracted, and each major component had a P-value below 0.05. In the OPLS-DA model, following results were obtained: R2Y = 0.996 and Q2 = 0.992 when the four major components were extracted; R2Y = 0.978 and Q2 = 0.976 when the three major components were extracted; and R2Y = 0.953 and Q2 = 0.942 when two major components were extracted, and the P-value of each component was less than 0.05. Taken together, we believe that the two models have sufficient explanatory ability and predictive power when two principal components are extracted from the two models (Figures 2A, B). Furthermore, the observed vs. predicted plot (Figure 2C) of the OPLS-DA model demonstrated that all SLE patients were correctly identified as having bacterial infections or flares, indicating that the model had a strong predictive ability for bacterial infections. Variable Important for the Projection (VIP) in the PLS-DA/OPLS-DA model is calculated to measure the influence intensity and explanatory ability of each indicator on the classification and discrimination of different groups, to assist the screening of meaningful variables. In general, a VIP value >1 may indicate a potential meaningful indicator. Based on the VIP values of the two models, we selected several indicators, as shown in Tables 2, 3.
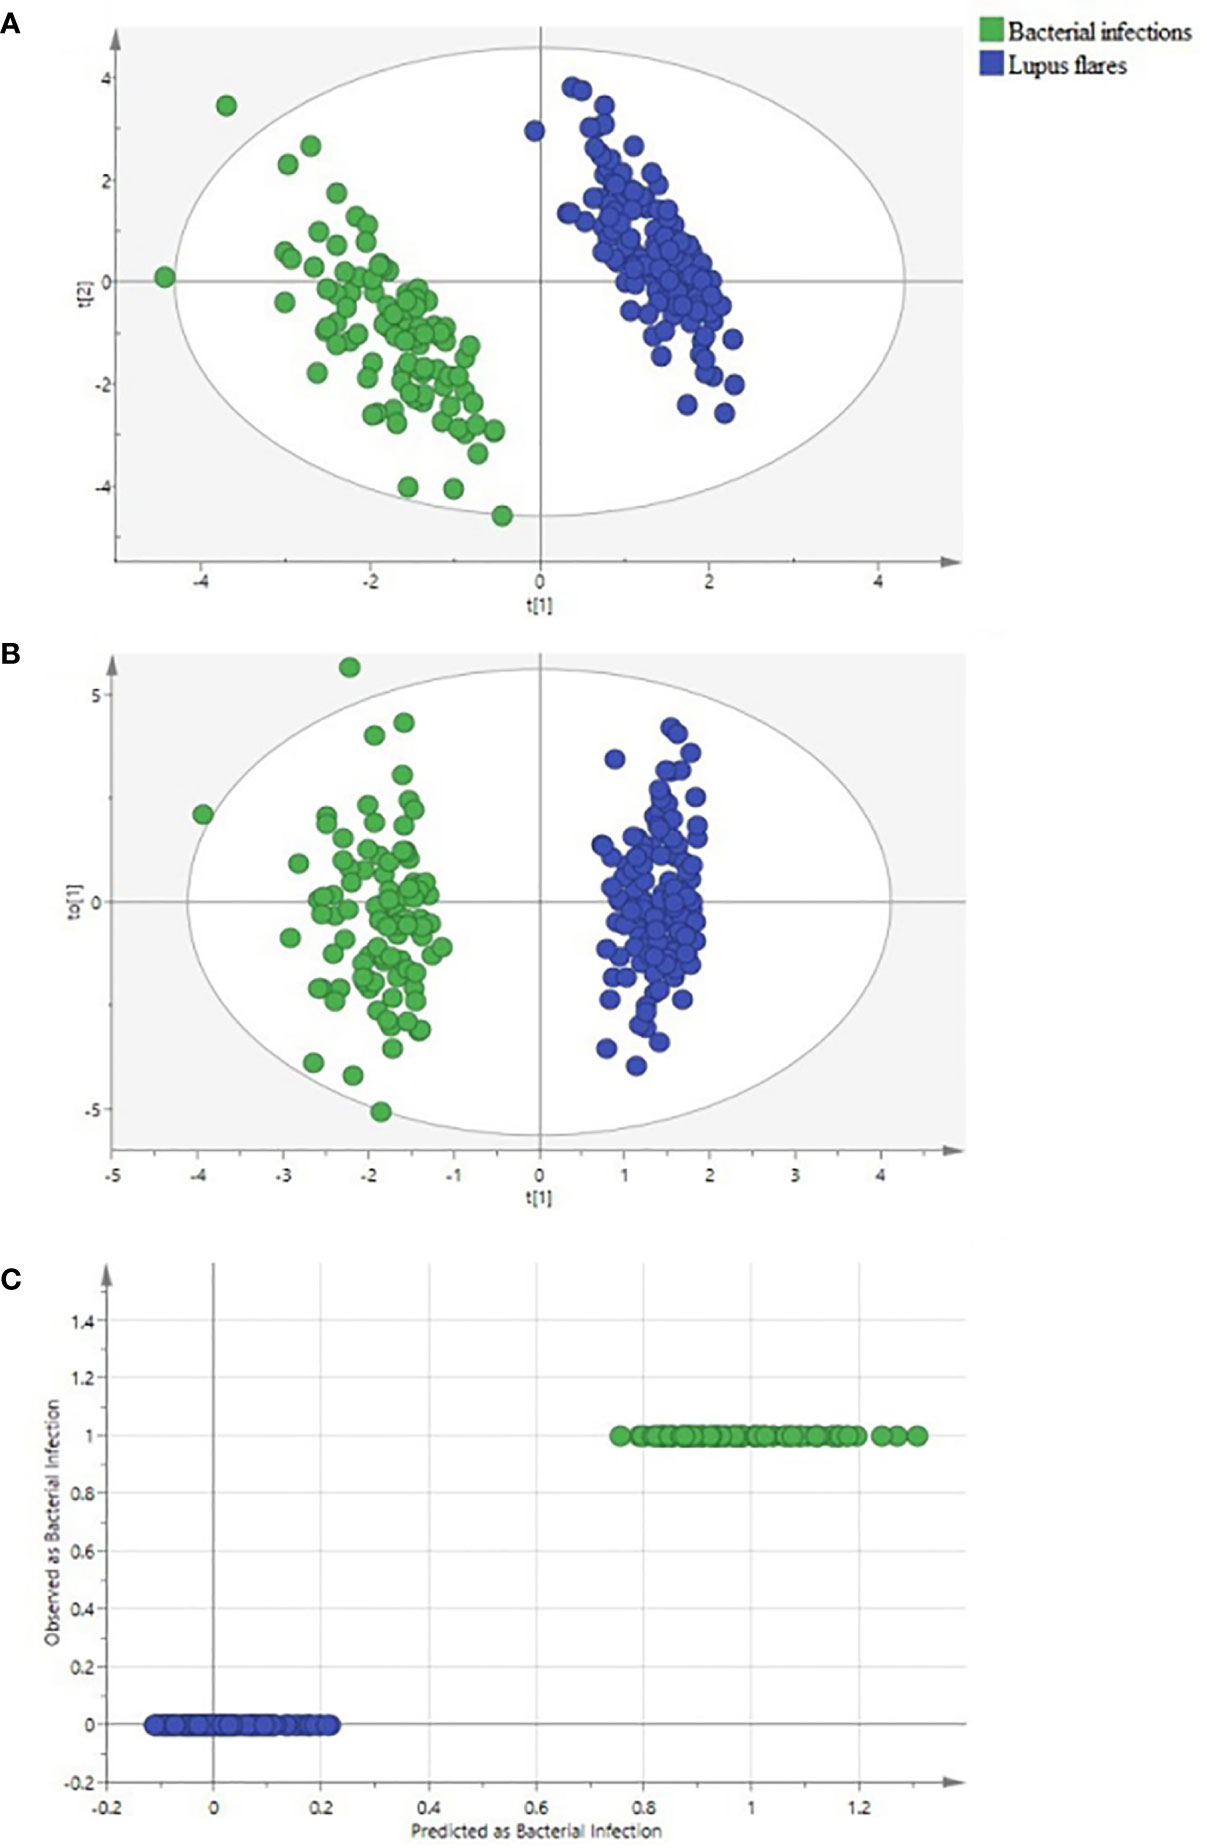
Figure 2 Identification of systemic lupus erythematosus (SLE) patients with bacterial infections and with lupus flares using partial least square discriminant analysis (PLS-DA) and orthogonal PLS-DA (OPLS-DA) methods. (A) the PLS-DA score scatter plot, (B) the OPLS-DA score scatter plot, and (C) the “Predicted vs. Observed” plot for distinguishing bacteria-infected SLE patients (green dots) from lupus flares (blue dots) based on 50 indicators. Both groups were greatly separated in the PLS-DA and OPLS-DA models. None of the SLE patients with lupus flares were predicted as a bacteria-infected SLE patient.
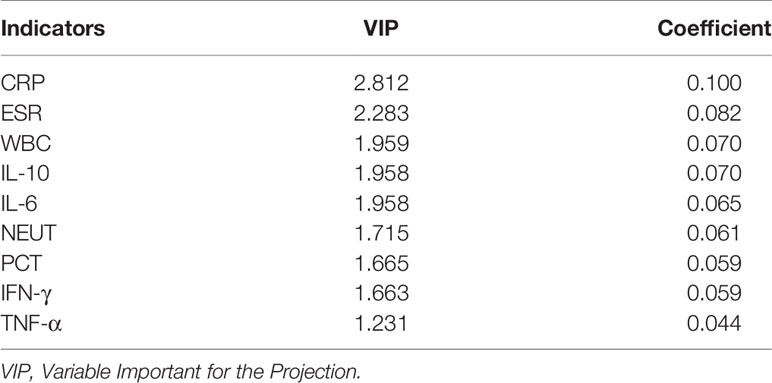
Table 2 Several indicators associated with bacterial infections in SLE based on VIP values in PLS-DA.
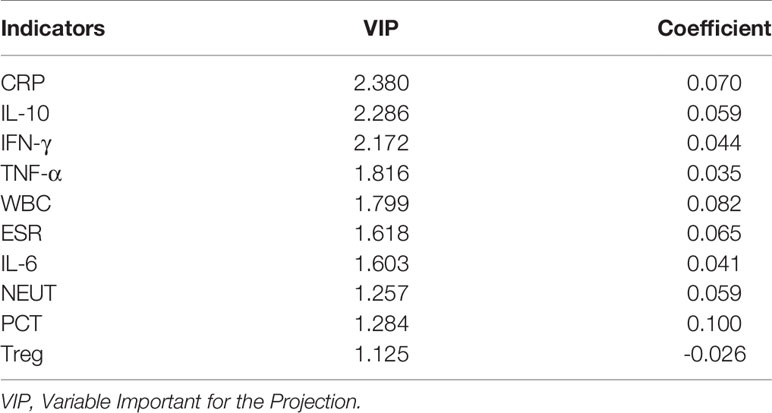
Table 3 Several indicators associated with bacterial infections in SLE based on VIP values in OPLS-DA.
Comparison of Various Indicators Between Bacterial Infections and Lupus Flares
For routine examination indicators, the levels of WBC, NEUT, ESR, CRP, and PCT in the bacteria-infected group were significantly elevated compared to those in the lupus flares group (Table 1). For immune cells subgroups, the absolute number of Treg cells was lower in patients with bacterial infections obviously. For cytokines, the concentrations of IL-6, IL-10, IFN-γ, and TNF-α in the bacteria-infected group were significantly higher than these indicators in the flares group, respectively (Figure 3, Table 4).
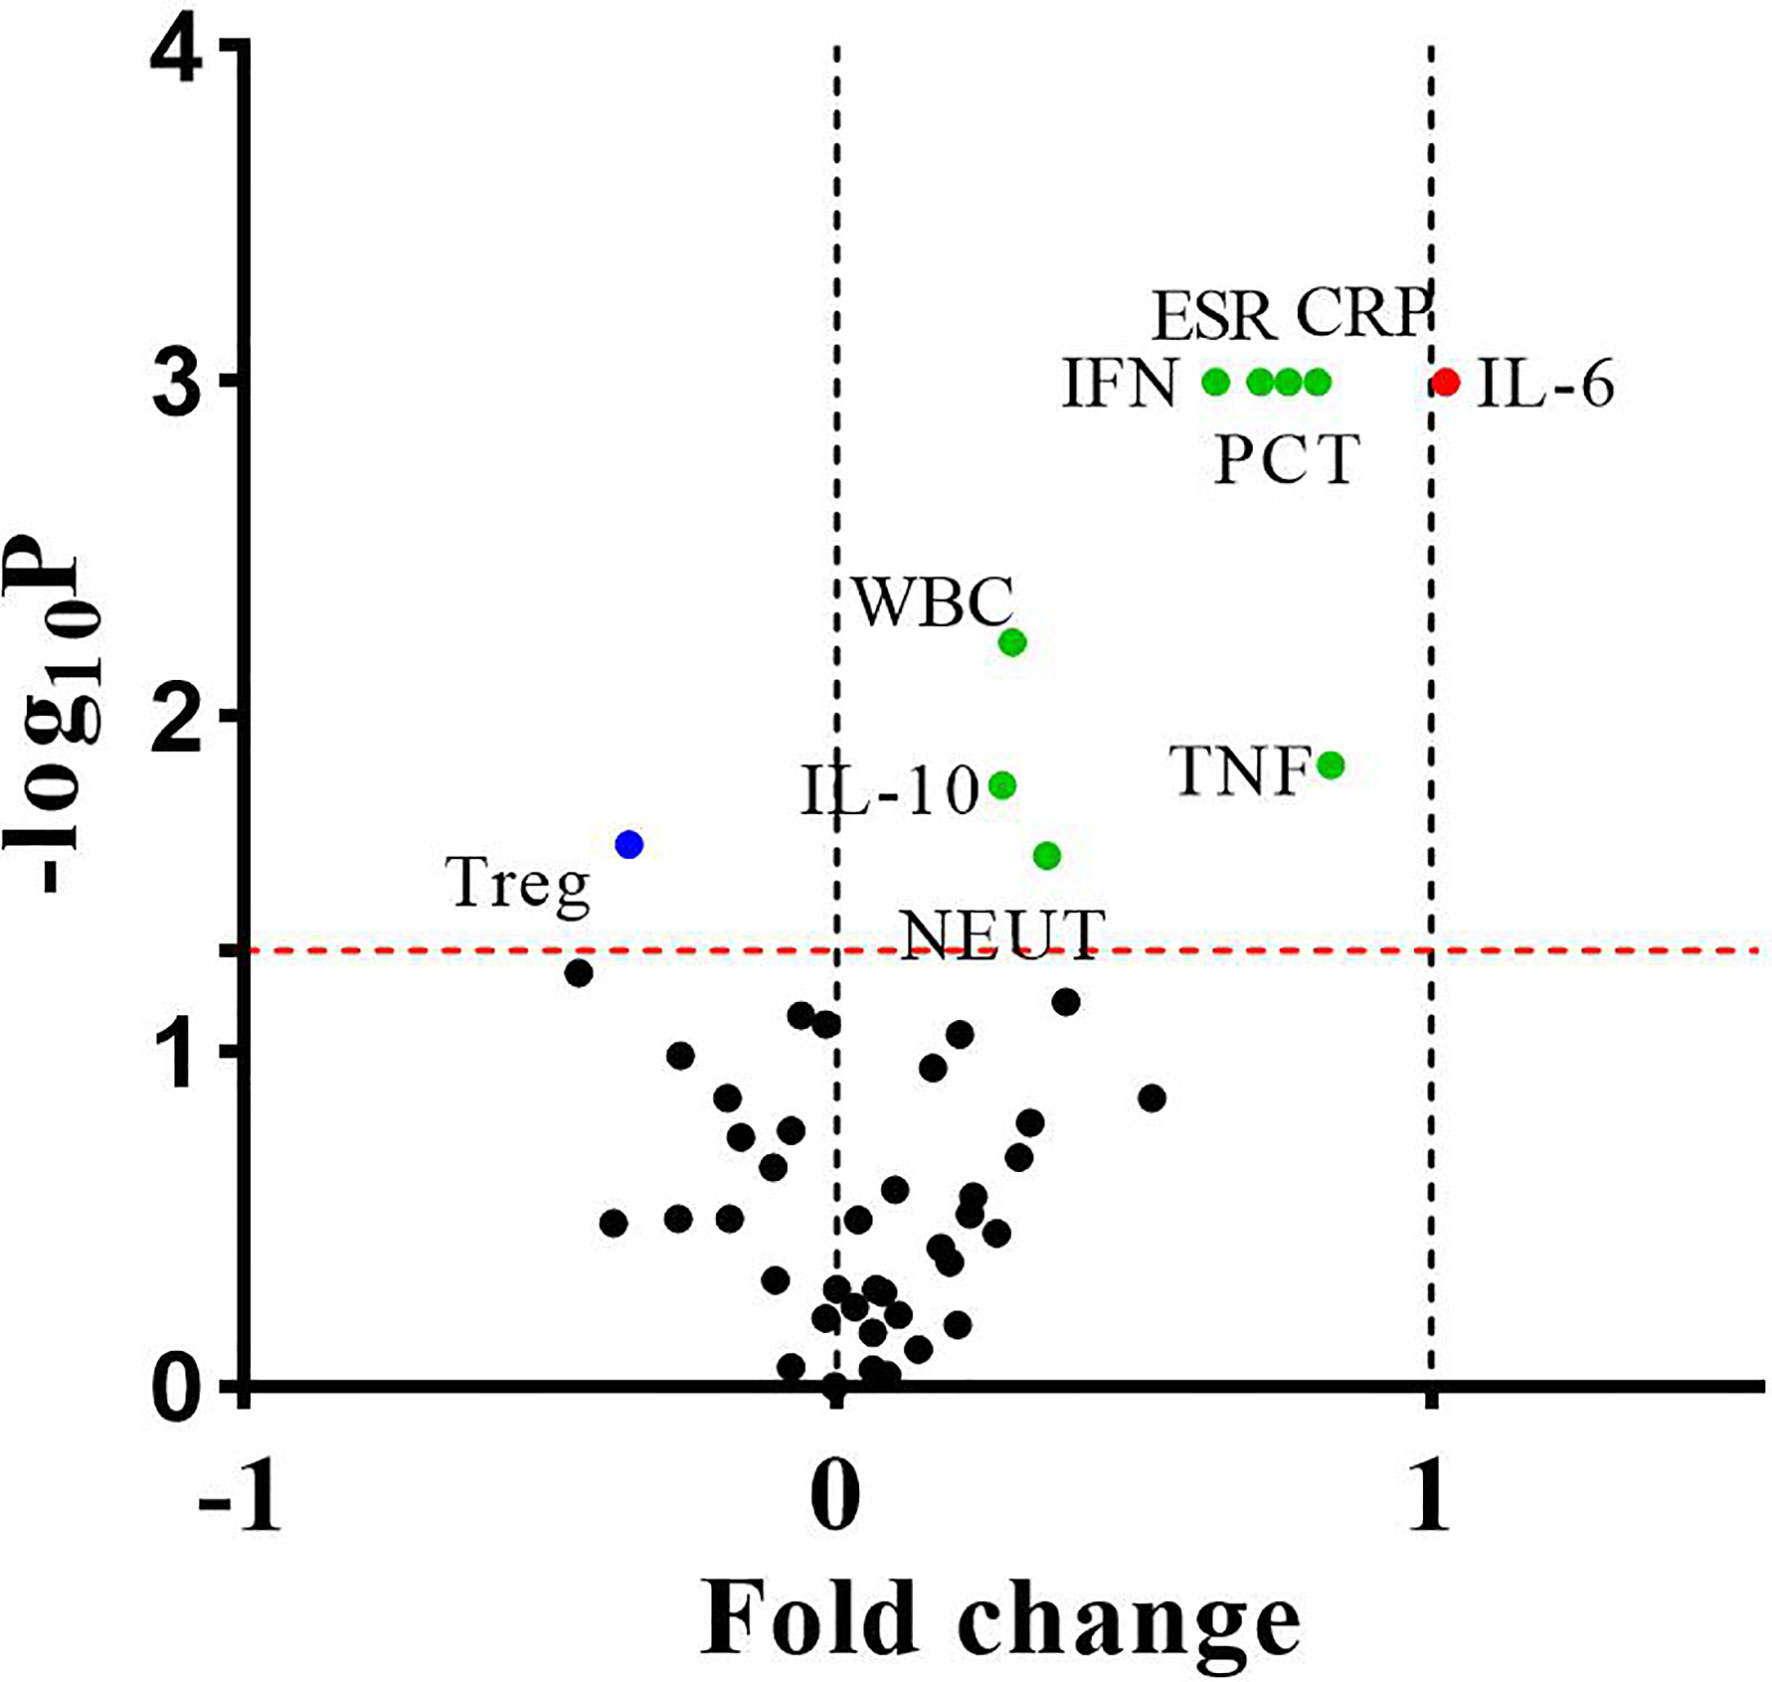
Figure 3 The differences of fifty indicators between 106 bacteria-infected patients and 142 lupus flares patients were showed in the volcano plot. The dots above the horizontal red dotted line indicated that these indicators were significantly different between the two groups (P < 0.05). The dots whose fold change <0 and >0 indicated that these indicators decreased or increased in infected patients, respectively, and the points of fold change >1 represented these indicators of infected patients increased by more than 2 times. P values were calculated by the independent samples t-test or the Mann-Whitney U test.
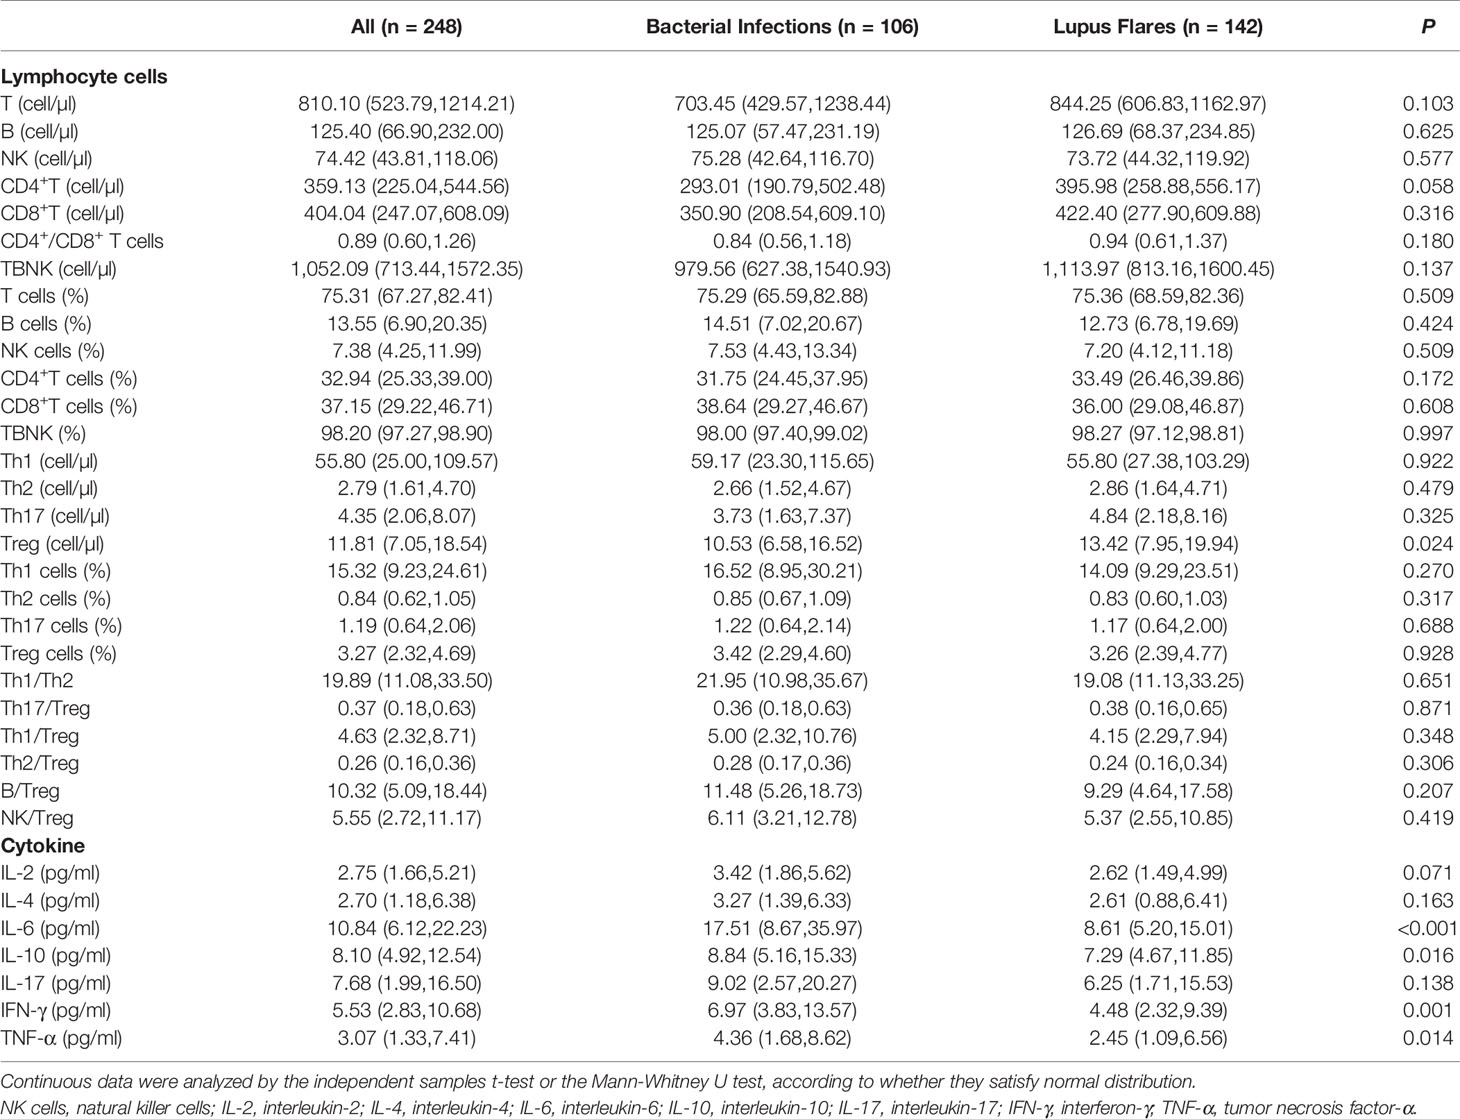
Table 4 Characteristics of lymphocyte subpopulations and cytokine in SLE.
ROC Curves of the 10 Statistically Different Indicators
In total, there were 10 discriminative indicators that were screened out, based on PLS-DA/OPLS-DA models and univariate analysis. ROC curves of the above 10 statistically different indicators were plotted to explore their diagnostic efficiency for bacterial infections. The diagnostic efficiency of the 10 indicators, based on their cut-off values, were summarized in Table 5. The cut-off value for NEUT was set at 6.33 × 10⁹/L, with the highest specificity rate, 93.66%. IFN-γ, whose cut-off value was established as 4.50 pg/ml, had the highest sensitivity rate, 72.64%. PCT, whose cut-off value was set at 0.38 ng/ml, had the largest AUC (0.717).
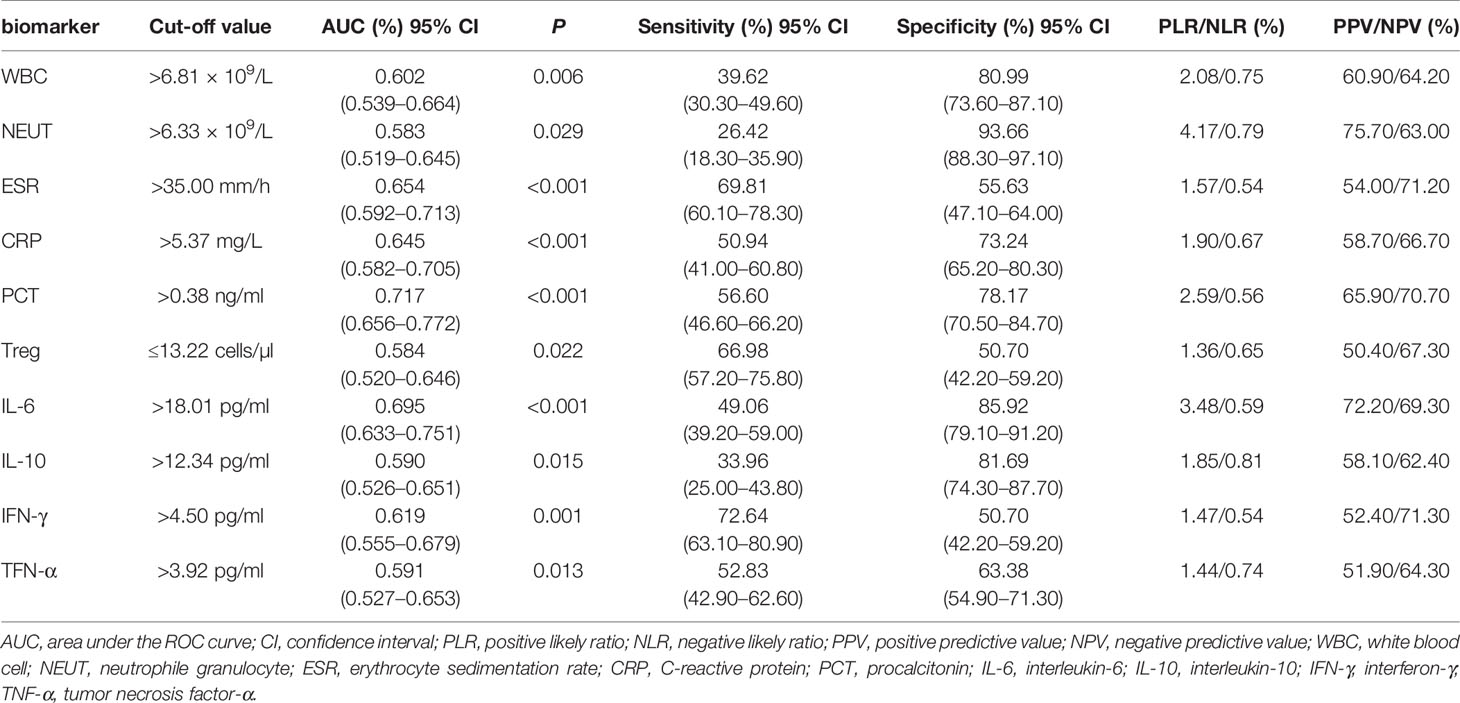
Table 5 Variables of the ROC curve for multiple biomarkers.
Bioscore System for Identifying Bacterial Infections in SLE
These 10 indicators, based on the cut-off value of their respective ROC curves, were dichotomized as high versus low. Each indicator, whose value was higher than its cut-off value, was classified as high and vice versa. Upon the inclusion of these 10 indicators in multivariate analysis, the results showed that WBC, NEUT, CRP, PCT, IL-6, and IFN-γ were independent predictors for bacterial infections in SLE (Table 6). Aiming to reveal the association, more concisely, between these indicators and the likelihood of bacterial infections in SLE, we created a simpler, faster, and more convenient bioscore system using the dichotomized versions of these six independent predictors. The indicator weight, which constitutes the bioscore system, was calculated by dividing the regression coefficient of each indicator by the minimum regression coefficient and rounded to the nearest rounded number. Each weight served as the score of each indicator (Table 7). The score of the bioscore system, hence, ranged from 0 to 10. The ROC curve of the bioscore system was plotted to observe the diagnostic ability for bacterial infections in SLE. The result revealed that the bioscore system could efficiently distinguish bacterial infections from lupus flares in SLE (AUC = 0.842, 95% CI 0.794–0.891). Furthermore, we scored the patients based on the weight of each indicator. The results showed that there were 0.00% and 100.00 of SLE patients with scores of 0, 8–10 infected with bacteria, respectively. There were 12 (85.71%), 47 (79.66%), and 27 (64.29%) patients with lupus flares among patients with bioscores of 1 (n = 14), 2 (n = 59), and 3 (n = 42), respectively. Both bacterial infections (n = 14) and lupus flares (n = 14) occurred in 50% of patients with a bioscore of 4 (n = 28). When the bioscore was >4, these patients were mainly infected with bacteria. The proportions of bacterial infections among SLE patients with scores 5, 6, and 7 were 70.59, 81.25, and 86.67%, respectively. The higher the bioscore, the greater the likelihood of bacterial infections in SLE (Figure 4).
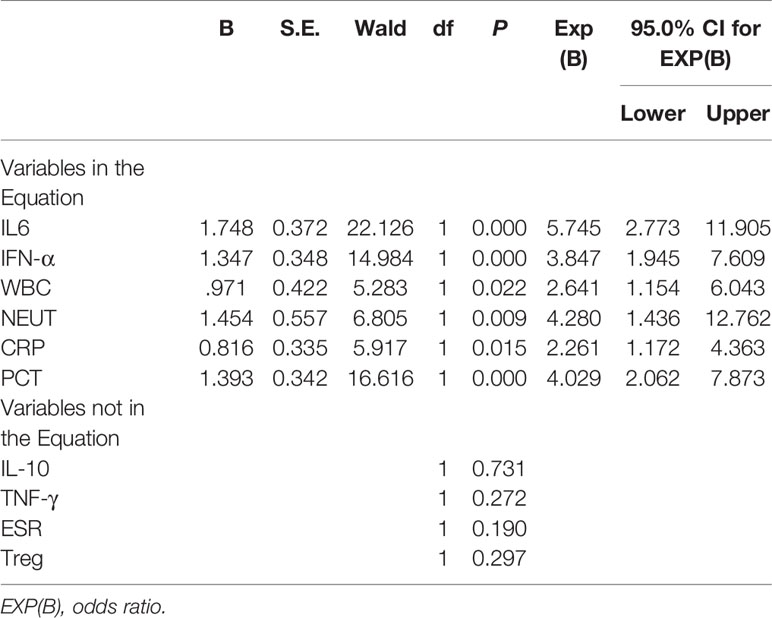
Table 6 Multivariate analysis of the 10 dichotomized indicators.
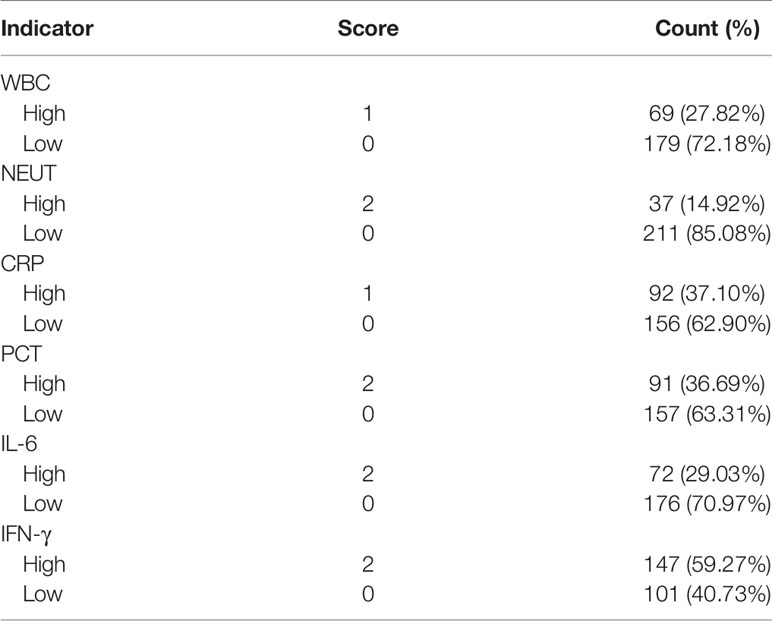
Table 7 Indicator Weights Used to build Bioscore.
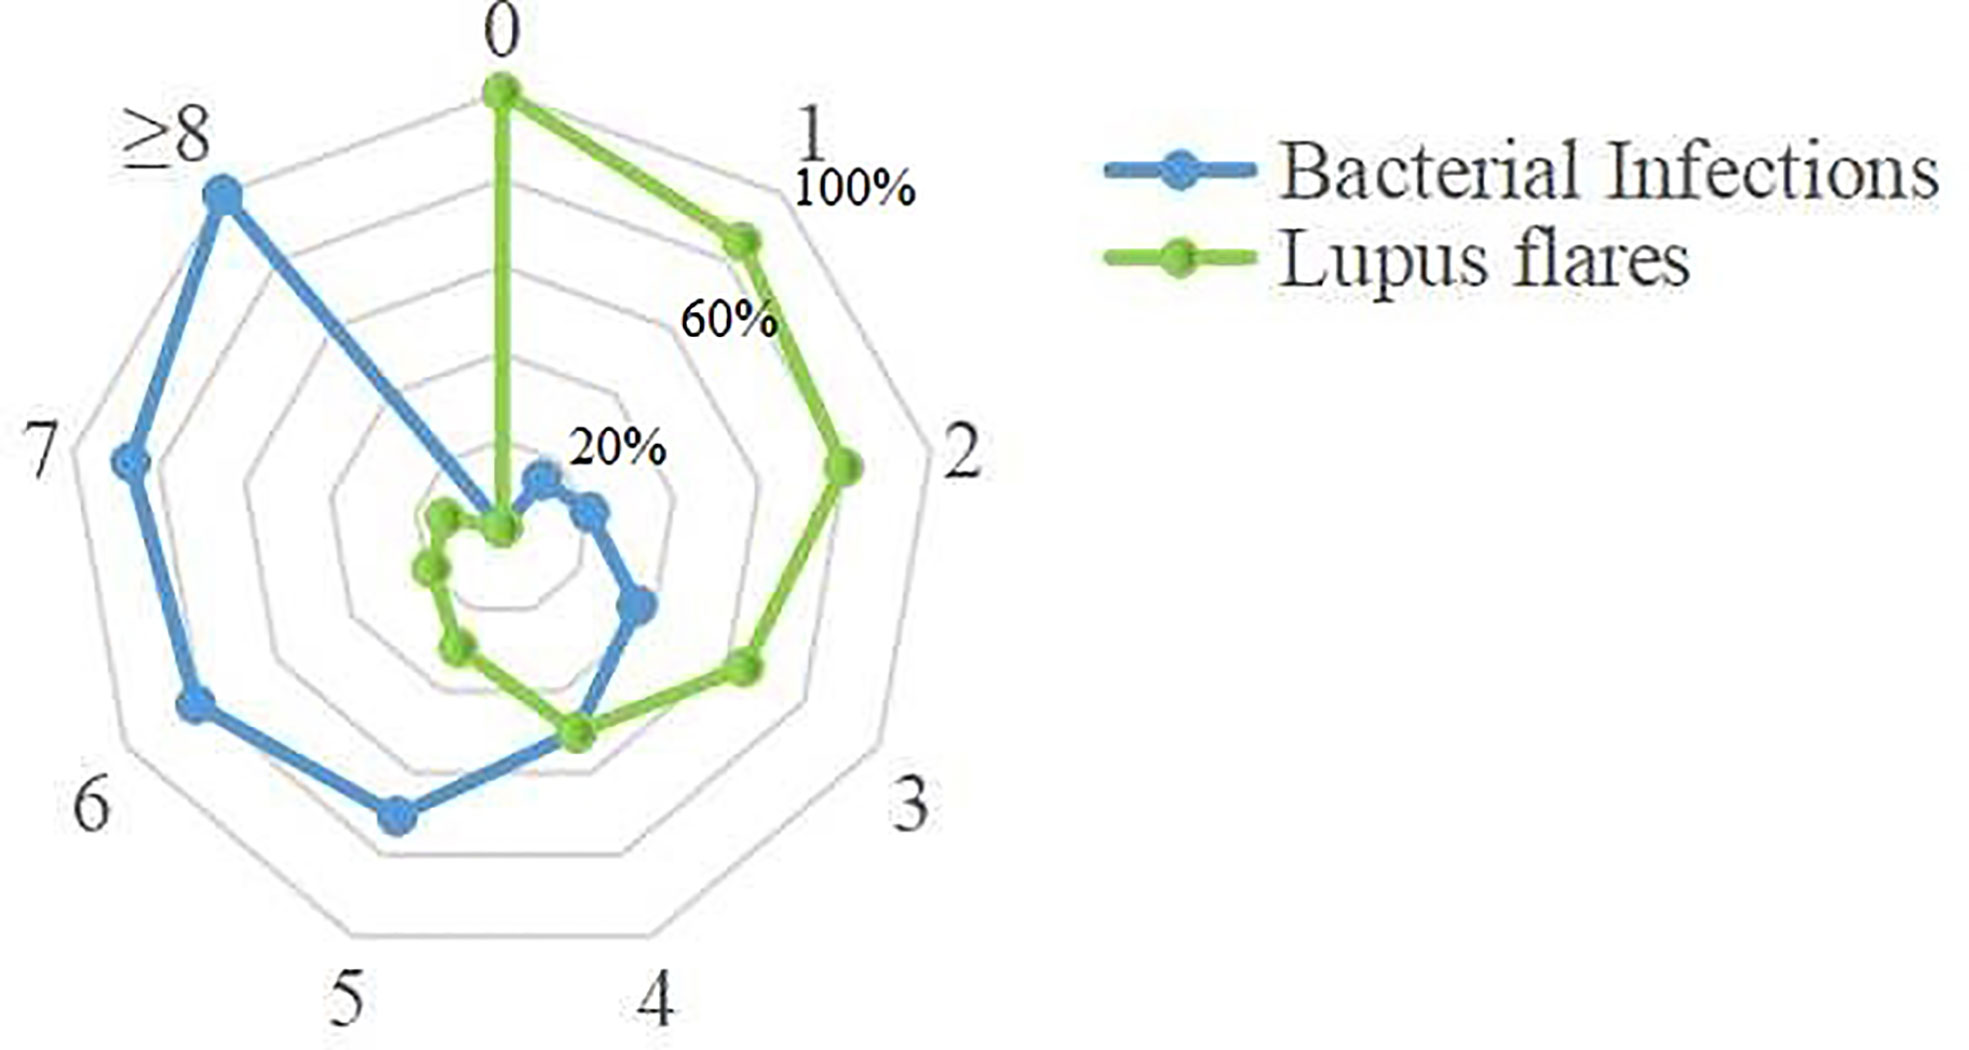
Figure 4 Distribution of the bacteria-infected SLE patients and the lupus flares patients in bioscore range 0~10. Twenty-seven patients with bioscore of 0 were lupus flares. All patients whose bioscore was greater than or equal to 8 (n = 13) were infected. A positive relationship was existed between the bioscore and the possibility of bacterial infections.
Discussion
The main results of our article included: 1) score plots of the PLS-DA and OPLS-DA models, including cytokines, lymphocyte subpopulations, and routine examination biomarkers, showed excellent performance in distinguishing between bacterial infections and lupus flares in SLE; 2) the levels of WBC, NEUT, ESR, CRP, PCT, IL-6, IL-10, IFN-γ, and TNF-α in bacteria-infected patients were significantly higher than in those with lupus flares, while the absolute number of Treg cells in bacteria-infected patients was obviously decreased; 3) the bioscore system constructed using the dichotomized versions of these 10 indicators provided a simpler, faster, and more convenient method to identify the SLE patients with bacterial infections.
Although the management of SLE patients has improved dramatically in recent years, bacterial infections remain the major cause of morbidity and mortality in SLE, given its own immune disorders and immunosuppressive intake. However, distinguishing between bacterial infections and lupus flares in SLE is still a common dilemma due to their similar symptoms and signs. Furthermore, in view of the disparate medication regimens, the potentially fatal consequences of unreasonable medication and the problem of antibiotic resistance caused by overuse and unnecessary use of antibiotics (Ospina et al., 2017), timely diagnosis, and discrimination of bacterial infections in SLE should be taken into consideration for developing specific therapies and achieving positive outcomes and cost effectiveness. Only a few studies have reported methods for effective distinction between bacterial infections and lupus flares in SLE in the past, and they have only explored the indicators, including WBC, CRP, PCT, and nCD64, independently (Hussein et al., 2010; Yang et al., 2010; Serio et al., 2014; Ajmani et al., 2019). Given the limitations of microbial culture and routine laboratory indicators, depending on a single biomarker to identify bacterial infections is not a reliable strategy. We have previously reported that combining multiple indicators to effectively distinguish bacterial infections from lupus recurrence; however, we did not take into account the role of each indicator in identifying bacterial infection (Feng et al., 2019). Therefore, seeking a more comprehensive data model to distinguish the bacterial infections in SLE is imperative.
Serving as indicators that are known to be elevated in bacterial infections, the levels of WBC and NEUT, in our study, were significantly higher in infected patients. However, the WBC count detected with the conventional method only reflects 5% of the whole WBC number, and a reduced WBC number in patients with bacterial infections has also been reported in several studies (Ye et al., 2016). ESR, which was significantly elevated in the infected group in the current study, is susceptible to a variety of factors. The change in ESR, consequently, could not specifically reflect the occurrence of bacterial infections. As an acute phase response protein, CRP has been reported to be elevated in the early phase of bacterial infections (Yang et al., 2016; van der Does et al., 2018), which was consistent with our findings. However, normal CRP levels were also observed in local and mild infections (Ng et al., 2000; Venkatesh et al., 2010). PCT, which rapidly increases as soon as bacterial infections commence, has also been reported to have no significant difference between SLE patients with bacterial infections and those with lupus flares (Lanoix et al., 2011). In recent years, there has been a gradual focus on the diagnostic ability of inflammatory cytokines for bacterial infections. Several Th1/Th2 cytokines have been found to be sensitive to the risk of bacterial infections (Santolaya et al., 2008; Tang et al., 2011; Urbonas et al., 2012a; Urbonas et al., 2012b). Indeed, the levels of IL-6, IL-10, IFN-γ, and TNF-α in our study, showed an upward trend. The changes in the levels of these cytokines were in line with previous reports. Additionally, Tang Y. et al. have also demonstrated that IL-6 and IL-10 could serve as important predictors for the infection severity and prognosis of bacteria-infected patients (Tang et al., 2011). Pro-inflammatory Th17 cells and suppressive Treg cells are involved in the immune response process (Zhou et al., 2008; Mubarak et al., 2016). The upregulation of Th17 or downregulation of Treg cells may trigger immunity to bacterial infections (Kimura and Kishimoto, 2010). Treg cells in bacterial-infected patients were significantly downregulated in our study, while no significant changes in Th17 cells were observed. We speculate that the reason for this behavior of Treg cells may be that decreased Treg cells are required to maintain the function of Th17 cells to clear bacteria during bacterial infections. Interestingly, Liu Y. et al. found that the numbers of Th17 and Treg cells in the infected group were significantly higher than those in the non-infected group (P < 0.001).
Previous studies have reported that the PLS-DA/OPLS-DA model was used to process multiple protein indicators to effectively predict bacterial infections (Kuusela et al., 2017; Tong et al., 2019). In our study, the PLS-DA/OPLS-DA models showed clear identification ability for bacterial infections in SLE. In addition to building the PLS-DA/OPLS-DA models, ROC curve analyses were also conducted to observe the identification ability of the 10 indicators for bacterial infections. For a single biomarker, NEUT had the highest specificity rate, 93.66%. IFN-γ exhibited a relatively higher sensitivity of 72.64%. However, the AUCs of these 10 indicators were not large enough to be strongly persuasive.
To enable clinicians to make rapid judgments for bacterial infections, we have constructed a bioscore system based on the different weights of these six independent predictors, which had the great predictive ability (AUC = 0.842). An advantage of this system is that the shortage of individual biomarker for identifying bacterial infections was overcome, and its prediction power is even more convincing. The bioscore system, in our study, showed a positive relationship between the bioscore and the possibility of bacterial infections, and a bioscore ≥8 can be used as a powerful indicator for the diagnosis of bacterial infections, which would be a powerful aid to physicians in handling patient decisions.
There were some deficiencies in our study. First, due to the retrospective nature of this study, a selection bias may have existed. Second, the clinical manifestation of patients, who were enrolled through the criteria “clinical improvement after antibiotic treatment,” may have also improved without antibiotic treatment. Therefore, the number of patients in the bacteria-infected group may have been overestimated. Third, the power of the bioscore system to identify new patients with bacterial infections has not been validated yet.
Conclusion
The PLS-DA/OPLS-DA models, including the above biomarkers, showed a strong predictive ability for bacterial infections in SLE. Combining WBC, NEUT, CRP, PCT, IL-6, and IFN-γ in a bioscore system may result in a faster prediction of bacterial infections in SLE and may guide toward a more appropriate, timely treatment for SLE.
Data Availability Statement
The original contributions presented in the study are included in the article/supplementary material. Further inquiries can be directed to the corresponding author.
Ethics Statement
The studies involving human participants were reviewed and approved by the ethics committee of the Second Hospital of Shanxi Medical University. The patients/participants provided their written informed consent to participate in this study.
Author Contributions
JL came up with the idea. XWZ and MF performed the detection of cytokines and the writing of the article. HG performed the writing of the article. ZL, YW, and YQ completed the detection of the immune cell subpopulations. YW and XCZ contributed to the analysis of data. CG polished the article. All authors contributed to the article and approved the submitted version.
Funding
The study was supported by the Preferential Financed Projects of Shanxi Provincial Human Resources and Social Security Department (2016-97); the Scientific Research Project of Shanxi Health Planning Committee (201601042); the Scientific Research Foundation for the Returned Overseas Scholar of Shanxi Province (2017-116); Scientific Research Project of Shenzhen University General Hospital (0000040522); the Key Research and Development Project (Guide) of Shanxi Province (201803D421067); Shanxi Applied Basic Research Program Project (201901D111377); Scientific research project of Shanxi Provincial Health Commission (2019044), and Shanxi Province Research support project for returned Overseas Students (2020-191).
Conflict of Interest
The authors declare that the research was conducted in the absence of any commercial or financial relationships that could be construed as a potential conflict of interest.
References
Ajmani S., Singh H., Chaturvedi S., Mishra R., Rai M. K., Jain A., et al. (2019). Utility of neutrophil CD64 and serum TREM-1 in distinguishing bacterial infection from disease flare in SLE and ANCA-associated vasculitis. Clin. Rheumatol. 38, 997–1005. doi: 10.1007/s10067-018-4334-5
Allen E., Bakke A. C., Purtzer M. Z., Deodhar A. (2002). Neutrophil CD64 expression: distinguishing acute inflammatory autoimmune disease from systemic infections. Ann. Rheumatol. Dis. 61, 522–525. doi: 10.1136/ard.61.6.522
Bador K. M., Intan S., Hussin S., Gafor A. H. (2012). Serum procalcitonin has negative predictive value for bacterial infection in active systemic lupus erythematosus. Lupus 21, 1172–1177. doi: 10.1177/0961203312450085
Bombardier C., Gladman D. D., Urowitz M. B., Caron D., Chang C. (1992). Derivation of the SLEDAI. A disease activity index for lupus patients. The Committee on Prognosis Studies in SLE. Arthritis Rheumatol. 35, 630–640. doi: 10.1002/art.1780350606
Dima A., Opris D., Jurcut C., Baicus C. (2016). Is there still a place for erythrocyte sedimentation rate and C-reactive protein in systemic lupus erythematosus? Lupus 25, 1173–1179. doi: 10.1177/0961203316651742
Echeverri A., Naranjo-Escobar J., Posso-Osorio I., Aguirre-Valencia D., Zambrano D., Castaño G. L., et al. (2018). Neutrophil CD64 expression, procalcitonin and presepsin are useful to differentiate infections from flares in SLE patients with SIRS. Lupus 27, 1130–1139. doi: 10.1177/0961203318763740
Esposito S., Bosis S., Semino M., Rigante D. (2014). Infections and systemic lupus erythematosus. Eur. J. Clin. Microbiol. Infect. Dis. 33, 1467–1475. doi: 10.1007/s10096-014-2098-7
Faix J. D. (2011). Established and novel biomarkers of sepsis. Biomark. Med. 5, 117–130. doi: 10.2217/bmm.11.21
Feng M., Zhang S., Liang Z., Wang Y., Zhao X., Gao C., et al. (2019). Peripheral neutrophil CD64 index combined with complement, CRP, WBC count and B cells improves the ability of diagnosing bacterial infection in SLE. Lupus 28, 304–316. doi: 10.1177/0961203319827646
Furst D. E., Breedveld F. C., Kalden J. R., Smolen J. S., Burmester G. R., Sieper J., et al. (2007). Updated consensus statement on biological agents for the treatment of rheumatic diseases. Ann. Rheumatol. Dis. 66, iii2–iii22. doi: 10.1136/ard.2007.081430
Holmes C. L., Russell J. A., Walley K. R. (2003). Genetic polymorphisms in sepsis and septic shock: role in prognosis and potential for therapy. Chest 124, 1103–1115. doi: 10.1378/chest.124.3.1103
Hussein O. A., El-Toukhy M. A., El-Rahman H. S. (2010). Neutrophil CD64 expression in inflammatory autoimmune diseases: its value in distinguishing infection from disease flare. Immunol. Invest. 39, 699–712. doi: 10.3109/08820139.2010.491520
Illescas-Montes R., Corona-Castro C. C., Melguizo-Rodríguez L., Ruiz C., Costela-Ruiz V. J. (2019). Infectious processes and systemic lupus erythematosus. Immunology 158, 153–160. doi: 10.1111/imm.13103
Kimura A., Kishimoto T. (2010). IL-6: regulator of Treg/Th17 balance. Eur. J. Immunol. 40, 1830–1835. doi: 10.1002/eji.201040391
Kuusela P., Saraswat M., Joenväärä S., Kaartinen J., Järvinen A., Renkonen R. (2017). Changes in plasma protein levels as an early indication of a bloodstream infection. PLoS One 12, e0172987. doi: 10.1371/journal.pone.0172987
Lanoix J. P., Bourgeois A. M., Schmidt J., Desblache J., Salle V., Smail A., et al. (2011). Serum procalcitonin does not differentiate between infection and disease flare in patients with systemic lupus erythematosus. Lupus 20, 125–130. doi: 10.1177/0961203310378862
Marshall J. C., Vincent J. L., Fink M. P., Cook D. J., Rubenfeld G., Foster D., et al. (2003). Measures, markers, and mediators: toward a staging system for clinical sepsis. A report of the Fifth Toronto Sepsis Roundtable (Toronto, Ontario, Canada). Crit. Care Med. 31, 1560–67. doi: 10.1097/01.CCM.0000065186.67848.3A
Mubarak A., Ahmed M. S., Upile N., Vaughan C., Xie C., Sharma R., et al. (2016). A dynamic relationship between mucosal T helper type 17 and regulatory T-cell populations in nasopharynx evolves with age and associates with the clearance of pneumococcal carriage in humans. Clin. Microbiol. Infect. 22, 736.e1–736.e7. doi: 10.1016/j.cmi.2016.05.017
Ng P. C., Lee C. H., Fok T. F., Chui K., Wong W., Cheung K. L., et al. (2000). Central nervous system candidiasis in preterm infants: limited value of biochemical biomarkers fordiagnosis. J. Paediatr. Child Health 36, 509–510. doi: 10.1046/j.1440-1754.2000.00520.x
Ospina F. E., Echeverri A., Zambrano D., Suso J. P., Javier M. B., Cañas C. A., et al. (2017). Distinguishing infections vs flares in patients with systemic lupus erythematosus. Rheumatology (Oxford) 56 (suppl_1), i46–i54. doi: 10.1093/rheumatology/kew340
Pierrakos C., Vincent J. L. (2010). Sepsis biomarkers: a review. Crit. Care 14, R15. doi: 10.1186/cc8872
Santolaya M. E., Alvarez A. M., Aviles C. L., Becker A., King A., Mosso C., et al. (2008). Predictors of severe sepsis not clinically apparent during the first twenty-four hours of hospitalization in children with cancer, neutropenia, and fever: a prospective, multicenter trial. Pediatr. Infect. Dis. J. 27, 538–543. doi: 10.1097/INF.0b013e3181673c3c
Serio I., Arnaud L., Mathian A., Hausfater P., Amoura Z. (2014). Can procalcitonin be used to distinguish between disease flare and infection in patients with systemic lupus erythematosus: a systematic literature review. Clin. Rheumatol. 33, 1209–1215. doi: 10.1007/s10067-014-2738-4
Soni S., Wadhwa N., Kumar R., Faridi M. M., Sharma S., Chopra A., et al. (2013). Evaluation of CD64 expression on neutrophils as an early indicator of neonatal sepsis. Pediatr. Infect. Dis. J. 32, e33–e37. doi: 10.1097/INF.0b013e31826faede
Tang Y., Liao C., Xu X., Song H., Shi S., Yang S., et al. (2011). Evaluation of Th1/Th2 cytokines as a rapid diagnostic tool for severe infection in paediatric haematology/oncology patients by the use of cytometric bead array technology. Clin. Microbiol. Infect. 17, 1666–1673. doi: 10.1111/j.1469-0691.2011.03490.x
Thamphiwatana S., Angsantikul P., Escajadillo T., Zhang Q., Olson J., Luk B. T., et al. (2017). Macrophage-like nanoparticles concurrently absorbing endotoxins and proinflammatory cytokines for sepsis management. Proc. Natl. Acad. Sci. U. S. A. 114, 11488–11493. doi: 10.1073/pnas.1714267114
Tong Y., Ku X., Wu C., Liu J., Yang C., Tang W., et al. (2019). Data-independent acquisition-based quantitative proteomic analysis reveals differences in host immune response of peripheral blood mononuclear cells to sepsis. Scand. J. Immunol. 89, e12748. doi: 10.1111/sji.12748
Urbonas V., Eidukaite A., Tamuliene I. (2012a). The diagnostic value of interleukin-6 and interleukin-8 for early prediction of bacteremia and sepsis in children with febrile neutropenia and cancer. J. Pediatr. Hematol. Oncol. 34, 122–127. doi: 10.1097/MPH.0b013e3182446a60
Urbonas V., Eidukaite A., Tamuliene I. (2012b). Increased interleukin-10 levels correlate with bacteremia and sepsis in febrile neutropenia pediatric oncology patients. Cytokine 57, 313–315. doi: 10.1016/j.cyto.2011.11.012
van der Does Y., Rood P. P. M., Ramakers C., Schuit S. C. E., Patka P., van Gorp E. C. M., et al. (2018). Identifying patients with bacterial infections using a combination of C-reactive protein, procalcitonin, TRAIL, and IP-10 in the emergency department: a prospective observational cohort study. Clin. Microbiol. Infect. 24, 1297–1304. doi: 10.1016/j.cmi.2018.09.007
Venkatesh M., Flores A., Luna R. A., Versalovic J. (2010). Molecular microbiological methods in the diagnosis of neonatal sepsis. Expert Rev. Anti Infect. Ther. 8, 1037–1048. doi: 10.1586/eri.10.89
Wang J., Niu R., Jiang L., Wang Y., Shao X., Wu M., et al. (2019). The diagnostic values of C-reactive protein and procalcitonin in identifying systemic lupus erythematosus infection and disease activity. Medicine (Baltimore) 98, e16798. doi: 10.1097/MD.0000000000016798
Yang D. H., Chang D. M., Lai J. H., Lin F. H., Chen C. H. (2010). Significantly higher percentage of circulating CD27(high) plasma cells in systemic lupus erythematosus patients with infection than with disease flare-up. Yonsei Med. J. 51, 924–931. doi: 10.3349/ymj.2010.51.6.924
Yang A., Liu J., Yue L., Wang H., Yang W., Yang G. (2016). Neutrophil CD64 combined with PCT, CRP and WBC improves the sensitivity for the early diagnosis of neonatal sepsis. Clin. Chem. Lab. Med. 54, 345–351. doi: 10.1515/cclm-2015-0277
Ye Q., Shao W., Shang S., Shen H., Chen X., Tang Y., et al. (2016). Clinical value of assessing cytokine levels for the differential diagnosis of bacterial meningitis in a pediatric population. Medicine (Baltimore) 95, e3222. doi: 10.1097/MD.0000000000003222
Keywords: systemic lupus erythematosus, bacterial infection, lupus flare, receiver operating characteristic, bioscore
Citation: Zhai X, Feng M, Guo H, Liang Z, Wang Y, Qin Y, Wu Y, Zhao X, Gao C and Luo J (2021) Development of Prediction Models for New Integrated Models and a Bioscore System to Identify Bacterial Infections in Systemic Lupus Erythematosus. Front. Cell. Infect. Microbiol. 11:620372. doi: 10.3389/fcimb.2021.620372
Received: 22 October 2020; Accepted: 08 January 2021;
Published: 01 March 2021.
Edited by:
Yang Zhang, University of Pennsylvania, United StatesReviewed by:
Hao Zhang, University of Pennsylvania, United StatesXue Zhang, Wistar Institute, United States
Cristian Baicus, Carol Davila University of Medicine and Pharmacy, Romania
Copyright © 2021 Zhai, Feng, Guo, Liang, Wang, Qin, Wu, Zhao, Gao and Luo. This is an open-access article distributed under the terms of the Creative Commons Attribution License (CC BY). The use, distribution or reproduction in other forums is permitted, provided the original author(s) and the copyright owner(s) are credited and that the original publication in this journal is cited, in accordance with accepted academic practice. No use, distribution or reproduction is permitted which does not comply with these terms.
*Correspondence: Jing Luo, bGp0eTk2NkBob3RtYWlsLmNvbQ==
†These authors have contributed equally to this work