 Gyeong-Yi Kang
 Hyeong-Jun Rhyu
 Hong-Hee Choi
 Sung Jae Shin
 Young-Min Hyun
95% of researchers rate our articles as excellent or good
Learn more about the work of our research integrity team to safeguard the quality of each article we publish.
Find out more
ORIGINAL RESEARCH article
Front. Cell. Infect. Microbiol. , 15 May 2020
Sec. Microbes and Innate Immunity
Volume 10 - 2020 | https://doi.org/10.3389/fcimb.2020.00226
This article is part of the Research Topic Mycobacteria-Host Interactions: Genetics, Immunity, Pathology View all 15 articles
Using a novel tissue-clearing method, we aimed to visualize the three-dimensional (3D) distribution of immune cells within Mycobacterium tuberculosis (Mtb)-infected mice lungs. Ethyl cinnamate-based tissue clearing of Mtb-infected mice lungs was performed to obtain transparent lung samples, which were then imaged using a light sheet fluorescence microscope. Using the 3D images, we performed quantitative analysis of the immune cell population within multiple granulomas. In addition, to compare the data from the tissue clearing method, we performed histopathological and immunofluorescence analyses, and flow cytometry. We then created 3D images of the Mtb-infected lung that successfully demonstrated the distribution of blood vessels, immune cells, and granulomas. Since the immune cells within a granuloma could be separately selected and counted, the immune cell population within a specific lesion could be quantified. In addition, macroscopic analysis, e.g., the size or shape of a granuloma, as well as microscopic analysis could be performed as intact lung samples were used. The use of the tissue clearing method in infected lungs could be a novel modality for understanding the role of the immune system in the pathogenesis of tuberculosis.
Tuberculosis (TB), a pulmonary disease caused by a group of infectious agents named Mycobacterium tuberculosis (Mtb) complex, remains one of the major health concerns worldwide. World Health Organization (WHO) reported that nearly 10.4 million people were infected, and 1.7 million deaths were caused by the contagious disease in 2016 (Floyd et al., 2018). The standard treatment for TB includes multiple anti-TB drugs, i.e., isoniazid, rifampin, ethambutol, and pyrazinamide (Tiberi et al., 2018). However, with the advent of drug-resistant TB, which exhibits resistance against one or more of the drugs in the initial regimen, chemotherapy alone has not been demonstrated to control the disease completely (Tiberi et al., 2018). Therefore, novel therapeutic approaches for TB are required.
In light of this need for a new treatment, several researches have attempted to elucidate the role of the innate immune system in the pathogenesis of the disease. The primary cells involved in the initial immune response against TB infection are macrophages, including resident alveolar and monocyte derived macrophages, and neutrophils (Schlesinger, 1996). The defense mechanism of macrophages against the infective agent is relatively well-known. As Mtb enter the alveoli, alveolar macrophages phagocytose the bacteria and subsequently produce various cytokines, recruiting monocytes from the blood and leading to mobilization of monocyte derived macrophages. This is followed by production of reactive oxygen species (ROS) and apoptosis of the recruited macrophages (Pieters, 2008). Recently, several counteractive actions of Mycobacteria against macrophages have also been found (Lerner et al., 2015). In contrast, several findings have identified a controversial role of neutrophils in regard to their interaction with the pathogen (Lowe et al., 2012). Being the most prominent immune cells in human TB, neutrophils are also the most common leukocytes in human blood (Eum et al., 2010). Animal studies have demonstrated that neutrophils play a crucial role in the initial defense against TB (Pedrosa et al., 2000; Fulton et al., 2002; Sugawara et al., 2004). Recruitment of neutrophils results in decreased colony forming units (CFU) while their depletion causes the opposite (Sugawara et al., 2004). One of the known antibacterial actions of neutrophils is its formation of a DNA scaffold, named neutrophil extracellular traps (NET) that entraps pathogens and facilitates bactericidal actions (Papayannopoulos, 2018). However, it has also been reported that there was no difference in the disease course in granulocyte-depleted mice and normal mice (Seiler et al., 2000). Additionally, the contribution of neutrophils is limited to the early stages of the disease (Petrofsky and Bermudez, 1999; Pedrosa et al., 2000; Sugawara et al., 2004; Zhang et al., 2009). In chronic TB infection, neutrophil depletion was shown to be correlated with a decrease in CFU (Zhang et al., 2009). Data from patients also suggest that higher neutrophil count is associated with worse prognosis in well-established TB (Barnes et al., 1988). To summarize, these findings indicate that the role of neutrophils in the immune response of TB remains to be clarified and studying their functions at different stages of the disease may provide a deeper understanding of the pathogenesis.
One possible approach to interpret the complicated immune reaction is to observe the spatial distribution of the immune cells. It has been reported that Mtb-infected macrophages become highly mobile and egress from the primary granuloma, consequently becoming a source of new granulomas in zebrafish and mouse (Davis and Ramakrishnan, 2009; Cohen et al., 2018). This implies that the physical distribution of Mtb-infected macrophages, or how they translocate out of the granuloma, can affect the progress of the disease. In contrast, the local influx of neutrophils has been correlated with worse prognosis while suppressing it by chemokine modulation has a better outcome (Condos et al., 1998; Nandi and Behar, 2011). These findings show that the course of the disease is closely linked with the distribution of the immune cells, such as neutrophils and macrophages. Traditionally, several modalities, e.g., hematoxylin and eosin (H&E) staining, immunohistochemistry, and fluorescence microscopy, have been used to localize cells in a pathologic condition. However, all these methods provide limited information, since the data are mostly 2D images with the possibility of omitting cells. Recently, total organ imaging enabled by a method that makes an organ transparent, namely tissue clearing, is emerging as a novel technique in various fields of research (Chung et al., 2013; Klingberg et al., 2017). One of tissue clearing methods, PACT (passive clarity technique), has also been used for fluorescence-labeled Mtb in the Mtb-infected mouse lungs (Cronan et al., 2015). In this study, we used the another tissue clearing technique using Ethyl cinnamate (ECi) to visualize immune cells within the pathologic tissue. We used 3D imaging technique of the tissue-cleared lung to localize neutrophils and macrophages in Mtb-infected mice lungs. Providing data on the spatial distribution of these immune cells and granulomas, we propose a new modality in understanding the role of the innate immune system in the pathogenesis of TB.
C57BL/6 mice were purchased from Japan SLC Inc. (Shizuoka, Japan). C57BL/6, CX3CR1-GFP (green fluorescent protein) (Jung et al., 2000) and LysM-GFP (Faust et al., 2000) mice were maintained under specific-pathogen-free conditions at the Avison Biomedical Research Center, Yonsei University College of Medicine. In order to minimize the unintended loss in leukocyte motility or its bactericidal function, heterogenetic (+/–) LysM-GFP and CX3CR1-GFP mice were used in the experiments. All animal experiments were performed with the approval by the animal ethics committee of Yonsei University College of Medicine (2016-0178 and 2018-0218).
Mice were infected under strict barrier conditions in a BSL-3 facility at the Avison Biomedical Research Center, Yonsei College of Medicine. Briefly, mice were challenged with the pre-calibrated Mtb H37Rv (ATCC 27294) via aerosol using an airborne infection apparatus (Glas-Col, USA), and ~200 viable bacteria were delivered. Mice at 4 weeks post-infection were used. For the bacterial growth analysis, the lungs were homogenized, and serially diluted samples were plated onto Middlebrook 7H11 agar plates (Becton Dickinson, USA) supplemented with 10% OADC (oleic acid albumin dextrose catalase; Difco Laboratories, USA), 2 μg/mL 2-thiophenecarboxylic acid hydrazide (Sigma-Aldrich, USA), and amphotericin B (Sigma-Aldrich). The bacterial colonies were counted after 3–4 weeks of incubation period at 37°C. The animal ethics committee of Yonsei University College of Medicine approved all of the experimental protocols used (2016-0178 and 2018-0218).
The naïve and Mtb-infected mice lungs were isolated and fixed in 10% formalin overnight. Fixed lungs were serially dehydrated using ethanol and then infiltrated with paraffin. The lungs were then embedded into the paraffin wax block. Paraffin blocks were sectioned by 4–5 μm thickness, and then stained using H&E. Samples were observed using Olympus BX51 microscope (Olympus, Japan). For immunofluorescence imaging, antigen retrieval was performed using Tris-EDTA. Immune cells were labeled using anti-CD3 (T cells; BioLegend, USA), anti-Ly-6G (neutrophils; Biolegend, USA), and anti-F4/80 (macrophages; BioLegend, USA) antibodies and nuclei were stained using DAPI (4',6-diamidino-2-phenylindole). The slides were observed using the LSM700 confocal microscope (Carl Zeiss, Germany). Volocity Software (Quorum Technologies, Canada) software was used for data analysis.
The lung samples were minced into 2-4 mm pieces using scissors. The samples were then incubated in 3 mL of cellular dissociation buffer [RPMI medium; Biowest, France)], which contained 0.1% collagenase type IV (Worthington Biochemical Corporation, USA) and 1 mM CaCl2 and 1 mM MgCl2 for 30 min at 37°C. The dissociated cells were then filtered using a 40 μm cell strainer (BD Biosciences, USA) in RPMI medium supplemented with 2% fetal bovine serum (FBS, Biowest, France), and the erythrocytes were removed by incubating the samples in red blood cell lysis buffer (Sigma-Aldrich, USA) for 3 min at room temperature. Finally, the single cells were washed twice in RPMI medium supplemented with 2% FBS before analysis. For flow-cytometric analysis, cells were first washed with 2% FBS containing PBS and anti-CD16/32 antibodies were treated for blocking function at 4°C for 20 min. Surface molecules were labeled with fluorochrome-conjugated anti-CD45 (immune cells), anti-Siglec-F (alveolar macrophages), anti-Ly-6G (neutrophils) (BD bioscience, USA), anti-F4/80 (macrophages), anti-CD11b (monocytes/macrophages, granulocytes) (eBioscience, USA), anti-CD64 (monocyte-derived macrophages), and anti-CD11c (monocytes/macrophages) (Biolegend, USA) antibodies and using the LIVE/DEAD Fixable Dead Cell Stain Kit (Molecular Probes, USA) at 4°C for 30 min. The cells were then washed with PBS, fixed with Intracellular (IC) fixation buffer (eBioscience, USA) for flow cytometry analysis. The cells were subsequently analyzed using a CytoFLEX S Flow Cytometer (Beckman Coulter, USA).
LysM-GFP and CX3CR1-GFP mice were used for visualization of the immune cells, and FSD-647 Lycopersicon esculentum (L. esculentum) lectin (BioActs, Korea) was intravenously injected to label glycocalyx in the basal membrane of the endothelial cells. ECi clearing method was selected as it has benefits such as minimizing sample shrinkage and preserving endogenous fluorescence for fluorescence imaging (Klingberg et al., 2017). In addition, the method is not toxic, and has been approved by the U.S. Food and Drug Administration (FDA). The aqueous buffer clearing method was excluded as it can make samples inadequately clear and may cause the samples to swell giving them a jelly-like texture. Before conducting tissue clearing using the ECi solution, the mice were perfused with 1X PBS and 4% formaldehyde via the myocardial route. Perfusion using this method enables effective fixation of mice lungs by utilizing the circulatory system of the animal. The intact lungs were then fixed in 4% formaldehyde solution for 2 h and dehydrated in alkaline solutions for 12 h (50/70/100% ethanol, 4 h each). Finally, the samples were cleared using the ECi solution (Alfa Aesar, USA) for 30 min at room temperature. All incubation processes were conducted away from light. The cleared samples were stored in polypropylene tubes till the imaging was done. Light sheet fluorescence microscopy (LFMS) was performed using UltraMicroscope II (LaVison BioTec, Germany). The samples were fixed with and immersed in absolute ECi solution in the mounting chamber during the imaging. Dual side illumination was used, and each plane was obtained every 7 μm. Imaris software (Bitplane, Switzerland) was used to analyze the whole-organ 3D images. The cell counts, volume and area of the granulomas were measured.
The cell count data were described as either mean ± standard deviation (flow cytometric studies) or mean ± standard error of the mean (histopathological and immunofluorescence studies, and tissue clearing). Prism version 7 (GraphPad Software, USA) was used for statistics and Student's t-test was used for analysis.
Flow cytometric studies were performed in order to quantify three types of immune cells: neutrophils, alveolar macrophages, and infiltrating macrophages, in both naïve and Mtb-infected mice lungs (Figure 1). All the Mtb-infected mice used in this study were in their fourth week post-infection, at which point the total CFU of the Mtb (T = 4 weeks) showed a higher increase than that at the first day of infection (T = 1 day) (Figure 1A). As described in Figure 1B, flow cytometric studies of both naïve and Mtb-infected mice lungs were performed to compare the population of neutrophils (CD45+ and Ly6G+), alveolar macrophages (CD45+ and Siglec-F+), and infiltrating macrophages (CD45+ and CD64+) between two groups. The proportion of the immune cells showed a notable difference between two groups (Figure 1C). In the naïve group, resident alveolar macrophages (CD45+ and Siglec-F+) was the predominant cell type (3.97%). Neutrophils and infiltrating macrophages represented 2.74% and 1.77% of the cell population, respectively. In contrast, neutrophils were the most abundant cell type in Mtb-infected lung (8.10%). This was followed by infiltrating macrophages (4.26%), while the proportion of alveolar macrophages was relatively insignificant (1.37%). The actual cell count of alveolar macrophages, however, showed no difference between two groups (Figure 1D). Instead the total cell number in the infected group was larger, making the relative proportion of alveolar macrophages smaller. Both neutrophils and infiltrating macrophages were drastically increased in the infected lung. The mean number of neutrophils was nearly 7 times larger than that of the uninfected lungs, and the mean number of infiltrating macrophages was more than 5 times larger than that of the uninfected lung. These data suggest that both neutrophils and macrophages mediate the host immune reaction against Mtb infection.
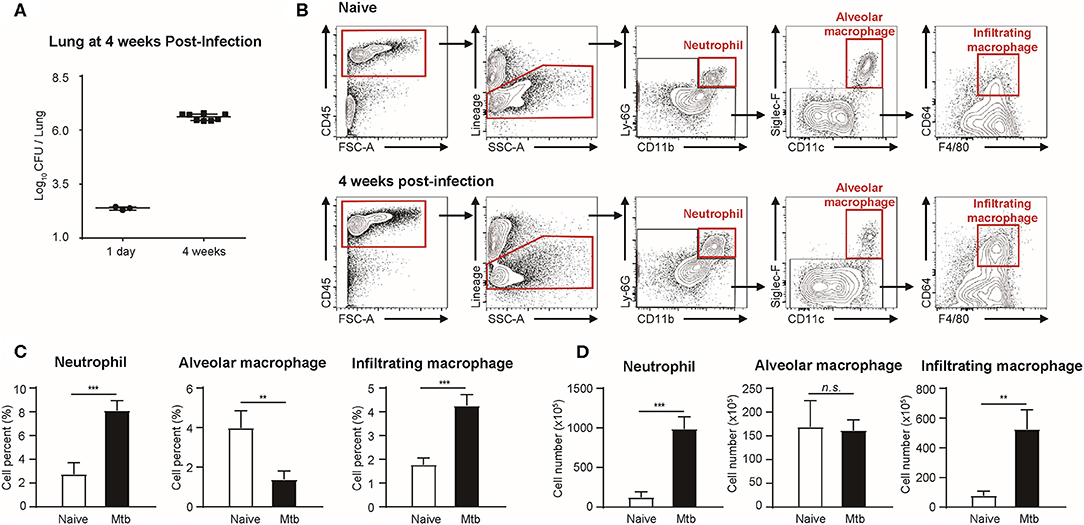
Figure 1. Quantitative analysis of immune cell population in naïve and Mtb (Mycobacterium tuberculosis)-infected mice lungs (4 weeks post-infection). (A) colony-forming units (CFU) 1 h after (T = 1 day, n = 3) and 4 weeks after (T = 4 weeks, n = 4) infection with Mtb. (B) Gating strategy of immune cells. (C) The proportion (%) and (D) the absolute count (×105) of different subtypes of immune cells were quantified and compared between naïve and Mtb-infected groups [four mice per group, mean ± standard deviation (SD)]. Statistical analysis was performed using the Student's t-test. **P < 0.01, ***P < 0.005. n.s., not significant.
The morphology and the immune cell population were compared between the naïve and Mtb-infected mice lungs (Figure 2). At low magnification, the whole lung section could be viewed (Figure 2A, upper panel). The granulomas were well-demarcated from the surrounding tissue. At higher magnification, the granulomas showed a highly cellular lesion lacking the normal alveolar structure seen in the naïve lung (Figure 2A). This is consistent with a previous finding that granulomas in C57BL/6 mouse are exclusively cellular without any necrosis or hypoxia (Medina and North, 1998). In order to classify the types of cells in this highly cellular structure, immunofluorescence (IF) microscopy was performed (Figure 2B). Neutrophils, macrophages, and T lymphocytes were distinguished and counted. Since the lung samples were not perfused, most of the immune cells in the naïve mice were located within the alveolar vessels and the non-granulomatous area of the infected mice showed a similar distribution. In contrast, both neutrophils and macrophages were dispersed irregularly throughout the granuloma. The cell number of each subtype of immune cells was counted (Figure 2C). A slight difference in the immune cell population was observed between the granulomas and naive mice lungs, but the difference was not significant (Figure 2C). However, compared with the non-granulomatous area, the infected group contained a larger number of all three subtypes of immune cells than the naïve group (Figure 2C). As stated above, both H&E and immunofluorescence images reveal a limited view of the organ, as they are 2D sectioned images. The sectioned view represents only a part of the whole lesion, making it challenging to quantitatively compare normal and pathologic conditions.
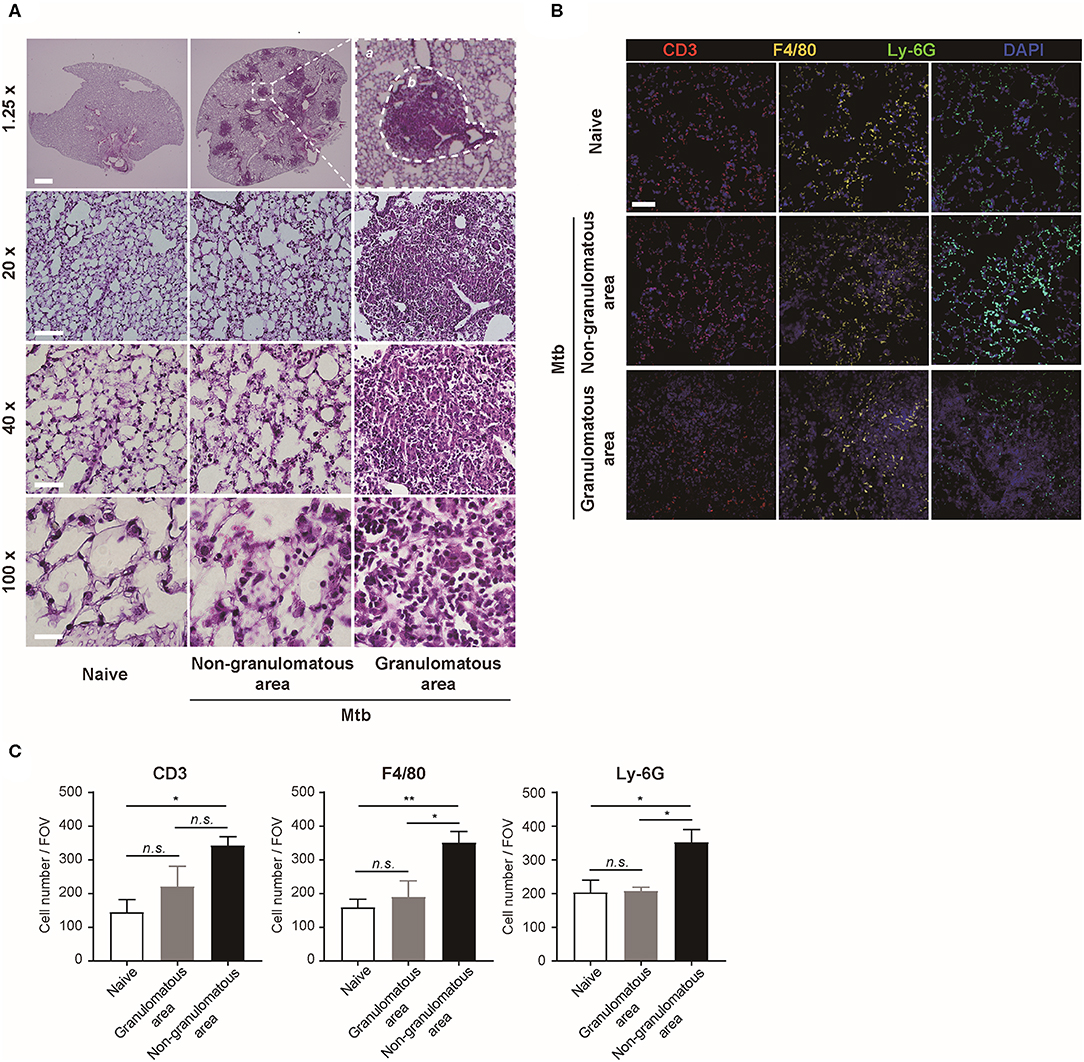
Figure 2. Microscopic morphology and immune cell distribution in naïve and Mtb-infected mice's lungs (A) Hematoxylin and eosin (H&E) staining of naïve and Mtb-infected mice lungs (Scale bar, 1.25X: 1 mm, 20X: 100 μm, 40X: 50 μm, 100X: 20 μm). The magnified image contains a single granulomatous area (b) separating it from the non-granulomatous area (a) via a dotted line. (B) Immunofluorescence staining of naïve and Mtb-infected mice lungs to verify specific immune cell subtypes. Scale bar, 50 μm. (C) The cell counts were compared between the naïve and Mtb-infected group, including granulomatous and non-granulomatous area. Manual counting of each of the immunofluorescence-stained sections was performed [three fields per section, three sections per mouse, three mice per group, mean ± standard error of mean (SEM)]. Statistical analysis was performed using the Student's t-test. *P < 0.05, **P < 0.01. Field of view (FOV): 10.24 mm2. n.s., not significant.
To overcome the limit of 2D analytical methods, 3D whole-lung imaging was performed in each of the cleared samples (Figure 3). In order to observe macrophages, the fluorescence was obtained using CX3CR1-GFP mice that produce green fluorescence protein (GFP) largely in macrophages (Jung et al., 2000) (Figure 3A and Supplementary Videos 1, 2). In order to visualize neutrophils, LysM-GFP mice that has GFP in their neutrophils were used (Faust et al., 2000) (Figure 3B and Supplementary Videos 3, 4). As the lung tissue itself has an auto-fluorescence (Ramanujam, 2000), the structures of the lungs such as the pleura or the bronchus could be identified along with the fluorescent cells (Figures 3A,B and Supplementary Videos 1–4). Multiple granulomas, whose intact shape and size were preserved, were detected in the infected lungs and their distribution in the entirety of the lungs could be visualized (Figures 3A,B). Both neutrophils and macrophages were aggregated near the granulomas. Using zoomed-in images, a single granuloma could be selected and reconstructed into a graphic mass (green), whose volume could be measured (Figure 3C and Supplementary Video 5). Since the fluorescence of the background tissues could be deleted by modulating the field of intensity, the cellular components could be separately selected. The cells were marked as spots (green; Figure 3C). We analyzed the cell counts, specifically those within the borders of the granuloma in the infected samples and divided it by the volume of each granuloma. The number of macrophages were significantly higher in the Mtb-infected granuloma (Figure 3D). In addition, the number of neutrophils were higher in the infected group than the naïve group (Figure 3E). These results were similar to that obtained by the flow cytometric studies. However, since the cell count was limited to the granulomas, this result is more reliable in regard to the analysis of the granulomatous lesions.
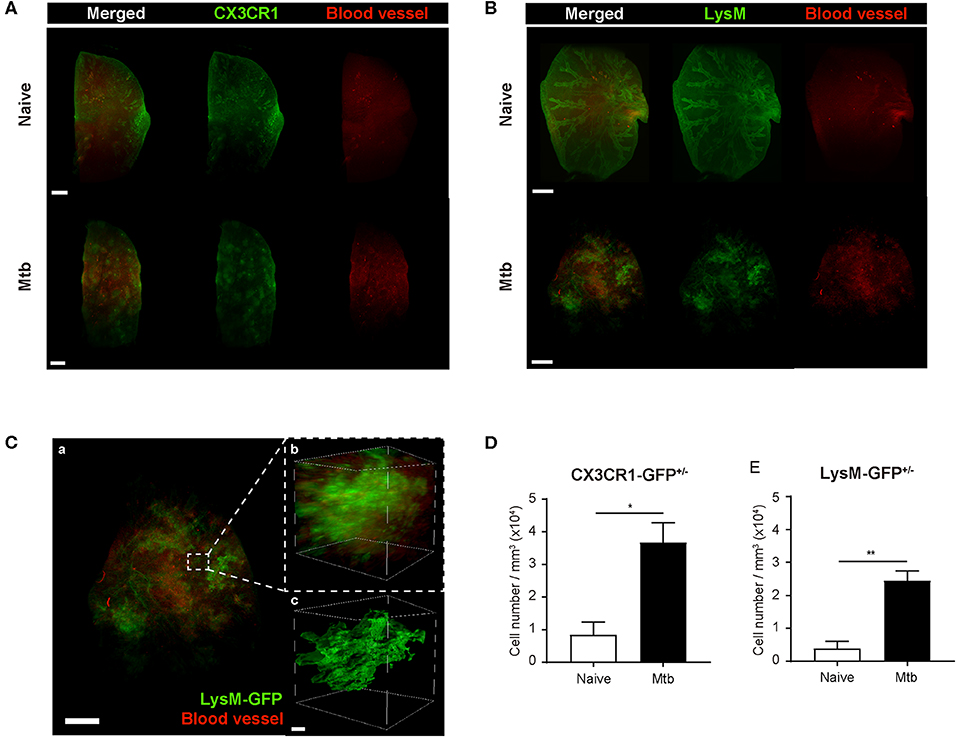
Figure 3. Three-dimensional visualization of the cleared naïve and Mtb-infected mice lung. (A,B) Granulomas were clearly detected using CX3CR1-GFP (green fluorescent protein) and LysM-GFP mice. The formation of the blood vessels around the granulomas was also observed. (C) The zoomed-in image, containing a single granuloma, was reconstructed as an image of a graphic mass, representing the granuloma, and spots, representing the fluorescent immune cells, for quantitative analysis. (D,E) The number of macrophages and neutrophils per volume was compared between naïve and infected group (three granulomas per mouse, three mice per group, mean ± SEM). Statistical analysis was performed using the Student's t-test. *P < 0.05, **P < 0.01.
To map the vascular distribution of the organ, florescent-labeled L. esculentum lectin was infused via the retro-orbital vein to visualize blood vessels prior to sample preparation. It has been reported that uncontrolled angiogenesis occurs in the lungs following Mtb infection (Cronan et al., 2015; Oehlers et al., 2015). Consistent with this report, the vascular distribution differed between the naïve and Mtb-infected mouse's lungs (Figure 3). In the naïve mouse's lung, the vasculature was distributed evenly over the entire organ, showing typical alveolar structures (Figures 3A,B, upper right panels). However, in the Mtb-infected lungs, the vessels showed a more concentrated distribution around the granulomas (Figures 3A,B, lower right panels). In a zoomed-in image of a granuloma (Figure 3C), the vessels appeared to form an outer layer of the lesion, which suggests that the angiogenesis around the granulomas can cause a difference in vascular distribution.
In this study, we employed a tissue-clearing method using ECi solution that preserves the fluorescence of fluorescent proteins, such as GFP, while making an intact organ transparent (Klingberg et al., 2017). Through this procedure, we were able to generate 3D images of the whole mouse lungs containing granulomatous lesions. We demonstrated the distribution of immune cells within each of the selected granulomas and performed a quantitative analysis comparing the immune cell population between Mtb-infected and naïve mouse lungs. The novelty of this study lies in its innovative approach to visualize the immune reactions during TB infection. Compared to the conventional methods such as H&E staining, FACS (fluorescence-activated cell sorting), clearing of the whole lung has a clear advantage of visualizing how the immune cells with fluorescence are located within the pathologic lesion. This allows an accurate counting of specific subtypes of immune cells, which is limited using 2D-sectioned images. In addition, since lung clearing uses the whole lung sample, macroscopic analysis, e.g., shape, volume, distribution of granuloma, can be performed simultaneously with the microscopic analysis. This method can be used in a variety of studies aiming to interpret or modulate the immune response against Mtb infection and should be further evaluated for its application in studying other diseases. For 3D images for the tissue-cleared lungs captured by light sheet microscopy, we employed low magnitude objective lens to acquire the larger area imaging including multiple granulomas, which may result in low-resolution images. To avoid a bias of manual counting of cell numbers from the image data, we performed cell counting by the Imaris software depending on the size and the intensity of the fluorescent cells. Although we just used only 4 weeks period of TB infection for immune cells counting in this study, as an innovative modality to visualize and quantify the immune reactions in TB infection, the whole lung clearing could be a versatile tool to find better clue for therapeutics against TB in combination with other experimental techniques.
All datasets generated for this study are included in the article/Supplementary Material.
The animal study was reviewed and approved by Yonsei University College of Medicine.
G-YK and H-JR performed the experiments and wrote the manuscript. H-HC provided essential reagents for the experiments. SS and Y-MH conceived the study and wrote the manuscript.
This study was supported by the National Research Foundation of Korea (NRF) grant funded by the Korea government (MSIT) (NRF-2019R1A2C2003204, SS and NRF-2019R1A2C2008481, Y-MH) Republic of Korea.
The authors declare that the research was conducted in the absence of any commercial or financial relationships that could be construed as a potential conflict of interest.
The Supplementary Material for this article can be found online at: https://www.frontiersin.org/articles/10.3389/fcimb.2020.00226/full#supplementary-material
Supplementary Video 1. 3D clearing imaging of naïve CX3CR1-GFP+/− mouse's lung. Green and red fluorescence represents CX3CR1+/− cells and blood vessels, respectively.
Supplementary Video 2. 3D clearing imaging of Mtb-infected CX3CR1-GFP+/− mouse's lung. Green and red fluorescence represents CX3CR1+/− cells and blood vessels, respectively. Blood vessels are aggregated around the granulomas.
Supplementary Video 3. 3D clearing imaging of naïve LysM-GFP+/− mouse's lung. Green and red fluorescence represents LysM-GFP+/− cells and blood vessels, respectively.
Supplementary Video 4. 3D view of Mtb-infected LysM-GFP+/− mouse's lung. Green and red fluorescence represents LysM-GFP+/− cells and blood vessels, respectively. Blood vessels are clumped around the granuloma lesion.
Supplementary Video 5. A single granuloma of Mtb-infected LysM-GFP+/− mouse's lung. For analysis, a single granulomatous area was reconstructed into a graphic mass, and volume could be measured, also LysM-GFP+/− cells could be defined as green dots.
CFU, colony-forming units; ECi, ethyl cinnamate; FACS, fluorescence-activated cell sorting; FBS, fetal bovine serum; FDA, U.S. Food and Drug Administration; GFP, green fluorescent protein; H&E, hematoxylin and eosin; LFMS, light sheet fluorescence microscopy; Mtb, Mycobacterium tuberculosis; OADC, oleic acid albumin dextrose catalase; PBS, phosphate-buffered saline; TB, tuberculosis; WHO, World Health Organization.
Barnes, P. F., Leedom, J. M., Chan, L. S., Wong, S. F., Shah, J., Vachon, L. A., et al. (1988). Predictors of short-term prognosis in patients with pulmonary tuberculosis. J. Infect. Dis. 158, 366–371. doi: 10.1093/infdis/158.2.366
Chung, K., Wallace, J., Kim, S. Y., Kalyanasundaram, S., Andalman, A. S., Davidson, T. J., et al. (2013). Structural and molecular interrogation of intact biological systems. Nature 497, 332–337. doi: 10.1038/nature12107
Cohen, S. B., Gern, B. H., Delahaye, J. L., Adams, K. N., Plumlee, C. R., Winkler, J. K., et al. (2018). Alveolar macrophages provide an early Mycobacterium tuberculosis niche and initiate dissemination. Cell Host Microbe 24, 439–446.e434. doi: 10.1016/j.chom.2018.08.001
Condos, R., Rom, W. N., Liu, Y. M., and Schluger, N. W. (1998). Local immune responses correlate with presentation and outcome in tuberculosis. Am. J. Respir. Crit. Care Med. 157, 729–735. doi: 10.1164/ajrccm.157.3.9705044
Cronan, M. R., Rosenberg, A. F., Oehlers, S. H., Saelens, J. W., Sisk, D. M., Jurcic Smith, K. L., et al. (2015). CLARITY and PACT-based imaging of adult zebrafish and mouse for whole-animal analysis of infections. Dis. Model Mech. 8, 1643–1650. doi: 10.1242/dmm.021394
Davis, J. M., and Ramakrishnan, L. (2009). The role of the granuloma in expansion and dissemination of early tuberculous infection. Cell 136, 37–49. doi: 10.1016/j.cell.2008.11.014
Eum, S. Y., Kong, J. H., Hong, M. S., Lee, Y. J., Kim, J. H., Hwang, S. H., et al. (2010). Neutrophils are the predominant infected phagocytic cells in the airways of patients with active pulmonary TB. Chest 137, 122–128. doi: 10.1378/chest.09-0903
Faust, N., Varas, F., Kelly, L. M., Heck, S., and Graf, T. (2000). Insertion of enhanced green fluorescent protein into the lysozyme gene creates mice with green fluorescent granulocytes and macrophages. Blood 96, 719–726. doi: 10.1182/blood.V96.2.719
Floyd, K., Glaziou, P., Zumla, A., and Raviglione, M. (2018). The global tuberculosis epidemic and progress in care, prevention, and research: an overview in year 3 of the End TB era. Lancet Respir. Med. 6, 299–314. doi: 10.1016/S2213-2600(18)30057-2
Fulton, S. A., Reba, S. M., Martin, T. D., and Boom, W. H. (2002). Neutrophil-mediated mycobacteriocidal immunity in the lung during Mycobacterium bovis BCG infection in C57BL/6 mice. Infect. Immun. 70, 5322–5327. doi: 10.1128/IAI.70.9.5322-5327.2002
Jung, S., Aliberti, J., Graemmel, P., Sunshine, M. J., Kreutzberg, G. W., Sher, A., et al. (2000). Analysis of fractalkine receptor CX(3)CR1 function by targeted deletion and green fluorescent protein reporter gene insertion. Mol. Cell Biol. 20, 4106–4114. doi: 10.1128/MCB.20.11.4106-4114.2000
Klingberg, A., Hasenberg, A., Ludwig-Portugall, I., Medyukhina, A., Mann, L., Brenzel, A., et al. (2017). Fully automated evaluation of total glomerular number and capillary tuft size in nephritic kidneys using lightsheet microscopy. J. Am. Soc. Nephrol. 28, 452–459. doi: 10.1681/ASN.2016020232
Lerner, T. R., Borel, S., and Gutierrez, M. G. (2015). The innate immune response in human tuberculosis. Cell Microbiol. 17, 1277–1285. doi: 10.1111/cmi.12480
Lowe, D. M., Redford, P. S., Wilkinson, R. J., O'Garra, A., and Martineau, A. R. (2012). Neutrophils in tuberculosis: friend or foe? Trends Immunol. 33, 14–25. doi: 10.1016/j.it.2011.10.003
Medina, E., and North, R. J. (1998). Resistance ranking of some common inbred mouse strains to Mycobacterium tuberculosis and relationship to major histocompatibility complex haplotype and Nramp1 genotype. Immunology 93, 270–274. doi: 10.1046/j.1365-2567.1998.00419.x
Nandi, B., and Behar, S. M. (2011). Regulation of neutrophils by interferon-gamma limits lung inflammation during tuberculosis infection. J. Exp. Med. 208, 2251–2262. doi: 10.1084/jem.20110919
Oehlers, S. H., Cronan, M. R., Scott, N. R., Thomas, M. I., Okuda, K. S., Walton, E. M., et al. (2015). Interception of host angiogenic signalling limits mycobacterial growth. Nature 517, 612–615. doi: 10.1038/nature13967
Papayannopoulos, V. (2018). Neutrophil extracellular traps in immunity and disease. Nat. Rev. Immunol. 18, 134–147. doi: 10.1038/nri.2017.105
Pedrosa, J., Saunders, B. M., Appelberg, R., Orme, I. M., Silva, M. T., and Cooper, A. M. (2000). Neutrophils play a protective nonphagocytic role in systemic Mycobacterium tuberculosis infection of mice. Infect. Immun. 68, 577–583. doi: 10.1128/IAI.68.2.577-583.2000
Petrofsky, M., and Bermudez, L. E. (1999). Neutrophils from Mycobacterium avium-infected mice produce TNF-alpha, IL-12, and IL-1 beta and have a putative role in early host response. Clin. Immunol. 91, 354–358. doi: 10.1006/clim.1999.4709
Pieters, J. (2008). Mycobacterium tuberculosis and the macrophage: maintaining a balance. Cell Host Microbe 3, 399–407. doi: 10.1016/j.chom.2008.05.006
Ramanujam, N. (2000). Fluorescence spectroscopy of neoplastic and non-neoplastic tissues. Neoplasia 2, 89–117. doi: 10.1038/sj.neo.7900077
Schlesinger, L. S. (1996). Entry of Mycobacterium tuberculosis into mononuclear phagocytes. Curr. Top Microbiol. Immunol. 215, 71–96. doi: 10.1007/978-3-642-80166-2_4
Seiler, P., Aichele, P., Raupach, B., Odermatt, B., Steinhoff, U., and Kaufmann, S. H. (2000). Rapid neutrophil response controls fast-replicating intracellular bacteria but not slow-replicating Mycobacterium tuberculosis. J. Infect. Dis. 181, 671–680. doi: 10.1086/315278
Sugawara, I., Udagawa, T., and Yamada, H. (2004). Rat neutrophils prevent the development of tuberculosis. Infect. Immun. 72, 1804–1806. doi: 10.1128/IAI.72.3.1804-1806.2004
Tiberi, S., Walzl, G., Vjecha, M. J., Rao, M., Ntoumi, F., Mfinanga, S., et al. (2018). Tuberculosis: progress and advances in development of new drugs, treatment regimens, and host-directed therapies. Lancet Infect. Dis. 18, e183–e198. doi: 10.1016/S1473-3099(18)30110-5
Keywords: granuloma, innate immunity, lung, tissue clearing, tuberculosis
Citation: Kang G-Y, Rhyu H-J, Choi H-H, Shin SJ and Hyun Y-M (2020) 3D Imaging of the Transparent Mycobacterium tuberculosis-Infected Lung Verifies the Localization of Innate Immune Cells With Granuloma. Front. Cell. Infect. Microbiol. 10:226. doi: 10.3389/fcimb.2020.00226
Received: 18 February 2020; Accepted: 22 April 2020;
Published: 15 May 2020.
Edited by:
David Neil McMurray, Texas A& M Health Science Center, United StatesReviewed by:
Selvakumar Subbian, Public Health Research Institute (PHRI), United StatesCopyright © 2020 Kang, Rhyu, Choi, Shin and Hyun. This is an open-access article distributed under the terms of the Creative Commons Attribution License (CC BY). The use, distribution or reproduction in other forums is permitted, provided the original author(s) and the copyright owner(s) are credited and that the original publication in this journal is cited, in accordance with accepted academic practice. No use, distribution or reproduction is permitted which does not comply with these terms.
*Correspondence: Sung Jae Shin, c2pzaGluQHl1aHMuYWM=; Young-Min Hyun, eW1oeXVuQHl1aHMuYWM=
†These authors have contributed equally to this work
Disclaimer: All claims expressed in this article are solely those of the authors and do not necessarily represent those of their affiliated organizations, or those of the publisher, the editors and the reviewers. Any product that may be evaluated in this article or claim that may be made by its manufacturer is not guaranteed or endorsed by the publisher.
Research integrity at Frontiers
Learn more about the work of our research integrity team to safeguard the quality of each article we publish.