 Tien Le1
 Stephanie Htun2
 Manoj Kumar Pandey1,3Yihui Sun4,5
 Albert Frank Magnusen1
 Ehsan Ullah6Julie Lauzon7Shannon Beres8,9Chung Lee10
 Bin Guan6
 Robert B. Hufnagel6Brian P. Brooks6
 Sergio E. Baranzini4,5
 Anne Slavotinek1,2,3*
- 1Division of Human Genetics, Cincinnati Children’s Hospital Medical Center, Cincinnati, OH, United States
- 2Division of Medical Genetics, Department of Pediatrics, University of California San Francisco, San Francisco, CA, United States
- 3Department of Pediatrics, University of Cincinnati College of Medicine, Cincinnati, OH, United States
- 4Department of Neurology, Weill Institute for Neurosciences., University of California San Francisco, San Francisco, CA, United States
- 5Institute of Human Genetics, University of California San Francisco, San Francisco, CA, United States
- 6Ophthalmic Genetics and Visual Function Branch, National Eye Institute, National Institutes of Health, Bethesda, MD, United States
- 7Department of Medical Genetics and Pediatrics, Cumming School of Medicine, Alberta Children’s Hospital, University of Calgary, Calgary, AB, Canada
- 8Department of Ophthalmology, Stanford University School of Medicine, Stanford, CA, United States
- 9Department of Neurology and Neurosciences, Stanford University School of Medicine, Stanford, CA, United States
- 10Stanford University Pediatrics/Medical Genetics, Stanford University, Stanford, CA, United States
Introduction: Heterozygous deletions predicting haploinsufficiency for the Cysteine Rich Motor Neuron 1 (CRIM1) gene have been identified in two families with macrophthalmia, colobomatous, with microcornea (MACOM), an autosomal dominant trait. Crim1 encodes a type I transmembrane protein that is expressed at the cell membrane of lens epithelial and fiber cells at the stage of lens pit formation. Decreased Crim1 expression in the mouse reduced the number of lens epithelial cells and caused defective adhesion between lens epithelial cells and between the epithelial and fiber cells.
Methods: We present three patients with heterozygous deletions and truncating variants predicted to result in haploinsufficiency for CRIM1 as further evidence for the role of this gene in eye defects, including retinal coloboma, optic pallor, and glaucoma. We used Clustered Regularly Interspaced Short Palindromic Repeats (CRISPR)/Cas9 to make a stable Danio rerio model of crim1 deficiency, generating zebrafish that were homozygous for a 2 basepair deletion, c.339_340delCT p.Leu112Leufs*, in crim1.
Results: Homozygous, crim1−/− larvae demonstrated smaller eyes and small and misshapen lenses compared to controls, but we did not observe colobomas. Bulk RNA-Seq using dissected eyes from crim1−/− larvae and controls at 72 h post fertilization showed significant downregulation of crim1 and chloride intracellular channel 4 (clic4) and upregulation of fibroblast growth factor 1b (fgf1b) and complement component 1, q subcomponent (c1q), amongst other dysregulated genes.
Discussion: Our work strengthens the association between haploinsufficiency for CRIM1 and eye defects and characterizes a stable model of crim1 loss of function for future research.
Introduction
Cysteine-rich motor neuron 1 (CRIM1; also known cysteine-rich transmembrane BMP regulator 1; Online Mendelian Inheritance in Man (OMIM) #606189) encodes a type I transmembrane protein that contains an extracellular N-terminal insulin-like growth factor-binding protein motif, six von Willebrand factor type C domains, four antistasin-like domains, a transmembrane domain, and a cytoplasmic C-terminal of 76 residues (Brastrom et al., 2019). The human gene has four isoforms, with the longest isoform containing 17 coding exons (NM_016441.3) and producing a 1,036 amino acid (Aa) protein. Heterozygous deletions predicted to result in haploinsufficiency for CRIM1 have been identified in families with eye defects comprising colobomatous macrophthalmia with an increased axial length of the globe, microcornea, and coloboma of the iris, chorioretinal structures, and optic disc (Toker et al., 2003; Beleggia et al., 2015; Haug et al., 2021). In these families, a deletion of approximately 22 kilobases (kb) that included exons 14 through 17 of CRIM1 was described in a family with microcornea, coloboma of the iris, choroid, retina, and optic disc, increased axial length, myopia, mild cornea plana, and a shallow anterior chamber (Toker et al., 2003; Beleggia et al., 2015). A deletion of approximately 9 kb removing exons 15–17 and the 3′ untranslated region (UTR) of CRIM1 was reported in a family with iris and chorioretinal colobomas and microcornea (Haug et al., 2021). These eye findings are known as colobomatous macrophthalmia with microcornea syndrome (MACOM; OMIM #602499) and are inherited as an autosomal dominant trait (Toker et al., 2003; Beleggia et al., 2015; Haug et al., 2021). Additional ocular findings in MACOM have included staphyloma and increased intraocular pressure (Bateman and Maumenee, 1984; Toker et al., 2003; Beleggia et al., 2015; Haug et al., 2021). The eye defects have shown variable expressivity, affecting eye laterality, axial length, and the severity of colobomas (Bateman and Maumenee, 1984; Haug et al., 2021). There have been no prior reports of pathogenic variants apart from the deletions resulting in CRIM1 haploinsufficiency. A duplication including CRIM1 and additional genes (GRCh37/hg19 2p23.3-21(chr2:24881528-43460021)x3) was noted in ClinVar, but no phenotypic details were provided. The predicted loss-of-function (pLoF) score for CRIM1 in gnomAD v4.1 (Chen et al., 2024) is 1.
In murine embryos, Crim1 expression begins throughout the lens placode at embryonic day (E)10.5 and becomes concentrated in the lens epithelial (LE) and lens fiber (LF) cells at E12.5 (Lovicu et al., 2000; Zhang et al., 2016). As the lens fibers continue to mature, Crim1 is downregulated, but strong expression is maintained in the LE cells and in the developing LF cells of the lens cortex until postnatal life (Lovicu et al., 2000). Within the LE cells, Crim1 is localized to the cell membranes and cytoplasm (Zhang et al., 2016). CRIM1 is also expressed in the endoplasmic reticulum and accumulates at cell–cell contacts after the stimulation of human microvascular endothelial cells with lipopolysaccharide (Glienke et al., 2002).
Although complete loss of function for Crim1 resulted in perinatal lethality in the mouse, there have been several studies examining eye formation in mice that are homozygous (HZ) for Crim1 hypomorphic or conditional null alleles (summarized in Supplementary Table S1; Pennisi et al., 2007; Wilkinson et al., 2007; Wilkinson et al., 2009; Chiu et al., 2012; Pennisi et al., 2012; Wilkinson et al., 2012; Phua et al., 2013; Beleggia et al., 2015; Tam et al., 2018; Furuichi et al., 2019). Ocular defects resembling MACOM in the mutant mice have included small lenses, microcornea, a restricted aperture of the anterior eye chamber, and a narrow eye without diminished axial diameter (Beleggia et al., 2015). Additional eye findings have included microphthalmia (Chiu et al., 2012; Zhang et al., 2016), retinal dysplasia (Zhang et al., 2016), and aberrant accumulation of an ‘endothelial-like’ cellular mass or hyaloid cells in the posterior vitreous chamber (Pennisi et al., 2007; Tam et al., 2018). Small and misshapen lenses (Pennisi et al., 2007; Fan et al., 2014; Beleggia et al., 2015; Zhang et al., 2016), congenital cataracts (Zhang et al., 2016), reduced numbers of LE cells with disorganized epithelial cell adhesion, and deficient development of the LF cell mass have also been noted (Beleggia et al., 2015; Zhang et al., 2016; Tam et al., 2018). Crim1 is critical for the maintenance of the lens epithelium, which becomes anteriorly restricted in the murine mutants due to the early differentiation of LE cells into LF cells (Tam et al., 2018).
Zebrafish have a single, crim1 transcript that encodes a protein of 1,027 amino acids with 69% identity to human CRIM1 and a conserved domain structure resembling the human protein (Kolle et al., 2000; Kolle et al., 2003; Kinna et al., 2006). crim1 expression was observed from early blastula up to 48 h post-fertilization (hpf), consistent with maternal and zygotic expression (Kinna et al., 2006). The expression of crim1 was first observed in a diffuse pattern along the entire anterior–posterior axis and the notochord (Kinna et al., 2006). crim1 was also noted in the brain, the intermediate cell mass (ICM), and otic vesicles (Kinna et al., 2006). Using Daniocell, expression in the eye is the strongest after 72 hpf and is predominantly observed in the anterior retinal pigment epithelium (RPE), retinal interneurons, and developing RPE (Farrell et al., 2018; Sur et al., 2023). Prior studies using antisense morpholino (MO) injections targeting crim1 resulted in embryos with small eyes, small heads, abnormal somite patterning, curved bodies, and an expansion of the ICM compared to controls (Supplementary Table S2; Kinna et al., 2006). The embryos also had an aberrant formation of the intersegmental vessels and dorsal longitudinal anastomotic vessels, implicating crim1 in vascular development (Kinna et al., 2006). A subsequent study that used a low (1.0–1.5 ng) dose of antisense MO injections revealed increased nuclei clustered in the medial portion of the lens with mild, nuclei-in-lens cataracts but preserved visual attentiveness (Brastrom et al., 2019). Injected larvae were otherwise normal (Brastrom et al., 2019). Higher (2.5–3.0 ng) doses of antisense MOs led to increased numbers of nuclei in the lenses, microphthalmia, and defective retinal lamination (Brastrom et al., 2019).
In this study, we present the clinical details pertaining to three unpublished patients from two families with ocular defects due to pathogenic variants predicting haploinsufficiency for CRIM1. To better understand the etiology of the eye defects associated with decreased CRIM1 expression, we used Clustered Regularly Interspaced Short Palindromic Repeats (CRISPR)/Cas9 to generate a stable zebrafish model of reduced crim1 function with smaller eyes and lenses. We describe the phenotype of the crim1−/− mutant larvae and provide bulk RNA-seq data to support the role of this gene in eye development.
Materials and methods
Patients with pathogenic variants predicting haploinsufficiency for CRIM1
Patients with CRIM1 deletions and pathogenic variants were ascertained by GeneMatcher (Sobreira et al., 2015). Phenotypic and genotypic details were collected in a spreadsheet. Consent was obtained for the publication of anonymous clinical details for each participant.
Generation and phenotyping of crim1−/− larvae
All animal experiments were performed under protocols approved by the Institute for Animal Care and Use Committee (IACUC) at the University of California, San Francisco, and the IACUC committee at Cincinnati Children’s Hospital Medical Center (IACUC #2022-0040). EKW strain zebrafish were maintained at 28°C on a 14-h (h) light/10-h dark cycle. We used a modification of the previous CRISPR methodology to target the single crim1 gene (ENSDART00000050534.6) in Danio rerio (Talbot and Amacher, 2014). We designed a small guide (sg)RNA targeting crim1 prior to the coding sequence for the von Willebrand factor type C domains, antistasin-like domains, and the cysteine-rich motor neuron 1 protein domain (Supplementary Table S3). We injected zebrafish eggs at the one-cell stage and used Sanger sequencing in batches of 10–20 larvae at 48 hpf to assess the success of the injections. F0 larvae with insertion/deletion (indel) variants were raised and genotyped at 6–8 weeks by fin clipping after inducing anesthesia by immersing the fish in 0.02% tricaine methanesulfonate (FINQUEL or Tricaine-S) until gill movement was slowed. DNA was extracted from the clipped tail fin and Sanger-sequenced to assess successful gene targeting (for genotyping primers, see Supplementary Table S4). We selected an F0 founder with a 2 base pair (bp) deletion, c.339_340delCT p.Leu112Leufs*3 that introduced a frameshift and predicted premature protein truncation and nonsense-mediated decay for the crim1 transcript (for Sanger sequencing traces, see Supplementary Figure S1). After outcrossing this F0 founder, F1 progeny were raised and genotyped using DNA obtained from fin-clipping, as mentioned above. Heterozygous F1 adults were in-crossed to obtain F2 zebrafish that were homozygous (HZ) for the 2 bp deletion in crim1. These HZ mutant larvae, henceforth referred to as crim1−/− larvae, were viable. We raised and bred crim1−/− larvae that appeared normal, without any eye defects, for our experiments. We also examined eye morphology in heterozygous crim1+/− larvae. Our control fish were derived from the EKW strain or the NBT:DsRed strain that labels neurons under the neural ß-tubulin promoter and is not known to have any eye defects (Mazzolini et al., 2018).
We examined the crim1−/− larvae, crim1+/− larvae, and controls at 1–6 days post fertilization (dpf) for the ocular and lens findings previously observed in patients with MACOM and prior models of Crim1 and crim1 loss of function. We measured eye and lens size, head size, and body length compared to control larvae of the same age and developmental stage. Larvae with bent tails were measured along the body axis and the curved tail to capture the full length of the larva. We examined eye and lens morphology with hematoxylin and eosin (H&E) staining and immunohistochemistry (IHC) and used light microscopy to visualize the LE cells, LF cells, and retinal cell layers according to previously described methods (Krall et al., 2018; see Supplementary Table S4 for antibodies used and Supplementary Data for Method). Larvae photographed with differential interference contrast (DIC) microscopy at 3 dpf were treated with propylthiouracil after fertilization according to standard methods (Elsalini and Rohr, 2003). We used rabbit anti-phospho-histone H3 at 1–400 dilution (PH3; #9701S, Cell Signaling, Danvers, MA) with anti-rabbit Alexa Fluor 488 (Invitrogen, Grand Island, New York) for PH3 staining. We scored two sections per eye for PH3+ cells. At 48 hpf, we scored 7 control larvae, 5 crim1+/− larvae, and 4 crim1−/− larvae. At 72 hpf, we scored 9 control larvae, 4 crim1+/− larvae, and 8 crim1−/− larvae.
5-Bromo-2′-deoxyuridine labeling and scoring
For BrdU labeling, 48 hpf and 72 hpf larvae were incubated in egg water containing 10 mM 5-bromo-2′-deoxyuridine (BrdU)/15% dimethyl sulfoxide (DMSO) solution (Sigma-Aldrich, St. Louis, MO) on ice for 30 min. Post-incubation, larvae were rinsed with fresh egg water and then placed at 28°C for 1 h (Janssens et al., 2013). BrdU-labeled larvae were euthanized and fixed with 4% paraformaldehyde in phosphate-buffered saline (PBS). BrdU-labeled sections were treated with 2N hydrochloric acid (HCl)/0.5% Triton/PBS for 60 min prior to incubation with mouse anti-BrdU (#B2531, 1-400, Sigma-Aldrich), followed by conjugation with anti-mouse Alexa 488 (Invitrogen, Carlsbad, CA). At least two sections per eye and both eyes were counted manually for BrdU + cells using ImageJ software.
‘Bulk’ RNA-seq in crim1−/− mutant larvae
We performed ‘bulk’ RNA-seq experiments in dissected eyes from in-crossed crim1−/− larvae and controls at 72 hpf according to the previously described methods (Krall et al., 2018). RNA quality and quantity were reviewed using a bioanalyzer (2100 Bioanalyzer, Agilent), and libraries were prepared with an Ovation® RNA-Seq System V2 Kit (NuGEN). With this method, total RNA was reverse transcribed to synthesize first-strand cDNA using a combination of random hexamers and a poly-T chimeric primer (Krall et al., 2018). The RNA template was then partially degraded by heating, and the second-strand cDNA was synthesized using DNA polymerase. The double-stranded DNA was then amplified using single primer isothermal amplification (SPIA). SPIA is a linear cDNA amplification process in which RNase H degrades RNA in DNA/RNA heteroduplex at the 5′-end of the double-stranded DNA, after which the SPIA primer binds to the cDNA and the polymerase starts replication at the 3′-end of the primer by displacement of the existing forward strand (Krall et al., 2018). Random hexamers were then used to linearly amplify the second-strand cDNA. Finally, libraries from the SPIA-amplified cDNA were prepared using the Ultralow DR Library Kit (NuGEN). The RNA-seq libraries were analyzed for quality and primer dimers using a bioanalyzer and quantified by quantitative polymerase chain reaction (qPCR) prior to sequencing (KAPA Library Quantification Kit). High-throughput sequencing was conducted using single-end 50 lane(s) on a HiSeq 4000 instrument (Illumina).
The quality of raw single-end reads of the RNA-seq dataset was tested by FastQC (http://www.bioinformatics.babraham.ac.uk/projects/fastqc/) to evaluate the per-base sequence quality, quality scores, sequence length distribution, and overrepresented adapter/primer sequences. After quality control with FastQC, data trimming and clipping were performed using BBDuk and aligned against the zebrafish reference genome (GRCz11) using STAR. Alignment results were then assessed to check the quality with Qualimap. RSEM was used to quantify genes. Finally, DESeq2 was used to conduct a downstream analysis for differentially expressed genes. Statistically significant differentially expressed genes (DEGs) with log2 (fold change) greater than ±0.5, an adjusted p-value ≤0.05, and the mean fragments per kilobase of exon per million fragments mapped (FPKM) ≥1 in all datasets were identified by comparing crim1−/− mutants with control datasets using an in-house Python script. Principal component analysis (PCA) was performed on global gene expression to determine the relatedness between the individual replicates of wildtype and mutant datasets.
Reverse transcriptase quantitative polymerase chain reaction
We designed gene-specific, reverse transcriptase quantitative polymerase chain reaction (RT-qPCR) primers flanking at least one intron for the top-ranking up- and down-dysregulated genes in the bulk RNA-seq experiments (for primers, see Supplementary Table S5). Each RT-qPCR was run in triplicate with melt curve analysis showing a single peak. All experiments were performed on at least three biological replicates of control and crim1−/− larvae, following the previously described methods (Krall et al., 2018). We generated a time course of crim1 expression from 24 to 72 hpf. Eyes were dissected from zebrafish larvae into cold, 1x PBS at 72 hpf. A total of 40 pairs of eyes were pooled in a 1.5-mL microfuge tube, spun, and snap-frozen at −80°C after PBS removal. Total RNA was extracted using the PureLink RNA Mini Kit (Invitrogen, Carlsbad, CA). RNA was treated with Ambion™ DNase I (RNase-free, Invitrogen, Carlsbad, CA) to remove impurities. cDNA was synthesized from 1.5 µg of total RNA with oligo(dT)20 priming using SuperScript III Reverse Transcriptase (Invitrogen, Carlsbad, CA). Reactions were run on an ABI Prism 7500 Sequence Detection System, and data were analyzed according to the ΔΔCt method using eef1a1l1 (NM_131263.1) as an internal control according to previously described methods (Wu et al., 2015).
Terminal deoxynucleotidyl transferase dUTP nick end labeling assay
Terminal deoxynucleotidyl transferase dUTP nick end labeling (TUNEL) staining was performed on cryosections of controls and crim−/− larvae from 48 to 72 hpf, according to the manufacturer’s protocol (1168479510, Roche, Indianapolis, IN). We examined a minimum of four larvae from each experimental group and analyzed 2–4 non-consecutive mid-eye sections per eye at each timepoint. For apoptotic cleaved caspase-3, we stained cryosections from controls and crim−/− larvae at 24, 30, 48, and 72 hpf. A minimum of four larvae from each experimental group were analyzed using 2–4 non-consecutive sections from the middle of each eye for each timepoint. Sections were stained and counted using the count tool in ImageJ software. The number of TUNEL-positive or cleaved caspase-3-positive cells was divided by the total number of nuclei labeled with 4′,6-diamidino-2phenylindole (DAPI) and plotted against age. After calculating the mean ± standard error (SE), groups with statistically significant differences compared to controls were determined using a Student’s t-test.
Enzyme-linked immunosorbent assay
Fifty whole larvae were collected from controls and crim1−/− larvae at 12 and 24 hpf. Additionally, 100 whole eyes were collected from controls and crim1−/− larvae at 48 and 72 hpf. These eye tissues were rapidly frozen on dry ice, then thawed, and mechanically homogenized. The homogenates were centrifuged at 8,000 relative centrifugal force (rcf) at 4°C. The resulting supernatants containing soluble proteins were carefully collected. These supernatants were then used for quantifying C1q levels using an enzyme-linked immunosorbent assay (ELISA), following the protocols provided by the manufacturer (MBS023066, MyBioSource, San Diego, CA). Optical density at 450 nm was read using a Bio-Tek Microplate Reader System with Gen5 software (Bio-Tek, Santa Clara, CA).
Immunoprecipitation
Fifty heads were collected from control and crim1−/− larvae at 72 hpf. Whole heads were homogenized, solubilized, and washed (Michel and Miller, 2023). Supernatants were pre-cleared, and the protein lysates were measured using a Direct Detect Spectrometer system (DDHW00010, Millipore Sigma, Burlington, MA, United States). Lysates were incubated with recombinant anti-Crim1 (AB5699, 1:200, Sigma-Aldrich, St. Louis, MO) and anti-β1-integrin (Itgβ1; clone MB1.2, MAB1997, 1:50, Sigma-Aldrich, St. Louis, MO) at 2 µg of antibody overnight at 4°C. After washing, the supernatants were used for Western blot analysis according to standard methods. We loaded 20 µL of 40 µg of immunoprecipitants and 20 µL of 4 µg of input using 4%–20% Mini-PROTEAN® TGX Stain-Free™ Protein Gels (Bio-Rad, Hercules, CA).
Statistics
Statistical analysis was performed using t-tests according to standard methods. We used a significance level of P-value < 0.05.
Results
Patients with pathogenic variants predicting haploinsufficiency for CRIM1 demonstrate coloboma and optic atrophy
The clinical and genetic data from patients with CRIM1 variants predicting haploinsufficiency are summarized in Table 1 and presented in full in Supplementary Table S6. We ascertained a 48-year-old female with bilateral cornea plana and microcornea, bilateral cataracts (right eye, dense nuclear and partially subluxated; left eye, surgically removed intraocular lens, aphakic), bilateral iris colobomas, and a coloboma of the retina in the left eye, with bilateral retinal detachments. Due to significant corneal band keratopathy and dense media opacity in the right eye, examination of the optic nerve and posterior pole of the retina could not to be performed. Her aphakic left eye distance visual acuity was 20/80 with a +7.00 + 2.00 × 81 refraction. Her right eye had no light perception. Other findings included mild, low-frequency sensorineural hearing loss that normalized in the mid frequencies and sloped to a mild-to-moderate loss at high frequencies bilaterally. A renal ultrasound (US) scan showed mild, focal caliectasis/hydronephrosis of the right kidney at the mid to lower pole of the collecting system and diffuse mild left hydronephrosis. The patient and her father had a heterozygous, 39,942 bp deletion encompassing exons 14 to 17 and the 3′ UTR region of CRIM1. The deletion also included exons 6 to 8 of Fasciculation and Elongation protein, Zygin/zeta-2 (FEZ2; OMIM #62486), which has not yet been associated with a phenotype in humans.
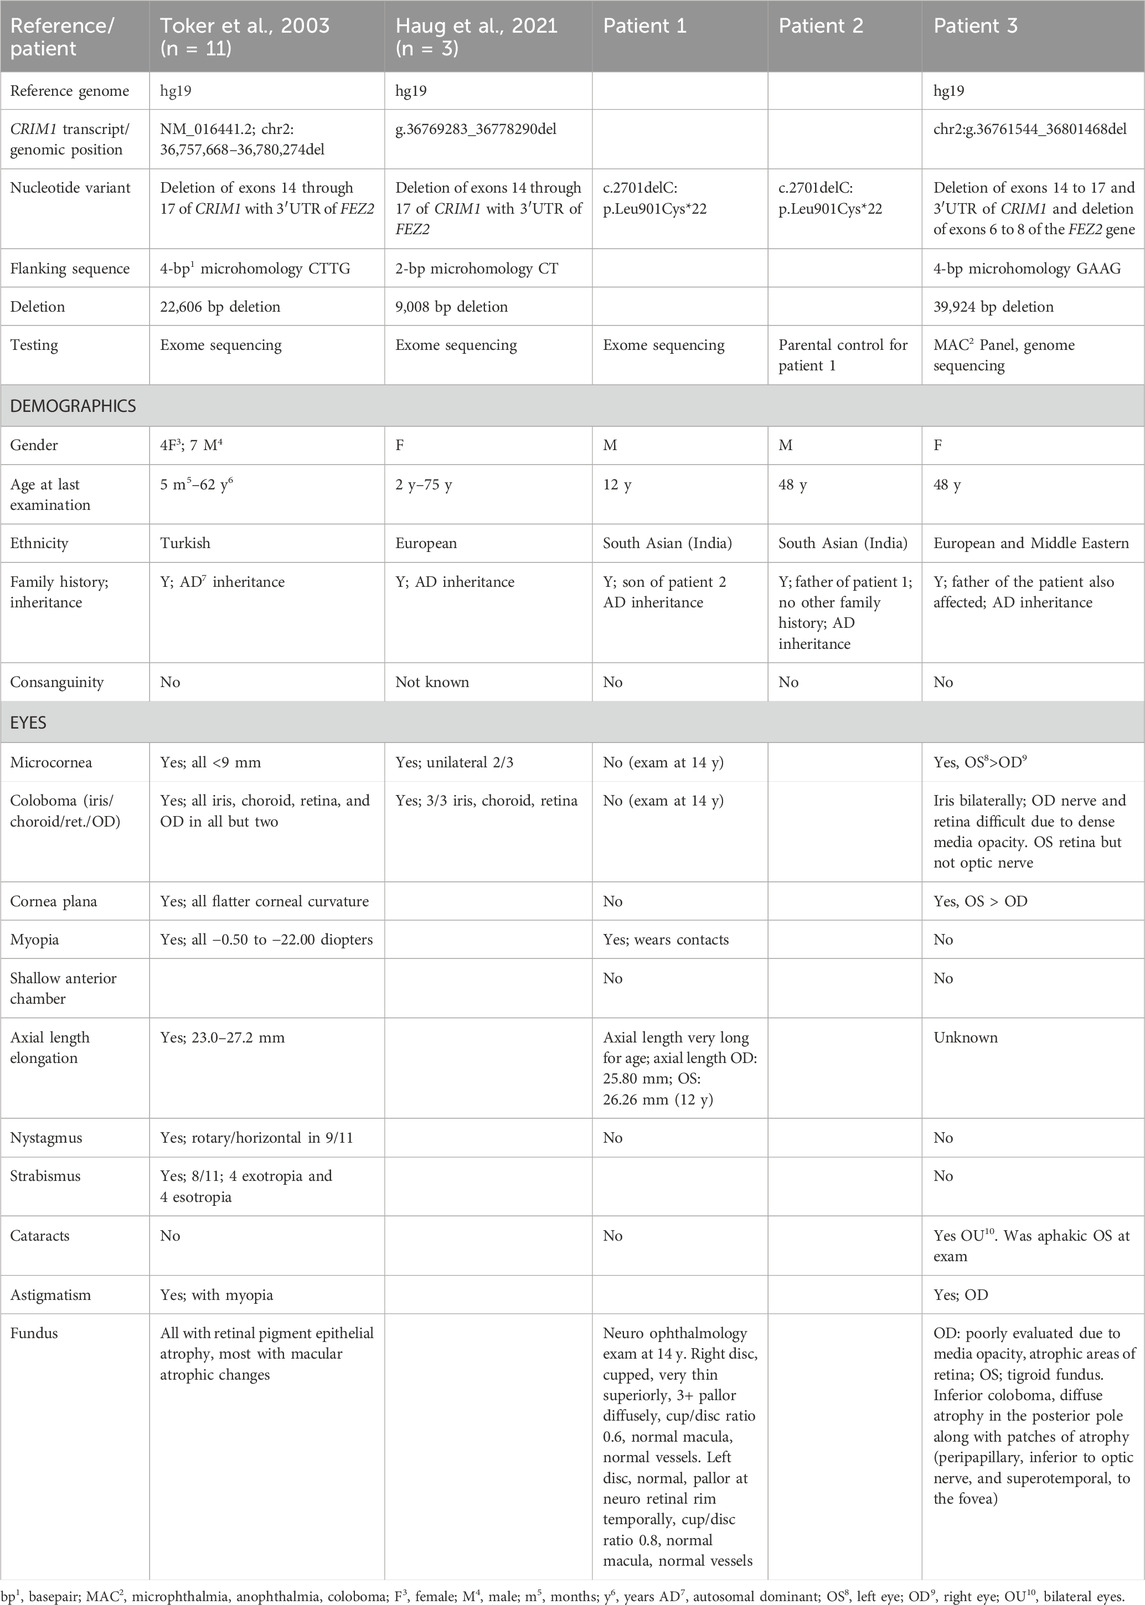
Table 1. Description of CRIM1 variants and eye findings in three new patients with CRIM1 haploinsufficiency.
A second family of two generations comprised a 12-year-old male with myopia and his father. The boy had an increased axial length and vision loss from optic atrophy in both eyes, with temporal field loss in the right eye and left total inferior temporal field loss. The optic nerves were cupped with 3+ optic atrophy of the neuro-retinal rim in the right eye. The left optic disc was normal, with pallor at the temporal neuro-retinal rim. Optical coherence tomography (OCT) showed a severely thin retinal nerve fiber layer in his right eye and a mildly thin retinal nerve fiber layer in his left eye. Other medical findings comprised febrile seizures at 2 years of age, testicular torsion treated with orchidopexy, an arachnoid cyst, and a Chiari malformation that reportedly resolved on subsequent magnetic resonance imaging (MRI) of the brain. His milestones and development were normal, except for requiring 6 months of speech therapy at the age of 2 years. His father was myopic and wore glasses from 10 years of age and was diagnosed with corneal pannus, cataract at a young age, and visual field loss. The father’s examination showed a similar optic nerve appearance to his son and bilateral, diffuse optic atrophy with cupping. Both father and son had a single-nucleotide deletion in CRIM1, c.2701delC p.Leu901Cysfs*22 (NM_016441.3). This variant affects exon 15 out of 17 exons in the longest isoform of CRIM1, which is the only known coding transcript. The variant is not present in the 1000 Genomes Project but was found in one individual in gnomAD v4.1 (1/1,424,618 alleles for an allele frequency of 7.02e−7; no homozygous allele) and predicts premature protein truncation and nonsense-mediated decay (MutationTaster; Schwarz et al., 2010). The nucleotide variant also increases an acceptor splice site (wildtype 0.21 mutant 0.27; exon gtgg/CCCA intron; MutationTaster; Schwarz et al., 2010).
crim1−/− mutant larvae demonstrate microphthalmia and lens defects
We in-crossed male and female zebrafish that were HZ for the 2bp deletion in crim1. At 48 hpf, the crim1−/− larvae showed increased numbers of malformations and shortened body lengths compared to controls (Figure 1A). Curved and shortened body axes and shortened or deformed tails were observed in 81.3% of crim1−/− larvae compared to 3.2% of controls (Figure 1A). At 24 hpf, there were no obvious external differences between the controls, heterozygous crim1+/− larvae, and crim1−/− larvae (Figure 1B). However, by 48 hpf, the crim1−/− mutants demonstrated tail deformities (Figure 1C, panel iii), and at 72 hpf, the crim1−/− mutants had curved tails similar to prior MO models of crim1 loss of function (Figure 1C, panel vi; Kinna et al., 2006). Heterozygotes appeared similar to controls at 48 hpf (Figure 1C, panel ii) and 72 hpf (Figure 1C, panel v), and for this reason, we did not quantify the malformations or study the heterozygotes further. Approximately 18% of the HZ crim1−/− larvae retained a normal external appearance and ocular appearance (Figure 1A).
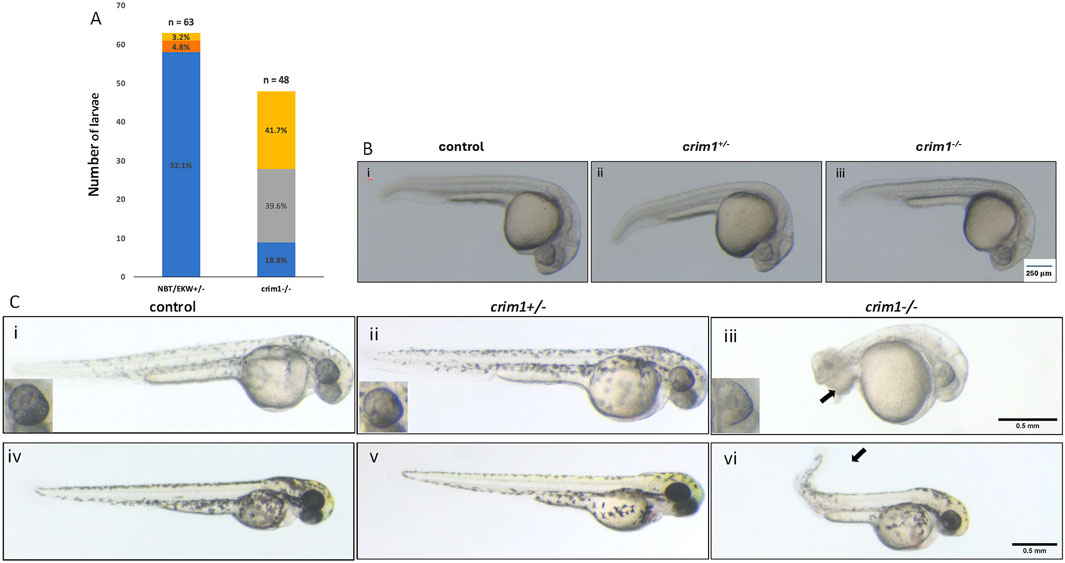
Figure 1. Morphology and appearance of control, heterozygous, crim1+/−, and crim1−/− larvae that are homozygous for a 2 base pair deletion, c.339_340delCT p.Leu112Leufs*3 at 24, 48, and 72 h post fertilization (hpf). (A) Morphology for control (n = 63) and crim1−/− larvae (n = 48) that are homozygous for a 2 base pair deletion in crim1. The columns are colored according to the numbers and percentages of larvae with a normal phenotype (blue), mild deformity (orange), curved body axis (yellow), and malformations such as edema, cardiac defects, and severely shortened body (gray). The crim1−/− larvae have an increased rate of abnormalities compared to controls. (B) Representative photographs of control larvae (panel i), heterozygous crim1+/− larvae (panel ii), and homozygous crim1−/− larvae (panel iii) at 24 hpf. The heterozygous crim1+/− larvae and homozygous crim1−/− larvae appear similar to the control. (C) Representative photographs of control larvae (panels i and iv), heterozygous crim1+/− larvae (panels ii and v), and homozygous crim1−/− larvae (panels iii and vi) at approximately 38 hpf (panels i, ii, and iii) and 72 hpf (panels iv, v, and vi). The heterozygous crim1+/− larvae appear similar to controls, but the homozygous crim1−/− larvae show shortened body axes and curved tails at both time periods, as indicated by the arrows. Scale bars = 500 µm.
We measured the longest axis for eye diameter, head diameter, and body length in the crim1−/− larvae and controls (see Figures 2A–C for measurements obtained). We found a significant decrease in the eye size in the crim1−/− larvae at 48 hpf and 72 hpf (Figure 2D; P-value for 48 hpf = 0.003 and P-value for 72 hpf = 0.002). This decrease in the eye size resembles microphthalmia observed in the mouse models of Crim1 loss of function (Supplementary Table S1; Chiu et al., 2012; Fan et al., 2014; Zhang et al., 2016). In contrast, the ratio of eye diameter to body length was significantly increased in the crim1−/− larvae at 48 hpf and 72 hpf (P-value for 48 hpf = 1.71e−06 and P-value for 72 hpf = 2.65e−05), consistent with a greater reduction in the body length than in the eye size (Figure 2E). Finally, the ratio of eye diameter to head diameter was increased in the crim1−/− larvae compared to controls at 48 hpf but not at 24 hpf or 72 hpf (Figure 2F).

Figure 2. Eye, head, and body measurements from control and crim1−/− larvae that are homozygous for a 2 base pair deletion, c.339_340delCT p.Leu112Leufs*3, at 48 and 72 h post fertilization (hpf). (A) Control larva showing measurements obtained for eye diameter and head length. (B, C) Control larva showing site of measurements for eye diameter and body and tail length. (D) Measurements of eye diameter in control larvae (white columns) and crim1−/− larvae (black columns) at 48 hpf and 72 hpf. Each dot represents a single measurement. Eye diameter is significantly decreased in the crim1−/− larvae compared to controls. (E) Ratio of eye diameter to body length in control larvae (white columns) and crim1−/− larvae (black columns) at 48 hpf and 72 hpf. Each dot represents a single measurement. The crim1−/− larvae demonstrate a significantly increased ratio for eye diameter to body length compared to controls. (F) Ratio of eye diameter to head diameter in control and crim1−/− larvae. Each gray dot represents a measurement at 24 hpf, 48 hpf, and 72 hpf. The height of the white columns represents the mean of the ratio of eye diameter to head diameter for control larvae and the height of the black columns representing the mean of the ratio of eye diameter to head diameter for the crim1−/− larvae. The crim1−/− larvae show a significantly increased ratio of eye diameter to head diameter at 48 hpf (P = 0.008), but the ratio was not significantly increased at 24 hpf or 72 hpf.
We used cryosections with H&E staining and light microscopy to examine eye and lens morphology in the crim1−/− larvae compared to controls at 3, 4, and 5 dpf (Figure 3). We also used differential interference contrast (DIC) microscopy to examine lens morphology in the crim1−/− mutant larvae compared to controls at 3 dpf (Figure 4). The lenses from crim1−/− mutant larvae appeared smaller in size compared to controls (Figure 3, panels A and E), and this difference in eye size persisted at 4 dpf and 5 dpf (Figure 3, panels B, C, and D and F, G, and H). The lens morphology also appeared to be irregular in crim1−/− mutant larvae compared with the typical spherical shape of control lenses (Figure 3, panel F compared to panel B and panel H compared to panel D). Examining the lenses with DIC microscopy showed that controls had a regular appearance of the lens in 8/8 larvae (Figure 4, panels A and B) compared to 3/14 crim1−/− mutant larvae that had an irregular, roughened appearance of the lens (Figure 4, panels D-F). However, some of the crim1−/− mutant larvae retained a normal appearance of the lens (Figure 4, panel C). The quantification of lens diameter for 16 lenses in controls and crim1−/− mutant larvae showed that crim1−/− larvae had significantly smaller lenses than controls (Figure 4, panel G, showing the method of measurement, and panel H, showing lens diameters; P-value = 0.036).
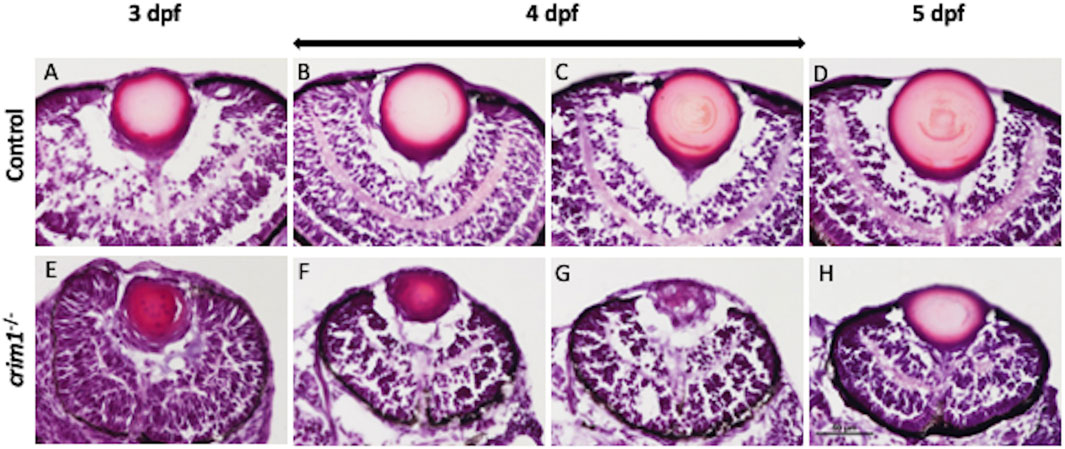
Figure 3. Representative images of zebrafish eyes stained with H&E from control and crim1−/− larvae that are homozygous for a 2 base pair deletion, c.339_340delCT p.Leu112Leufs*3, at 3–5 days post fertilization (dpf). The top row shows control larvae at 3 dpf (A), 4 dpf (B, C), and 5 dpf (D), showing normal lens and eye development. The bottom row shows homozygous crim1−/− larvae at 3 dpf (E), 4 dpf (F, G), and 5 dpf (H), showing reduced lens and eye size in the crim1−/− lenses at 3 and 4 dpf (E, F). At 3 dpf, 6–8 larvae were scored, and at 4 and 5 dpf, 10–12 larvae were scored. Scale bar = 50 µm.
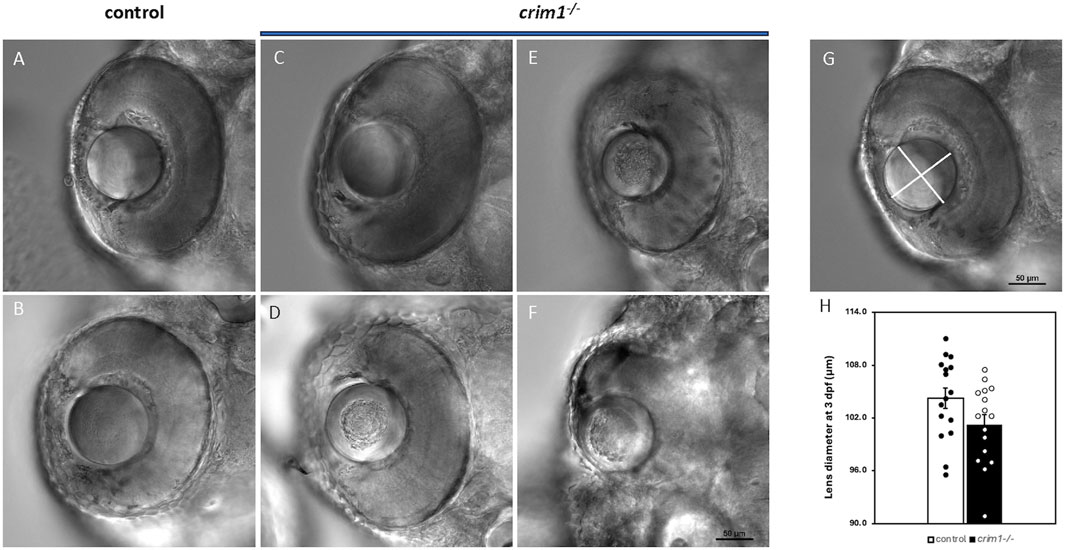
Figure 4. DIC microscopy of control and crim1−/− larvae that are homozygous for a 2 base pair deletion, c.339_340delCT p.Leu112Leufs*3, at 3 days post fertilization (dpf). (A–C) Lenses from control larvae and a crim1−/− larva that have a smooth and regular appearance. (D–F) Lenses from crim1−/− larvae that have a roughened and irregular appearance. (G) Method for obtaining measurements of lens diameter. (H) Measurements of lens diameter (in μm) in control and crim1−/− larvae in 16 lenses. There is a significant reduction in lens diameter for the crim1−/− larvae compared to controls (P = 0.036).
We then examined various ocular cell types for differences between the crim1−/− mutant larvae and controls. Staining with the zl-1 antibody that binds to differentiating LF cells (Greiling et al., 2010) showed irregular and amorphous-appearing lenses in the crim1−/− larvae compared to controls (Figure 5, panels A and B). Staining of the corneal epithelium with the E-cadherin antibody that binds to the corneal epithelium was similar between controls and crim1−/− larvae (Figure 5, panels C and D). Retinal lamination was grossly normal when examined using the zn-5 antibody that binds to amacrine cells and retinal ganglion cells in the retinal ganglion cell layer (Figure 5, panels E and F), but there was a significant increase in thickness of the retinal ganglion cell layer in the crim1−/− larvae compared to controls (Supplementary Figure S2; P-value = 0.00034). There was no obvious difference between controls and crim1−/− mutant larvae using the zpr-1 antibody that binds to photoreceptor cells (Figure 4, panels G and H). We did not observe colobomas in the crim1−/− larvae.
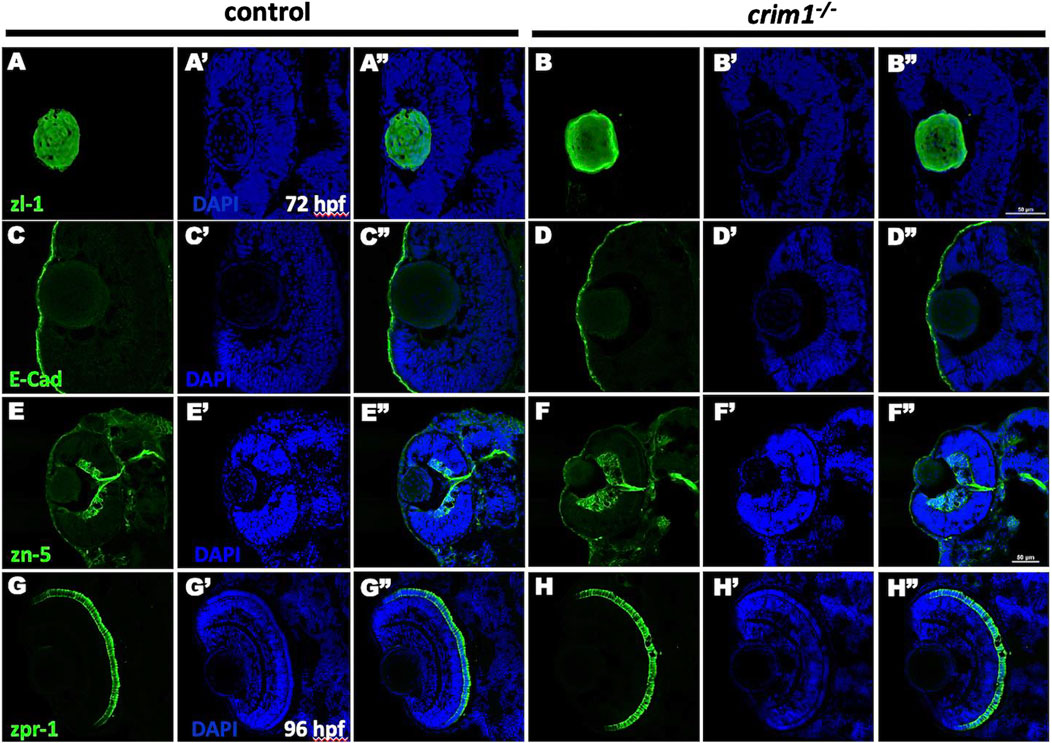
Figure 5. Immunohistochemistry in control and crim1−/− larvae that are homozygous for a 2 base pair deletion, c.339_340delCT p.Leu112Leufs*3, at 72 and 96 h post fertilization (hpf). Representative sections of eyes from control larvae (A, C, E, G) and crim1−/− larvae (B, D, F, H) at 72 hpf stained with zl-1 (A, B), E-cadherin (C, D), zn-5 antibody (E, F) and at 96 hpf stained with zpr-1 (G, H). The lens fiber cells in the crim1−/− larva stained with z-l1 are less homogenous compared to the lens from a control larva (A, B). The corneal epithelium showed mild clumping of cells in the crim1−/− larva stained with E-cadherin (C, D) compared to a control larva. The retinal ganglion cell layer was thicker in the crim1−/− larva stained with the zn-5 antibody than in a control larva (E, F). There was no obvious difference in the photoreceptors in crim1−/− and control larvae stained with zpr-1 (G, H). (A–H) Larvae stained with Alexa Fluor 488 dye (green). (A′–H′) Larvae stained with DAPI (blue). (A′′–H′′) Merged images. Scale bars = 50 µm.
We reasoned that the smaller eye size in the crim1−/− mutant larvae could be due to reduced cell proliferation. Staining with PH3 did not show any difference between crim1+/− heterozygous larvae and controls and between crim1−/− mutant larvae compared and controls (Figure 6, panels A–F; Figure 7A). There was a significant reduction in staining in crim1−/− mutant larvae compared to controls at 48 hpf (P = 0.013; Figure 6 panels G–I; Figure 7B), consistent with reduced cellular proliferation, but this difference was not statistically significant for heterozygous crim+/− larvae compared to controls at 48 hpf or between crim1−/− larvae compared to controls at 72 hpf.
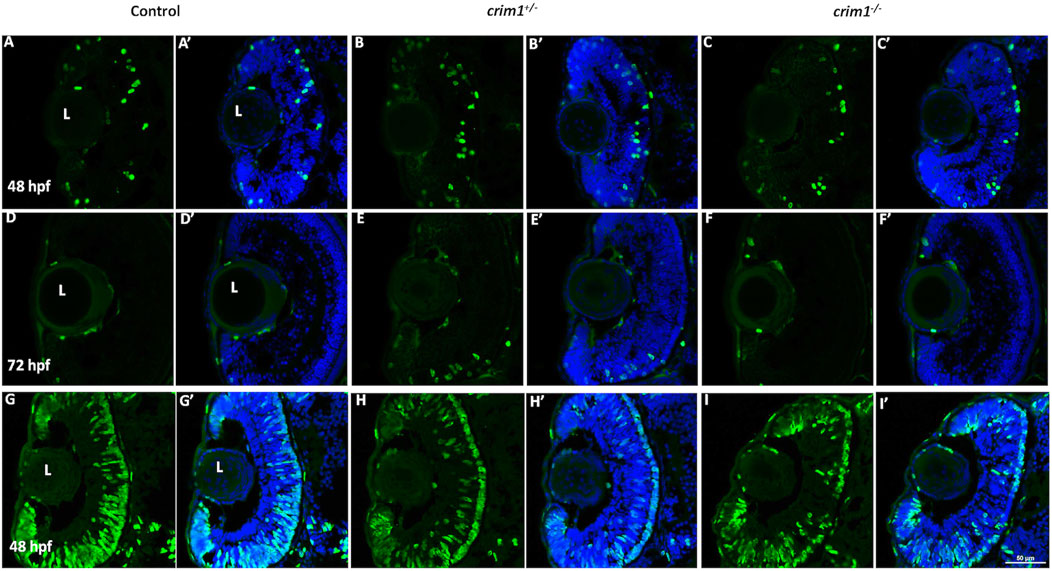
Figure 6. Phospho-histone H3 and 5-bromo-2′-deoxyuridine staining in control, crim1+/− larvae, and crim1−/− larvae that are homozygous for a 2 base pair deletion, c.339_340delCT p.Leu112Leufs*3, at 48 and 72 h post fertilization (hpf). Representative sections of eyes from control larvae (A, D, G), crim1+/− larvae (B, E, H), and crim1−/− larvae (C, F, I) stained with the PH3 antibody (Alexa Fluor 488 dye; green) and DAPI (merged (A’–F’), blue) at 48 and 72 hpf (A–F) and with BrdU (Alexa Fluor 488 dye; green) and DAPI (merged (G’–I’), blue) at 48 hpf (G–I). The quantification of the BrdU antibody showed a significant reduction in BrdU staining in the homozygous crim1−/− larvae compared to control at 48 hpf (P = 0.013). L = lens.
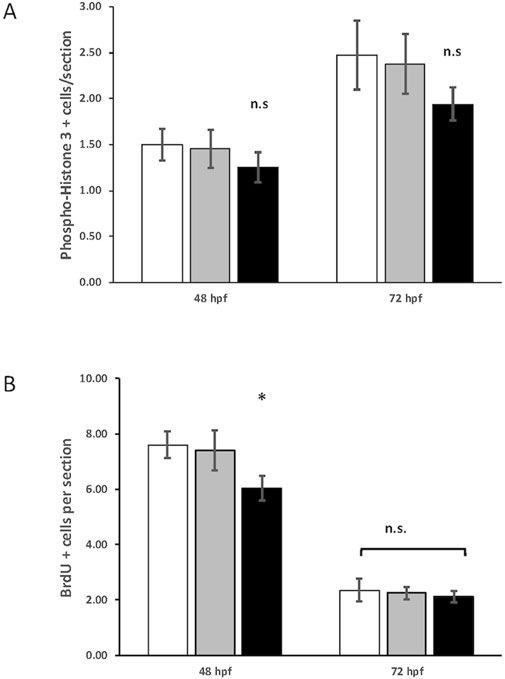
Figure 7. Quantification of phospho-histone H3 and 5-bromo-2′-deoxyuridine (BrdU) staining in control, heterozygous crim1+/−, and crim1−/− larvae that are homozygous for a 2 base pair deletion, c.339_340delCT p.Leu112Leufs*3, at 48 and 72 h post fertilization (hpf). (A) The quantification of the PH3 antibody showed no significant difference between control, heterozygous crim1+/−, and crim1−/− larvae. A total of 14 control larvae were scored, 11 crim1+/− larvae were scored, and 8 crim1−/− larvae were scored at 48 hpf. A total of 19 control larvae, 8 crim1+/− larvae, and 17 crim1−/− larvae were scored at 72 hpf. (B) The quantification of the BrdU antibody showed a significant reduction in BrdU staining in the homozygous crim1−/− larvae compared to control and heterozygous crim1+/− larvae at 48 hpf (P = 0.013) but not at 72 hpf. A total of eight control larvae were scored, three crim1+/− larvae were scored, and seven crim1−/− larvae were scored at 48 hpf. A total of five control larvae, five crim1+/− larvae, and five crim1−/− larvae were scored at 72 hpf.
Bulk RNA-seq comparing gene expression between crim1−/− larvae and controls shows the downregulation of clic4 and the upregulation of fgf1b
A three-dimensional PCA plot confirmed the separation of gene expression in the crim1−/− samples compared to the control samples (Figure 8A). There were 223 genes that were significantly dysregulated (adjusted P-value < 0.05), with 109 upregulated genes and 114 downregulated genes (Supplementary Table S7). A heatmap showing the separation of the DEGs in control and crim1−/− larvae is shown in Figure 8C, and a volcano plot showing the distribution of dysregulated genes is shown in Figure 8B. The top 16 downregulated and upregulated DEGs and transcripts from the bulk RNA-seq experiments comparing gene expression from crim1−/− larval eyes with those of controls at 72 hpf are shown in Table 2. crim1 expression was downregulated in the crim1−/− larvae compared to controls with an adjusted P-value of 1.72e−11 (Table 2), consistent with the predicted decrease in crim1 expression after CRISPR targeting of this gene. This result was confirmed with RT-qPCR at 24, 48, and 72 hpf (see Figure 9A; P-value = 0.04; Supplementary Figure S3). Chloride intracellular channel 4 (clic4) was the most significantly downregulated gene, with an adjusted P-value of 2.77e−41 (Table 2). RT-qPCR also confirmed reduced expression for this gene in RNA from crim1−/− mutant eyes compared to controls (P-value = 0.02; Figure 9A). IHC revealed mildly reduced expression of clic4 in the lens at the same timepoint (Supplementary Figure S4), but expression of this gene was still detectable in the crim1−/− mutant lenses.
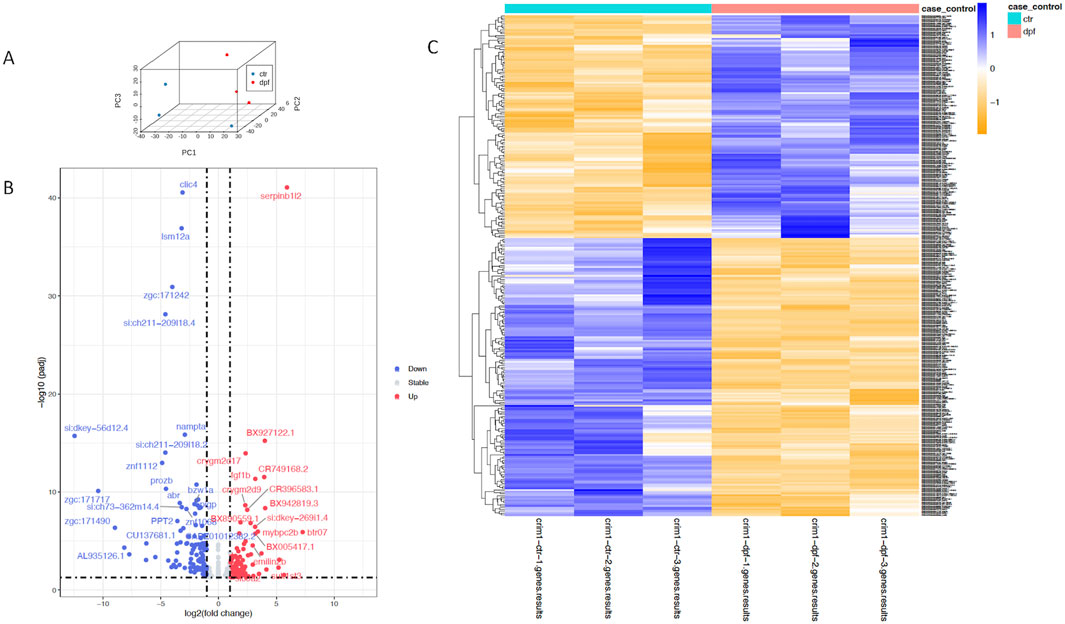
Figure 8. Principal component analysis, heatmap, and volcano plot showing DEGs for controls and crim1−/− larvae. Data from DEGs with adjusted P-values </ = 0.05 and an absolute (log2foldchange) >/ = 1 were used to generate the plots. (A) Three-dimensional PCA plot showing the separation of samples from control larval eyes (blue dots) compared to samples from crim1−/− larval eyes (red dots). (B) Volcano plot showing differential gene expression for crim1−/− mutant larvae and controls. The log2 fold change indicates the mean expression level for each gene. Each dot represents one gene. Selected genes with an adjusted P-value </ = 0.01 and absolute (log2foldchange) >/ = 2 have been named. Downregulated genes are shown in blue and upregulated genes are shown in red. (C) Heatmap of expressed genes in crim1−/− larvae and controls, showing separation of gene expression between control and crim1−/− mutant larvae. The type of sample (control or crim1−/− mutant) is listed on the X axis and the Y axis contains DEGs.
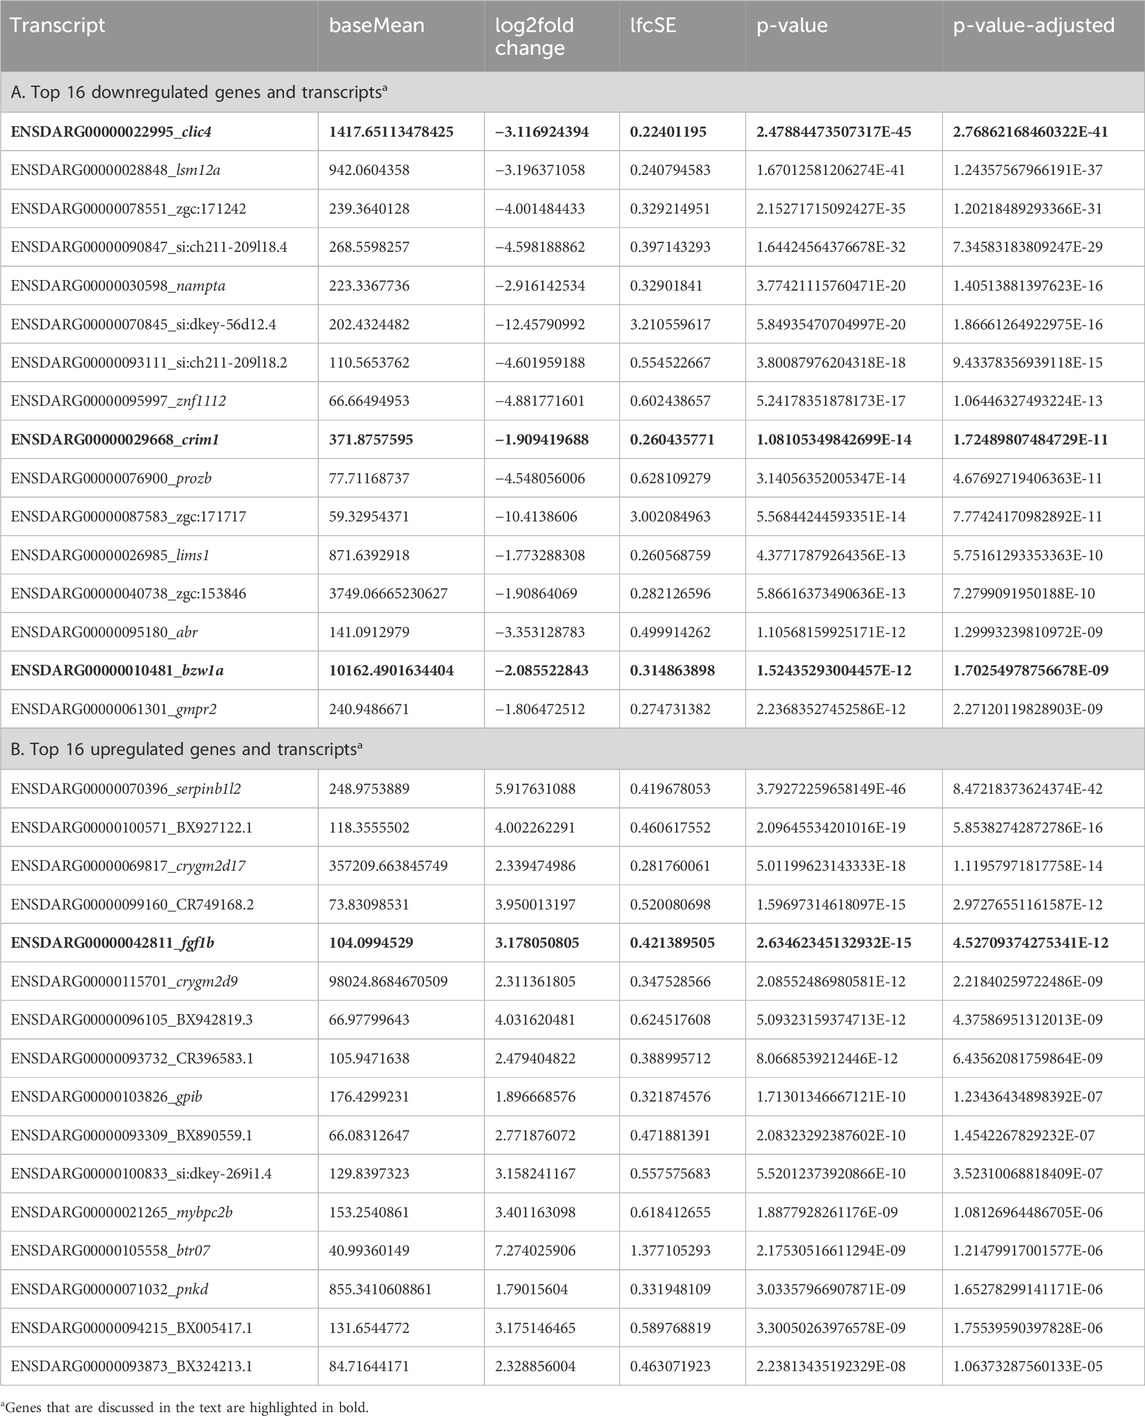
Table 2. ‘Bulk’ RNA-seq data comparing gene expression in pooled eyes from crim1−/− larvae and controls at 72 h post fertilization.
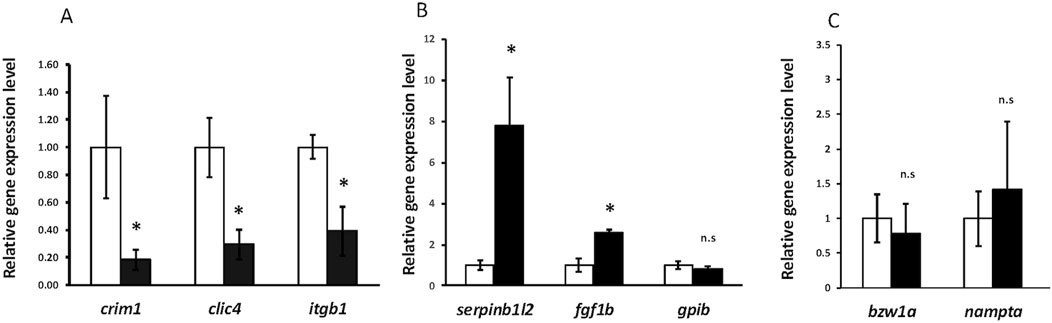
Figure 9. RT-qPCR showing significant downregulation of crim1, clic4, and itgb1 and significant upregulation of serpinb1l2 and fgf1b. (A) RT-qPCR showing expression of crim1, clic4, and itgb1 in crim1−/− larvae compared to controls. RT-qPCR was performed on dissected eyes for all experiments from control (white columns; expression normalized to 1.0) and crim1−/− larvae (black columns) at 72 hpf. The results show significantly reduced expression of crim1 (P = 0.04), clic4 (P = 0.02), and itgb1 (P = 0.02) in crim1−/− larvae compared to controls. (B) RT-qPCR showing expression of serpinb1l2, fgf1b, and gpib in crim1−/− larvae compared to controls. The results show significantly increased expression of serpinb1l2 (P = 0.02) and fgf1b (P = 0.02) but not gpib (P = 0.25) in crim1−/− larvae compared to controls. (C) RT-qPCR showing expression of bzw1a and nampta in crim1−/− larvae compared to controls. The results do not show significantly reduced expression for bzw1a (P = 0.4) or nampta (P = 0.16) in crim1−/− larvae compared to controls.
Crim1 recruits and co-localizes with β1-integrin at the plasma membrane and is involved in integrin recycling and β1-integrin-dependent cell adhesion (Argenzio et al., 2014). We, therefore, performed RT-qPCR to measure the expression of itgb1 encoding β1-integrin in the crim1−/− mutant eyes compared to controls. We observed significant downregulation of itgb1 (P-value = 0.02; Figure 9A). We considered a model in which the reduced clic4 expression observed in the crim1−/− larvae disrupts integrin-mediated cell interactions and investigated whether Crim1 can directly bind to Clic4. Immunoprecipitation showed a faint band at the expected size (29 kDa) in a lysate obtained from whole larval heads from controls at 72 hpf incubated with the recombinant Crim1 antibody and using the anti-Clic4 antibody for Western blotting (Supplementary Figure S5). However, the polyclonal nature of the Clic4 antibody resulted in non-specific bands, and our results do not demonstrate a definite interaction. We could not identify a suitable antibody for itgb1 to verify interactions between itgb1 and Clic4 or Crim1 (data not shown). There are multiple itgb1 homologs in zebrafish including integrin beta 1a (itgb1a), integrin beta 1b (itgb1b), integrin beta 1b.1 (itgb1b.1), and integrin beta 1b.2 (itgb1b.2; Mould et al., 2006; Wang et al., 2014). The Danio rerio genes itgb1a and itgb1b are closely homologous to integrin beta1 subunits present in other vertebrates, but itgb1b.1 and itgb1b.2 are unconventional beta1 subunits that have not yet been described in other vertebrate species (Wang et al., 2014).
Our bulk RNA-seq results also showed significant upregulation of fgf1b, with an adjusted P-value of 4.53e−12 (Table 2). The upregulation of this gene was confirmed by RT-qPCR (P-value = 0.023; Figure 9B). IHC using an antibody for Fgf1 supported the increased expression of fgf1b in the crim1−/− mutant lenses, with the distribution of signal throughout the lens rather than confined to the exterior of the lens (Supplementary Figure S6). However, it is also possible that this antibody would also detect fgf1a. Additional upregulated genes included serpinb1l2, with an adjusted P-value of 8.47e−42 (Table 1B). RT-qPCR confirmed significantly increased expression for serpinb1l2 (P-value = 0.02) in the crim1−/− mutant eyes compared to controls but did not confirm significance for the other upregulated genes, such as gpib, bzw1a, and nampta (Figures 9B, C). We also examined c1q expression in our bulk RNA-seq data in light of results demonstrating the dysregulation of complement genes in HZ mice with a hypomorphic Crim1 allele compared to heterozygotes (Crim1glcr11; GEO GSE62561 dataset; Zhang et al., 2023). c1q was significantly upregulated in our bulk RNA-seq data (P = 0.03; Supplementary Table S7). We, therefore, determined to verify this RNA-seq result using RT-qPCR (Figure 10) and an ELISA (Supplementary Figure S7). The RT-qPCR showed significant upregulation of c1qb (Figure 10; P = 0.018) and downregulation of c1qc (P = 0.003) and cd74b (P = 0.032). The expression of c1qa (P = 0.154) and cd74a (P = 0.391) was not significantly different. The ELISA results did not demonstrate significant dysregulation of the C1q protein in the crim1−/− larvae (Supplementary Figure S7). For the Gene Ontology (GO) analysis (Supplementary Figure S8), a false discovery rate (FDR) P-value of <0.05 was used to determine significance. Only the category ‘molecular functions’ among the three categories of GO analysis (biological processes, cellular locations, and molecular functions) had significant results (FDR < 0.05). One of the significant results under this category was the ‘structural constituent of the eye lens’ (FDR was 1.27 E-02).
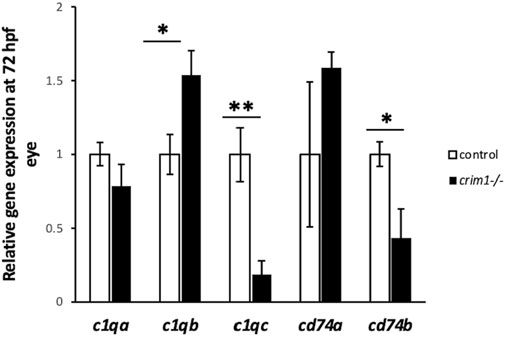
Figure 10. c1q levels measured by RT-qPCR in control and crim1−/− larvae that are homozygous for a 2 base pair deletion, c.339_340delCT p.Leu112Leufs*3, at 72 h post fertilization (hpf). RT-qPCR showing expression of c1qa, c1qb, c1qc, cd74a, and cd74b in crim1−/− larvae compared to controls. RT-qPCR was performed on dissected eyes for all experiments from control (white columns; expression normalized to 1.0) and crim1−/− larvae (black columns) at 72 hpf. The results show significantly increased expression of c1qb (P = 0.018) and significantly reduced expression of c1qc (P = 0.003) and cd74b (P = 0.032) in crim1−/− larvae compared to controls. c1qa (P = 0.154) and cd74a (P = 0.391) expression was not significantly different.
crim1−/− larvae demonstrate increased apoptosis compared to controls
Finally, we reasoned that the reduction in eye size could be associated with an increase in apoptosis in the lenses and eyes of the crim1−/− larvae. Examination and quantification of apoptotic cells using cleaved caspase-3 by IHC at 24, 30, 48, and 72 hpf demonstrated a significant increase in cleaved caspase-3 cells at 24 and 72 hpf but not at 30 and 48 hpf in crim1−/− larvae compared to controls (Supplementary Figures S9A, B). We also performed a TUNEL assay at 48 and 72 hpf and found no significant difference between the control and crim1−/− larvae (data not shown).
Discussion
We present three new patients with heterozygous deletions and truncating variants predicting haploinsufficiency for CRIM1. We report the first truncating variant (c.2701delC p.Leu901Cys*22) in CRIM1 in a father and son with glaucoma and optic disc pallor (patients 2 and 3; Table 1; Supplementary Table S6), strengthening the association between these ocular anomalies and haploinsufficiency for CRIM1. Other ocular findings included colobomas, cataracts, microcornea, cornea plana, and retinal detachment that caused reduced visual acuity with myopia, temporal visual field loss, and an afferent pupillary defect (Table 1). Haploinsufficiency for CRIM1 has previously been associated with MACOM syndrome (Toker et al., 2003; Beleggia et al., 2015; Haug et al., 2021), but pathogenic deletions involving this gene remain rare. When the clinical data from the three new patients in this paper are examined with the 11 patients described by Toker et al. (2003) and Beleggia et al. (2015) and with the three patients reported by Haug et al. (2021), no patient had significant growth or developmental concerns (Supplementary Table S6). These findings suggest that CRIM1 haploinsufficiency is likely to be associated with a variable phenotype that can include both macrophthalmia and microphthalmia.
We generated crim1−/− mutant zebrafish larvae with reduced crim1 function due to a 2bp deletion in exon 2 and observed small eyes with small and misshapen lenses compared to controls (Figures 3, 4). In addition, we observed shortening of the bodies and increased body curvature in the crim1−/− larvae; in particular, body length appeared to be more affected than eye size (Figure 2D). These findings are consistent with previously reported MO models of reduced crim1 function (Supplementary Table S2; Kinna et al., 2006; Brastrom et al., 2019). The ratio of eye size to head size was also increased in the crim1−/− larvae at 2 dpf, which may resemble the macrophthalmia described in MACOM (Figure 2E). Our model has strengths as we successfully bred HZ adult fish, but not all crim1−/− larvae were affected, and the ocular phenotype was not fully penetrant (for example, Figures 1A, 4C). Although haploinsufficiency is sufficient to cause a phenotype in patients, we did not observe eye or body malformations in heterozygous crim1+/− larvae, and it is possible that there are differences in genetic compensation for different species for reduced crim1 function.
The eye findings in the crim1−/− larvae also resembled those observed in mouse models of Crim1 loss of function, which have been considered useful models for the structural eye defects observed in patients with CRIM1 haploinsufficiency. However, although congenital cataracts have been observed in Crim1 conditional and null mutant mouse models (Pennisi et al., 2007; Chiu et al., 2012; Beleggia et al., 2015; Tam et al., 2018), they have not yet been observed in patients. We observed smaller lenses with an irregular external appearance in crim1−/− larvae. The variation in the eye defects in the different species might reflect differences in ocular development, in modifying alleles, or in CRIM1/Crim1/crim1 expression and function. We also did not model the variant detected in two of the patients. Finally, we examined the crim1−/− larvae at 72 hpf, and it is also possible that lens opacities will become more visible in the crim1−/− larvae with increasing age.
Lens growth is characterized by epithelial cell proliferation in the germinative zone, a narrow cellular region that rings the lens epithelium toward the periphery of the anterior lens surface (Remington and Meyer, 2007). The LE cells then differentiate into secondary lens fibers in the transitional zone, undergoing cellular elongation, loss of nuclei and organelles, and synthesis of lens fiber-specific proteins, such as β- and γ-crystallins (Lovicu and McAvoy, 2005). Crim1 is critical for the maintenance of the lens epithelium, which was anteriorly restricted in murine Crim1 larvae due to early differentiation of the LE cells into LF cells (Tam et al., 2018). Murine Crim1glcr11, Crim1null, and Crim1cko mutants demonstrated reduced numbers of LE cells, with defective polarity and proliferation (Supplementary Table S1; Beleggia et al., 2015; Zhang et al., 2016; Tam et al., 2018). Crim1 function is also required for cell adhesion between LE cells and between LE and LF cells (Zhang et al., 2016). Our data also support reduced proliferation and numbers of LE cells in the smaller lens sizes of the crim1−/− larvae.
The results of our RNA-seq experiments showed clic4 as achieving the greatest significance among the downregulated genes (Table 2). Human CLIC4 encodes a 253 amino acid protein that belongs to the six-member, mammalian CLIC family (CLIC1–6) of globular proteins that are involved in gene regulation and signal transduction, cell adhesion and migration, and membrane remodeling (He et al., 2011; Argenzio et al., 2014; Argenzio and Innocenti, 2020; Chuang et al., 2022; Olotu et al., 2022). CLIC4 is present in the cytosol or on intracellular organelles (Gururaja Rao et al., 2018), but in the presence of activators, it can translocate to lipid rafts in the plasma membrane where it interacts with ezrin–radixin–moesin (ERM) proteins that connect the membrane proteins with the actin cytoskeleton (Argenzio et al., 2018; Olotu et al., 2022). Crim1 localized to the sites of actin cytoskeleton remodeling at the leading edge of cell protrusions and regulated the level of β1 integrin and focal adhesion kinase (FAK) and the extracellular signal-regulated kinase (ERK) signaling in LE cells (Iyer et al., 2016; Zhang et al., 2016). The interaction between Crim1 and integrins at the lateral surfaces of LE cells provides a mechanism for cell adhesion between LE cells and may be relevant to eye defects, including coloboma. Experiments crossing postnatal day (P)0–3.9-GFPCre;Crim1flox/flox and Itgb1flox/flox mice showed that 1 out of 4 GFPCre;Crim1flox/+;Itgb1flox/+ mice displayed iris coloboma and 6/6 P21 compound heterozygotes exhibited bilateral cataracts compared to none of the four littermate controls (Zhang et al., 2016). Immunostaining of the lenses in the compound heterozygous GFPCre;Crim1flox/+;Itgb1flox/+ mice showed the detachment of the LE cells from the LF cells (Zhang et al., 2016). An LE cell line was also found to have high expression of ITGB1 (Weatherbee et al., 2019) and a mouse mutant for Itgb1 exhibited loss of LE cells (Simirskii et al., 2007). It is also notable that beta1-integrin signaling is essential for lens fiber survival (Samuelsson et al., 2007).
We hypothesized that the downregulated clic4 expression in the crim1−/− larvae could disrupt integrin-mediated cell interactions and that Crim1, Clic4, and Itgb1 would co-localize at sites of LE/LF cell adhesion. We used IP to investigate whether Crim1 could bind directly to Clic4 but failed to demonstrate a convincing interaction. Interestingly, Clic4 is enriched in the proximal tubule epithelial cells of the kidney, and Clic4-null murine embryos have impaired renal tubulogenesis (Chou et al., 2016). It is plausible that the reduction in clic4 observed in our model may be relevant to the renal defects observed in one of the patients.
The bulk RNA-seq data also showed significant upregulation of fgf1b, with an adjusted P-value of 4.53 × 10⁻¹² (Table 2), and increased expression of this gene was also confirmed by RT-qPCR (Figure 9B; P = 0.022). Lens growth is known to be regulated by genes from the FGF family (Lovicu et al., 1997; Lovicu and McAvoy, 2005; McAvoy et al., 2017), and Fgf1 has been shown to promote LE cell proliferation and fiber differentiation in explant experiments (McAvoy and Chamberlain, 1989; Qu et al., 2011). In addition, transgenic mice overexpressing Fgf1 and Fgf2 in the lens exhibited abnormal lens growth and premature differentiation of the anterior LE cells (Robinson et al., 1995; Lovicu and Overbeek, 1998; Robinson et al., 1998). The upregulation of fgf1b could be consistent with the known role of crim1 in the maintenance of the anterior lens epithelium, with reduced crim1 leading to the upregulation of other genes with similar functions.
The basic leucine zipper domain- and W2 domain-containing protein 1 (BZW1) gene, known as BAZP45, KIAA0005, and 5MP2 (OMIM #619252), was also downregulated in the bulk RNA-Seq data (Table 2). This gene is a member of the superfamily of bZIP transcription factors and encodes a 419 amino acid protein with a basic, leucine-zipper domain located at the N-terminal end of the protein (Mitra et al., 2001). The overexpression of BZW1 promoted ATF4 expression in human cells, a protein that is part of the unfolded protein response (UPR) activation (Kozel et al., 2016). The UPR is active in LF cell differentiation (Firtina and Duncan, 2011), and the ectopic expression of atf4 in Xenopus embryos suppressed eye formation, suggesting that tightly controlled Atf4 activity is critical for early eye patterning (Liu et al., 2011). However, our RT-qPCR results did not confirm significant dysregulation of bzw1 (Figure 9C). The most significant upregulated gene was serpinb1l2, with an adjusted P-value of 8.47 × 10−42 (Table 2), but we could not find an exact match to an orthologous zebrafish gene in the ZFIN database.
We also considered a prior study examining murine gene expression data at postnatal day (P) 60 comparing HZ mice with a hypomorphic Crim1 allele (Crim1glcr11; GEO GSE62561 dataset) and using heterozygous mice as controls (Zhang et al., 2023). The previous study showed 750 DEGs, comprising 407 genes with increased expression and 343 genes with reduced expression (Zhang et al., 2023). GO analysis showed that the DEGs were primarily connected with the immune system and involved activities such as antigen processing and presentation, apoptosis, and cell translation (Zhang et al., 2023). C1qa, C1qb, C1qc, and Cd74 exhibited the highest degrees of altered expression (Zhang et al., 2023). Conditional knock-out mice with a Clic4-null allele in the retinal pigment epithelium (RPE∆Clic4 mice) develop the clinical, histological, and functional hallmarks of dry age-related macular degeneration (Chuang et al., 2022), and complement is also known to play an important role in the pathogenesis of age-related macular degeneration (Fritsche et al., 2010). Our bulk RNA-seq results did show significant upregulation of c1q (P = 0.03) in the crim1−/− mutant larvae, but, apart from c1qb, we could not confirm the upregulation of complement-associated genes by RT-qPCR or ELISA. The different results may be explained by the selection of different tissues, variation in experimental timing, and variation between mRNA and protein levels.
Conclusion
We present three new patients with ocular findings, including retinal coloboma, optic disc pallor, and glaucoma, associated with gene deletions and truncating variants in CRIM1. The clinical features observed in these individuals support a broader ocular phenotype associated with CRIM1 haploinsufficiency. We generated a zebrafish model of crim1 deficiency, in which homozygous crim1−/− mutant larvae had smaller eyes and lenses compared to controls, resembling prior MO models of reduced crim1 expression. Bulk RNA-seq showed significant downregulation of clic4 expression that may perturb β-integrin-mediated cell adhesion, but we could not demonstrate an interaction between Crim1 and Clic4. Our work supports the association between CRIM1 haploinsufficiency and eye defects and has developed a stable crim1 loss-of-function model for future research.
Data availability statement
The data presented in this study are deposited to the GEO repository, accession number GSE289562.
Ethics statement
The studies involving humans were approved by the Institutional Review Board, National Institutes of Health. The studies were conducted in accordance with the local legislation and institutional requirements. Written informed consent for participation in this study was provided by the participants’ legal guardians/next of kin. The animal study was approved by IACUC, Cincinnati Children’s Hospital Medical Center, and IACUC, University of California, San Francisco. The study was conducted in accordance with the local legislation and institutional requirements. Written informed consent was obtained from the minor(s)’ legal guardian/next of kin for the publication of any potentially identifiable images or data included in this article.
Author contributions
TL: Formal Analysis, Investigation, Methodology, Writing–original draft, Writing–review and editing. SH: Formal Analysis, Investigation, Writing–original draft, Writing–review and editing. MP: Formal Analysis, Investigation, Methodology, Supervision, Writing–original draft, Writing–review and editing. YS: Formal Analysis, Investigation, Methodology, Writing–original draft, Writing–review and editing. AM: Formal Analysis, Investigation, Methodology, Writing–original draft, Writing–review and editing. EU: Investigation, Writing–original draft, Writing–review and editing. JL: Investigation, Resources, Writing–original draft, Writing–review and editing. SB: Data curation, Investigation, Resources, Writing–original draft, Writing–review and editing. CL: Data curation, Investigation, Resources, Writing–original draft, Writing–review and editing. BG: Investigation, Resources, Writing–original draft, Writing–review and editing. RH: Investigation, Resources, Supervision, Writing–original draft, Writing–review and editing. BB: Investigation, Resources, Supervision, Writing–original draft, Writing–review and editing. SEB: Data curation, Formal Analysis, Investigation, Writing–original draft, Writing–review and editing. AS: Conceptualization, Data curation, Funding acquisition, Investigation, Resources, Supervision, Writing–original draft, Writing–review and editing.
Funding
The author(s) declare that financial support was received for the research, authorship, and publication of this article. This work was supported by grants 1R01 EY032976 and 1R01 EY035500 from the National Eye Institute, National Institutes of Health, to Anne Slavotinek.
Conflict of interest
The authors declare that the research was conducted in the absence of any commercial or financial relationships that could be construed as a potential conflict of interest.
Generative AI statement
The author(s) declare that no Generative AI was used in the creation of this manuscript.
Publisher’s note
All claims expressed in this article are solely those of the authors and do not necessarily represent those of their affiliated organizations, or those of the publisher, the editors and the reviewers. Any product that may be evaluated in this article, or claim that may be made by its manufacturer, is not guaranteed or endorsed by the publisher.
Supplementary material
The Supplementary Material for this article can be found online at: https://www.frontiersin.org/articles/10.3389/fcell.2025.1522094/full#supplementary-material
SUPPLEMENTARY FIGURE S1 | Chromatograms showing tracings from wildtype, heterozygous, and homozygous crim1−/− larvae with a 2 base pair deletion, c.339_340delCT p.Leu112Leufs*3 (NM_212821.1) in crim1. (A) Chromatogram from wild-type larva. (B) Chromatogram from heterozygous crim1−/+ larva. (C) Chromatogram from homozygous crim1−/− larva.
SUPPLEMENTARY FIGURE S2 | Immunohistochemistry with zn-5 in control and crim1−/− larvae that are homozygous for a 2 base pair deletion, c.339_340delCT p.Leu112Leufs*3 in crim1, at 72 h post fertilization (hpf). (A, B) Two or three measurements were taken from at least three control and crim1−/− larvae and quantified by measuring the width of the white lines. Supplementary Figure S2C. The results show a significant increase in the width of the retinal ganglion cell layer (stained in green) in crim1−/− larvae compared to controls (P = 0.00034).
SUPPLEMENTARY FIGURE S3 | Time course of crim1 expression in control and crim1−/− larvae that are homozygous for a 2 base pair deletion, c.339_340delCT p.Leu112Leufs*3 in crim1, at 24, 48, and 72 h post fertilization (hpf). RT-qPCR showing the expression of crim1 in crim1−/− larvae compared to controls. RT-qPCR was performed on dissected eyes for all experiments from control (white columns; expression normalized to 1.0) and crim1−/− larvae (black columns) at 24, 48, and 72 hpf. The results show significantly reduced expression of crim1 (P = 0.0164 at 24 hpf, P = 0.0077 at 48 hpf, and P = 0.0122 at 72 hpf) in crim1−/− larvae compared to controls.
SUPPLEMENTARY FIGURE S4 | Immunohistochemistry with Clic4 in control and crim1−/− larvae that are homozygous for a 2 base pair deletion, c.339_340delCT p.Leu112Leufs*3 in crim1, at 72 h post fertilization (hpf). Representative sections of eyes from control larvae (A, B) and crim1−/− larvae (C, D) at 72 hpf. The first two panels (A, C) were negative sections without antibodies, and the second two panels (B, D) were stained with an antibody against Clic4. There is a mild reduction in clic4 expression in crim1−/− larvae compared to control larvae, but this expression is still present in the crim1−/− mutant larvae.
SUPPLEMENTARY FIGURE S5 | Lysate from whole larval heads at 72 hpf incubated with the recombinant anti-crim1 antibody for immunoprecipitation, followed by Western blotting using the anti-clic4 antibody. A faint band can be observed at 29 kDa, the expected size, but there are other more intense bands.
SUPPLEMENTARY FIGURE S6 | Immunohistochemistry using an antibody to Fgf1 in control and crim1−/− larvae that are homozygous for a 2 base pair deletion, c.339_340delCT p.Leu112Leufs*3 at 48 h post fertilization (hpf). Representative sections of eyes from control larvae (A, B) and crim1−/− larvae (C, D). There is an increase in fgf1 staining in the smaller and irregular lenses in the crim1−/− larvae compared to control larvae.
SUPPLEMENTARY FIGURE S7 | C1q levels measured with an ELISA in control and crim1−/− larvae that are homozygous for a 2 base pair deletion, c.339_340delCT p.Leu112Leufs*3, at 12, 24, 48, and 72 h post fertilization (hpf). Mean C1q levels, measured in µg/mL using an ELISA, in control larvae are indicated by the white columns, and mean C1q levels in the crim1−/− mutant larvae are indicated by the black columns. There is no significant difference (n.s.) between the C1q levels in controls and crim1−/− mutant larvae at any time period.
SUPPLEMENTARY FIGURE S8 | GO analysis shown as a bar plot using Ensembl gene identities of DEGs. A false discovery rate P-value of <0.05 was used to determine significance. Only the category ‘molecular functions’ among the three categories of GO analysis (biological processes, cellular locations, and molecular functions) had significant results (FDR < 0.05). In this category, the ‘structural constituent of the eye lens’, achieved significance (FDR was 1.27E-02).
SUPPLEMENTARY FIGURE S9 | Immunohistochemistry with cleaved caspase-3 in control and crim1−/− larvae that are homozygous for a 2 base pair deletion, c.339_340delCT p.Leu112Leufs*3 at 24 and 30 h post fertilization (hpf). (A) Representative sections of eyes from control larvae ((A, B) at 24 hpf and (E, F) at 30 hpf) and crim1−/− larvae ((C, D) at 24 hpf and (G, H) at 30 hpf). Increased staining can be observed throughout the lenses of the crim1−/− mutant larvae, compared to reduced staining localized to the anterior portion of the lens in controls. (B) Quantification of cleaved caspase-3/nuclei in control and crim1−/− larvae that are homozygous for a 2 base pair deletion, c.339_340delCT p.Leu112Leufs*3, at 24, 30, 48, and 72 h post fertilization (hpf). Control results are represented by white columns, and crim1−/− larvae results are represented by black columns. There is a statistically significant difference between control and crim1−/− larvae at 24 and 72 hpf.
References
Argenzio, E., and Innocenti, M. (2020). The chloride intracellular channel protein CLIC4 inhibits filopodium formation induced by constitutively active mutants of formin mDia2. FEBS Lett. 594 (11), 1750–1758. doi:10.1002/1873-3468.13766
Argenzio, E., Klarenbeek, J., Kedziora, K. M., Nahidiazar, L., Isogai, T., Perrakis, A., et al. (2018). Profilin binding couples chloride intracellular channel protein CLIC4 to RhoA-mDia2 signaling and filopodium formation. J. Biol. Chem. 293 (50), 19161–19176. doi:10.1074/jbc.RA118.002779
Argenzio, E., Margadant, C., Leyton-Puig, D., Janssen, H., Jalink, K., Sonnenberg, A., et al. (2014). CLIC4 regulates cell adhesion and β1 integrin trafficking. J. Cell Sci. 127 (Pt 24), 5189–5203. doi:10.1242/jcs.150623
Bateman, J. B., and Maumenee, I. H. (1984). Colobomatous macrophthalmia with microcornea. Ophthalmic Paediatr. Genet. 4, 59–66. doi:10.3109/13816818409007839
Beleggia, F., Li, Y., Fan, J., Elcioğlu, N. H., Toker, E., Wieland, T., et al. (2015). CRIM1 haploinsufficiency causes defects in eye development in human and mouse. Hum. Mol. Genet. 24 (8), 2267–2273. doi:10.1093/hmg/ddu744
Brastrom, L. K., Scott, C. A., Dawson, D. V., and Slusarski, D. C. (2019). A high-throughput assay for congenital and age-related eye diseases in zebrafish. Biomedicines 7 (2), 28. doi:10.3390/biomedicines7020028
Chen, S., Francioli, L. C., Goodrich, J. K., Collins, R. L., Kanai, M., Wang, Q., et al. (2024). A genomic mutational constraint map using variation in 76,156 human genomes. Nature 625, 92–100. doi:10.1038/s41586-023-06045-0
Chiu, H. S., York, J. P., Wilkinson, L., Zhang, P., Little, M. H., and Pennisi, D. J. (2012). Production of a mouse line with a conditional Crim1 mutant allele. Genesis 50 (9), 711–716. doi:10.1002/dvg.22032
Chou, S. Y., Hsu, K. S., Otsu, W., Hsu, Y. C., Luo, Y. C., Yeh, C., et al. (2016). CLIC4 regulates apical exocytosis and renal tube luminogenesis through retromer- and actin-mediated endocytic trafficking. Nat. Commun. 7, 10412. doi:10.1038/ncomms10412
Chuang, J. Z., Yang, N., Nakajima, N., Otsu, W., Fu, C., Yang, H. H., et al. (2022). Retinal pigment epithelium-specific CLIC4 mutant is a mouse model of dry age-related macular degeneration. Nat. Commun. 13 (1), 374. doi:10.1038/s41467-021-27935-9
Elsalini, O. A., and Rohr, K. B. (2003). Phenylthiourea disrupts thyroid function in developing zebrafish. Dev. Genes Evol. 212 (12), 593–598. doi:10.1007/s00427-002-0279-3
Fan, J., Ponferrada, V. G., Sato, T., Vemaraju, S., Fruttiger, M., Gerhardt, H., et al. (2014). Crim1 maintains retinal vascular stability during development by regulating endothelial cell Vegfa autocrine signaling. Development 141, 448–459. doi:10.1242/dev.097949
Farrell, J. A., Wang, Y., Riesenfeld, S. J., Shekhar, K., Regev, A., and Schier, A. F. (2018). Single-cell reconstruction of developmental trajectories during zebrafish embryogenesis. Science 360 (6392), eaar3131. doi:10.1126/science.aar3131
Firtina, Z., and Duncan, M. K. (2011). Unfolded Protein Response (UPR) is activated during normal lens development. Gene Expr. Patterns 11 (1-2), 135–143. doi:10.1016/j.gep.2010.10.005
Fritsche, L. G., Lauer, N., Hartmann, A., Stippa, S., Keilhauer, C. N., Oppermann, M., et al. (2010). An imbalance of human complement regulatory proteins CFHR1, CFHR3 and factor H influences risk for age-related macular degeneration (AMD). Hum. Mol. Genet. 19 (23), 4694–4704. doi:10.1093/hmg/ddq399
Furuichi, T., Tsukamoto, M., Saito, M., Sato, Y., Oiji, N., Yagami, K., et al. (2019). Crim1C140Smutant mice reveal the importance of cysteine 140 in the internal region 1 of CRIM1 for its physiological functions. Mamm. Genome 30 (11-12), 329–338. doi:10.1007/s00335-019-09822-3
Glienke, J., Sturz, A., Menrad, A., and Thierauch, K. H. (2002). CRIM1 is involved in endothelial cell capillary formation in vitro and is expressed in blood vessels in vivo. Mech. Dev. 119 (2), 165–175. doi:10.1016/s0925-4773(02)00355-6
Greiling, T. M., Aose, M., and Clark, J. I. (2010). Cell fate and differentiation of the developing ocular lens. Invest Ophthalmol. Vis. Sci. 51, 1540–1546. doi:10.1167/iovs.09-4388
Gururaja Rao, S., Ponnalagu, D., Patel, N. J., and Singh, H. (2018). Three decades of chloride intracellular channel proteins: from organelle to organ physiology. Curr. Protoc. Pharmacol. 80 (1), 11.21.1–11. doi:10.1002/cpph.36
Haug, P., Koller, S., Maggi, J., Lang, E., Feil, S., Wlodarczyk, A., et al. (2021). Whole exome sequencing in coloboma/microphthalmia: identification of novel and recurrent variants in seven genes. Genes (Basel) 12 (1), 65. doi:10.3390/genes12010065
He, G., Ma, Y., Chou, S. Y., Li, H., Yang, C., Chuang, J. Z., et al. (2011). Role of CLIC4 in the host innate responses to bacterial lipopolysaccharide. Eur. J. Immunol. 41 (5), 1221–1230. doi:10.1002/eji.201041266
Iyer, S., Pennisi, D. J., and Piper, M. (2016). Crim1-a regulator of developmental organogenesis. Histol. Histopathol. 31 (10), 1049–1057. doi:10.14670/HH-11-766
Janssens, E., Gaublomme, D., De Groef, L., Darras, V. M., Arckens, L., Delorme, N., et al. (2013). Matrix metalloproteinase 14 in the zebrafish: an eye on retinal and retinotectal development. PLoS One 8 (1), e52915. doi:10.1371/journal.pone.0052915
Kinna, G., Kolle, G., Carter, A., Key, B., Lieschke, G. J., Perkins, A., et al. (2006). Knockdown of zebrafish crim1 results in a bent tail phenotype with defects in somite and vascular development. Mech. Dev. 123 (4), 277–287. doi:10.1016/j.mod.2006.01.003
Kolle, G., Georgas, K., Holmes, G. P., Little, M. H., and Yamada, T. (2000). CRIM1, a novel gene encoding a cysteine-rich repeat protein, is developmentally regulated and implicated in vertebrate CNS development and organogenesis. Mech. Dev. 90 (2), 181–193. doi:10.1016/s0925-4773(99)00248-8
Kolle, G., Jansen, A., Yamada, T., and Little, M. (2003). In ovo electroporation of Crim1 in the developing chick spinal cord. Dev. Dyn. 226 (1), 107–111. doi:10.1002/dvdy.10204
Kozel, C., Thompson, B., Hustak, S., Moore, C., Nakashima, A., Singh, C. R., et al. (2016). Overexpression of eIF5 or its protein mimic 5MP perturbs eIF2 function and induces ATF4 translation through delayed re-initiation. Nucleic Acids Res. 44 (18), 8704–8713. doi:10.1093/nar/gkw559
Krall, M., Htun, S., Anand, D., Hart, D., Lachke, S. A., and Slavotinek, A. M. (2018). A zebrafish model of foxe3 deficiency demonstrates lens and eye defects with dysregulation of key genes involved in cataract formation in humans. Hum. Genet. 137, 315–328. doi:10.1007/s00439-018-1884-1
Liu, J. T., Yang, Y., Guo, X. G., Chen, M., Ding, H. Z., Chen, Y. L., et al. (2011). Over-expression of atf4 in Xenopus embryos interferes with neurogenesis and eye formation. Dongwuxue Yanjiu 32 (5), 485–491. doi:10.3724/SP.J.1141.2011.05485
Lovicu, F. J., de Iongh, R. U., and McAvoy, J. W. (1997). Expression of FGF-1 and FGF-2 mRNA during lens morphogenesis, differentiation and growth. Curr. Eye Res. 16 (3), 222–230. doi:10.1076/ceyr.16.3.222.15408
Lovicu, F. J., Kolle, G., Yamada, T., Little, M. H., and McAvoy, J. W. (2000). Expression of Crim1 during murine ocular development. Mech. Dev. 94 (1-2), 261–265. doi:10.1016/s0925-4773(00)00292-6
Lovicu, F. J., and McAvoy, J. W. (2005). Growth factor regulation of lens development. Dev. Biol. 280 (1), 1–14. doi:10.1016/j.ydbio.2005.01.020
Lovicu, F. J., and Overbeek, P. A. (1998). Overlapping effects of different members of the FGF family on lens fiber differentiation in transgenic mice. Development 125 (17), 3365–3377. doi:10.1242/dev.125.17.3365
Mazzolini, J., Chia, K., Sieger, D., and Isolation, (2018). Isolation and RNA extraction of neurons, macrophages and microglia from larval zebrafish brains. J. Vis. Exp. (134), 57431. doi:10.3791/57431
McAvoy, J. W., and Chamberlain, C. G. (1989). Fibroblast growth factor (FGF) induces different responses in lens epithelial cells depending on its concentration. Development 107 (2), 221–228. doi:10.1242/dev.107.2.221
McAvoy, J. W., Dawes, L. J., Sugiyama, Y., and Lovicu, F. J. (2017). Intrinsic and extrinsic regulatory mechanisms are required to form and maintain a lens of the correct size and shape. Exp. Eye Res. 156, 34–40. doi:10.1016/j.exer.2016.04.009
Michel, J. C., and Miller, A. C. (2023). Isolation of immunocomplexes from zebrafish brain. Bio Protoc. 13 (7), e4646. doi:10.21769/BioProtoc.4646
Mitra, P., Vaughan, P. S., Stein, J. L., Stein, G. S., and van Wijnen, A. J. (2001). Purification and functional analysis of a novel leucine-zipper/nucleotide-fold protein, BZAP45, stimulating cell cycle regulated histone H4 gene transcription. Biochemistry 40 (35), 10693–10699. doi:10.1021/bi010529o
Mould, A. P., McLeish, J. A., Huxley-Jones, J., Goonesinghe, A. C., Hurlstone, A. F., Boot-Handford, R. P., et al. (2006). Identification of multiple integrin beta1 homologs in zebrafish (Danio rerio). BMC Cell Biol. 7, 24. doi:10.1186/1471-2121-7-24
Olotu, F., Medina-Carmona, E., Serrano-Sanchez, A., Ossa, F., El-Hamdaoui, A., Bishop Öt, O.-R. J. L., et al. (2022). Structure-based discovery and in vitro validation of inhibitors of chloride intracellular channel 4 protein. Comput. Struct. Biotechnol. J. 21, 688–701. doi:10.1016/j.csbj.2022.12.040
Pennisi, D. J., Kinna, G., Chiu, H. S., Simmons, D. G., Wilkinson, L., and Little, M. H. (2012). Crim1 has an essential role in glycogen trophoblast cell and sinusoidal-trophoblast giant cell development in the placenta. Placenta 33 (3), 175–182. doi:10.1016/j.placenta.2011.12.014
Pennisi, D. J., Wilkinson, L., Kolle, G., Sohaskey, M. L., Gillinder, K., Piper, M. J., et al. (2007). Crim1KST264/KST264 mice display a disruption of the Crim1 gene resulting in perinatal lethality with defects in multiple organ systems. Dev. Dyn. 236 (2), 502–511. doi:10.1002/dvdy.21015
Phua, Y. L., Martel, N., Pennisi, D. J., Little, M. H., and Wilkinson, L. (2013). Distinct sites of renal fibrosis in Crim1 mutant mice arise from multiple cellular origins. J. Pathol. 229 (5), 685–696. doi:10.1002/path.4155
Qu, X., Hertzler, K., Pan, Y., Grobe, K., Robinson, M. L., and Zhang, X. (2011). Genetic epistasis between heparan sulfate and FGF-Ras signaling controls lens development. Dev. Biol. 355 (1), 12–20. doi:10.1016/j.ydbio.2011.04.007
Remington, S. G., and Meyer, R. A. (2007). Lens stem cells may reside outside the lens capsule: an hypothesis. Theor. Biol. Med. Model 4, 22. doi:10.1186/1742-4682-4-22
Robinson, M. L., Ohtaka-Maruyama, C., Chan, C. C., Jamieson, S., Dickson, C., Overbeek, P. A., et al. (1998). Disregulation of ocular morphogenesis by lens-specific expression of FGF-3/int-2 in transgenic mice. Dev. Biol. 198 (1), 13–31. doi:10.1006/dbio.1998.8879
Robinson, M. L., Overbeek, P. A., Verran, D. J., Grizzle, W. E., Stockard, C. R., Friesel, R., et al. (1995). Extracellular FGF-1 acts as a lens differentiation factor in transgenic mice. Development 121 (2), 505–514. doi:10.1242/dev.121.2.505
Samuelsson, A. R., Belvindrah, R., Wu, C., Müller, U., and Halfter, W. (2007). β1-Integrin signaling is essential for lens fiber survival. Gene Regul. Syst. Bio 1, 177–189. doi:10.1177/117762500700100016
Schwarz, J. M., Rödelsperger, C., Schuelke, M., and Seelow, D. (2010). MutationTaster evaluates disease-causing potential of sequence alterations. Nat. Methods 7, 575–576. doi:10.1038/nmeth0810-575
Simirskii, V. N., Wang, Y., and Duncan, M. K. (2007). Conditional deletion of beta1-integrin from the developing lens leads to loss of the lens epithelial phenotype. Dev. Biol. 306 (2), 658–668. doi:10.1016/j.ydbio.2007.04.004
Sobreira, N., Schiettecatte, F., Valle, D., and Hamosh, A. (2015). GeneMatcher: a matching tool for connecting investigators with an interest in the same gene. Hum. Mutat. 36 (10), 928–930. doi:10.1002/humu.22844
Sur, A., Wang, Y., Capar, P., Margolin, G., and Farrell, J. A. (2023). Single-cell analysis of shared signatures and transcriptional diversity during zebrafish development. bioRxiv 15, 533545. doi:10.1101/2023.03.20.533545
Talbot, J. C., and Amacher, S. L. (2014). A streamlined CRISPR pipeline to reliably generate zebrafish frameshifting alleles. Zebrafish 11, 583–585. doi:10.1089/zeb.2014.1047
Tam, O. H., Pennisi, D., Wilkinson, L., Little, M. H., Wazin, F., Wan, V. L., et al. (2018). Crim1 is required for maintenance of the ocular lens epithelium. Exp. Eye Res. 170, 58–66. doi:10.1016/j.exer.2018.02.012
Toker, E., Elcioglu, N., Ozcan, E., Yenice, O., and Ogut, M. (2003). Colobomatous macrophthalmia with microcornea syndrome: report of a new pedigree. Am. J. Med. Genet. A 121A (1), 25–30. doi:10.1002/ajmg.a.20083
Wang, X., Li, L., and Liu, D. (2014). Expression analysis of integrin β1 isoforms during zebrafish embryonic development. Gene Expr. Patterns 16 (2), 86–92. doi:10.1016/j.gep.2014.10.001
Weatherbee, B. A. T., Barton, J. R., Siddam, A. D., Anand, D., and Lachke, S. A. (2019). Molecular characterization of the human lens epithelium-derived cell line SRA01/04. Exp. Eye Res. 188, 107787. doi:10.1016/j.exer.2019.107787
Wilkinson, L., Gilbert, T., Kinna, G., Ruta, L. A., Pennisi, D., Kett, M., et al. (2007). Crim1KST264/KST264 mice implicate Crim1 in the regulation of vascular endothelial growth factor-A activity during glomerular vascular development. J. Am. Soc. Nephrol. 18 (6), 1697–1708. doi:10.1681/ASN.2006091012
Wilkinson, L., Gilbert, T., Sipos, A., Toma, I., Pennisi, D. J., Peti-Peterdi, J., et al. (2009). Loss of renal microvascular integrity in postnatal Crim1 hypomorphic transgenic mice. Kidney Int. 76 (11), 1161–1171. doi:10.1038/ki.2009.345
Wilkinson, L., Kurniawan, N. D., Phua, Y. L., Nguyen, M. J., Li, J., Galloway, G. J., et al. (2012). Association between congenital defects in papillary outgrowth and functional obstruction in Crim1 mutant mice. J. Pathol. 227 (4), 499–510. doi:10.1002/path.4036
Wu, D., Mandal, S., Choi, A., Anderson, A., Prochazkova, M., Perry, H., et al. (2015). DLX4 is associated with orofacial clefting and abnormal jaw development. Hum. Mol. Genet. 24 (15), 4340–4352. doi:10.1093/hmg/ddv167
Zhang, Y., Fan, J., Ho, J. W., Hu, T., Kneeland, S. C., Fan, X., et al. (2016). Crim1 regulates integrin signaling in murine lens development. Development 143 (2), 356–366. doi:10.1242/dev.125591
Keywords: cysteine-rich motor neuron 1, zebrafish, lens development, RNA-seq, colobomatous macrophthalmia with microcornea, coloboma, macrophthalmia
Citation: Le T, Htun S, Pandey MK, Sun Y, Magnusen AF, Ullah E, Lauzon J, Beres S, Lee C, Guan B, Hufnagel RB, Brooks BP, Baranzini SE and Slavotinek A (2025) A zebrafish model of crim1 loss of function has small and misshapen lenses with dysregulated clic4 and fgf1b expression. Front. Cell Dev. Biol. 13:1522094. doi: 10.3389/fcell.2025.1522094
Received: 03 November 2024; Accepted: 22 January 2025;
Published: 06 March 2025.
Edited by:
James Alan Marrs, Indiana University, Purdue University Indianapolis, United StatesCopyright © 2025 Le, Htun, Pandey, Sun, Magnusen, Ullah, Lauzon, Beres, Lee, Guan, Hufnagel, Brooks, Baranzini and Slavotinek. This is an open-access article distributed under the terms of the Creative Commons Attribution License (CC BY). The use, distribution or reproduction in other forums is permitted, provided the original author(s) and the copyright owner(s) are credited and that the original publication in this journal is cited, in accordance with accepted academic practice. No use, distribution or reproduction is permitted which does not comply with these terms.
*Correspondence: Anne Slavotinek, YW5uZS5zbGF2b3RpbmVrQGNjaG1jLm9yZw==