 Can Qi
 Ziwei Zhao1†
 Huizhong Niu
 Guochen Duan
 Le Wang
- 1Institute of Pediatric Research, Children’s Hospital of Hebei Province, Shijiazhuang, Hebei, China
- 2Department of Thoracic Surgery, Hebei General Hospital, Shijiazhuang, Hebei, China
Background: Neuroblastoma (NB), one of the most common malignant extracranial solid tumors in children, is highly invasive and lethal with limited treatment efficacy. This study aimed to establish a prognostic model of advanced-stage NB.
Methods: Differentially expressed genes were screened and validated using two training datasets and one validation dataset from the Therapeutically Applicable Research to Generate Effective Treatments and Gene Expression Omnibus databases. Protein–protein interaction networks were developed using the MCode plug-in, and the top three key clusters were used to produce candidate genes. We performed gene set enrichment analysis (GSEA), gene ontology analysis (GO), Kyoto Encyclopedia of Genes and Genomes (KEGG) analysis, immune cell infiltration, and drug sensitivity analysis to further understand the functions of these candidate genes. Kaplan–Meier (K–M) and receiver operating characteristic (ROC) curves were used to check their prognosis value. Real-time quantitative polymerase chain reaction (qPCR), Western blot (WB), and immunohistochemistry (IHC) were employed to verify the mRNA and protein levels in clinical samples.
Results: A total of 699 differentially expressed genes were identified, including 294 upregulated and 405 downregulated genes. CNR1, PRKACB, CDKN3, and PCLAF were found to significantly affect the overall survival and event-free survival of neuroblastoma patients and were positively correlated with the INSS advanced stages. The functional analysis of these four genes revealed their cancer-promoting effects and correlations with immune-inflammatory, cell cycle, and p53 signaling pathways. After stratifying patients using the established model containing the above four genes, significantly different patterns were observed in terms of infiltrating immune cell proportion, drug sensitivity, and the expression of immune checkpoints. Finally, both the mRNA and protein expression verification assays demonstrated that the CDKN3 and PCLAF were upregulated, while the PRKACB was downregulated in advanced-stage neuroblastoma tissue samples.
Conclusion: The model containing CNR1, PRKACB, CDKN3, and PCLAF can serve as a new prognostic biomarker for predicting the prognosis of patients with neuroblastoma. Findings on immune cell infiltration and immune checkpoints provide novel insights for the immunotherapy of neuroblastoma.
Background
Neuroblastoma (NB) is an embryonal tumor with extensive molecular heterogeneity in its biological and clinical presentation (Matthay et al., 2016). Although some NBs resolve spontaneously without treatment, approximately 50% of patients are classified as high risk on diagnosis, and only 50% survive for 5 years (Shohet et al., 2021). Accounting for 7%–10% of all childhood cancers, NB contributes 15% of cancer-related deaths (Irwin and Park, 2015). The pathogenesis of NB is reportedly associated with a number of genetic aberrations in genes regulating the cell cycle, cell proliferation, and programmed cell death (Salemi et al., 2022). Despite the emergence of many new treatment modalities for NB, such as radioimmunotherapy and molecular targeting therapies (Feng et al., 2023; Zafar et al., 2021), the estimated 5-year survival rates for patients with high-risk NB are approximately 50% (Shohet et al., 2021). According to the Children’s Oncology Group guidelines, NB can be divided into four International Neuroblastoma Staging System (INSS) stages (Brodeur et al., 1993). INSS is a postsurgical staging system that uses tumor location in relation to the midline structures, lymph node status, and the extent of previous surgical resection to define the tumor status. Bone marrow assessment and radiographic studies are used to detect metastases. Stage 4 or 4S determination depends on other clinical details (Naranjo et al., 2018).
Owing to the key role of INSS staging in assessing disease severity and prognosis, researchers continue to explore prognostic biomarkers associated with the INSS stage. MYCN gene amplification is more observed in neuroblastomas with higher INSS stages (Stages 3 and 4) (Hansen et al., 2017). Significantly higher TERT expression has been detected in NB samples with INSS Stage 4 than in samples with earlier stages (Akter and Kamijo, 2021). Differences in the 1p/11q (Raitio et al., 2021) and serum inflammatory factors (Zheng et al., 2020) were also identified by the stratification based on INSS staging. However, these studies either did not use transcriptomics and bioinformatics to screen genes at a hierarchical level, as in Secomandi et al., who compared only one gene, the lysosomal protease cathepsin D (Secomandi et al., 2022), or did not use clinically derived specimens for expression validation (Fan et al., 2020). Therefore, identifying specific markers for diagnosis and treatment is of vital importance for improving the prognosis of children with advanced INSS stage of NB.
Over the last few years, high-throughput sequencing and gene microarray technologies have been applied in many medical fields to facilitate the classification of tumors based on histological and clinical data, cancer-related genes, and biological pathways (Satam et al., 2023). Moreover, emerging bioinformatics based on gene expression has recently become an effective method for systematically screening tumor-related genes and exploring the related molecular mechanisms (Hernandez-Lemus et al., 2019). The early detection and prognosis of many diseases depend on biomarkers that can mark changes in the structure or function of systems, organs, tissues, cells, and subcells (Shawraba et al., 2021). Biomarkers can be used to classify NB into different groups, facilitating NB treatment and prognosis (Trigg et al., 2019). Several studies have discussed the prognostic role of biomarkers (Galardi et al., 2018; Glembocki and Somers, 2024; Liu et al., 2022); however, the clinical use of these biomarkers requires clinical evaluation. In this study, we screened patients with NB using the Therapeutically Applicable Research to Generate Effective Treatments (TARGET) and Gene Expression Omnibus (GEO) databases for potential biomarkers of survival prognosis. A novel approach for the prognostic diagnosis of NB was proposed. We identify markers of advanced-stage NB, explore their role in prognosis, and highlight the value of their implementation in a clinical setting. To effectively manage advanced-stage NB, the detection and analysis of prognostic biomarkers can play a vital role in refined risk assessment and the development of targeted therapeutic regimens.
Materials and methods
Data source
Training set 1 related to NB patients captured from the Therapeutically Applicable Research to Generate Effective Treatments (TARGET) database (https://ocg.cancer.gov/programs/target), called TARGET-NB. This set included clinical information and survival information for 152 patients with advanced stages of NB and was utilized for the prognostic model. From the Gene Expression Omnibus (GEO) database (http://www.ncbi.nlm.nih.gov/geo/), GSE73517 (GPL16876) was downloaded as training set 2 and utilized for differential expression analysis. The training set consisted of 105 samples; 20 tissues from patients with stages 1–2 of NB were selected as control samples (10 and 9 patients in stages 1 and 2, respectively), and 65 tissues from patients with advanced stages of NB (10 and 55 patients in stage 3 and 4, respectively). Stage 4S was not involved in this study. The validation set GSE62564 (GPL5175) contains 498 samples accompanied by survival information for validation of the prognostic model.
Differential expression analysis
For choosing differentially expressed genes (DEGs) in stages 1–2 and 3–4 of NB patients, differential expression was undertaken based on the stages in training set 2 using R package limma version 3.54.0 (Ritchie et al., 2015). Screening was performed with threshold |log2fold-change (FC)| > 1, adj. p < 0.05. Using the R package ClusterProfiler version 4.2.2 (Wu T. et al., 2021), the acquired DEGs were analyzed for gene ontology (GO) and Kyoto Encyclopedia of Genes and Genomes (KEGG) with p adj < 0.05 to probe their possible roles. Furthermore, DEGs were submitted into the STRING database, with interaction = 0.7, and a protein–protein-interaction (PPI) network was developed. Subsequently, key clusters in PPI were analyzed by plug-in MCode in Cytoscape, and the top 3 clusters were selected by K-core = 2, degree cutoff = 2, max depth = 100, and node score cutoff = 0.2. The genes in these three clusters acted as candidate genes.
Prognostic risk model
With the use of the coxph function in survival package version 3.3–5, univariate Cox regression was performed to select for genes linked to prognosis (HR ≠ 1, p < 0.05). A proportional hazards (PH) assumption was then tested on these genes, and a p-value greater than 0.05 indicated the genes did not influence each other. The least absolute shrinkage and selection operator (LASSO) regression analysis was fitted to the genes obtained from univariate Cox using the R package glmnet version 4.1-4 (Friedman et al., 2010). After 10-fold cross validation, the genes whose final regression coefficients were penalized to 0 were used as prognostic genes. A risk model was built with the expression and coefficients of the genes obtained from LASSO. The formula for this risk score was as follows:
The coef and x represented coefficients and relative expression levels of prognostic genes, respectively. A risk formula was adopted to calculate risk scores for patients with NB, and patients were sorted into high-/low-risk cohorts based on median risk scores to demonstrate score distribution and survival status in training set 1. Survival difference for patients from both risk cohorts was then analyzed using Kaplan–Meier (K–M) curves (p < 0.05). The performance of the risk model in predicting NB patient survival was also assessed with the help of receiver operating characteristic (ROC) curves. The risk model was then validated with the validation set using the same methodology.
Independent prognostic analysis and nomogram construction
To assess the clinical applicability of the risk model, univariate and multivariate Cox regression analyses and Proportional Hazards tests were employed on risk scores and clinical characteristics based on training set 1 to screen the independent prognostic factors. With the rms package version 6.5-0, a nomogram was constructed depending on independent prognostic factors to predict survival for patients with NB. Calibration, ROC, and decision curve analysis (DCA) curves were plotted to evaluate the nomogram.
Analysis of correlation between risk scores and clinical characteristics
For the purpose of exploring the relationship between risk scores and clinicopathological characteristics of NB patients, the distribution of risk score grades across different characteristics was demonstrated in training set 1. The differences among risk scores in different subgroups of clinical and molecular characteristics were confirmed.
Functional enrichment analysis
With a view to understanding the biological pathways for risk cohorts, inter-cohort difference was analyzed via DESeq2 package version 1.38.3 (Love et al., 2014) in all the samples of training set 1, and log2FC was calculated and ranked from the largest to the smallest and then subjected to gene set enrichment analysis (GSEA). The reference gene set was KEGG (c2.cp.kegg.v2023.1.Hs.symbols.gmt). In addition, gene set variation analysis (GSVA) scores were calculated for training set 1 in the KEGG pathway using the GSVA package (v 1.42.0) (Hanzelmann et al., 2013), and the T-test was used to compare GSVA scores for prognostic genes in the early- and advanced-stage NB groups (p < 0.05).
Immune microenvironment and drug sensitivity analysis
To assess immune cell infiltration associated with risk cohorts, patients with p-values <0.05 and incomplete cell content of 0 in samples of training set 1 were screened for the study using CIBERSORT analysis. The proportions of 22 immune cells in each NB patient were further counted. Immune cell differences were compared between risk cohorts. In addition, eight immune checkpoints were analyzed in the inner cohort of training set 1 (Wu J. et al., 2021). To evaluate drug sensitivity, the half-maximal inhibitory concentration (IC50) of each drug in each tumor sample in training set 1 was counted via oncoPredict. Differences in the IC50 of drugs were compared inter-cohorts, and the top 20 drugs were selected for presentation.
Clinical sample collection
This study was approved by the Ethics Committee of Hebei Children’s Hospital (No. 2020-14), and written informed consent was obtained from each patient or guardian. Clinical data of children with neuroblastoma admitted to Children’s Hospital of Hebei (CHH) from March to December 2023 and their fresh neuroblastoma tissues obtained during tumor resection were collected and frozen for spare use; all of the above clinical tissue samples were obtained from the first time the children were admitted to the hospital, and they had not received any relevant treatment prior to surgery.
Quantitative real-time PCR for mRNA expression of differentially expressed genes
In order to verify the expression of DEGs, quantitative real-time PCR was taken to measure the mRNA levels of the four DEGs. Total RNA was extracted from the tissue samples using TRIzol (Invitrogen). The RNA (1 µg) of each sample was used for reverse transcription with PrimeScript RT reagent (Takara). Then, PCR was performed using Power SYBR® Green PCR Master Mix (TaKaRa), according to the manufacturer’s instructions. The primer sequences for quantitative PCR were CNR1: Forward 5′-TGTGCAGATGAAGGCTCAGG-3′; Reverse 5′-GAGCATTGGTACTGCCTGGT-3′. PRKACB: Forward 5′-AGGCTGGGATAACTAGCTTGA-3′; Reverse 5′- AAGCCCCTAGAAGCAAAGCA-3′. CDKN3: Forward 5′-GGACTCCTGACATAGCCAGC-3′; Reverse 5′-TGATGGTCTGTATTGCCCCG-3′. PCLAF: Forward 5′-ACATGGTGCGGACTAAAGCA-3′; Reverse 5′-AGGACATGCTCTITCCTCGAT-3′. GAPDH: Forward 5′-CGAAGGTGGAGTCAACGGATTT-3′; Reverse 5′- ATGGGTGGAATCATATTGGAAC-3′. Relative expression was normalized, and the 2−ΔΔCt method was carried out to calculate the relative mRNA level, with GAPDH as an internal control.
Immunohistochemistry and Western blot validation of the protein expression of differentially expressed genes
To verify the protein expression of differentially expressed genes, immunohistochemistry (IHC) and Western blot (WB) techniques were employed to detect the protein levels of four DEGs.
Immunohistochemistry: Paraffin-embedded tissue specimens were deparaffinized, dewaxed, and rehydrated in gradient ethanol. Sections were incubated with polyclonal rabbit anti-human antibodies diluted at 1:100 overnight at 4°C. CNR1, bs-1683R, Bioss; PRKACB, AF7746, Affinity Biosciences; CDKN3, DF6791, Affinity Biosciences; PCLAF, E-AB-52100, E-lab-science Biotechnology. The stained sections were scored by two independent pathologists who were blinded to the clinical outcomes. The total IHC scores for protein expression were semi-quantitatively calculated based on the positive cells and staining intensity. Scoring criteria: A: number of positive cells: 0%–1% = 0, 1%–10% = 1, 10%–50% = 2, 50%–80% = 3, 80%–100% = 4. B: staining intensity: 0 (Negative), 1 (Weakly positive), 2 (Positive), 3 (Strongly positive). Total scores = A × B.
Western blot: Tissues were solubilized in cell lysis buffer. After the total protein was extracted, the concentration was measured using the BCA assay (Thermo) method. Equivalent amounts of protein were separated by 12% SDS–PAGE and transferred into polyvinylidene fluoride (PVDF, Millipore) membranes. After being blocked by 5% bovine serum albumin (BSA) for 2 h at room temperature, the membranes were incubated with one of the following primary rabbit antibodies at 4°C overnight: CNR1, diluted at 1:1000, bs-1683R, Bioss; PRKACB, 1:1000, AF7746, Affinity Biosciences; CDKN3, 1:1000, DF6791, Affinity Biosciences; PCLAF, 1:1000, 81533, Cell Signaling Technology. GAPDH, diluted at 1:3000, 10494-1-AP, Proteintech Biotechnology. The membranes were washed three times with TBST, and the membrane was incubated with secondary anti-rabbit IgG (ZSGB-BIO) for 1.5 h. Finally, the bands were visualized using an ECL chemiluminescence kit, and the band intensity was quantified using ImageJ software.
Statistical analysis
The statistical analysis was conducted using R version 4.2.2. If not specified, a Wilcoxon rank-sum test was applied for difference analysis inter-cohort with p < 0.05 as statistically significant.
Results
Candidate genes
Of the 699 deferentially expressed genes (DEGs; Stage 1–2 versus Stage 3–4), 294 and 405 genes were upregulated and downregulated in the stages 1–2 and 3–4 groups, respectively (Figure 1A). The DEGs were ranked according to their adjusted p-values, and the top 10 up- and downregulated genes were selected for the density heatmap (Figure 1B). These DEGs were enriched in 389 gene ontology (GO) terms, including the regulation of “mitotic nuclear division,” “nuclear division,” and “mitotic nuclear division,” and 23 KEGG pathways, including the “cell cycle,” “axon guidance,” and “circadian entrainment” pathways (Figure 1C). The protein–protein interaction (PPI) network contained 268 nodes and 1,686 edges (Figure 1D). Furthermore, cluster1 (score = 36.550) contained 41 genes and 731 edges, cluster2 (score = 4.677) contained 10 genes and 21 edges, and cluster3 (score = 4.000) contained four genes and six edges (See Supplementary Figure S1). Thus, 55 genes were considered as candidate genes.
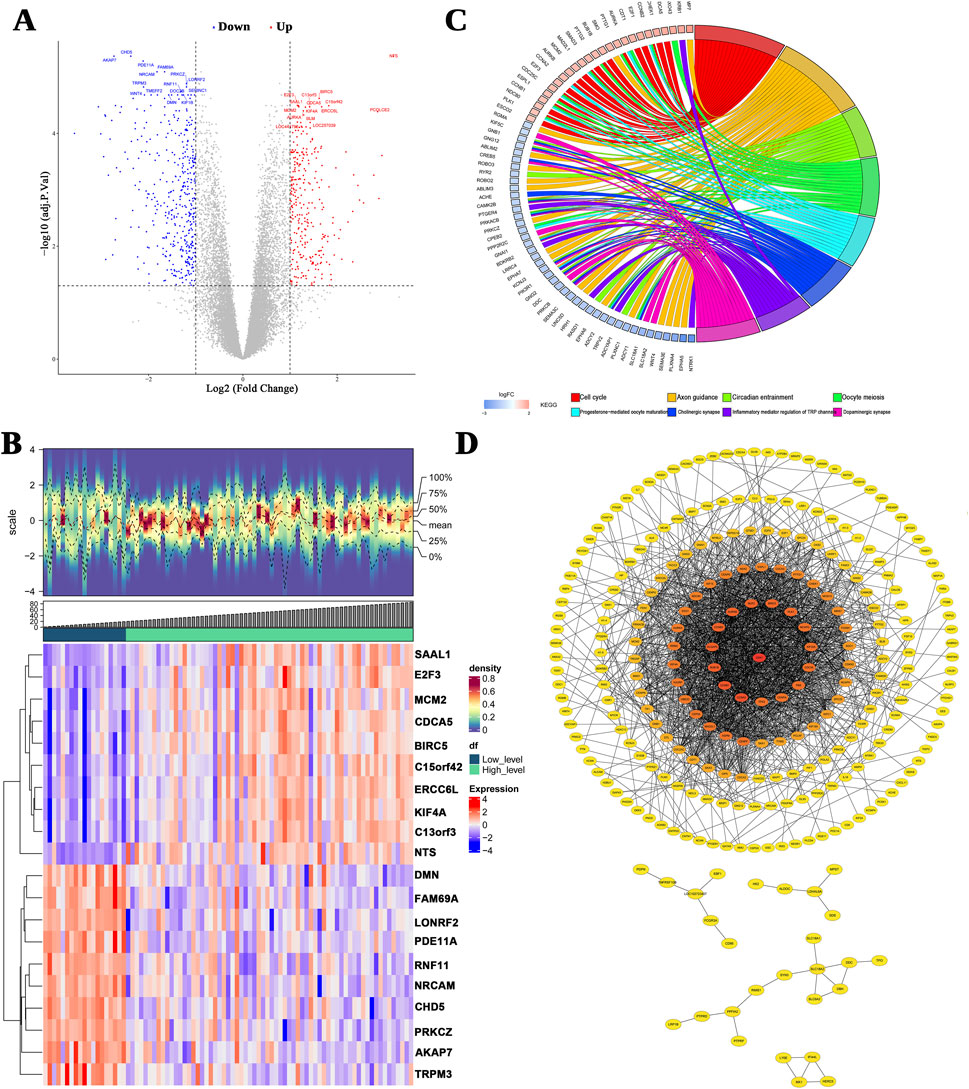
Figure 1. Differentially expressed genes (DEGs) between INSS early and advanced stages. (A) A volcano plot of the logFC and statistical significance of all DEGs. Red plots represent upregulated genes, and blue plots represent downregulated genes. Gray plots are genes that did not meet the criteria for DEGs. (B) The top 10 upregulated and downregulated genes are shown in this density heatmap. The expression levels of the genes are indicated by the colors in each cell (red for high and blue for low). (C) Top 10 significant KEGG signal pathways. (D) The PPI networks.
Risk model to predict the survival of patients with NB
Using univariate Cox regression, 24 of the 55 candidate genes were screened for associations with prognosis, and all these genes passed the PH test (p-value >0.05, Figure 2A). The LASSO model with a lambda value minimum of 0.06 had the lowest model error rate and yielded four prognostic genes: CNR1, PRKACB, CDKN3, and PCLAF (Figure 2B). These four prognostic genes and their coefficients used to calculate the risk scores are listed in Supplementary Table S1. The patients in training set 1 were subgrouped as a high-risk cohort (n = 75) and a low-risk cohort (n = 75) using −0.426 as the cutoff value (Figures 2c, D). According to Kaplan–Meier (K–M) curves, the low-risk patients had considerably higher concurrent survival rates than high-risk patients (Figure 2E). The ROC curve demonstrates that the overall area under the curve (AUC) was above 0.600 (AUC values for 1 year, 3 years, and 5 years = 0.638, 0.674, and 0.729, respectively), suggesting that the risk scores could better predict the survival status of NB patients relatively accurately (Figure 2F).
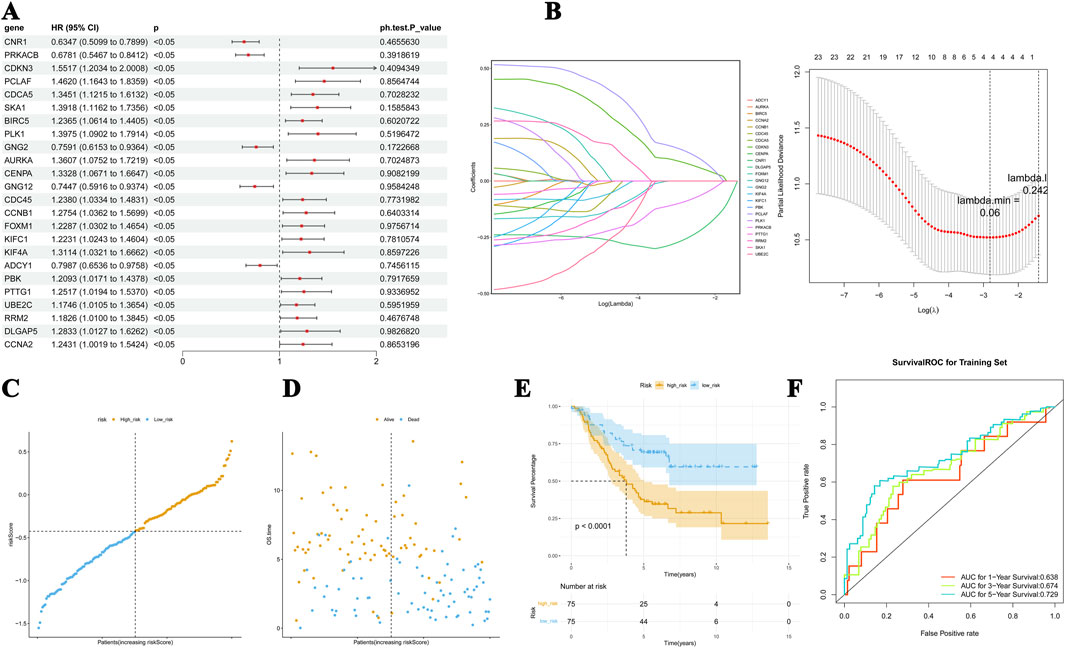
Figure 2. Risk model for predicting the survival status of NB. (A) Significance and hazard ratio values of stage-related DEGs in univariate Cox regression. All of the 55 candidate genes passed the PH test. (B) The LASSO model has the lowest error rate and yielded four prognostic genes, including CDKN3, PCLAF, PRKACB, and CNR1. (C, D) The distribution of risk scores, the association between risk scores and OS, and the mRNA expression of the four genes. (E) K–M curves showed dramatically higher concurrent survival rates of patients in the low-risk cohort than those in the high-risk group. (F) The ROC curve of the predictive performance of the four genes.
For the validation set, the patients were divided into high-risk (n = 249) and low-risk (n = 249) cohorts using the median of the risk scores, −1.556 (Figures 3A, B). The K–M curves showed a significant difference in survival in these two cohorts (p < 0.05), and the results were consistent with the survival pattern and performance of the training set survival pattern (Figure 3C). In the ROC curve, the overall AUC values were also above 0.7 (Figure 3D), suggesting that the constructed risk model is applicable to different NB datasets.
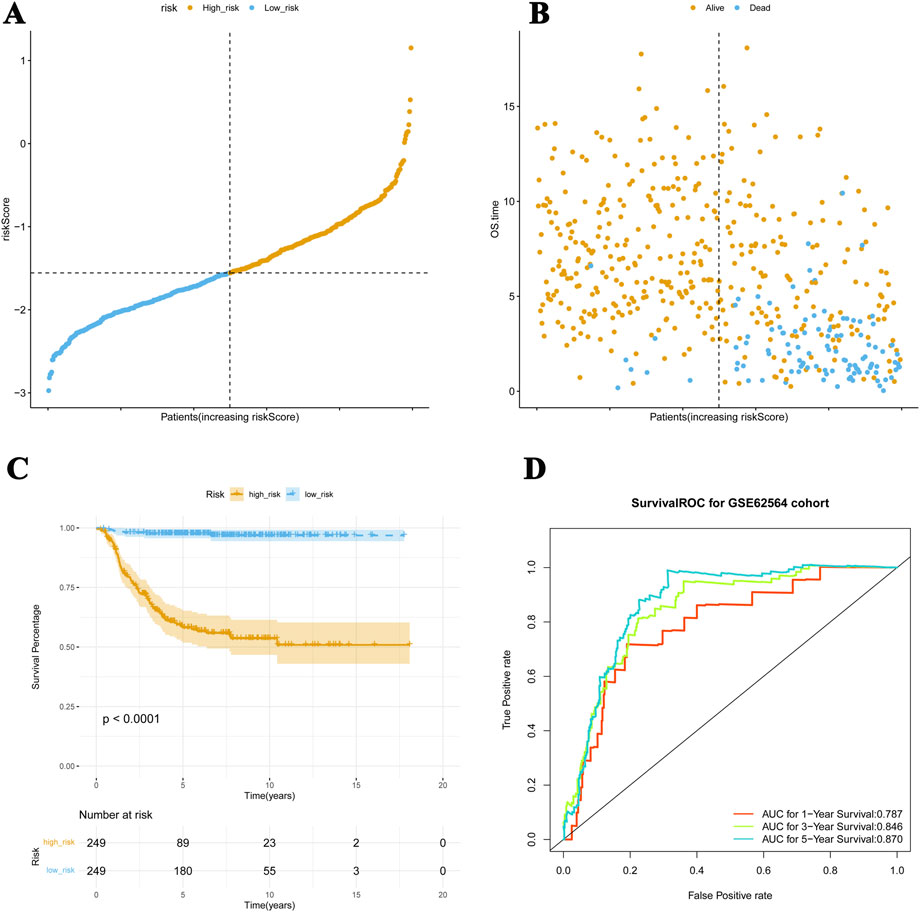
Figure 3. Risk model applied to the validation dataset. (A, B) For the validation set, patients are divided into high-risk and low-risk cohorts. (C) The K–M curves show meaningful differences in survival between these two cohorts (p < 0.05), which is consistent with the performance of the training set survival pattern. (D) The ROC curve verifies the predictive performance of these four genes.
Predictive ability of the nomogram model
The predictive abilities of the risk score, age, gender, NB stages, ploidy, and MYC-N status were analyzed. The Cox regression analysis showed that risk score and ploidy were two good independent prognostic factors (Figures 4A, B). These two factors were, therefore, included in the construction of the nomogram. The nomogram model was developed using logistic regression based on independent prognostic factors. It allowed the prediction of the probability of patient survival after 1 year, 3 years, and 5 years based on the total number of points (Figure 4C). The predictions for the different periods were all close to the diagonal line in the calibration curves (Figure 4D). In the ROC curves, the AUCs were greater than 0.7 for all three periods (Figure 4E). Decision curve analysis showed that the predictive power of the nomogram was greater than that of the individual factors (Figure 4F). These results all reflect the good predictive ability of the nomogram model.
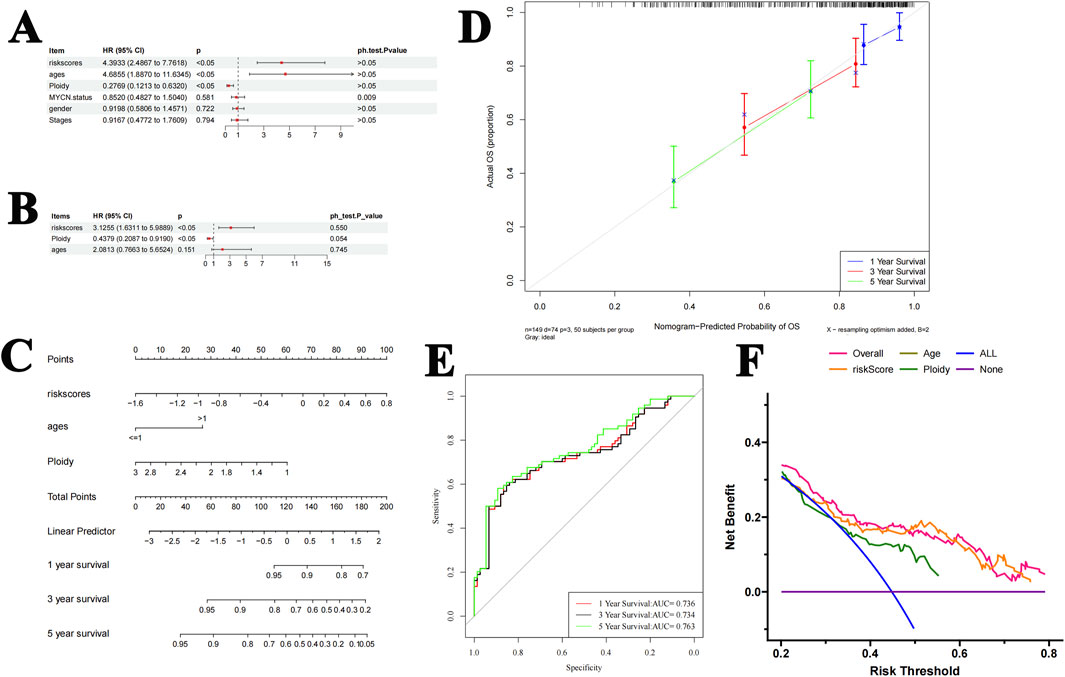
Figure 4. Construction and validation of the nomogram. (A, B). Cox analysis shows that the risk score and ploidy are independent prognostic factors. (C) The nomogram model predicts the probability of patient survival at 1 year, 3 years, and 5 years. (D) The predictions for each year are all around the diagonal in the calibration curves. (E) The ROC curve showed that the AUC values for 1 year, 3 years, and 5 years were all greater than 0.7. (F) The DCA curve showed that the predictive effect of the nomogram was greater than that of other individual factors.
Risk scores differed between the tumor stage, MYCN status, and age subgroups
A heat map was used to illustrate the distribution of clinical characteristics between the high- and low-risk cohorts (Figure 5A). The risk scores significantly differed between the different tumor stages, MYCN status, and age subgroups; however, no significant difference was observed between genders (Figures 5B–E).
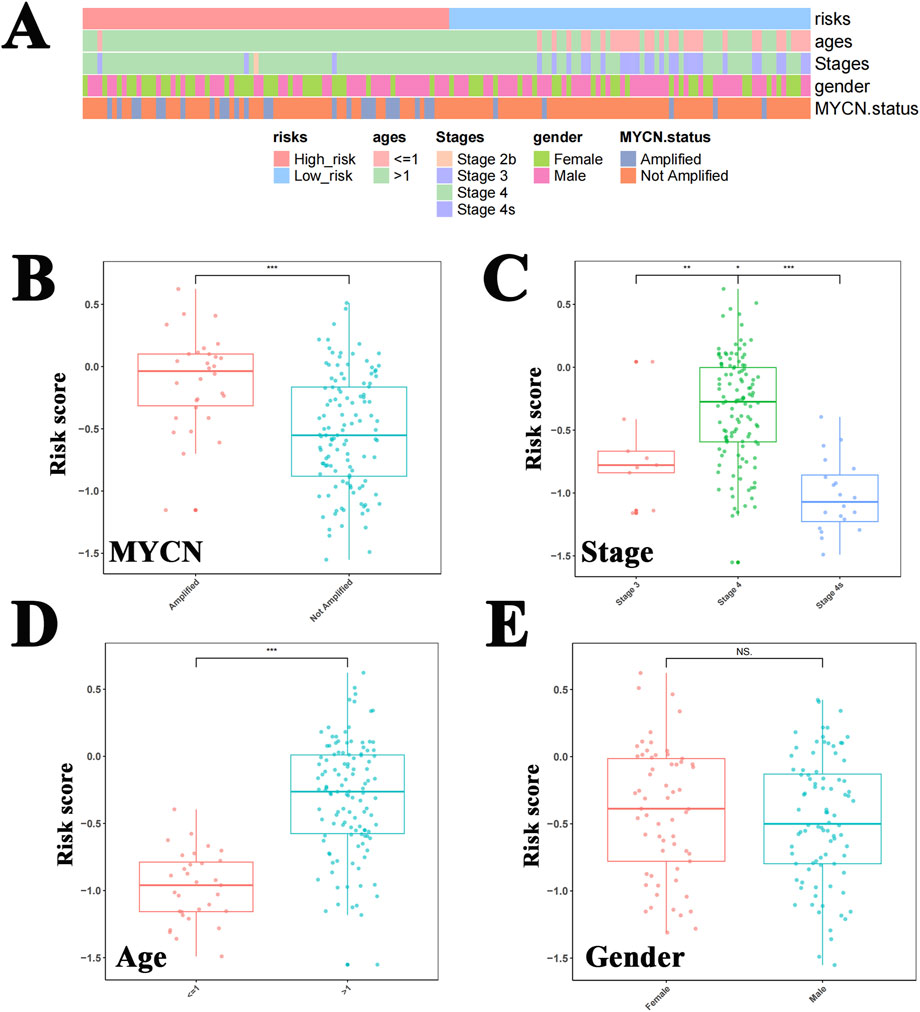
Figure 5. Risk scores differed between tumor stage, MYCN status, and age groups. (A) The heat map shows the distribution of clinical characteristics between the high-risk and low-risk cohorts. The risk scores differed significantly between the MYCN amplified status (B), tumor stages (C), and age subgroups (D), but this significance was not observed between genders (E).
Major differential gene expression profiles
GSEA demonstrated enrichment in a total of 68 pathways closely related to the cell cycle, immune-inflammatory processes, and the p53 signaling pathways (Figure 6). Panel A represents the Top10 pathways that are significantly activated in the high-risk group; panel B represents the Top10 pathways that are significantly inhibited. Interestingly, the most significantly enriched pathways in the gene set variation analysis (GSVA) were consistent with the GSEA results (Figure 6C); they were mainly pathways closely related to the cell cycle and cell proliferation.
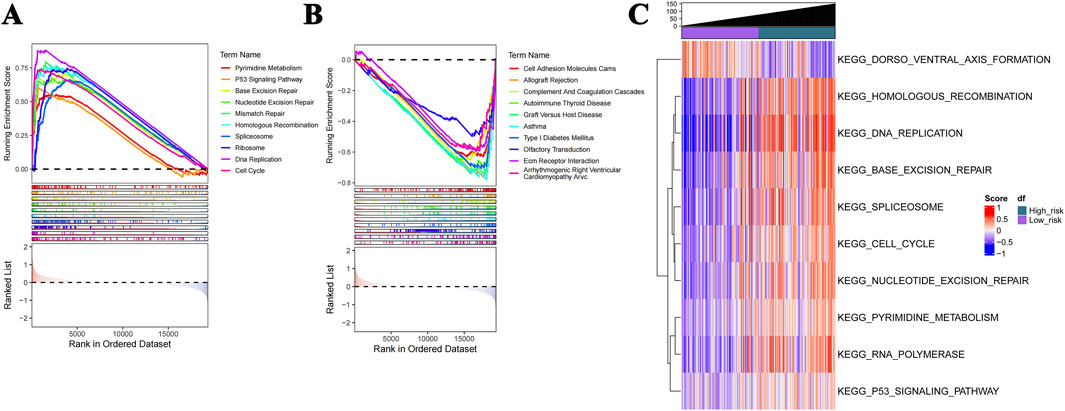
Figure 6. GSEA and GSVA profiles. (A) GSEA shows that the Top10 activated pathways in the high-risk group are closely related to the cell cycle, immune-inflammatory processes, and P53 signaling. (B) The Top10 pathways that are significantly inhibited. (C) The enriched pathways in GSVA are consistent with the GSEA results.
Immune cells, immune checkpoint, and drug sensitivity profiles
The heat map shows that the proportions of M0 macrophages, plasma cells, follicular helper T cells, and Tregs were markedly higher in the high-risk cohort than in the low-risk one (Figures 7A, B). In addition, the expression level of LAG3 was significantly higher in the high-risk group, while CD274 (PD-L1) and PDCD1LG2 were significantly downregulated (Figure 7C). By comparing the half-maximal inhibitory concentration (IC50) values of drugs between the risk cohorts, the top 20 drugs are identified and illustrated in Supplementary Figure S2.
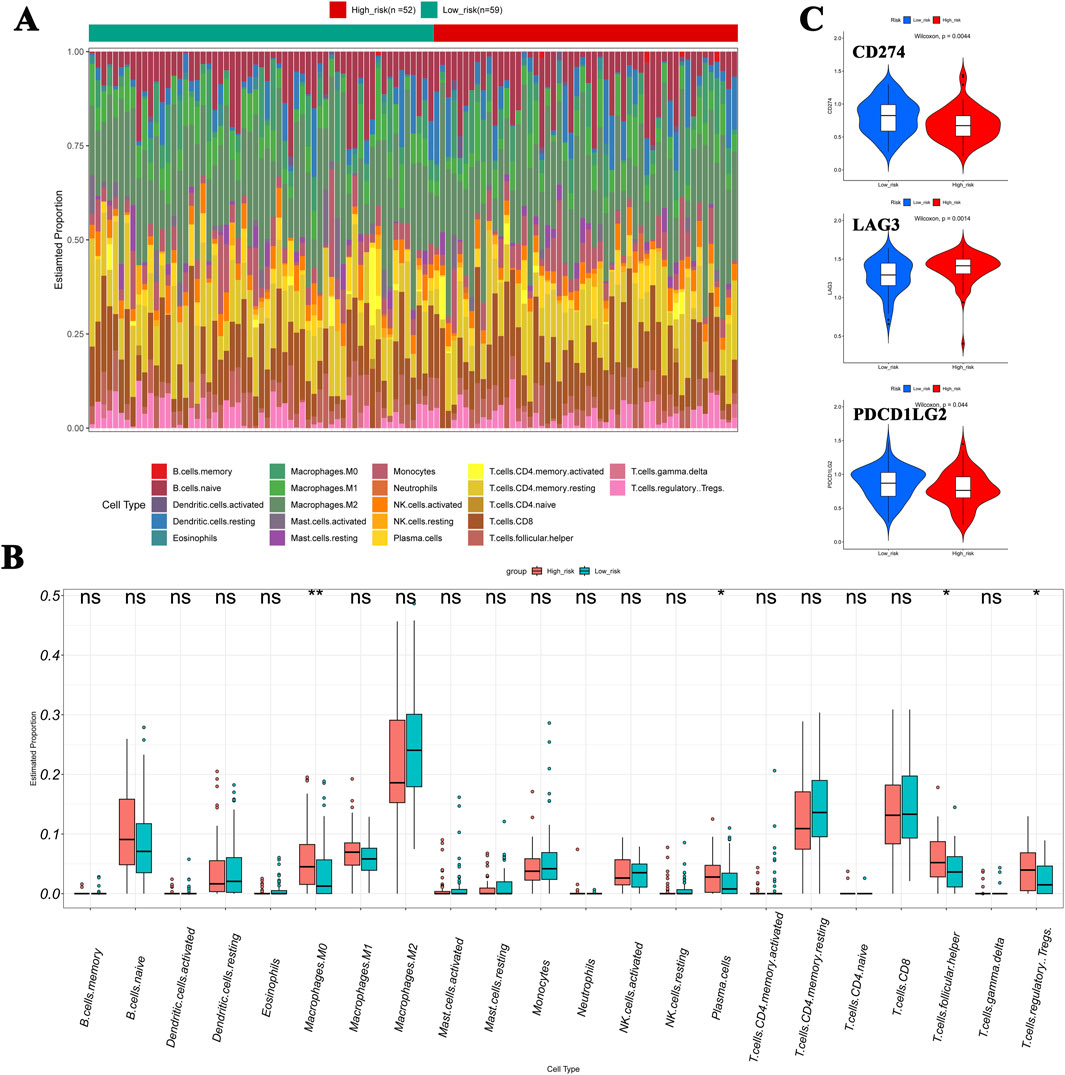
Figure 7. Immune cell infiltration in NB. (A, B) Compared to the low-risk cohort, the heat map showed that the proportions of M0 macrophages, plasma cells, follicular helper T cells, and Tregs were significantly higher in the high-risk cohort. (C) Expression levels of LAG3, CD274 (PD-L1), and PDCD1LG2 show significant differences between cohorts.
Verification of mRNA expression of DEGs in NB tissue samples
A total of 10 NB tumor samples were analyzed for the mRNA expression of four DEGs, with equal numbers of advanced-stage NB tissue samples (n = 5) and early-stage ones (n = 5). The mRNA expression levels of CDKN3 and PCLAF were upregulated, and that of PRKACB was downregulated at the advanced stage, which was consistent with the bioinformatics analysis (p < 0.05, Figure 8). No significant change was observed in the CNR1 mRNA level (p > 0.05).
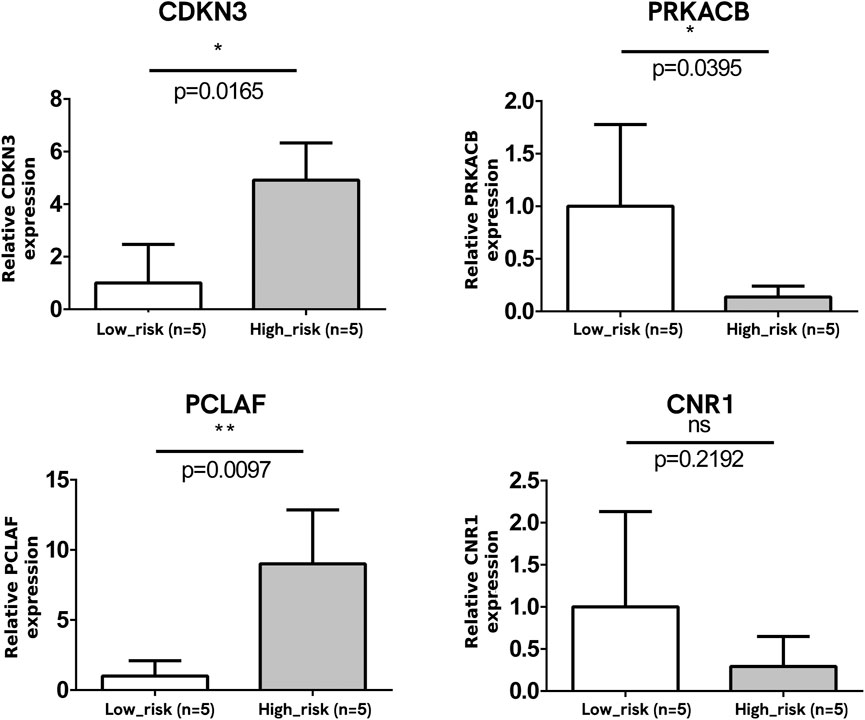
Figure 8. Verification of mRNA expression of DEGs. The mRNA expressions of CDKN3 and PCLAF were significantly upregulated and that of PRKACB was downregulated at the advanced stage. No significant change was observed in the CNR1 mRNA level.
Verification of protein expression in NB tissue samples
To clinically validate the four genes identified in our prognostic model, we conducted protein-level verifications, including immunohistochemistry (IHC) and WB. The clinical samples used for protein verification were the same as those used in the qPCR assay. The representative IHC images are illustrated in Figure 9A. The IHC (Figure 9A) and WB (Figure 9B) both show that the expressions of CDKN3 and PCLAF in the advanced stages were significantly higher than in the early stages, while PRKACB was the opposite (p < 0.05). No significant change was observed in the protein level of CNR1 (p > 0.05).
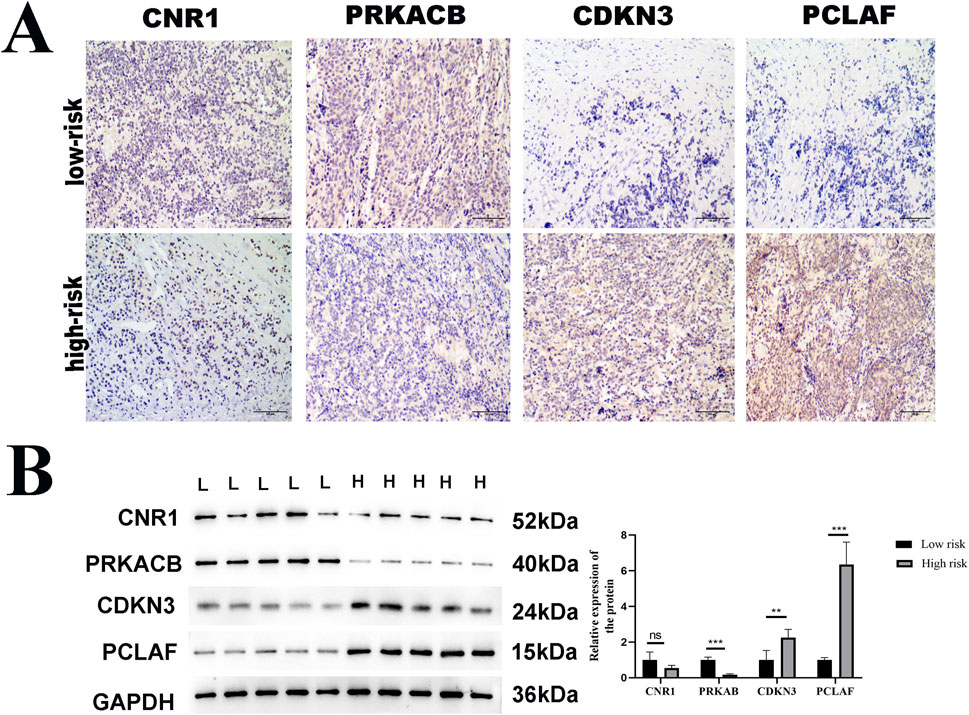
Figure 9. Verification of protein expression of DEGs. Immunohistochemistry (IHC) and Western blot (WB) analysis of CDKN3, PCLAF, PRKACB, and CNR1 expression in low-risk versus high-risk NB tumor tissue samples. (A) Representative IHC images of these four genes in tumor tissues. Scale bar: 100 μm, (B) Western immunoblots. GAPDH was used to normalize. The expressions of CDKN3 and PCLAF were significantly upregulated and that of PRKACB was downregulated at the advanced stage of NB, compared with the early stage, with statistical significance indicated (*p < 0.05, **p < 0.01).
Discussion
NB has an insidious onset without specific symptoms (Kembhavi et al., 2015), making early-stage diagnosis challenging. Approximately 50% of children with NB show metastases at initial diagnosis (Tolbert and Matthay, 2018), which contributes to a poor prognosis, especially in patients at an advanced INSS stage (Pizzo et al., 2015). The INSS has been an effective predictive tool for the prognosis of NB over the past decade in China (Brodeur et al., 1993). Patients with advanced INSS stages are resistant to current high-intensity therapy and typically have a poor prognosis compared to children in the early stages (Sokol and Desai, 2019; Maris et al., 2007). Researchers have speculated that this may be due to tumors that are more difficult to treat or that have spread to areas that are inaccessible for surgery; however, clinical evidence is lacking. By reviewing the clinical data of 72 patients with NB, Qi et al. found that advanced lung cancer inflammation index and INSS stage were independent prognostic factors for patients with NB (Qi et al., 2022). Keane et al. evaluated the expression of DLG and LIN7 gene families in different INSS stages and found that the disrupted DLG isoform was abundant in the advanced stage of NB. This could control cell polarity and signaling, thereby affecting cancer cell viability (Keane et al., 2021). Further mechanistic studies investigating poor prognosis in children with advanced-stage NB are needed in the future.
In this study, we analyzed NB RNA-seq data from the TARGET and GEO databases to investigate the relationship between DEGs and NB prognosis. During screening, four genes (CDKN3, PCLAF, PRKACB, and CNR1) were identified as being significantly associated with advanced NB, and a risk model based on these four genes showed prognostic value for patient survival. These genes exert biological functions in the cell cycle, immunoinflammatory processes, and the p53 signaling pathway, and expression assays validated that the mRNA and protein levels of CDKN3, PCLAF, PRKACB, and CNR1 in NB tissues correlate with NB staging.
As a member of the dual-specific protein phosphatase family and kinase-associated phosphatases, the cyclin-dependent kinase inhibitor 3 (CDKN3) gene product inhibits the G (1)/S transition by dephosphorylating cyclin-dependent kinases (Ding et al., 2020). In our report, we observed that the level of CDKN3 was elevated in the advanced-stage NB. Several recent studies have reported that CDKN3 plays a regulatory role in the survival and proliferation of cancer cells. Yang et al. found that CDKN3 is a marker of poor prognosis in NB (Yang et al., 2017). Vernaza et al. found that knocking down CDKN3 reduced the expression of the cell proliferation markers Ki67 and proliferating cell nuclear antigen (PCNA), a binding partner of PCLAF, and decreased the colony formation of NB cells (Vernaza et al., 2024). The in vitro functional assays have been conducted in liver hepatocellular carcinoma (LIHC). Q-PCR and Western blotting were used to detect the expression of CDKN3 in LIHC and its adjacent tissues as well as human liver cancer cell lines. It was found that, compared with the adjacent samples, the mRNA expression of the CDKN3 gene was significantly upregulated in 63.9% (23/36) of liver cancer tissues. After silencing the expression of CDKN3, the growth and colony formation ability of cancer cells were significantly inhibited (Li et al., 2023). Moreover, silencing the expression of CDKN3 could induce G0/G1 phase arrest in liver cancer cells, indicating that CDKN3 promotes the proliferation of liver cancer cells by affecting the cell cycle distribution (Lin et al., 2013). Knockdown of CDKN3 led to the downregulation of p53 and p21 protein levels, while the AKT serine/threonine kinase 1 was upregulated (Dai et al., 2016). Therefore, the elevated expression of CDKN3 may reduce the survival of tumor cells and change the sensitivity to therapeutic agents through the AKT/P53/P21 signaling pathway (Dai et al., 2016). These observations facilitate translating genomic and transcriptomic features into molecular mechanisms of high-risk NB.
Proliferating cell nuclear antigen-clamp associated factor (PCLAF) is involved in DNA repair through its binding partner, proliferating cell nuclear antigen (PCNA) (Liu et al., 2021). PCLAF has been reported to play various essential roles in cell proliferation, apoptosis, and cell cycle regulation (Liu et al., 2021). Among the differentially expressed downregulated genes in NB, Liu et al. found that the cell cycle-related pathway genes were most significantly altered in association with the decreased level of PCLAF (Liu et al., 2022a). The patients with elevated levels of PCLAF mRNA had the worst OS and EFS, which was consistent with our results. Importantly, PCLAF knockdown could limit the proliferation of NB cells in vitro and in vivo (Liu et al., 2022a). In eight types of tumors, including cholangiocarcinoma, cervical cancer, and glioblastoma multiforme, the expression levels of PCLAF are significantly higher than those in normal tissues (Liu et al., 2022b). Meanwhile, the DNA methylation level of PCLAF is decreased, indicating an association between hypomethylation and high expression (Liu et al., 2022b). The survival analysis conducted using the GEPIA2 tool showed that the high expression of the PCLAF gene is correlated with the overall survival and disease-free survival of patients, suggesting that it can serve as a potential prognostic biomarker. At the same time, this pan-cancer study also found that the expression of PCLAF is positively correlated with activated CD4+ T cells and T helper 2 (Th2) cells. This implies that PCLAF may play a specific role in the process of tumor immune cell infiltration and affect the functions and distribution of immune cells in the microenvironment (Liu et al., 2022b). These results, together with ours, reveal the mechanism through which PCLAF facilitates cell cycle progression, suggesting this gene may be a therapeutic target in NB.
Protein kinase cAMP-dependent catalytic subunit beta (PRKACB) is a member of the serine/threonine protein kinase family and a key effector of cAMP/PKA-induced signal transduction (Soberg et al., 2017). It is involved in numerous cellular processes, including cell proliferation, apoptosis, gene transcription, metabolism, and differentiation (Ahmed et al., 2022; Huang et al., 2024). Shao et al. found significantly lower PRKACB expression in an N-myc proto-oncogene (MYCN)-amplified group than in an MYCN-non-amplified group (Shao et al., 2021). In the present study, PRKACB downregulation was observed in children with poor OS rates. Whole genome-scale integrated analyses of exon arrays demonstrated that PRKACB is a novel cancer-related variant transcript in gastric cancers (Furuta et al., 2012). The expression of PRKACB was downregulated in both colorectal cancer and non-small cell lung cancer (NSCLC) (Yao et al., 2020; Chen et al., 2013). In a study aiming to evaluate the expression pattern of PRKACB in NSCLC, Chen et al. found that PRKACB is downregulated in NSCLC tissues, and the upregulation of this gene decreased the number of proliferative, colony-forming cells and invasive cells, indicating that an upregulated PRKACB level may be an effective way to prevent the progression of NSCLC (Chen et al., 2013). In a large-scale study in 2023 involving a nutrient database and cellular and animal assays, trans-vaccenic acid (TVA) was found to lead to an increased PRKACB expression in immunodeficient nude mice, T cell receptor-α knockout mice, and mice with a CD8+ T cell depletion. When the gene was upregulated, the cAMP-PKA-CREB axis was activated, which not only enhanced the function of CD8+ T cells but also reversed T cell exhaustion (Fan et al., 2023). This multi-faceted approach provides a new potential direction; that is, the anti-tumor effect could be enhanced by regulating the intake of related nutrients based on their gene regulation mechanisms.
Cannabinoid receptor-1 (CNR1) is a classical receptor of the endocannabinoid system that primarily exists in the central and peripheral nervous systems (Tao et al., 2020). Depending on its binding to its corresponding ligands, CNR1 activates intracellular signaling pathways related to survival and is a potential biomarker of poor prognosis in cancer (Zou and Kumar 2018). In recent years, cannabinoids (CB) have received increasing attention due to their effects on cancer growth. CB2 agonists (JWH-015; JWH-133) have been proved to reduce the size of breast cancer tumors (Blanton et al., 2022). In triple-negative breast cancer (TNBC), CNR1 regulates fatty acid metabolism by modulating the PI3K-AKT/MAPK signaling pathways, thereby affecting the sensitivity of cells toward ferroptosis (Li et al., 2022). Moreover, the combined use of CNR1 antagonists and ferroptosis inducers has demonstrated good anti-tumor effects in TNBC (Li et al., 2022). In studies on the association between liver metabolism and tumors, the activation of CNR1 can specifically induce the expression of the CREBH gene through the phosphorylation of the JNK signaling pathway and the binding of c-Jun to the AP-1 in the promoter of the CREBH and then regulating hepatic gluconeogenesis (Chanda et al., 2011). In neuroblastoma, this signaling pathway may also be involved in regulating the proliferation, metabolism, and other processes of tumor cells. Mu et al. compared 89 DEGs between MYCN amplification and non-amplification groups and suggested that CNR1 plays a prognostic role in NB, although they did not perform any verification experiments (Schmitt et al., 1986). Decock et al. applied two independent genome-wide methylation screening methods to eight NB cell lines and found that CNR1 methylation was associated with classical risk factors, including stage and MYCN status, but not with OS, EFS, or both (Decock et al., 2012). Although the bioinformatic analysis revealed an association between the NB stage and CNR1, remarkably different CNR1 expression levels were not observed in the clinical samples in our study. This may have been owing to tumor heterogeneity or the small sample size. Thus, further analyses are required to clarify the role of CNR1 as an independent prognostic biomarker.
MYCN gene amplification (defined as a copy number greater than 10-fold) is an internationally recognized molecular event in high-risk NB, and this alteration is present in approximately 20%–30% of cases (Qiu and Matthay, 2022). Clinical data indicate that the 5-year survival rate of patients with MYCN gene amplification is significantly lower than that of patients without it (Schwalbe et al., 2017). We used the predictive model constructed from the four DEGs to divide patients into high-risk and low-risk groups. We found that the positive amplification rate of the MYCN gene in the high-risk group was significantly higher than that in the low-risk one. This confirmed that this risk model was significantly correlated with the MYCN molecular type.
The chromosomal ploidy of NB is classified into near-diploid (Diploid) and near-triploid (Triploid). Near-diploid tumors are often accompanied by deletions or gains of chromosomal segments and are associated with MYCN amplification and a high risk of recurrence (Irwin et al., 2021). Near-triploid tumors are more common in infants, mostly low-risk babies, and may resolve spontaneously. Studies have shown that near-diploid tumors have higher genomic instability and are prone to accumulating MYCN amplification, leading to treatment resistance and recurrence (Benard et al., 2008). In this study, through performing Cox, ROC, and DCA analysis, we found that ploidy has independent prognostic value and can provide a more reliable basis for clinical decision-making in NB. Currently, the International Neuroblastoma Risk Group (INRG) system has integrated factors such as MYCN amplification, patient age, tumor stage, and ploidy to guide NB treatment. Intervention strategies targeting the MYCN gene include the following three aspects: (i) directly interfering with MYCN transcription, for instance, using peroxisome proliferator-activated receptor γ (PPAR-γ) antagonists to induce cell differentiation by inhibiting MYCN expression (Nakao-Ise et al., 2023); (ii) metabolic intervention: aldehyde dehydrogenase 18 family member A1 (ALDH18A1) inhibitors can block the MYCN-metabolic feedback loop and have shown significant efficacy in animal models (Guo et al., 2020); (iii) epigenetic regulation: histone deacetylase inhibitors or DNA methyltransferase inhibitors can reverse the epigenetic silencing driven by MYCN (Eppet et al., 2023). Due to the synergistic effect between ploidy and MYCN amplification (Park et al., 2012), multi-omics integration analysis, as well as studies combining MYCN inhibitors with immune checkpoint inhibitors (ICIs), have shown therapeutic potential in long-term follow-up (van Tilburg et al., 2020). In the future, multi-dimensional molecular stratification and targeted intervention will be applied to improve the survival outcomes of high-risk patients.
Immunotherapy has been proved to be an effective treatment for solid tumors in adults (Anderson et al., 2022). However, evaluations of tumor mutational burden have shown that neuroblastoma ranks first among human cancers with the fewest mutations, and it also has the lowest infiltration of immune cells (Anderson et al., 2022). Therefore, due to the “cold” state of NB in terms of immunity and mutation, its immunotherapy seems to have reached a bottleneck (Grobner et al., 2018). Fortunately, the inherent immune evasion mechanism of neuroblastoma is similar to that of adult tumors (Wienke et al., 2021). Anderson et al. mentioned that the immunotherapy of NB should not only focus on increasing tumor antigenicity; addressing the problem of the tumor immunosuppressive microenvironment is also crucial (Anderson et al., 2022).
In the present work, after evaluating the infiltration of immune cells in high- and low-risk patients using the established model, we observed that the infiltration of immune cells in these two groups was different: the numbers of macrophage M0, plasma cells, follicular helper T cells, and Tregs in the high-risk cohort were significantly higher than in the low-risk group. Research by Zhang et al. showed that the infiltration degree of M0 macrophages in hepatocellular carcinoma tissues was remarkably higher than that in normal liver tissues (Zhang et al., 2022), which was consistent with our results. Together with our findings, these results indicate that macrophage infiltration is related to poor prognosis, and immunotherapy may be effective because macrophages can enhance phagocytosis of tumors in high-risk NB. M2 macrophages, which are polarized from M0 macrophages, can release cytokines and chemokines such as transforming growth factor-β (TGF-β), vascular endothelial growth factor (VEGF), and indoleamine-2,3-dioxygenase (IDO). These inhibitory factors substances could suppress the anti-tumor immune response (Iolascon et al., 2000). Meanwhile, these substances will recruit plasma cells and Tregs into the tumor microenvironment, where they directly kill effector T cells or inhibit their functions and facilitate tumor cells escaping immune surveillance (Anderson et al., 2022). Kang et al. reported that the proportion of follicular helper T cells was higher in the high-risk cohorts than in the low-risk NB group (Kang et al., 2021). Mei et al. used single-cell RNA-seq to conduct a comparative analysis of patients with and without metastasis and observed macrophage enrichment, T-cell exhaustion, and increased numbers of Tregs (Mei et al., 2024). Methods need to be found to inhibit the functions or reduce the number of regulatory T cells to break the immunosuppressive state. However, relevant research is still under exploration (Anderson et al., 2022; Zhu et al., 2023).
Cancer immunotherapy has achieved remarkable success due to the application of immune checkpoint inhibitors (ICI) in the treatment of adult tumors and pediatric hematological malignancies (Davis et al., 2017). However, in contrast, most children with solid tumors, including high-risk neuroblastoma, have hardly benefited from ICI (Anderson et al., 2022). Using the model we established, the patients were divided into high- and low-risk groups. We found that the upregulated lymphocyte activation gene 3 (LAG3) was significantly upregulated in the high-risk cohort. It has been observed that the LAG3 gene exerts an inhibitory function on antigen-activated T cells (Camisaschi et al., 2010). In addition to LAG3, two other important checkpoint molecules expressed by tumor cells, namely, the PD-L1 ligand (CD274) and its paralog PDCD1LG2, were significantly decreased in the high-risk groups. By suppressing the expression of PD-L1, tumor cells weaken the signals transmitted to immune cells, thus facilitating tumor escape (Mezzadra et al., 2017). Tang et al. studied the mechanism of PD-1 blockade therapy and found that macrophages are important effector cells in anti-high-risk NB immunity (Tang et al., 2022). PD-1 blockade can lead to the exhaustion of macrophages, a decrease in their phagocytic potency, a reduction in tumor growth, and an increase in survival in mouse models of NB in a macrophage-dependent manner (Gordon et al., 2017). Recent studies have focused on optimizing existing GD2 antibodies, developing novel bispecific antibodies or chimeric antigen receptor T cell (CAR-T) therapies, and exploring the combined application of ICI (NCT05437315, NCT02914405, etc.). Although the efficacy of a single ICI is limited, combined regimens (such as anti-GD2 + anti-PD-1) and novel immunomodulatory strategies are showing potential in clinical application (Kennedy et al., 2023). Immunotherapy combined with chemotherapy has been added to the standard treatment regimen recommended for relapsed or refractory neuroblastoma (Anderson et al., 2022). It will be necessary to verify the safety and long-term efficacy of these therapies through clinical trials. The findings related to immune cell infiltration and checkpoints in this study are expected to serve as targets for drug development, aiming to restore the functions of immune cells that have been damaged during chemotherapy.
Limitations
This study had several limitations. First, the main sources of clinical information, the online databases, are limited and incomplete; some biological factors, such as individual therapeutic regimens, cannot be obtained. Second, limited by the current research conditions, the verification of the biological functions was only performed in vivo. It is recommended that in further studies, the cancer-promoting mechanisms of these genes should be preferentially verified in vitro.
Conclusion
Our study proposes an INSS stage-related risk model that combines genetic and clinical characteristics to predict the prognosis of patients with NB. Four prognostic genes (CNR1, PRKACB, CDKN3, and PCLAF) were identified, and a prognostic model based on these genes was developed that provides novel insights into the prognostic evaluation of neuroblastoma. In clinical applications, the diversity of biomarkers and their implication on clinical features can facilitate the formation of targeted therapeutic strategies and the development of individualized immunotherapy regimens.
Data availability statement
The raw data supporting the conclusions of this article will be made available by the authors, without undue reservation.
Ethics statement
The studies involving humans were approved by the Ethics Committee of Hebei Children’s Hospital. The studies were conducted in accordance with the local legislation and institutional requirements. Written informed consent for participation in this study was provided by the participants’ legal guardians/next of kin. Written informed consent was obtained from the individual(s), and minor(s)’ legal guardian/next of kin, for the publication of any potentially identifiable images or data included in this article.
Author contributions
CQ: conceptualization, data curation, resources, software, and writing – original draft. ZZ: formal analysis, methodology, project administration, software, supervision, and writing – review and editing. YQ: data curation, investigation, methodology, project administration, and writing – review and editing. YZ: data curation, formal analysis, writing – review and editing, conceptualization, and project administration. FY: conceptualization, funding acquisition, validation, and writing – review and editing. HN: data curation, methodology, project administration, and writing – review and editing. GD: conceptualization, resources, supervision, and writing – review and editing. ZZ: conceptualization, data curation, formal analysis, funding acquisition, software, and writing – review and editing. LW: data curation, formal analysis, methodology, resources, validation, visualization, and writing – review and editing.
Funding
The author(s) declare that financial support was received for the research and/or publication of this article. This work was supported by the Clinical Medicine Talent Training Project funded by the Hebei government (ZF2024183 and ZF2025308), People’s Government of Hebei Province.
Conflict of interest
The authors declare that the research was conducted in the absence of any commercial or financial relationships that could be construed as a potential conflict of interest.
Generative AI statement
The author(s) declare that no Generative AI was used in the creation of this manuscript.
Publisher’s note
All claims expressed in this article are solely those of the authors and do not necessarily represent those of their affiliated organizations, or those of the publisher, the editors and the reviewers. Any product that may be evaluated in this article, or claim that may be made by its manufacturer, is not guaranteed or endorsed by the publisher.
Supplementary material
The Supplementary Material for this article can be found online at: https://www.frontiersin.org/articles/10.3389/fcell.2025.1502380/full#supplementary-material
SUPPLEMENTARY FIGURE S1 | The PPI network showed a total of 55 genes were considered as candidate genes in the three clusters.
SUPPLEMENTARY FIGURE S2 | The top 20 drugs include AS605240_224, AST_1306_381, AZD7762_1022 et al.
Abbreviations
ALI, advanced lung cancer inflammation index; AUC, area under the curve; CDKN3, cyclin-dependent kinase inhibitor 3; COG, Children’s Oncology Group; CNR1, cannabinoid receptor-1; DEG, differentially expressed gene; GEO, Gene Expression Omnibus; INSS, International Neuroblastoma Staging System; KAP, kinase-associated phosphatase; LASSO, least absolute shrinkage and selection operator; NB, neuroblastoma; PCLAF, proliferating cell nuclear antigen-clamp associated factor; PCNA, proliferating cell nuclear antigen; PPI, protein–protein interaction; PRKACB, protein kinase cAMP-dependent catalytic subunit β; ROC, receiver operating characteristic; TARGET, Therapeutically Applicable Research to Generate Effective Treatments; LASSO, least absolute shrinkage and selection operator.
References
Ahmed, M. B., Alghamdi, A. A. A., Islam, S. U., Lee, J. S., and Lee, Y. S. (2022). cAMP signaling in cancer: a PKA-CREB and EPAC-centric approach. Cells 11, 2020. doi:10.3390/cells11132020
Akter, J., and Kamijo, T. (2021). How do telomere abnormalities regulate the biology of neuroblastoma? Biomolecules 11, 1112. doi:10.3390/biom11081112
Anderson, J., Majzner, R. G., and Sondel, P. M. (2022). 'Immunotherapy of neuroblastoma: facts and hopes. Clin. Cancer Res. 28, 3196–3206. doi:10.1158/1078-0432.CCR-21-1356
Benard, J., Raguenez, G., Kauffmann, A., Valent, A., Ripoche, H., Joulin, V., et al. (2008). MYCN-non-amplified metastatic neuroblastoma with good prognosis and spontaneous regression: a molecular portrait of stage 4S. Mol. Oncol. 2, 261–271. doi:10.1016/j.molonc.2008.07.002
Blanton, H. L., McHann, M. C., De Selle, H., Dancel, C. L., Redondo, J. L., Molehin, D., et al. (2022). Chronic administration of cannabinoid receptor 2 agonist (JWH-133) increases ectopic ovarian tumor growth and endocannabinoids (anandamide and 2-arachidonoyl glycerol) levels in immunocompromised SCID female mice. Front. Pharmacol. 13, 823132. doi:10.3389/fphar.2022.823132
Brodeur, G. M., Pritchard, J., Berthold, F., Carlsen, N. L., Castel, V., Castelberry, R. P., et al. (1993). Revisions of the international criteria for neuroblastoma diagnosis, staging, and response to treatment. J. Clin. Oncol. 11, 1466–1477. doi:10.1200/JCO.1993.11.8.1466
Camisaschi, C., Casati, C., Rini, F., Perego, M., De Filippo, A., Triebel, F., et al. (2010). LAG-3 expression defines a subset of CD4(+)CD25(high)Foxp3(+) regulatory T cells that are expanded at tumor sites. J. Immunol. 184, 6545–6551. doi:10.4049/jimmunol.0903879
Chanda, D., Kim, D. K., Li, T., Kim, Y. H., Koo, S. H., Lee, C. H., et al. (2011). 'Cannabinoid receptor type 1 (CB1R) signaling regulates hepatic gluconeogenesis via induction of endoplasmic reticulum-bound transcription factor cAMP-responsive element-binding protein H (CREBH) in primary hepatocytes. J. Biol. Chem. 286, 27971–27979. doi:10.1074/jbc.M111.224352
Chen, Y., Gao, Y., Tian, Y., and Tian, D. L. (2013). PRKACB is downregulated in non-small cell lung cancer and exogenous PRKACB inhibits proliferation and invasion of LTEP-A2 cells. Oncol. Lett. 5, 1803–1808. doi:10.3892/ol.2013.1294
Dai, W., Miao, H., Fang, S., Fang, T., Chen, N., and Li, M. (2016). CDKN3 expression is negatively associated with pathological tumor stage and CDKN3 inhibition promotes cell survival in hepatocellular carcinoma. Mol. Med. Rep. 14, 1509–1514. doi:10.3892/mmr.2016.5410
Davis, K. L., Agarwal, A. M., and Verma, A. R. (2017). Checkpoint inhibition in pediatric hematologic malignancies. Pediatr. Hematol. Oncol. 34, 379–394. doi:10.1080/08880018.2017.1383542
Decock, A., Ongenaert, M., Hoebeeck, J., De Preter, K., Van Peer, G., Van Criekinge, W., et al. (2012). 'Genome-wide promoter methylation analysis in neuroblastoma identifies prognostic methylation biomarkers. Genome Biol. 13, R95. doi:10.1186/gb-2012-13-10-r95
Ding, L., Cao, J., Lin, W., Chen, H., Xiong, X., Ao, H., et al. (2020). The roles of cyclin-dependent kinases in cell-cycle progression and therapeutic strategies in human breast cancer. Int. J. Mol. Sci. 21, 1960. doi:10.3390/ijms21061960
Epp, S., Chuah, S. M., and Halasz, M. (2023). Epigenetic dysregulation in MYCN-amplified neuroblastoma. Int. J. Mol. Sci. 24, 17085. doi:10.3390/ijms242317085
Fan, H., Xia, S., Xiang, J., Li, Y., Ross, M. O., Lim, S. A., et al. (2023). Trans-vaccenic acid reprograms CD8(+) T cells and anti-tumour immunity. Nature 623, 1034–1043. doi:10.1038/s41586-023-06749-3
Fan, X., Lu, H. T., Hou, L., Zhang, L., Yang, B. Y., Chen, W. M., et al. (2020). A comprehensive analysis of potential prognostic biomarkers for MYCN-amplified neuroblastoma. Zhongguo Dang Dai Er Ke Za Zhi 22, 262–268. doi:10.7499/j.issn.1008-8830.2020.03.015
Feng, L., Li, S., Wang, C., and Yang, J. (2023). Current status and future perspective on molecular imaging and treatment of neuroblastoma. Semin. Nucl. Med. 53, 517–529. doi:10.1053/j.semnuclmed.2022.12.004
Friedman, J., Hastie, T., and Tibshirani, R. (2010). Regularization paths for generalized linear models via coordinate descent. J. Stat. Softw. 33, 1–22. doi:10.18637/jss.v033.i01
Furuta, K., Arao, T., Sakai, K., Kimura, H., Nagai, T., Tamura, D., et al. (2012). Integrated analysis of whole genome exon array and array-comparative genomic hybridization in gastric and colorectal cancer cells. Cancer Sci. 103, 221–227. doi:10.1111/j.1349-7006.2011.02132.x
Galardi, A., Colletti, M., Businaro, P., Quintarelli, C., Locatelli, F., and Di Giannatale, A. (2018). MicroRNAs in neuroblastoma: biomarkers with therapeutic potential. Curr. Med. Chem. 25, 584–600. doi:10.2174/0929867324666171003120335
Glembocki, A. I., and Somers, G. R. (2024). Prognostic and predictive biomarkers in paediatric solid tumours. Pathology 56, 283–296. doi:10.1016/j.pathol.2023.11.007
Gordon, S. R., Maute, R. L., Dulken, B. W., Hutter, G., George, B. M., McCracken, M. N., et al. (2017). PD-1 expression by tumour-associated macrophages inhibits phagocytosis and tumour immunity. Nature 545, 495–499. doi:10.1038/nature22396
Grobner, S. N., Worst, B. C., Weischenfeldt, J., Buchhalter, I., Kleinheinz, K., Rudneva, V. A., et al. (2018). The landscape of genomic alterations across childhood cancers. Nature 555, 321–327. doi:10.1038/nature25480
Guo, Y. F., Duan, J. J., Wang, J., Li, L., Wang, D., Liu, X. Z., et al. (2020). Inhibition of the ALDH18A1-MYCN positive feedback loop attenuates MYCN-amplified neuroblastoma growth. Sci. Transl. Med. 12, eaax8694. doi:10.1126/scitranslmed.aax8694
Hansen, J. N., Li, X., Zheng, Y. G., Lotta, L. T., Dedhe, A., and Schor, N. F. (2017). Using chemistry to target neuroblastoma. ACS Chem. Neurosci. 8, 2118–2123. doi:10.1021/acschemneuro.7b00258
Hanzelmann, S., Castelo, R., and Guinney, J. (2013). GSVA: gene set variation analysis for microarray and RNA-seq data. BMC Bioinforma. 14, 7. doi:10.1186/1471-2105-14-7
Hernandez-Lemus, E., Reyes-Gopar, H., Espinal-Enriquez, J., and Ochoa, S. (2019). The many faces of gene regulation in cancer: a computational oncogenomics outlook. Genes (Basel) 10, 865. doi:10.3390/genes10110865
Huang, Z., Zhou, L., Duan, J., Qin, S., Jiang, J., Chen, H., et al. (2024). Oxidative stress promotes liver cancer metastasis via RNF25-mediated E-cadherin protein degradation. Adv. Sci. (Weinh) 11, e2306929. doi:10.1002/advs.202306929
Iolascon, A., Giordani, L., Borriello, A., Carbone, R., Izzo, A., Tonini, G. P., et al. (2000). Reduced expression of transforming growth factor-beta receptor type III in high stage neuroblastomas. Br. J. Cancer 82, 1171–1176. doi:10.1054/bjoc.1999.1058
Irwin, M. S., Naranjo, A., Zhang, F. F., Cohn, S. L., London, W. B., Gastier-Foster, J. M., et al. (2021). 'Revised neuroblastoma risk classification system: a report from the Children's oncology group. J. Clin. Oncol. 39, 3229–3241. doi:10.1200/JCO.21.00278
Irwin, M. S., and Park, J. R. (2015). Neuroblastoma: paradigm for precision medicine. Pediatr. Clin. North Am. 62, 225–256. doi:10.1016/j.pcl.2014.09.015
Kang, W., Hu, J., Zhao, Q., and Song, F. (2021). Identification of an autophagy-related risk signature correlates with immunophenotype and predicts immune checkpoint blockade efficacy of neuroblastoma. Front. Cell Dev. Biol. 9, 731380. doi:10.3389/fcell.2021.731380
Keane, S., Martinsson, T., Kogner, P., and Ejeskar, K. (2021). The loss of DLG2 isoform 7/8, but not isoform 2, is critical in advanced staged neuroblastoma. Cancer Cell Int. 21, 170. doi:10.1186/s12935-021-01851-w
Kembhavi, S. A., Shah, S., Rangarajan, V., Qureshi, S., Popat, P., and Kurkure, P. (2015). Imaging in neuroblastoma: an update. Indian J. Radiol. Imaging 25, 129–136. doi:10.4103/0971-3026.155844
Kennedy, P. T., Zannoupa, D., Son, M. H., Dahal, L. N., and Woolley, J. F. (2023). Neuroblastoma: an ongoing cold front for cancer immunotherapy. J. Immunother. Cancer 11, e007798. doi:10.1136/jitc-2023-007798
Li, P., Lin, Q., Sun, S., Yang, N., Xia, Y., Cao, S., et al. (2022). Inhibition of cannabinoid receptor type 1 sensitizes triple-negative breast cancer cells to ferroptosis via regulating fatty acid metabolism. Cell Death Dis. 13, 808. doi:10.1038/s41419-022-05242-5
Li, S., Xue, P., Diao, X., Fan, Q. Y., Ye, K., Tang, X. M., et al. (2023). Identification and validation of functional roles for three MYC-associated genes in hepatocellular carcinoma. J. Adv. Res. 54, 133–146. doi:10.1016/j.jare.2023.01.010
Lin, W. R., Lai, M. W., and Yeh, C. T. (2013). Cyclin-dependent kinase-associated protein phosphatase is overexpressed in alcohol-related hepatocellular carcinoma and influences xenograft tumor growth. Oncol. Rep. 29, 903–910. doi:10.3892/or.2012.2208
Liu, L. J., Liao, J. M., and Zhu, F. (2021). Proliferating cell nuclear antigen clamp associated factor, a potential proto-oncogene with increased expression in malignant gastrointestinal tumors. World J. Gastrointest. Oncol. 13, 1425–1439. doi:10.4251/wjgo.v13.i10.1425
Liu, X., Cai, Y., Cheng, C., Gu, Y., Hu, X., Chen, K., et al. (2022a). PCLAF promotes neuroblastoma G1/S cell cycle progression via the E2F1/PTTG1 axis. Cell Death Dis. 13, 178. doi:10.1038/s41419-022-04635-w
Liu, X., Cheng, C., Cai, Y., Gu, Y., Wu, Y., Chen, K., et al. (2022b). 'Pan-cancer analyses reveal the regulation and clinical outcome association of PCLAF in human tumors. Int. J. Oncol. 60, 66. doi:10.3892/ijo.2022.5356
Love, M. I., Huber, W., and Anders, S. (2014). Moderated estimation of fold change and dispersion for RNA-seq data with DESeq2. Genome Biol. 15, 550. doi:10.1186/s13059-014-0550-8
Maris, J. M., Hogarty, M. D., Bagatell, R., and Cohn, S. L. (2007). 'Neuroblastoma. Lancet 369, 2106–2120. doi:10.1016/S0140-6736(07)60983-0
Matthay, K. K., Maris, J. M., Schleiermacher, G., Nakagawara, A., Mackall, C. L., Diller, L., et al. (2016). 'Neuroblastoma. Nat. Rev. Dis. Prim. 2, 16078. doi:10.1038/nrdp.2016.78
Mei, S., Alchahin, A. M., Embaie, B. T., Gavriliuc, I. M., Verhoeven, B. M., Zhao, T., et al. (2024). Single-cell analyses of metastatic bone marrow in human neuroblastoma reveals microenvironmental remodeling and metastatic signature. JCI Insight 9, e173337. doi:10.1172/jci.insight.173337
Mezzadra, R., Sun, C., Jae, L. T., Gomez-Eerland, R., de Vries, E., Wu, W., et al. (2017). Identification of CMTM6 and CMTM4 as PD-L1 protein regulators. Nature 549, 106–110. doi:10.1038/nature23669
Nakao-Ise, Y., Narita, T., Miyamoto, S., Watanabe, M., Tanaka, T., Sowa, Y., et al. (2023). Induction of MYCN-amplified neuroblastoma differentiation through NMYC suppression using PPAR-gamma antagonist. J. Clin. Biochem. Nutr. 73, 191–197. doi:10.3164/jcbn.23-28
Naranjo, A., Irwin, M. S., Hogarty, M. D., Cohn, S. L., Park, J. R., and London, W. B. (2018). Statistical framework in support of a revised Children's oncology group neuroblastoma risk classification system. JCO Clin. Cancer Inf. 2, 1–15. doi:10.1200/CCI.17.00140
Park, A. K., Lee, S. J., Phi, J. H., Wang, K. C., Kim, D. G., Cho, B. K., et al. (2012). Prognostic classification of pediatric medulloblastoma based on chromosome 17p loss, expression of MYCC and MYCN, and Wnt pathway activation. Neuro Oncol. 14, 203–214. doi:10.1093/neuonc/nor196
Pizzo, P. A., Poplack, D. G., Adamson, P. C., Blaney, S. M., and Helman, L. J. (2015). Principles and practice of pediatric Oncology. Philadelphia, PA: Wolters Kluwer. Available online at: https://hsrc.himmelfarb.gwu.edu/books/2/.
Qi, C., Zhou, Y., Hu, Z., Niu, H., Yue, F., An, H., et al. (2022). The prognostic value of the advanced lung cancer inflammation index (ALI) for patients with neuroblastoma. J. Int. Med. Res. 50, 3000605221109382. doi:10.1177/03000605221109382
Qiu, B., and Matthay, K. K. (2022). Advancing therapy for neuroblastoma. Nat. Rev. Clin. Oncol. 19, 515–533. doi:10.1038/s41571-022-00643-z
Raitio, A., Rice, M. J., Mullassery, D., and Losty, P. D. (2021). Stage 4S neuroblastoma: what are the outcomes? A systematic review of published studies. Eur. J. Pediatr. Surg. 31, 385–389. doi:10.1055/s-0040-1716836
Ritchie, M. E., Phipson, B., Wu, D., Hu, Y., Law, C. W., Shi, W., et al. (2015). 'limma powers differential expression analyses for RNA-sequencing and microarray studies. Nucleic Acids Res. 43, e47. doi:10.1093/nar/gkv007
Salemi, F., Alam, W., Hassani, M. S., Hashemi, S. Z., Jafari, A. A., Mirmoeeni, S. M. S., et al. (2022). Neuroblastoma: essential genetic pathways and current therapeutic options. Eur. J. Pharmacol. 926, 175030. doi:10.1016/j.ejphar.2022.175030
Satam, H., Joshi, K., Mangrolia, U., Waghoo, S., Zaidi, G., Rawool, S., et al. (2023). 'Next-Generation sequencing Technology: current trends and advancements. Biol. (Basel) 12, 997. doi:10.3390/biology12070997
Schmitt, H. P., Kuhn, B., and Alonso, A. (1986). Characterization of cloned sequences complementary to F9 cell double-stranded RNA and their expression during differentiation. Differentiation 30, 205–210. doi:10.1111/j.1432-0436.1986.tb00782.x
Schwalbe, E. C., Lindsey, J. C., Nakjang, S., Crosier, S., Smith, A. J., Hicks, D., et al. (2017). Novel molecular subgroups for clinical classification and outcome prediction in childhood medulloblastoma: a cohort study. Lancet Oncol. 18, 958–971. doi:10.1016/S1470-2045(17)30243-7
Secomandi, E., Salwa, A., Vidoni, C., Ferraresi, A., Follo, C., and Isidoro, C. (2022). High expression of the lysosomal protease cathepsin D confers better prognosis in neuroblastoma patients by contrasting EGF-induced neuroblastoma cell growth. Int. J. Mol. Sci. 23, 4782. doi:10.3390/ijms23094782
Shao, F., Wang, Z., and Wang, S. (2021). Identification of MYCN-related gene as a potential biomarker for neuroblastoma prognostic model by integrated analysis and quantitative real-time PCR. DNA Cell Biol. 40, 332–347. doi:10.1089/dna.2020.6193
Shawraba, F., Hammoud, H., Mrad, Y., Saker, Z., Fares, Y., Harati, H., et al. (2021). Biomarkers in neuroblastoma: an insight into their potential diagnostic and prognostic utilities. Curr. Treat. Options Oncol. 22, 102. doi:10.1007/s11864-021-00898-1
Shohet, J. M., Lowas, S. R., and Nuchtern, J. G. (2021). “Treatment and prognosis of neuroblastoma.” In.
Soberg, K., Moen, L. V., Skalhegg, B. S., and Laerdahl, J. K. (2017). 'Evolution of the cAMP-dependent protein kinase (PKA) catalytic subunit isoforms. PLoS One 12, e0181091. doi:10.1371/journal.pone.0181091
Sokol, E., and Desai, A. V. (2019). The evolution of risk classification for neuroblastoma. Child. (Basel) 6, 27. doi:10.3390/children6020027
Tang, X. X., Shimada, H., and Ikegaki, N. (2022). Macrophage-mediated anti-tumor immunity against high-risk neuroblastoma. Genes Immun. 23, 129–140. doi:10.1038/s41435-022-00172-w
Tao, R., Li, C., Jaffe, A. E., Shin, J. H., Deep-Soboslay, A., Yamin, R., et al. (2020). Cannabinoid receptor CNR1 expression and DNA methylation in human prefrontal cortex, hippocampus and caudate in brain development and schizophrenia. Transl. Psychiatry 10, 158. doi:10.1038/s41398-020-0832-8
Tolbert, V. P., and Matthay, K. K. (2018). Neuroblastoma: clinical and biological approach to risk stratification and treatment. Cell Tissue Res. 372, 195–209. doi:10.1007/s00441-018-2821-2
Trigg, R. M., Shaw, J. A., and Turner, S. D. (2019). 'Opportunities and challenges of circulating biomarkers in neuroblastoma. Open Biol. 9, 190056. doi:10.1098/rsob.190056
van Tilburg, C. M., Witt, R., Heiss, M., Pajtler, K. W., Plass, C., Poschke, I., et al. (2020). INFORM2 NivEnt: the first trial of the INFORM2 biomarker driven phase I/II trial series: the combination of nivolumab and entinostat in children and adolescents with refractory high-risk malignancies. BMC Cancer 20, 523. doi:10.1186/s12885-020-07008-8
Vernaza, A., Cardus, D. F., Smith, J. L., Partridge, V., Baker, A. L., Lewis, E. G., et al. (2024). Identification of CDKN3 as a key gene that regulates neuroblastoma cell differentiation. J. Cancer 15, 1153–1168. doi:10.7150/jca.89660
Wienke, J., Dierselhuis, M. P., Tytgat, G. A. M., Kunkele, A., Nierkens, S., and Molenaar, J. J. (2021). The immune landscape of neuroblastoma: challenges and opportunities for novel therapeutic strategies in pediatric oncology. Eur. J. Cancer 144, 123–150. doi:10.1016/j.ejca.2020.11.014
Wu, J., Li, L., Zhang, H., Zhao, Y., Zhang, H., Wu, S., et al. (2021a). A risk model developed based on tumor microenvironment predicts overall survival and associates with tumor immunity of patients with lung adenocarcinoma. Oncogene 40, 4413–4424. doi:10.1038/s41388-021-01853-y
Wu, T., Hu, E., Xu, S., Chen, M., Guo, P., Dai, Z., et al. (2021b). clusterProfiler 4.0: a universal enrichment tool for interpreting omics data. Innov. (Camb) 2, 100141. doi:10.1016/j.xinn.2021.100141
Yang, X. H., Tang, F., Shin, J., and Cunningham, J. M. (2017). A c-Myc-regulated stem cell-like signature in high-risk neuroblastoma: a systematic discovery (Target neuroblastoma ESC-like signature). Sci. Rep. 7, 41. doi:10.1038/s41598-017-00122-x
Yao, X., Hu, W., Zhang, J., Huang, C., Zhao, H., and Yao, X. (2020). Application of cAMP-dependent catalytic subunit beta (PRKACB) low expression in predicting worse overall survival: a potential therapeutic target for colorectal carcinoma. J. Cancer 11, 4841–4850. doi:10.7150/jca.46156
Zafar, A., Wang, W., Liu, G., Wang, X., Xian, W., McKeon, F., et al. (2021). Molecular targeting therapies for neuroblastoma: progress and challenges. Med. Res. Rev. 41, 961–1021. doi:10.1002/med.21750
Zhang, Y., Zou, J., and Chen, R. (2022). An M0 macrophage-related prognostic model for hepatocellular carcinoma. BMC Cancer 22, 791. doi:10.1186/s12885-022-09872-y
Zheng, C., Liu, S., Feng, J., and Zhao, X. (2020). Prognostic value of inflammation biomarkers for survival of patients with neuroblastoma. Cancer Manag. Res. 12, 2415–2425. doi:10.2147/CMAR.S245622
Zhu, A., Li, X., and Wang, J. (2023). Integrating bulk-seq and single-cell-seq reveals disulfidptosis potential index associating with neuroblastoma prognosis and immune infiltration. J. Cancer Res. Clin. Oncol. 149, 16647–16658. doi:10.1007/s00432-023-05392-9
Keywords: neuroblastoma, prognosis, biomarkers, INSS stage, pediatric
Citation: Qi C, Zhao Z, Qi Y, Zhou Y, Yue F, Niu H, Duan G, Zhong Z and Wang L (2025) Identification and verification of international neuroblastoma staging system (INSS) stage-related genes as potential biomarkers for neuroblastoma prognostic models. Front. Cell Dev. Biol. 13:1502380. doi: 10.3389/fcell.2025.1502380
Received: 28 September 2024; Accepted: 06 March 2025;
Published: 15 April 2025.
Edited by:
Jianhua Luo, University of Pittsburgh, United StatesReviewed by:
Ayse Banu Demir, İzmir University of Economics, TürkiyeJingchao Wang, Harvard Medical School, United States
Copyright © 2025 Qi, Zhao, Qi, Zhou, Yue, Niu, Duan, Zhong and Wang. This is an open-access article distributed under the terms of the Creative Commons Attribution License (CC BY). The use, distribution or reproduction in other forums is permitted, provided the original author(s) and the copyright owner(s) are credited and that the original publication in this journal is cited, in accordance with accepted academic practice. No use, distribution or reproduction is permitted which does not comply with these terms.
*Correspondence: Le Wang, bHVrYV93bEAxNjMuY29t
†These authors have contributed equally to this work