- 1Division of Molecular and Medical Genetics, Center for Gene and Cell Therapy, The Institute of Medical Science, The University of Tokyo, Tokyo, Japan
- 2Division of Cell and Gene Therapy, Nippon Medical School, Tokyo, Japan
- 3Division of Oral and Maxillofacial Surgical, Tokyo Women’s Medical School, Tokyo, Japan
- 4Division of Genetics, The Institute of Medical Science, The University of Tokyo, Tokyo, Japan
Introduction: Duchenne muscular dystrophy (DMD) is a genetic disorder caused by mutations in the dystrophin-encoding gene that leads to muscle necrosis and degeneration with chronic inflammation during growth, resulting in progressive generalized weakness of the skeletal and cardiac muscles. We previously demonstrated the therapeutic effects of systemic administration of dental pulp mesenchymal stromal cells (DPSCs) in a DMD animal model. We showed preservation of long-term muscle function and slowing of disease progression. However, little is known regarding the effects of cell therapy on the metabolic abnormalities in DMD. Therefore, here, we aimed to investigate the mechanisms underlying the immunosuppressive effects of DPSCs and their influence on DMD metabolism.
Methods: A comprehensive metabolomics-based approach was employed, and an ingenuity pathway analysis was performed to identify dystrophy-specific metabolomic impairments in the mdx mice to assess the therapeutic response to our established systemic DPSC-mediated cell therapy approach.
Results and Discussion: We identified DMD-specific impairments in metabolites and their responses to systemic DPSC treatment. Our results demonstrate the feasibility of the metabolomics-based approach and provide insights into the therapeutic effects of DPSCs in DMD. Our findings could help to identify molecular marker targets for therapeutic intervention and predict long-term therapeutic efficacy.
1 Introduction
Duchenne muscular dystrophy (DMD) is an X-linked disorder triggered by primary abnormalities in the DMD gene that causes degenerative myopathy with secondary inflammation and necrotizing phase. Mutations in the dystrophin-encoding gene lead to dystrophin–glycoprotein complex deficiency in the sarcolemma, which leads to progressive degeneration/regeneration cycles in the striated muscle, manifesting as muscle weakness and eventual skeletal muscle atrophy (Ervasti et al., 1990; Campbell, 1995). In addition to the main symptoms of myopathy, patients often experience complications, such as endocrine metabolic disorders. As metabolic alterations also play a dominating influential role in the initiation and progression of various inherited or acquired diseases, abnormal metabolic function has been described as a part of the physiological challenges of DMD. Loss of dystrophin, the large membrane cytoskeletal protein, results in multiple systemic alterations, including extensive changes in energy production, in both patients (Boca et al., 2016; Srivastava et al., 2016; Spitali et al., 2018) and genetic animal models of DMD (Guiraud et al., 2015; Joseph et al., 2018; Lee-McMullen et al., 2019). Classically, creatine kinase (CK) released from leaked muscle tissue membranes, which is elevated in patients and animal models, is widely used as a clinical blood biomarker of DMD. However, its levels are highly variable and do not reflect the degree of muscle atrophy because they gradually decline and are no longer correlated with the severity of the disease.
Various studies have focused on metabolic alterations in the skeletal muscles (Dabaj et al., 2021; Merckx et al., 2022), cardiac muscles (Khairallah et al., 2007), brain (Tracey et al., 1996), and serum or plasma (Spitali et al., 2018; Xu et al., 2023) derived from patients with DMD, animal models, animals with Golden retriever muscular dystrophy (GRMD) (Abdullah et al., 2017), and mdx mice (Tsonaka et al., 2020).
MSCs are isolated from several organs, such as bone-marrow (Friedenstein et al., 1968), adipose tissue (Zannettino et al., 2008), amnion (Tsai et al., 2004), dental pulp (Zhang et al., 2008), peripheral blood (He et al., 2007), and cord blood (Oh et al., 2008) express several common cell surface antigenic markers, e.g., CD44, CD73, CD90, and CD105, and low levels of major histocompatibility complex class I molecules. They do not express hematopoietic markers CD34 or CD45 (Friedenstein et al., 1968). Dental pulp stem cells (DPSCs) obtained from decidual tooth tissue are a less invasive cell source, and demonstrated multipotency (Zhang et al., 2008) as well as high proliferative and immunosuppressive activities (Jo et al., 2007). DPSCs can also modulate immune effectors, thereby affecting crucial processes such as cell development, maturation, and function, as well as reactive T-cell responses (Ozdemir et al., 2016). Because regulating severe inflammation in dystrophic muscles could prolong the duration of therapeutic effects, DPSCs are also attractive candidates for cell-based strategies that target diseases with chronic inflammation, including DMD (Ichim et al., 2010). We previously demonstrated the therapeutic effects of systemic administration of DPSCs in model dogs and mice, i.e., preservation of long-term muscle function and slowing of disease progression (Nitahara-Kasahara et al., 2021). However, the mechanisms underlying the immunosuppressive effects of DPSCs, including abnormal skeletal muscle metabolism, have not been sufficiently characterized.
Currently, little is known regarding the effects of cell therapy on the metabolic abnormalities in DMD. In this study, we aimed to identify dystrophy-specific metabolomic impairments and assess therapeutic responsiveness to systemic DPSC administration via a comprehensive metabolomics-based approach using CE and liquid chromatography-mass spectrometry (LC–MS/MS). We also aimed to investigate whether metabolite monitoring is an appropriate component of the therapeutic evaluation of DMD.
2 Materials and methods
2.1 Animals
Mdx mice have a premature stop mutation in the exon 23 of the murine Dmd gene, which results in failure to translate dystrophin. These mice mimic various aspects of the human disease (Bulfield et al., 1984; Sicinski et al., 1989). C57BL/6-background mdx mice were developed by Dr. T. Sasaoka (National Institute for Basic Biology, Aichi, Japan) and were maintained in our animal facility. Age-matched and untreated male mdx littermates (P30 and P90, n = 3; P60, n = 6) and wild-type C57BL/6 mice (P30 and P90, n = 3; P60, n = 6) were used as controls in these metabolic studies. All mice remained healthy in appearance, activity, and body weight throughout the observation period. All experiments were conducted in accordance with the protocols described in the experimental protocols approved by the Ethics Committee for the Treatment of Laboratory Animals at the Nippon Medical School and Institute of Medical Science. The same male littermates were housed together in individually ventilated cages, with four to six mice per cage. Each group of mice was randomly assigned to a cage. All mice were maintained under a regular 12-h light/12-h dark diurnal lighting cycle with ad libitum access to food and water.
2.2 Culture and transplantation of DPSCs into mice and sampling
DPSCs were provided by JCR Pharmaceuticals (Hyogo, Japan). The cells were cultured in DMEM (Thermo Fisher Scientific) supplemented with 10% fetal bovine serum (Thermo Fisher Scientific) and 1% antibiotic-antimycotic solution (Wako Pure Chemical Industries) at 37°C in a 5% CO2 atmosphere. The animals were randomly divided into two groups: control and MSC-treated groups. Systemic delivery of DPSCs (8.0 × 10⁵ cells/100 μL of PBS) into mdx mice via the tail vein was conducted using four injections (treated-mdx, n = 3, each) administered at an interval of 1 week, beginning at 4–5 weeks of age (body weight [BW] > 10 g), as previously reported (Nitahara-Kasahara et al., 2021). Age-matched male WT and mdx mice (n = 3 each) were used as controls. At the ages of 30-, 60-, and 90 days (P30, P60, and P90), the animals were euthanized by cervical cord dislocation, and tissues were excised for histological and molecular analysis.
2.3 Histopathological analysis
Muscle samples were collected from the DPSC-treated mice and immediately frozen in liquid nitrogen-cooled isopentane. Subsequently, 8-μm-thick transverse cryosections were prepared from the skeletal muscles and stained with hematoxylin and eosin (H&E) using standard procedures. Tissue sections were visualized using the IX71 or IX83 microscope (Olympus, Tokyo, Japan). Quantification of nuclear infiltration and collagen-stained areas was performed using the HALO image analysis software (Indica Labs, Corrales, MN, USA). The nucleic area (%) was calculated by dividing the nuclear infiltration area by the total area.
2.4 Enzyme-linked immunosorbent assay (ELISA)
Serum CK levels were determined using an ELISA mouse kit (Cloud-Clone, Corp., TX, USA) according to the manufacturer’s recommendations.
2.5 Metabolomic analysis
Plasma and skeletal muscle samples were collected from young (P30) and adult (P60 and P90) mdx mice and age-matched WT mice (three male mice each group). The collected tissue samples (30 mg) were stored at −80°C until the assay was performed. Blood collected from the heart was centrifuged at 1,500 g for 15 min at 4°C. Plasma was isolated from the resulting supernatant.
Mouse plasma (50 µL) was added to a 450 µL methanol solution prepared to achieve a concentration of 10 µM of the pretreatment internal standard for capillary electrophoresis-time-of-flight mass spectrometry (CE-TOFMS). This mixture was added to 500 μL of chloroform and 200 μL of Milli-Q water and centrifuged at 2,300 g and 4°C for 5 min. After centrifugation, 400 μL of the aqueous layer was transferred to an ultrafiltration tube (Ultrafree MC PLHCC, HMT, centrifugal filter unit 5 kDa) and centrifuged (9,100 ×g, 4°C, 120 min) followed by ultrafiltration. The filtrate was dried and dissolved again in 50 μL of Milli-Q water for measurement. For liquid chromatography-time-of-flight mass spectrometry (LC-TOFMS) analysis, 300 μL of mouse plasma was added to 900 μL of formic acid-acetonitrile solution (1%) prepared as the internal standard (6 μM) and was centrifuged (2,300 ×g, 4°C, 5 min). Phospholipids were removed from the supernatant by solid-phase extraction and dried. For measurement, the dried sample was dissolved in 100 μL of 50% isopropanol solution (v/v).
The skeletal muscle sample (30 mg) added to 750 μL of 50% acetonitrile solution (v/v) was crushed using a crusher under cooling (1,500 rpm, 120 s × 3 times). The same volume of 50% acetonitrile solution (v/v) was added, and the sample was centrifuged at 2,300 g at 4°C for 5 min. The upper layer (400 μL) was transferred to an ultrafiltration tube (Ultra-free MC PLHCC, HMT, centrifugal filter unit 5 kDa) and was centrifuged (9,100 ×g, 4°C, 120 min), followed by ultrafiltration. The filtrated sample was dried and dissolved again in 50 μL of Milli-Q water for CE-TOFMS. For LC-TOFMS analysis, the skeletal muscle sample from the lower legs (30 mg) added in 500 μL of 1% formic acid-acetonitrile solution was crushed (1,500 rpm, 120 s × three times, and 1,500 rpm, 120 s × one time after addition of 167 μL Milli-Q water) using a crusher under cooling conditions and then centrifuged (2,300 × g, 4°C, 5 min). The supernatant was added to 500 μL of 1% formic acid-acetonitrile AMEOR-HMT-0096 and 167 μL of Milli-Q water to precipitate and stirred. Three tubes with a volume of 350 µL (NANOSEP 3 K Ω, PALL) were transferred to an ultrafiltration unit. The samples in the tubes were subjected to centrifugation (9,100 ×g, 4°C, 120 min) and ultrafiltration. After phospholipids in the mixture were removed using solid-phase extraction, the sample was dried and dissolved in 100 μL of 50% isopropanol solution (v/v) for analysis.
The mass spectrometers of the CE-TOFMS system (Agilent; Santa Clara, CA, USA) (Capillary: Fused silica capillary i.d. 50 μm × 80 cm, CE voltage: Positive, 27 kV; MS ionization: ESI Positive or ESI Negative; MS capillary voltage: 4,000 V, and MS scan range: m/z 50–1,000) and Agilent 1,200 series RRLC system SL (Column: ODS column, 2 × 50 mm, 2 μm; Column temp.: 40°C, Flow rate: 0.3 mL/min, Run time: 20 min, Post time: 7.5 min, Gradient condition: 0–0.5 min: B 1%, 0.5–13.5 min: B 1%–100%, 13.5–20 min: B 100%, MS ionization mode: ESI Positive, MS Nebulizer pressure: 40 psi, MS dry gas flow: 10 L/min, MS dry gas temp: 350°C, MS capillary voltage: 3500 V, MS scan range: m/z 100–1700) were operated in positive and negative electrospray ionization conditions. Three independent measurements were performed for each group.
Candidate compounds were assigned to 451 peaks in the plasma sample and 336 peaks in the skeletal muscle using the mass-to-charge ratio (m/z), migration time (MT), and retention time (RT) values of the substances in the HMT metabolite library (Human Metabolome Technologies Inc.) and the Kyoto Encyclopedia of Genes and Genomes (KEGG). For group comparisons, relative area ratios were calculated for each of the peaks corresponding to skeletal muscles and plasma, facilitating the identification of candidate compounds. Quantitative analysis was performed for the candidate compounds. To this end, the calibration curves incorporated peak areas corrected by internal standards, and concentrations were calculated via single-point calibration of 100 μM of substance (internal standard of 200 μM). Ingenuity pathway analysis (IPA; QIAGEN, CA, USA) was performed based on the quantified data from the plasma of each mouse group.
2.6 Statistical analyses
For each group, data were excluded when data acquisition was difficult due to weight loss, debilitation, or death or when there were concerns regarding peculiar values, mechanical errors in measurement, or external environmental influences because motor function and tissue structure could not be correctly assessed. Data are presented as the mean ± standard deviation (SD). Differences between the two groups were assessed using unpaired two-tailed t-tests. Multiple comparisons between three or more groups were performed using analysis of variance (ANOVA, n = 3, Tukey’s post hoc test). Statistical significance was defined as *p < 0.05, **p < 0.01, ***p < 0.001, and ****p < 0.0001 and was calculated using GraphPad Prism eight or 9 (GraphPad, La Jolla, CA, USA).
3 Results
3.1 Mdx mice repeatedly treated with DPSCs showed milder DMD disease phenotypes
Mdx mice were repeatedly administered DPSCs via the tail vein (Figure 1A). The cross-section of the tibialis anterior (TA) muscle of the untreated mdx mice showed fibers with smaller (regenerating) and larger (hypertrophic) diameters, centrally nucleated fibers (CNFs), spread muscle interstitium, and cell infiltration interspersed in the muscle interstitium (Figure 1B). Histopathological findings observed in the repeatedly DPSC treated mdx mice included limited interstitial muscle area and nuclear infiltration. Quantitative analysis revealed a reduction in the nuclear inflammation area in the DPSC-treated TA muscle compared with that in untreated mdx mice (Figure 1C). In addition, high concentrations of circulating CK decreased temporarily after DPSC treatment in mdx mice (Figure 1D).
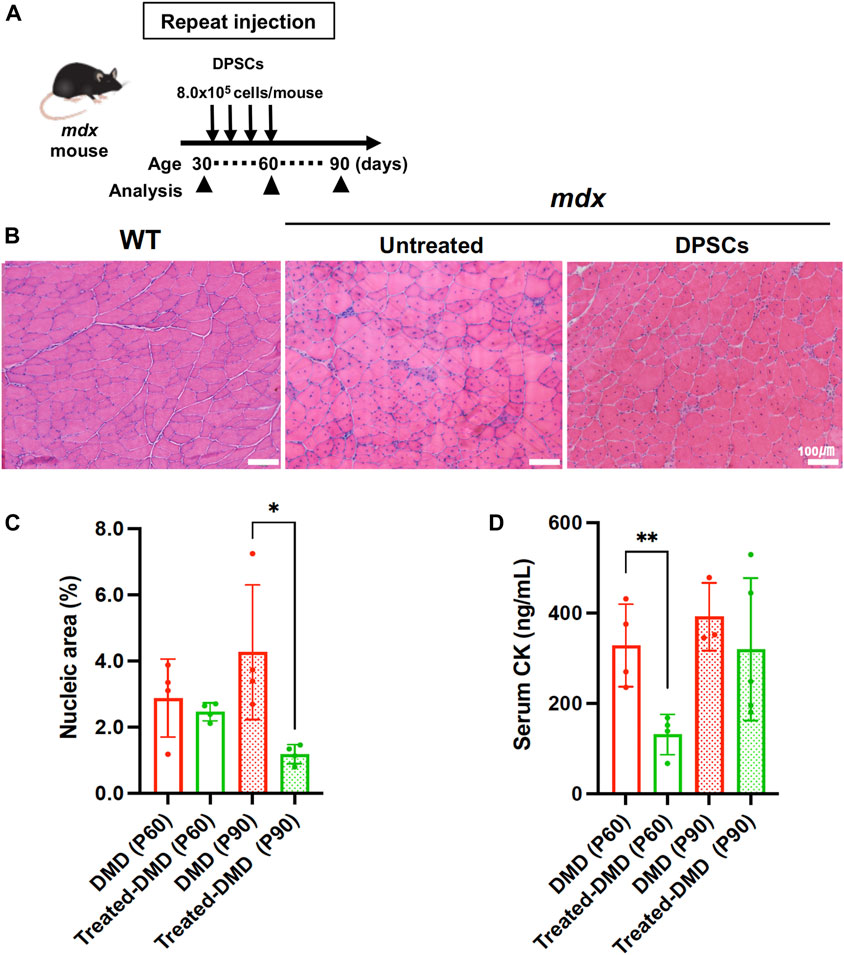
Figure 1. Systemic treatment of the mdx mice with DPSCs (A) Schematic representation of the repeated DPSC treatments of the mdx mice. (B) Hematoxylin and eosin (H&E) staining of the tibialis anterior (TA) muscle (original magnification, ×40, each) of untreated mdx mice and mdx mice treated four times with DPSC. Scale bars, 100 μm. (C) Quantification of the hematoxylin-positive area in the cross-section (% of total area) of the TA muscle of control mdx (DMD) mice and mdx mice treated four times DPSCs (Treated-DMD) at the age of 60 and 90 days (P60, P90, n = 4, each). Statistical differences between WT vs. DMD (*p < 0.05, and **p < 0.01) are indicated; two-way ANOVA or multiple t-tests. (D) Serum creatine kinase (CK) levels in each group of mice; at the age of 60 and 90 days (P60, and P90) of control mdx (n = 4, and 3), and hDPSC-mdx (Treated-DMD; n = 4, each), using ELISA.
3.2 Metabolite variation on the dystrophic muscle with or without DPSC-treatment
We investigated the therapeutic effects of DPSC-treatment on the DMD pathology-specific metabolic abnormalities. To understand the biological responses to DPSC treatment or environmental changes in disease-specific features, we analyzed metabolic disturbances in plasma and TA muscles from WT (healthy), dystrophic mdx, and DPSC-treated mdx mice. Metabolic analysis by CE-TOFMS and LC-TOFMS revealed several substances in the plasma samples (451 metabolites; CE-TOFMS, cation: 195, anion: 95; LC-TOFMS, positive: 72, negative: 89, Supplementary Table S1) and skeletal muscle samples (460 metabolites; CE-TOFMS, cation: 212, anion: 126; LC-TOF-MS, positive: 85, negative: 37, Supplementary Table S2).
In the case of plasma samples, we used metabolic profiling to identify and quantitate a total of 165 metabolites, which revealed that changes in a total of 85 metabolites were statistically significant (p ≤ 0.05). The levels were either elevated or decreased in the comparison of untreated mdx mice versus WT (P30, 21 metabolites; P60, 26 metabolites; P90, 37 metabolites). Significant alterations were observed in 25 metabolites upon comparison of DPSC-treated mdx mice versus untreated mdx mice (P60, 11 metabolites; P90, 22 metabolites), and 31 metabolites were significantly changed upon the comparison of DPSC-treated mdx versus WT (P60, 27 metabolites; P90, 9 metabolites) (Supplementary Table S3).
Using global metabolic profiling, we identified and quantitated metabolites in the skeletal muscles. We found that changes in 62 metabolites were statistically significant (p ≤ 0.05), which either increased or reduced in the comparison of untreated mdx mice versus WT (P30, 23 metabolites; P60, 30 metabolites; P90, 37 metabolites). A total of 33 metabolites were significantly altered in the comparison of DPSC-treated mdx mice versus untreated mdx mice (P60, 11 metabolites; P90, 25 metabolites), and 50 metabolites were significantly changed in the comparison of DPSC-treated mdx mice versus WT (P60, 21 metabolites; P90, 41 metabolites) (Supplementary Table S4).
Based on quantitative metabolite differences, principal component analysis (PCA) showed a clear separation between WT and dystrophic muscles (Figures 2A, B). The first and second PCA components explained 17.2% and 14.7% of the variation in plasma (Figure 2A) and 22.4% and 12.5% of the variation in the TA muscles (Figure 2B), respectively. In addition, DPSC-treated mdx mice showed an intermediate distribution between these groups in the PCA graph. While plasma samples showed negligible change with respect to the time course among mouse groups in the PCA results, we observed time-series variation in the analysis of data derived using the partial least-squares method (PLS) (Supplementary Figure S1). In the skeletal muscles, PCA analysis described clear time-series changes between 30 and 60–90 days for both WT and mdx mice. These data suggest that DPSC-treated mdx mice demonstrated a PCA distribution closer to that of WT mice than to that of untreated mdx mice in both plasma and skeletal muscle samples.
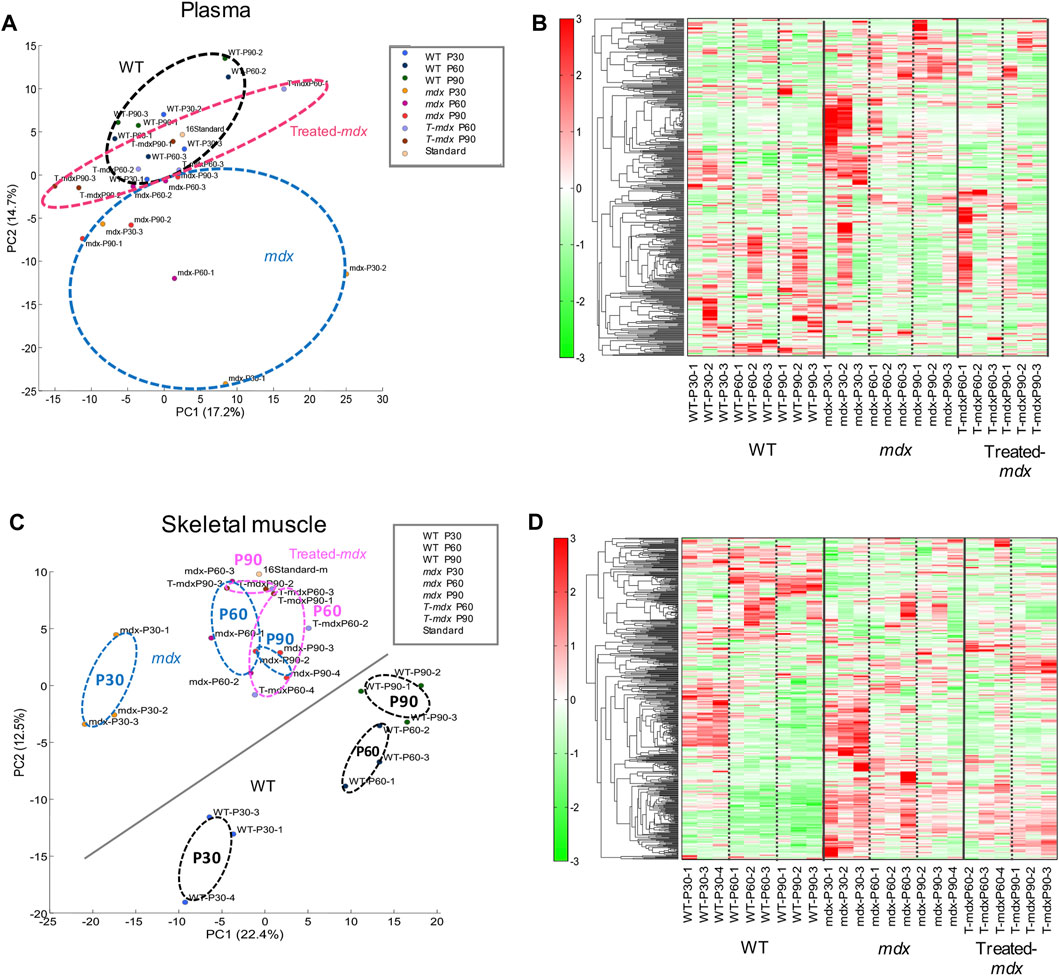
Figure 2. Principal component analysis (PCA) and differential concentration of metabolites A principal component analysis (PCA) plot (A,C) and heat map depicting hierarchical clustering analysis (B,D) of plasma (A,B) and the tibialis anterior (TA) muscles (C,D) derived from 30-, 60-, and 90-day-old (P30, P60, and P90) C57BL/6 mice (wild type, WT), untreated mdx mice (DMD), and DPSC-treated mdx mice (Treated-mdx). The PCA plot revealed significant separation among the mouse groups (n = 3). High and low concentrations of the metabolites are shown on a continuum from red to green.
Considering the observed changes in metabolite levels, we next investigated how mdx and DPSC-treated mice exhibited metabolite imbalances compared to WT mice in the plasma and skeletal muscle. The heat map in Figures 2B, D shows the results of hierarchical clustering analysis (HCA). In HCA of skeletal muscle, WT and mdx mice showed notable differentiation consistent with PCA findings (Figure 2C), especially evident between the 30- and 60–90-day groups (Figure 2D). While less prominent than the differentiation between WT and mdx mice, we also detected some alterations in HCA patterns in DPSC-treated mdx mice compared to those in the untreated mdx mice, particularly at 60–90 days of age.
3.3 Metabolites that varied markedly in the dystrophic muscles with or without DPSC-treatment
The top and bottom 30 factor loadings annotated in the Human Metabolome Database (HMBD) containing PC1 and PC2 using PCA for the plasma samples (Table 1) as well as PC1 and PC2 for the skeletal muscle samples are listed in Table 2.
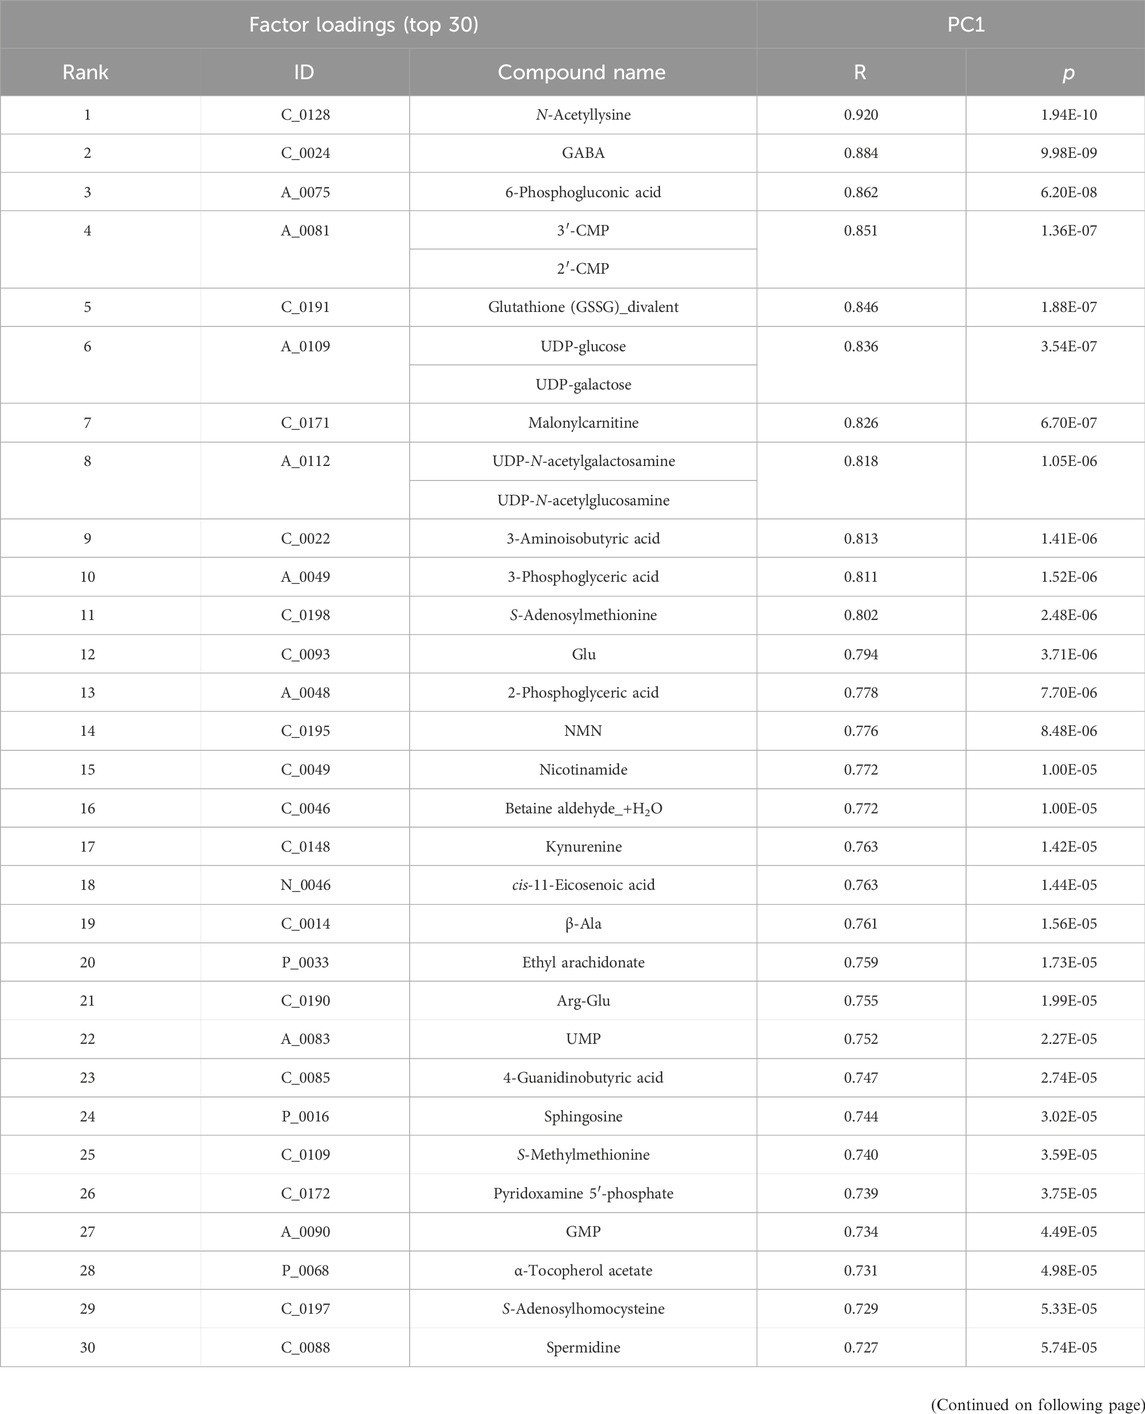
Table 1. Top and bottom 30 loading factors based on the principal component analysis (PCA) of plasma samples Based on the quantitative metabolic differences annotated in the Human Metabolome Database (HMBD), PCA was performed on plasma samples derived from each group, namely, wild-type, untreated mdx mice and DPSC-treated mdx mice. Factor loading top and bottom 30 metabolites sorted by PC1 (top, R > 0.727, p < 5.74E-05; bottom, R < −0.307, p < 1.45E-01) are listed in the upper two tables, whereas the corresponding top and bottom 30 metabolites sorted by PC2 (top, R > 0.678, p < 2.72E-04; bottom, R < −0.498, p < 1.33E-02) are listed in the bottom two tables.
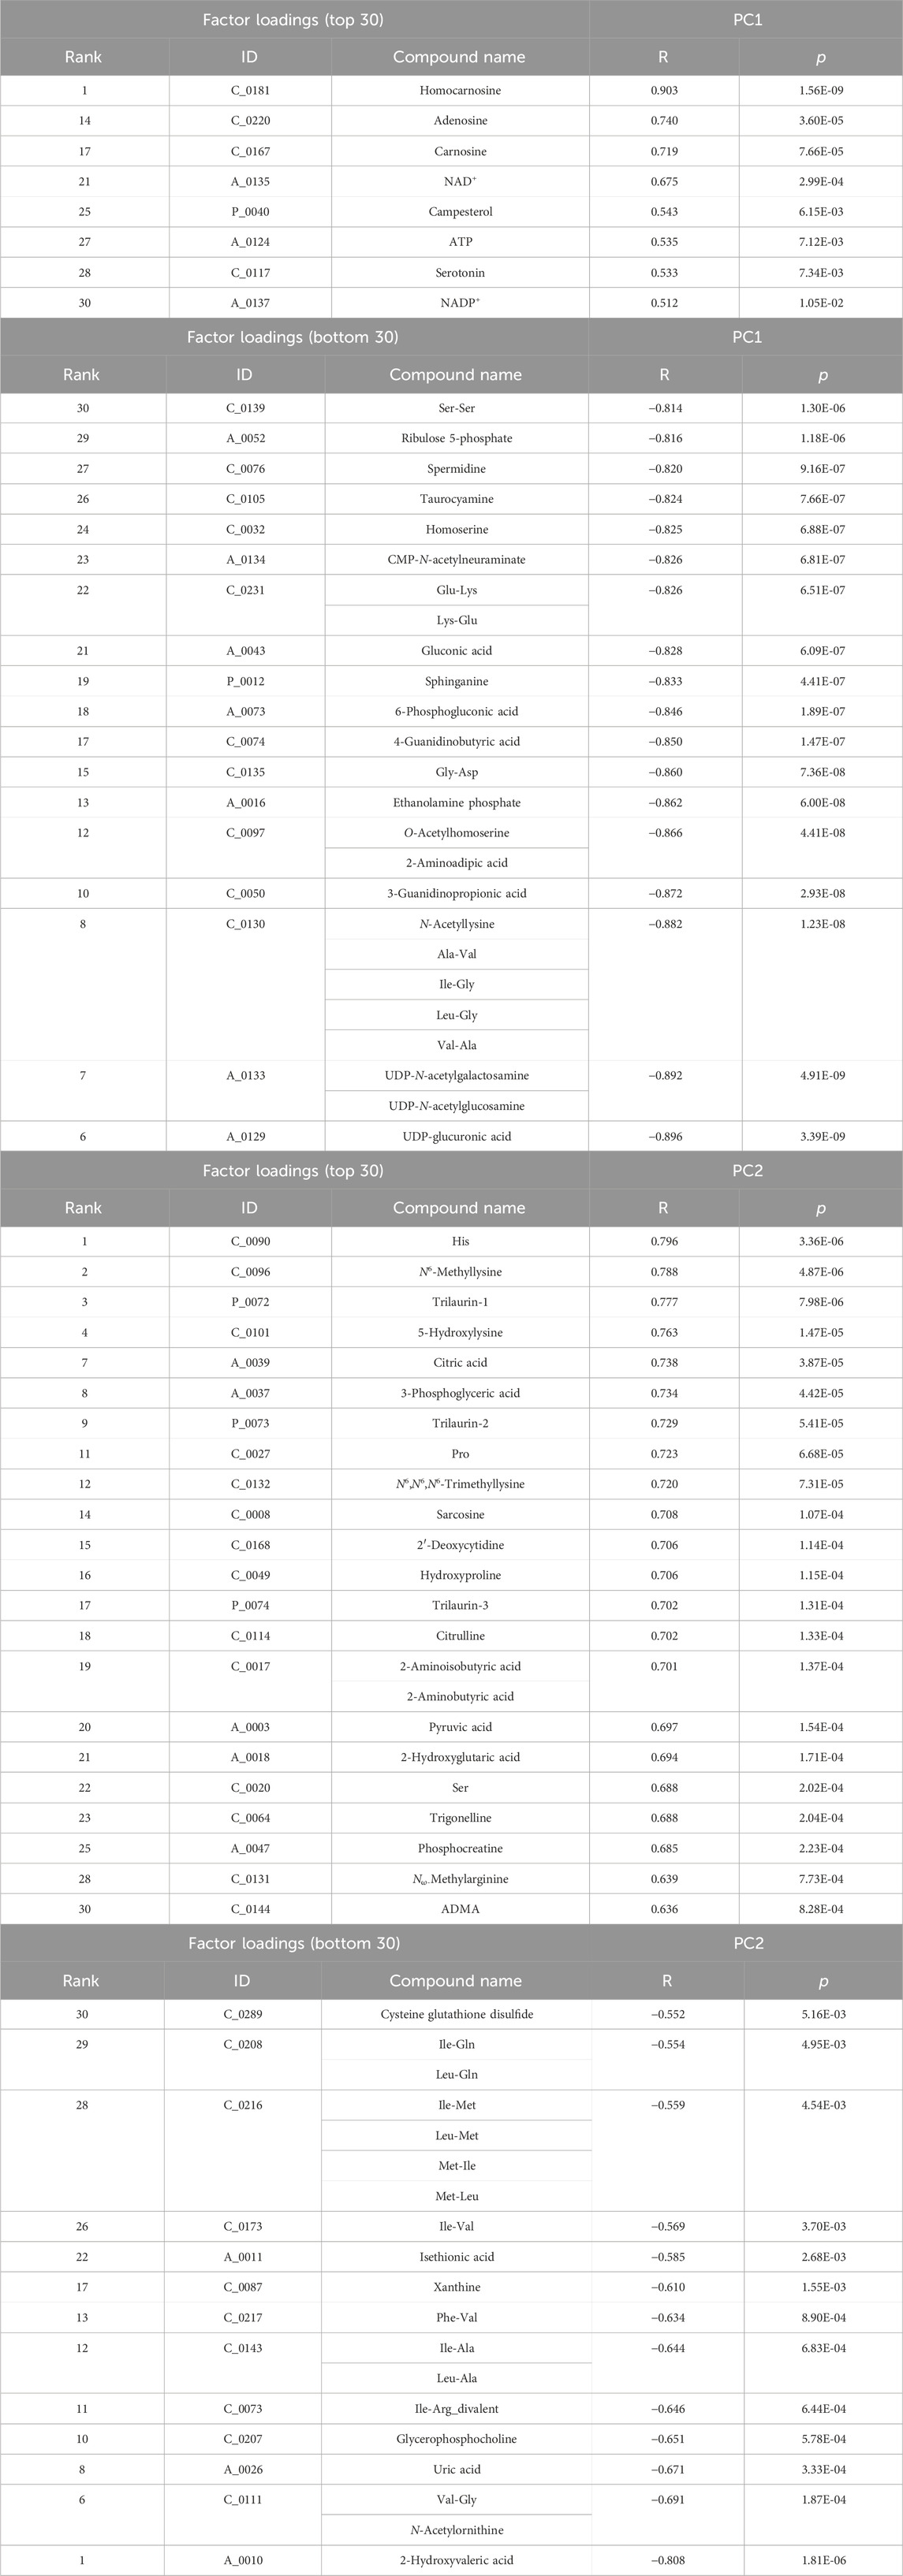
Table 2. Top and bottom 30 loading factors based on the principal component analysis (PCA) of the skeletal muscles Based on the quantitative metabolic differences annotated in the Human Metabolome Database (HMBD), PCA was performed on the skeletal muscle derived from each group, namely, wild-type, untreated mdx mice, and DPSC-treated mdx mice. Factor loading top and bottom 30 metabolites sorted by PC1 (top, R > 0.512, p < 1.05E-02; bottom, R < −0.814, p < 1.30E-06) are listed in the upper two tables, whereas the corresponding top and bottom 30 metabolites sorted by PC2 (top, R > 0.636, p < 8.28E-04; bottom, R < −0.552, p < 5.16E-03) are listed in the bottom two tables.
When we focused on the regions of the HCA map where a marked difference between WT and mdx mice was observed, we noticed that several amino acid metabolites were present in addition to HMBD. In terms of concentration, amino acid metabolites, such as Asn (asparagine), Asp, Lys, and Met, were accumulated in plasma samples (Supplementary Table S3), and Asn and Gln were abundant in the skeletal muscles of the mdx mice compared to those in the WT mice (Supplementary Table S4). Ser in plasma and Ile and Tyr in the skeletal muscle were lower than those in the WT. Accumulated amino acid metabolites in the mdx mice were downregulated in the DPSC-treated group, including Asn (ratio of mdx ver. WT P60, 1.5, p = 0.021; treated-mdx ver. mdx, 0.7; p = 0.046) and Met (ratio of mdx ver. WT P60, 1.27, p = 0.015; treated-mdx ver. mdx, 0.83, p = 0.035) in the plasma samples and Asn (ratio of mdx ver. WT P90, 1.49, p = 0.012; treated-mdx ver. mdx, 0.72; p = 0.023) in the skeletal muscles.
3.4 Identification of DMD and DPSC-treatment specifically altered metabolites
To compare the exact metabolite amounts, we focused on the quantification of their areas, as reported by the peaks of the mass spectrum. We found that some metabolites, such as phosphocreatine, homocarnosine, S-methylcysteine, guanidinosuccinic acid, and thiamine, were altered in the plasma samples of the 60–90-day-old mdx mice compared to those in the WT. Among these metabolites, statistical analysis confirmed that S-methylcysteine in the DPSC-treated mice at P90 showed significant differences compared to that in the mdx mice (Figure 3A). Analysis of plasma samples from 30 to 90-day-old mice among the three groups showed that the metabolites creatine, inosine monophosphate (IMP), and carnosine accumulated in the early phase of the mdx mice at the age of 30–90 days (Figure 3B). Additionally, glucose 6-phosphate (G-6-P), fructose 6-phosphate, and thymidine levels were higher in the mdx mice than in WT mice after the age of 60 days. In contrast, fumaric acid was reduced in the mdx mice after the age of 60 days than in WT mice. Creatine, IMP, G-6-P, and fumaric acid levels in DPSC-treated mdx mice were not significantly different from those in WT mice at 90 days of age. Furthermore, in the quantification data of the skeletal muscle, the metabolites, threonic acid, pantothenic acid, O-acetylhomoserine, sphinganine, sphingosine, ethanolamine phosphate, and uric acid accumulated in the mdx mice at the age of 60–90 days, whereas homocarnosine levels decreased compared to those in WT mice (Figure 4A). Especially, the elevation of Ans and uric acid in the mdx mice after DPSC treatment showed a reduction at P90, indicating significant differences when compared to the untreated mdx mice (DMD vs. treated-med, Ans, p = 0.008; uric acid, p = 0.006). Next, we examined the changes in metabolites in the skeletal muscles of mice at the ages of 30–90 days by comparing the three groups of mice (Figure 4B). Choline, creatine, and putrescine levels in the mdx mice increased at 60 and 90 days of age. The metabolites choline and Asn were downregulated in DPSC-treated mdx mice (Figures 4A, B). While the levels of carnosine in the mdx mice were lower than those in WT mice, the differences were not significant when compared with the levels in WT mice after DPSC treatment. In addition, we found that cis-5,8,11,14,17-eicosapentaenoic acid, nicotinamide, and ornitin were transiently elevated in the skeletal muscles of DPSC-treated mice compared with those in the WT and mdx mice (Supplementary Table S4; Supplementary Figure S4).
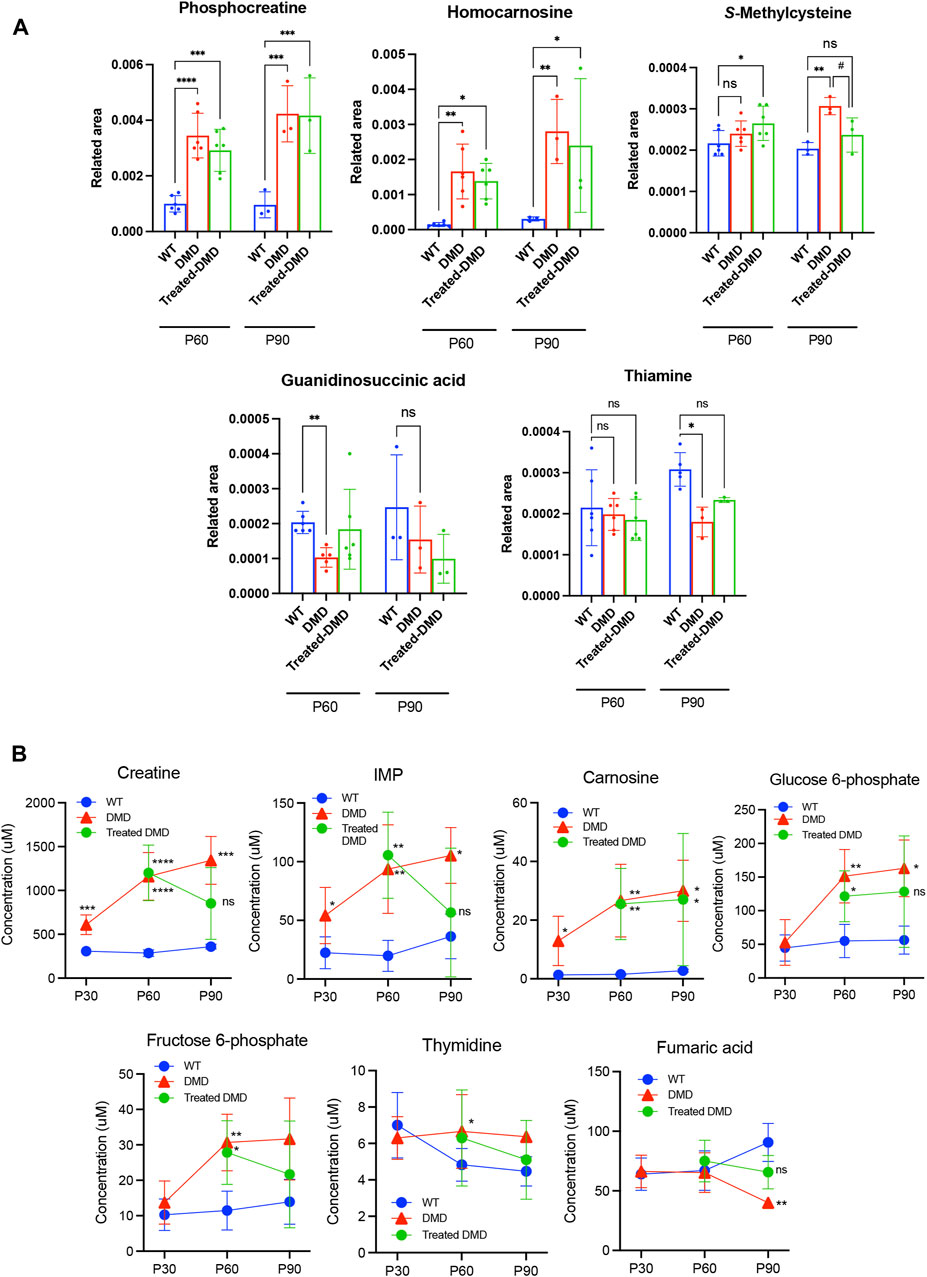
Figure 3. Altered metabolites in the plasma of dystrophic mice and effects of DPSC treatment (A) Quantitative analysis of metabolites altered in the plasma samples derived from 60- and 90-day-old (P60 and P90) C57BL/6 mice (wild type, WT), untreated mdx mice (DMD), and DPSC-treated mdx mice (Treated-mdx). Relative values of differentially expressed metabolites were described as fold changes compared to standard peaks. (B) Plasma levels of metabolite concentrations are described in 30–90-day-old mice (P30, P60, and P90). Statistical differences between WT vs. DMD (*p < 0.05, **p < 0.01, ***p < 0.001, and ****p < 0.0001) and DMD vs. Treated-DMD (#p < 0.05) are indicated; ns, not significant, two-way ANOVA or multiple t-tests. n = 3 for each group. Data are presented as the mean ± SD.
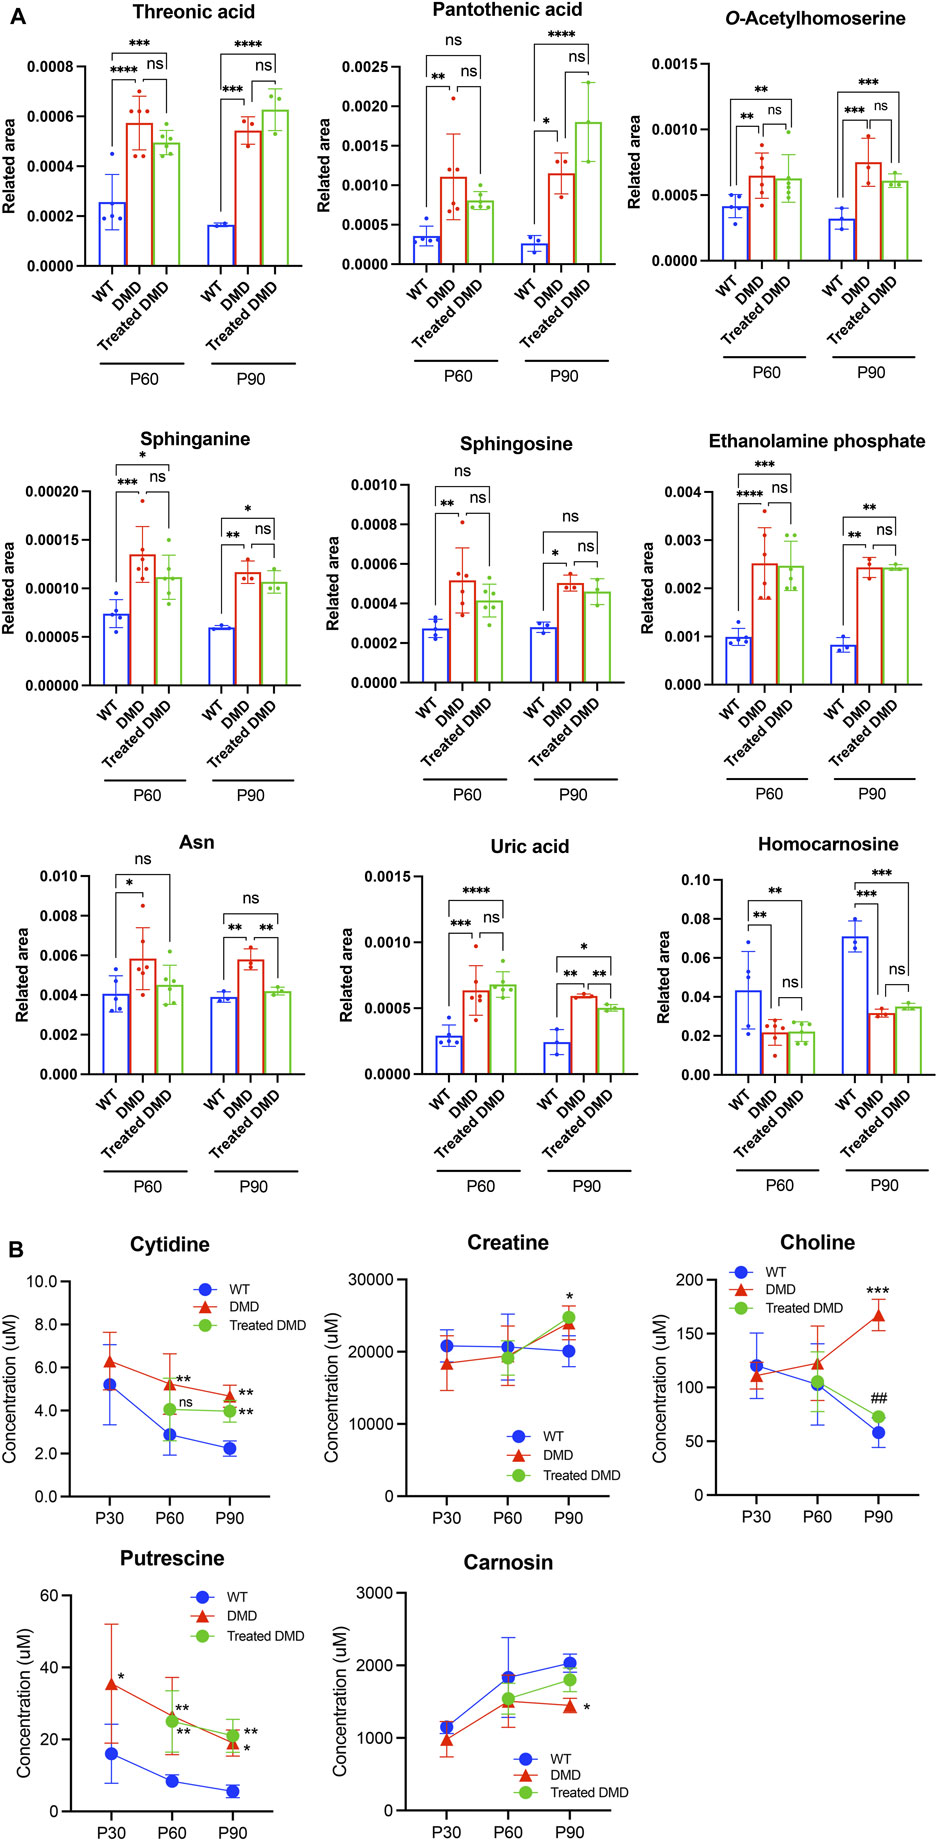
Figure 4. Altered metabolites in the skeletal muscle of dystrophic mice and effects of DPSC-treatment (A) Quantitative analysis of metabolites altered in the skeletal muscles derived from 60- and 90-day old (P60, and P90) C57BL/6 mice (wild type, WT), untreated mdx mice (DMD), and DPSC-treated mdx mice (Treated-mdx). Relative values of differentially expressed metabolites described as fold changes to standard peaks. (B) Metabolite concentrations in the skeletal muscles are described for 30–90-day-old mice (P30, P60, and P90). Statistical differences between WT vs. DMD (*p < 0.05, **p < 0.01, ***p < 0.001, and ****p < 0.0001) and DMD vs. Treated-DMD (##p < 0.01) are indicated; ns, not significant, two-way ANOVA or multiple t-test. n = 3 for each group. Data are presented as the mean ± SD.
3.5 Characterization of disease-specific modified features and the effects of DPSC treatment on the metabolite pathway determined using ingenuity pathway analysis
To understand the significance of the metabolites that underwent disease-specific changes or that varied after DPSC administration, we carried out “diseases and biological functions” analysis using IPA. To detect early changes, we performed the IPA analysis at P60, immediately following DPSC administration. The results revealed canonical pathways that were altered in the plasma samples of mice in the DPSC-treatment group. A total of 21 pathways with predicted upper or lower activation states were detected when untreated mdx mice and DPSC-treated mdx mice were compared (Table 3). As predicted by the activation z-score, the top pathways activated in mdx mice included “transport of amino acids, mobilization of Ca2+, uptake of D-glucose, release of nitric oxide, synthesis of prostaglandin E2”. Hence, the relevant factors were reduced in DPSC-treated mice. The top pathways in the mdx mice included “uptake of amino acids, storage or concentration of triacylglycerol, uptake of glutamine family amino acid, and conversion of lipid.” Next, we confirmed the differences in these parameters between WT and mdx mice along with variability ratios in the untreated and DPSC-treated mdx mice (Table 4). We found that the “transport of L-amino acid” and “uptake of L-amino acid” were enriched in the mdx mice compared with those in the WT. In contrast, “conversion of lipid” and “uptake of amino acids” were decreased in mdx mice. The pathways that were altered in the untreated mdx mice compared with those in the WT were increased by approximately two-fold in mdx mice compared to those in the DPSC-treated group, except for the “uptake of L-amino acid.” These results imply that the enriched pathways in the mdx mice were downregulated in DPSC-treated mdx mice, resembling WT mice closely. In contrast, pathways such as the “uptake of amino acids,” “concentration of triacylglycerol,” “uptake of glutamine family amino acid,” and “conversion of lipid,” which were downregulated in the mdx mice compared with those in the WT, were upregulated in the DPSC-treated group, indicating a trend toward similarity with WT mice in the DPSC-treated group.
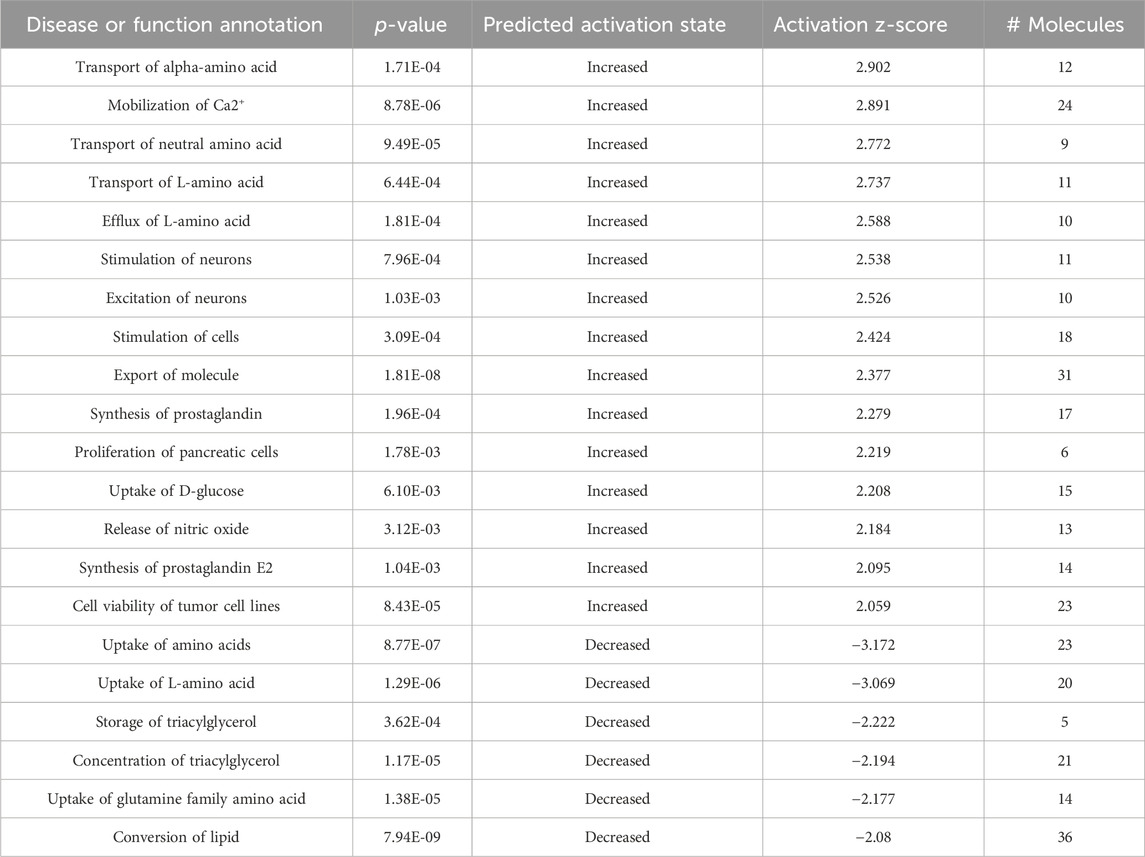
Table 3. Disease or function annotation using ingenuity pathway analysis (IPA) The plasma samples derived from 60-day-old (P60) untreated mdx mice (DMD) and DPSC-treated mdx mice (treated-mdx) mice were compared by “Disease or function annotation analysis” using IPA and listed as predicted by the activation z-score (>2.0, or < −2.0).
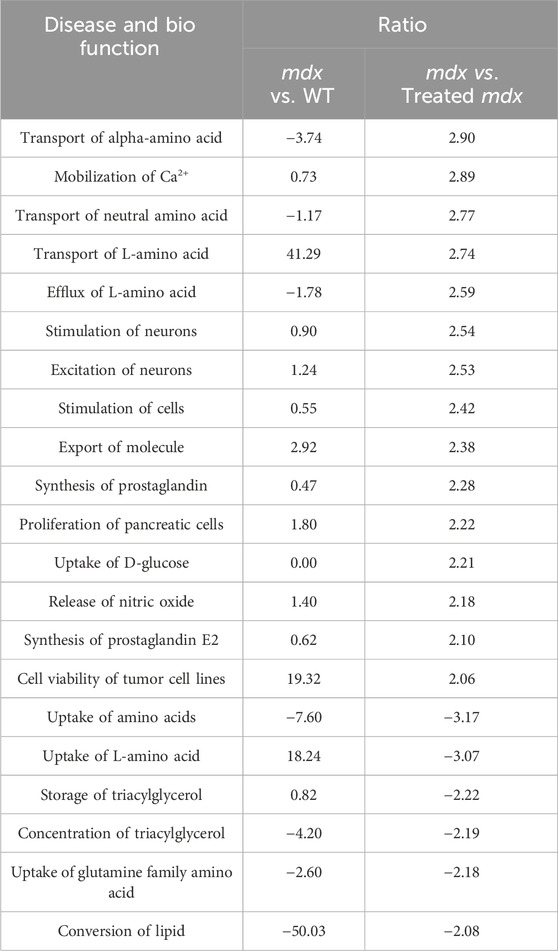
Table 4. Disease and bio function determined using IPA The plasma samples derived from 60-day-old wild type (WT), untreated mdx mice, and DPSC-treated mdx (treated-mdx) mice were compared by “Disease and bio function” using IPA, and the items were listed according to the ratio of the results of mdx vs. treated-mdx mice (>2.0, or < −2.0). Corresponding values obtained after a comparison between mdx vs. WT were also included.
IPA was used to identify the upstream regulators that explained the observed changes in the metabolites because upstream regulators were activated early and subsequently contributed to downstream metabolic changes (Figure 5; Supplementary Table S5). This suggests that several upstream regulators are critical for DMD and MSC treatment. The most activated upstream regulators in WT vs. mdx mice included disease-specific factors, LEP, NOS3, and 3-nitropropionic acid, while the inhibited state targeted 6–8 molecules such as creatinine, D-sphingosine, glutathione, and L-arginine. LDL and BHMT in the activated state targeted 5–6 molecules such as cholesterol, D-sphingosine, and glutathione.
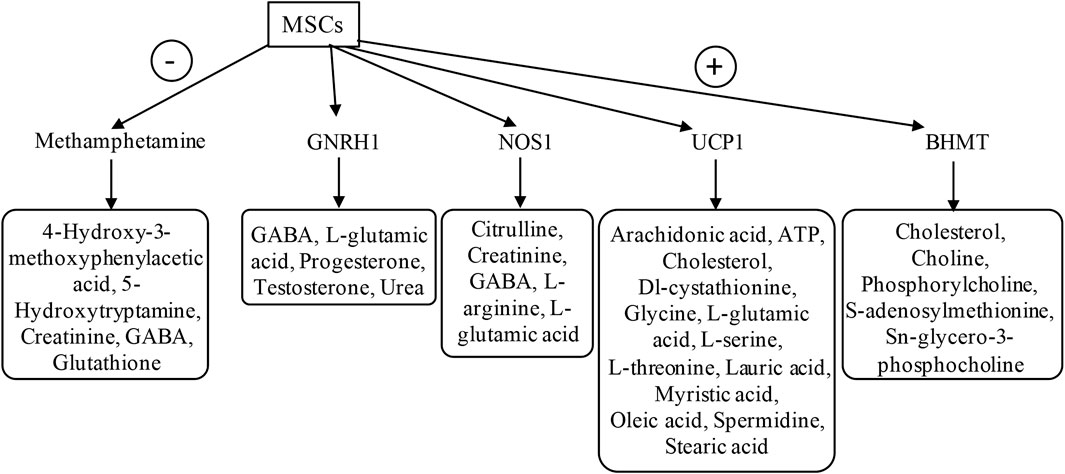
Figure 5. Upstream regulator analysis using IPA The plasma samples derived from 60-day-old untreated mdx mice and DPSC-treated mdx mice (treated-mdx) were compared using “Upstream regulator” analysis by IPA and were listed by activated upstream regulators for both downregulated factors (-; Inhibited, activation z-score; < −2.0), and upregulated factors (+; Activated, activation z-score; >2.0). The target molecules listed based on each upstream factor are surrounded by a square.
In the case of DPSC-treated mdx mice, the top activated upstream regulators included methamphetamine in an inhibitory state targeting molecules such as 4-hydroxy-3-methoxyphenylacetic acid, 5-hydroxytryptamine, creatinine, GABA, and glutathione as predicted, and upstream regulators BHMT, UCP1, NOS1, and GNRH1 in the activated state, targeting molecules such as creatinine, GABA, L-arginine, L-glutamic acid, oleic acid, phosphorylcholine, and glycero-3-phosphocholine. These results demonstrated that disease-specific or DPSC-treated DMD-specific pathways, including upstream regulators, could be identified using IPA.
4 Discussion
We investigated the metabolic signatures of previously identified and newly characterized factors associated with the effects of DPSC treatment on the metabolic status of dystrophic mice. Although a previous study reported metabolic disturbances in DMD using mouse and dog models (Nitahara-Kasahara et al., 2021), this study is the first to report the therapeutic evaluation of cell therapy focused on metabolic abnormalities in DMD. We identified DMD-specific impairments in metabolites and their responses to systemic DPSC treatment. Our results demonstrate that metabolomics-based pathological assessment is expected to help understand the histopathological mechanisms associated with the anti-inflammatory effects of DPSC treatment and can help identify the therapeutic targets and pathways.
Early systemic DPSC administration in mdx mice ameliorated the progressive phenotypes and retained milder histological phenotypes (Figure 1). DPSC-treated mice retained motor function, resulting in the long-term improvement of skeletal muscles, as in our previous study (Nitahara-Kasahara et al., 2021). However, the therapeutic mechanisms, target molecules, and environmental changes in the skeletal muscle after systemic administration of DPSCs were unclear. As chronic inflammation is followed by the controlled degeneration and necrosis of muscle fibers, it was considered that the treated mice might have efficient energy production, metabolism, and structural stability, which may be closely related to muscle function.
PCA and heat maps showed that the overall variants of metabolites depended on the time course in mdx mice and DPSC-treated mdx mice compared to those in WT mice (Figure 2). Quantitative analysis provided a list of metabolites with disease-specific variations, and groups of factors that were further altered by cell therapy were obtained (Tables 1, 2). Furthermore, we focused on the marked differences between normal and disease conditions during the growth process (Figures 3, 4) and suggested that the metabolite variety was affected by DPSC treatment during disease progression.
In dystrophic muscles, disruption of the dystrophin-glycoprotein complex initiates complex pathogenesis, including membrane microrupturing, Ca2+-induced proteolytic degradation, and fiber degeneration, followed by chronic inflammation (Allen et al., 2016; Smith, and Barton, 2018; Tidball et al., 2018). In addition to progressive muscle wasting, metabolic abnormalities have been reported previously. For instance, changes in plasma metabolites have been observed in patients with DMD, including alterations in unsaturated fatty acids, carnitine, and lipids. Moreover, metabolites associated with amino acid metabolism, such as elevated levels of Gln and Glu, as well as decreased levels of Val, have been noted compared to healthy controls. (Xu et al., 2023). In an animal model, the metabolites Ala, Met, Gly, and Glu showed different variants in dystrophic mdx mice (Lorena et al., 2023) compared to those in the WT. Glu accumulates in GRMD (Kornegay, 2017); however, this alteration may be specific to certain animal models. Our study revealed that DPSC treatments may influence variations in amino acid metabolites, particularly those that are disease-specific and altered in mdx mice. This effect is possibly attributed to elevated levels of Asn and Glu (Figure 4A; Supplementary Tables S3, S4).
We found that elevated uric acid and reduced carnosine levels in the skeletal muscle of mdx mice showed a trend similar to that of WT mice after DPSC treatment (Figures 4A, B). Similarly, patients with DMD had much higher muscle concentrations of uric acid than healthy individuals, which is associated with purine metabolism (Camina et al., 1995). The hypothesis that DMD involves alterations leading to the blockage of the IMP-purine pathway was supported. Therefore, inhibition of xanthine oxidase is expected to delay the loss of hypoxanthine in the form of uric acid, thus favoring the restoration of nucleotide levels via IMP and guanine (Camina et al., 1995). Considering this pathway, the IMP levels in plasma after the treatment of dystrophic mice with DPSCs were comparable to those in the untreated controls and were not sufficient to restore purine levels in our study (Figure 3B).
Carnosine is a dipeptide that is highly concentrated in the skeletal muscles (Kohen et al., 1988). A previous study showed that significantly decreased carnosine in GRMD could set the stage for eventual muscle damage (e.g., due to lactic acid or oxidative damage). This decline may lead to limited myosin ATPase activity, as highlighted in a previous study (Rayment, 1996), and may contribute to muscle fatigue (Parker, and Ring, 1970). Patients also have significantly lower muscle concentrations of ATP, ADP, GTP, GDP, IMP, S-AMP, hypoxanthine, and guanine (Camina et al., 1995). Our results showed that carnosine levels in the skeletal muscle of DPSC-treated mice were similar to those in WT mice (Figure 4B). We also demonstrated that the locomotor function of mdx mice was maintained for a long time after DPSC treatment (Nitahara-Kasahara et al., 2021). These results suggest that energy production and metabolic efficiency may also contribute to the maintenance of muscle function, followed by decreased muscle damage by downregulating inflammation via DPSCs. Future investigations of the relationship between changes in muscle fiber type and metabolic variation may provide clues to explain the mechanisms of the therapeutic effects by DPSC-treatment. Furthermore, higher levels of metabolites involved in glycolysis, including 6-phosphoglycerate, fructose-6-phosphate, and glucose-6-phosphate have been previously reported in mdx mice (Xu et al., 2023). Similar results were obtained in this study, and the abnormal metabolism of amino acids, energy, and lipids in DMD was consistent with pathological features, such as recurrent muscle necrosis and regeneration and inflammation, which also partially reflect therapeutic effects.
Choline-containing compounds were approximately three times higher than those in healthy individuals and patients with other myopathies, whereas creatine levels were within the normal range, indicating that abnormal cell membrane function may be correlated with abnormal dystrophin or lack of dystrophin in the brains of patients with DMD (Kato et al., 1997). We found that increased choline in the skeletal muscle of mdx mice was similar to that in patients with DMD and was downregulated after DPSC-treatment (Figure 4B). These findings are consistent with the protective cell membrane function in DPSC-treated dystrophic muscle compared with that in the untreated control. Lower levels of circulating CK in the treated mice imply the retention of cellular fragility, albeit temporarily, associated with an improved histological appearance of the skeletal muscle. Therefore, these measurements imply that tissue damage was decreased by DPSC-treatments, reflecting protection against physical damage. In contrast, sphingolipid biosynthesis is known to be upregulated in dystrophic muscles (Laurila et al., 2022), but was not significantly influenced by DPSC treatment.
The IPA pathway is disease-specific and influences various signaling pathways. We found that the main differences between disease and treatment groups included the variation related to increased “transport of amino acid and mobilization of Ca2+” and decreased “uptake of amino acids and storage of triacylglycerol” in the analysis of “Diseases or functions annotation” (Table 3). Choline was included as a factor in the “triacylglycerol enrichment or storage” category with a reduced predicted activation state. Carnosine and Glu were also in the “lipid metabolism” Pathway. Creatine and uric acid were in “release of nitric oxide, stimulation of cells, and mobilization of Ca2+.” As nitric oxide and Ca2+ are known to be involved in the pathogenesis of muscle dystrophy, DPSCs are expected to have the potential to maintain tissue structure. Furthermore, BHMT was identified as an upstream molecule that regulates factors, including choline and its analogs (Figure 5; Supplementary Table S5). There are many upstream factors that regulate Glu; here, we identified UCP1, GNRH1, and NOS1. The dystrophic muscle membrane induces the secondary loss of neuronal nitric oxide synthase. Because nitric oxide is a potent regulator of skeletal muscle metabolism, the loss of NO bioavailability is likely a key contributor to chronic pathology (Timpani et al., 2017). Considering the above findings and our results using IPA based on metabolite variation, we successfully characterized pathways that reflect disease pathology and suggest that treatment may ameliorate disease progression.
There are a few reports on metabolites resulting from MSC administration, for example, MSC-triggered metabolomic alterations in liver-resident immune cells from acute liver injury model mice (Shi et al., 2019), and key metabolic pathways in MSC-mediated immunomodulation for GVHD (Burnham et al., 2020). This is the first report of metabolic improvements following DPSC administration in relation to muscular dystrophy. Whether the supply of DPSCs has a significant impact on the metabolic network and crosstalk with the immune response to alter the disease progression of DMD needs to be further investigated. Metabolite analysis may be useful for understanding the molecular targets and mechanisms underlying cellular therapies.
Data availability statement
The original contributions presented in the study are included in the article/Supplementary Material, further inquiries can be directed to the corresponding authors.
Ethics statement
Ethical approval was not required for the studies on humans in accordance with the local legislation and institutional requirements because only commercially available established cell lines were used. The animal study was approved by the Ethics Committee for the Treatment of Laboratory Animals at the Nippon Medical School and Institute of Medical Science. The study was conducted in accordance with the local legislation and institutional requirements.
Author contributions
YN-K: Data curation, Formal Analysis, Investigation, Methodology, Software, Writing–original draft, Writing–review and editing. GP-H: Methodology, Writing–review and editing. KH: Methodology, Writing–original draft. YO: Methodology, Writing–original draft. NS-M: Methodology, Writing–original draft. YY: Conceptualization, Funding acquisition, Project administration, Supervision, Writing–review and editing. TO: Conceptualization, Funding acquisition, Project administration, Supervision, Writing–review and editing.
Funding
The author(s) declare that financial support was received for the research, authorship, and/or publication of this article. This work was supported by the Japan Agency for Medical Research and Development (AMED) under grant number DNW-15006 and and Grant-in-Aid for Scientific Research (B), and (C) from the Japan Society for the Promotion of Science (#20H03788, #23K20328, #22K06921).
Acknowledgments
The authors express their gratitude to Jun Tanihata, Tomoko Mori, and Chiaki Masuda for technical advice, support, and helpful discussions. We also thank Sonoko Shimazu, Tomomi Fukatsu, Maya Kawamura, and Yuko Aizen for their technical assistance. The authors thank Editage (www.editage.jp) for editing the manuscript draft.
Conflict of interest
YN-K and TO were members of the Division of Cell and Gene Therapy, Nippon Medical School, which is an endowment department supported by a grant from JCR Pharmaceuticals Co., Ltd.
Publisher’s note
All claims expressed in this article are solely those of the authors and do not necessarily represent those of their affiliated organizations, or those of the publisher, the editors and the reviewers. Any product that may be evaluated in this article, or claim that may be made by its manufacturer, is not guaranteed or endorsed by the publisher.
Supplementary material
The Supplementary Material for this article can be found online at: https://www.frontiersin.org/articles/10.3389/fcell.2024.1363541/full#supplementary-material
References
Abdullah, M., Kornegay, J. N., Honcoop, A., Parry, T. L., Balog-Alvarez, C. J., O'Neal, S. K., et al. (2017). Non-targeted metabolomics analysis of golden retriever muscular dystrophy-affected muscles reveals alterations in arginine and proline metabolism, and elevations in glutamic and oleic acid in vivo. Metabolites 7, 38. doi:10.3390/metabo7030038
Allen, D. G., Whitehead, N. P., and Froehner, S. C. (2016). Absence of dystrophin disrupts skeletal muscle signaling: roles of Ca2+, reactive oxygen species, and nitric oxide in the development of muscular dystrophy. Physiol. Rev. 96, 253–305. doi:10.1152/physrev.00007.2015
Boca, S. M., Nishida, M., Harris, M., Rao, S., Cheema, A. K., Gill, K., et al. (2016). Discovery of metabolic biomarkers for Duchenne muscular dystrophy within a natural history study. PLoS One 11, e0153461. doi:10.1371/journal.pone.0153461
Bulfield, G., Siller, W. G., Wight, P. A., and Moore, K. J. (1984). X chromosome-linked muscular dystrophy (mdx) in the mouse. Proc. Natl. Acad. Sci. U. S. A. 81, 1189–1192. doi:10.1073/pnas.81.4.1189
Burnham, A. J., Foppiani, E. M., and Horwitz, E. M. (2020). Key metabolic pathways in MSC-mediated immunomodulation: implications for the prophylaxis and treatment of graft versus host disease. Front. Immunol. 11, 609277. doi:10.3389/fimmu.2020.609277
Camina, F., Novo-Rodriguez, M. I., Rodriguez-Segade, S., and Castro-Gago, M. (1995). Purine and carnitine metabolism in muscle of patients with Duchenne muscular dystrophy. Clin. Chim. Acta 243, 151–164. doi:10.1016/0009-8981(95)06164-9
Campbell, K. P. (1995). Three muscular dystrophies: loss of cytoskeleton-extracellular matrix linkage. Cell 80, 675–679. doi:10.1016/0092-8674(95)90344-5
Dabaj, I., Ferey, J., Marguet, F., Gilard, V., Basset, C., Bahri, Y., et al. (2021). Muscle metabolic remodelling patterns in Duchenne muscular dystrophy revealed by ultra-high-resolution mass spectrometry imaging. Sci. Rep. 11, 1906. doi:10.1038/s41598-021-81090-1
Ervasti, J. M., Ohlendieck, K., Kahl, S. D., Gaver, M. G., and Campbell, K. P. (1990). Deficiency of a glycoprotein component of the dystrophin complex in dystrophic muscle. Nature 345, 315–319. doi:10.1038/345315a0
Friedenstein, A. J., Petrakova, K. V., Kurolesova, A. I., and Frolova, G. P. (1968). Heterotopic of bone marrow. Analysis of precursor cells for osteogenic and hematopoietic tissues. Transplantation 6, 230–247. doi:10.1097/00007890-196803000-00009
Guiraud, S., Squire, S. E., Edwards, B., Chen, H., Burns, D. T., Shah, N., et al. (2015). Second-generation compound for the modulation of utrophin in the therapy of DMD. Hum. Mol. Genet. 24, 4212–4224. doi:10.1093/hmg/ddv154
He, Q., Wan, C., and Li, G. (2007). Concise review: multipotent mesenchymal stromal cells in blood. Stem Cells 25, 69–77. doi:10.1634/stemcells.2006-0335
Ichim, T. E., Alexandrescu, D. T., Solano, F., Lara, F., Campion Rde, N., Paris, E., et al. (2010). Mesenchymal stem cells as anti-inflammatories: implications for treatment of Duchenne muscular dystrophy. Cell Immunol. 260, 75–82. doi:10.1016/j.cellimm.2009.10.006
Jo, Y. Y., Lee, H. J., Kook, S. Y., Choung, H. W., Park, J. Y., Chung, J. H., et al. (2007). Isolation and characterization of postnatal stem cells from human dental tissues. Tissue Eng. 13, 767–773. doi:10.1089/ten.2006.0192
Joseph, J., Cho, D. S., and Doles, J. D. (2018). Metabolomic analyses reveal extensive progenitor cell deficiencies in a mouse model of Duchenne muscular dystrophy. Metabolites 8, 61. doi:10.3390/metabo8040061
Kato, T., Nishina, M., Matsushita, K., Hori, E., Akaboshi, S., and Takashima, S. (1997). Increased cerebral choline-compounds in Duchenne muscular dystrophy. Neuroreport 8, 1435–1437. doi:10.1097/00001756-199704140-00022
Khairallah, M., Khairallah, R., Young, M. E., Dyck, J. R., Petrof, B. J., and Des Rosiers, C. (2007). Metabolic and signaling alterations in dystrophin-deficient hearts precede overt cardiomyopathy. J. Mol. Cell Cardiol. 43, 119–129. doi:10.1016/j.yjmcc.2007.05.015
Kohen, R., Yamamoto, Y., Cundy, K. C., and Ames, B. N. (1988). Antioxidant activity of carnosine, homocarnosine, and anserine present in muscle and brain. Proc. Natl. Acad. Sci. U. S. A. 85, 3175–3179. doi:10.1073/pnas.85.9.3175
Kornegay, J. N. (2017). The golden retriever model of Duchenne muscular dystrophy. Skelet. Muscle 7, 9. doi:10.1186/s13395-017-0124-z
Laurila, P. P., Luan, P., Wohlwend, M., Zanou, N., Crisol, B., Imamura de Lima, T., et al. (2022). Inhibition of sphingolipid de novo synthesis counteracts muscular dystrophy. Sci. Adv. 8, eabh4423. doi:10.1126/sciadv.abh4423
Lee-McMullen, B., Chrzanowski, S. M., Vohra, R., Forbes, S. C., Vandenborne, K., Edison, A. S., et al. (2019). Age-dependent changes in metabolite profile and lipid saturation in dystrophic mice. NMR Biomed. 32, e4075. doi:10.1002/nbm.4075
Lorena, M., Santos, E. K. D., Ferretti, R., Nagana Gowda, G. A., Odom, G. L., Chamberlain, J. S., et al. (2023). Biomarkers for Duchenne muscular dystrophy progression: impact of age in the mdx tongue spared muscle. Skelet. Muscle 13, 16. doi:10.1186/s13395-023-00325-z
Merckx, C., and De Paepe, B. (2022). The role of taurine in skeletal muscle functioning and its potential as a supportive treatment for Duchenne muscular dystrophy. Metabolites 12, 193. doi:10.3390/metabo12020193
Nitahara-Kasahara, Y., Kuraoka, M., Guillermo, P. H., Hayashita-Kinoh, H., Maruoka, Y., Nakamura-Takahasi, A., et al. (2021). Dental pulp stem cells can improve muscle dysfunction in animal models of Duchenne muscular dystrophy. Stem Cell Res. Ther. 12, 78. doi:10.1186/s13287-020-02099-3
Oh, W., Kim, D. S., Yang, Y. S., and Lee, J. K. (2008). Immunological properties of umbilical cord blood-derived mesenchymal stromal cells. Cell Immunol. 251, 116–123. doi:10.1016/j.cellimm.2008.04.003
Ozdemir, A. T., Ozgul Ozdemir, R. B., Kirmaz, C., Sariboyaci, A. E., Unal Halbutogllari, Z. S., Ozel, C., et al. (2016). The paracrine immunomodulatory interactions between the human dental pulp derived mesenchymal stem cells and CD4 T cell subsets. Cell Immunol. 310, 108–115. doi:10.1016/j.cellimm.2016.08.008
Parker, C. J., and Ring, E. (1970). A comparative study of the effect of carnosine on myofibrillar-ATPase activity of vertebrate and invertebrate muscles. Comp. Biochem. Physiol. 37, 413–419. doi:10.1016/0010-406X(70)90569-4
Rayment, I. (1996). The structural basis of the myosin ATPase activity. J. Biol. Chem. 271, 15850–15853. doi:10.1074/jbc.271.27.15850
Shi, X., Liu, J., Chen, D., Zhu, M., Yu, J., Xie, H., et al. (2019). MSC-triggered metabolomic alterations in liver-resident immune cells isolated from CCl(4)-induced mouse ALI model. Exp. Cell Res. 383, 111511. doi:10.1016/j.yexcr.2019.111511
Sicinski, P., Geng, Y., Ryder-Cook, A. S., Barnard, E. A., Darlison, M. G., and Barnard, P. J. (1989). The molecular basis of muscular dystrophy in the mdx mouse: a point mutation. Science 244, 1578–1580. doi:10.1126/science.2662404
Smith, L. R., and Barton, E. R. (2018). Regulation of fibrosis in muscular dystrophy. Matrix Biol. 68-69, 602–615. doi:10.1016/j.matbio.2018.01.014
Spitali, P., Hettne, K., Tsonaka, R., Sabir, E., Seyer, A., Hemerik, J. B. A., et al. (2018). Cross-sectional serum metabolomic study of multiple forms of muscular dystrophy. J. Cell Mol. Med. 22, 2442–2448. doi:10.1111/jcmm.13543
Srivastava, N. K., Annarao, S., and Sinha, N. (2016). Metabolic status of patients with muscular dystrophy in early phase of the disease: in vitro, high resolution NMR spectroscopy based metabolomics analysis of serum. Life Sci. 151, 122–129. doi:10.1016/j.lfs.2016.01.032
Tidball, J. G., Welc, S. S., and Wehling-Henricks, M. (2018). Immunobiology of inherited muscular dystrophies. Compr. Physiol. 8, 1313–1356. doi:10.1002/cphy.c170052
Timpani, C. A., Hayes, A., and Rybalka, E. (2017). Therapeutic strategies to address neuronal nitric oxide synthase deficiency and the loss of nitric oxide bioavailability in Duchenne Muscular Dystrophy. Orphanet J. Rare Dis. 12, 100. doi:10.1186/s13023-017-0652-y
Tracey, I., Dunn, J. F., and Radda, G. K. (1996). Brain metabolism is abnormal in the mdx model of Duchenne muscular dystrophy. Brain 119 (Pt 3), 1039–1044. doi:10.1093/brain/119.3.1039
Tsai, M. S., Lee, J. L., Chang, Y. J., and Hwang, S. M. (2004). Isolation of human multipotent mesenchymal stem cells from second-trimester amniotic fluid using a novel two-stage culture protocol. Hum. Reprod. 19, 1450–1456. doi:10.1093/humrep/deh279
Tsonaka, R., Signorelli, M., Sabir, E., Seyer, A., Hettne, K., Aartsma-Rus, A., et al. (2020). Longitudinal metabolomic analysis of plasma enables modeling disease progression in Duchenne muscular dystrophy mouse models. Hum. Mol. Genet. 29, 745–755. doi:10.1093/hmg/ddz309
Xu, H., Cai, X., Xu, K., Wu, Q., and Xu, B. (2023). The metabolomic plasma profile of patients with Duchenne muscular dystrophy: providing new evidence for its pathogenesis. Orphanet J. Rare Dis. 18, 273. doi:10.1186/s13023-023-02885-1
Zannettino, A. C., Paton, S., Arthur, A., Khor, F., Itescu, S., Gimble, J. M., et al. (2008). Multipotential human adipose-derived stromal stem cells exhibit a perivascular phenotype in vitro and in vivo. J. Cell Physiol. 214, 413–421. doi:10.1002/jcp.21210
Keywords: Duchenne muscular dystrophy, mesenchymal stromal cells, metabolomics, cell therapy, mdx mouse
Citation: Nitahara-Kasahara Y, Posadas-Herrera G, Hirai K, Oda Y, Snagu-Miyamoto N, Yamanashi Y and Okada T (2024) Characterization of disease-specific alterations in metabolites and effects of mesenchymal stromal cells on dystrophic muscles. Front. Cell Dev. Biol. 12:1363541. doi: 10.3389/fcell.2024.1363541
Received: 30 December 2023; Accepted: 22 April 2024;
Published: 14 June 2024.
Edited by:
Willem Fibbe, Leiden University Medical Center (LUMC), NetherlandsReviewed by:
Naseem Ahamad, The University of Texas Health Science Center at San Antonio, United StatesYuyao Tian, Massachusetts General Hospital and Harvard Medical School, United States
Copyright © 2024 Nitahara-Kasahara, Posadas-Herrera, Hirai, Oda, Snagu-Miyamoto, Yamanashi and Okada. This is an open-access article distributed under the terms of the Creative Commons Attribution License (CC BY). The use, distribution or reproduction in other forums is permitted, provided the original author(s) and the copyright owner(s) are credited and that the original publication in this journal is cited, in accordance with accepted academic practice. No use, distribution or reproduction is permitted which does not comply with these terms.
*Correspondence: Takashi Okada, dC1va2FkYUBpbXMudS10b2t5by5hYy5qcA==; Yuko Nitahara-Kasahara, eS1rYXNhaGFyYUBpbXMudS10b2t5by5hYy5qcA==
 Yuko Nitahara-Kasahara
 Guillermo Posadas-Herrera
 Kunio Hirai2