- 1State Key Laboratory of Respiratory Disease, Guangzhou Institute of Respiratory Health, The First Affiliated Hospital of Guangzhou Medical University, Guangzhou, China
- 2Department of Respiratory, The Second Affiliated Hospital of Guangzhou Medical University, Guangzhou, China
- 3Department of Critical Care Medicine, The Third Affiliated Hospital of Guangzhou Medical University, Guangzhou, China
- 4GMU-GIBH Joint School of Life Sciences, Guangzhou Medical University, Guangzhou, Guangdong, China
- 5Department of Thoracic Medicine, Shenzhen Second People’s Hospital, The First Affiliated Hospital of Shenzhen University, Guangzhou, China
- 6Department of Respiratory and Critical Care Medicine, Guizhou Provincial People’s Hospital, Guiyang, Guizhou, China
Background: Pulmonary hypertension (PH) is a progressive disease affecting the lung vasculature that is characterized by sustained vasoconstriction and leads to vascular remodeling. The lung microbiome contributes to PH progression, but the function of the gut microbiome and the correlation between the gut microbiome and metabolome remain unclear. We have analyzed whether chronic hypoxia-induced PH alters the rat fecal microbiota.
Purpose: We explored hypoxia-induced pulmonary hypertension model rats to find out the characteristic changes of intestinal microorganisms and metabolites of hypoxia-induced pulmonary hypertension, and provide a theoretical basis for clinical treatment.
Methods: In the current study, a chronic hypoxia-induced PH rat model was used to investigate the role of the gut microbiome and metabolome as a potential mechanism contributing to the occurrence and development of PH. 16S ribosomal ribonucleic acid (16S rRNA), short-chain fatty acid (SCFA) measurements, mass spectrometry (MS) metabolomics analysis and metatranscriptome were performed to analyze stool samples. The datasets were analyzed individually and integrated for combined analysis using bioinformatics approaches.
Results: Our results suggest that the gut microbiome and metabolome of chronic hypoxia-induced PH rats are distinct from those of normoxic rats and may thus aid in the search for new therapeutic or diagnostic paradigms for PH.
Conclusion: The gut microbiome and metabolome are altered as a result of chronic hypoxia-induced PH. This imbalanced bacterial ecosystem might play a pathophysiological role in PH by altering homeostasis.
Introduction
Pulmonary hypertension (PH) is a pathophysiological disorder that involve multiple clinical factors and can be associated with a variety of cardiovascular and respiratory diseases. The mechanisms of PH are complicated and not well understood. Limited progress has been made in preventing or arresting the progression of PH despite extensive efforts (Humbert et al., 2022). Thus, it is imperative to consider innovative concepts for the discovery of new targets for a successful PH regimen.
There are five types in clinical classification of pulmonary hypertension: GROUP 1 Pulmonary arterial hypertension (PAH), GROUP 2 PH associated with left heart disease, GROUP 3 PH associated with lung diseases and/or hypoxia, GROUP 4 PH associated with pulmonary artery obstructions and GROUP 5 PH with unclear and/or multifactorial mechanisms (Simonneau et al., 2019). Although the causes of PH in the five groups are different, they can lead to pulmonary vascular pathological changes. Although the main lesion site of PH is the pulmonary vessels, it involves many other tissues and organs, such as the immune system (Parperis et al., 2023), heart (Cassady and Ramani, 2020), and kidney (Bolignano et al., 2013). The interaction of various organs causes PHs to have the characteristics of systemic diseases (Humbert et al., 2022). Recently, increasing evidence has shown that the intestinal tract and its microbial flora are closely related to lung diseases, especially chronic diseases. Changes in the intestinal microbial flora could affect the evolution of lung diseases, and in turn, the development of lung diseases also affects changes in the intestinal flora and its metabolites (Budden et al., 2019; Bowerman et al., 2020). Similarly, the “gut-lung axis” may play an important role in the pathogenesis of PH. Related papers have reported the microbiome of PAH and hypoxic PH. Daphne M Moutsoglou (Moutsoglou et al., 2023) has reported that the intestinal flora in the feces of PAH patients is dysbiotic, with an abundance of flora associated with inflammatory states and a low abundance of beneficial flora, and that the severity of pulmonary vascular disease is associated with a low diversity of intestinal microbiota. Observing the function and classification of the gut microbiome profile of PH patients showed that the gut microbes in PH patients differ from those in healthy individuals (Kim et al., 2020). It has been reported that there was no difference in the overall microbiome (α or β diversity) between SU5146 and hypoxia-induced PAH rats compared with normoxic rats, however, the ratio of Firmicutes and Bacteroidetes was significantly increased in SU5146 and hypoxia-induced PAH rats (Callejo et al., 2018; Sanada et al., 2020). With the emerging role of the gut microbiome in health and disease, the gut-lung axis could offer attractive alternative pathways in the pathogenesis of PAH or PH (Ranchoux et al., 2017; Wedgwood et al., 2020), as the gut and its microbiome play an important role in pulmonary vascular function. Although PAH and hypoxic PH have different etiologies, they share some common pathological mechanisms, such as increased oxidative stress in the pulmonary arteries, activation of HIF1a, and enhanced glycolysis in PASMCs. Hypoxia, as an important cause of pulmonary vascular remodeling and the development of PH, also has an important impact on intestinal microbes. We speculated that if the microbiome is changed in PAH, it might also be altered in hypoxic PH.
Therefore, we observed chronic hypoxia-induced pulmonary hypertension in rats. Thus, our objective in this study was to evaluate the hypothesis that chronic hypoxia-induced PH rats have a unique gut microbiome profile that produces microbial metabolites and molecules important in the pathogenesis of PH. Our data suggest that microbial imbalances may contribute to the development of chronic hypoxia-induced PH.
Materials and methods
Animal PH model
For the animal model, male Wistar rats that weighed from 250 to 350 g and were aged from 6 to 8 weeks were used in this study. The acquisition and care of rats are described in the Acknowledgments section. Twenty-nine rats were randomly divided into two groups: 15 in normoxia group and 14 in hypoxia-induced PH group. Rats were maintained in an environment with a controlled temperature (23°C) and relative humidity (60%) on a 12 h light and 12 h dark cycle and with free access to sterile food and water. For the hypoxia-induced PH model, male rats kept in normal chow were exposed to 10% O2 (hypoxia) or room air (normoxia) for 3 weeks as previously described (Lu et al., 2015). On day 21, sodium pentobarbital at a dose of 30 mg/kg was used to sacrifice the rats. The catheter was inserted into the isolated right external jugular vein, inserted into the right ventricle through the right atrium, and the right ventricular systolic pressure (RVSP) was recorded (Wu et al., 2020). The right ventricular hypertrophy index (RVHI) was measured by the ratio of the right ventricle/left ventricle + septum (Kim et al., 2010). Development of the PH model was evaluated by measuring RVHI and RVSP.
Analysis of the gut microbiota
For analysis of the gut microbiota, fresh fecal samples were collected and processed from rats. Samples was further extracted using the OMEGA Soil DNA Kit (M5635-02) (Omega Bio-Tek, Norcross, GA, USA) by CTAB DNA extraction protocol (Arseneau et al., 2017), followed by sequencing on the Illumina HiSeq 2,500 platform. The primer sequences were as follows: 341F 5′-CCTAYGGGRBGCASCAG-3′ and 806R 5′-GGACTACNNGGGTATCTAAT-3′. Sequence assembly, quality control, and clustering were then performed.
SCFA measurements
Quantification of SCFAs was performed as described previously (Garcia-Villalba et al., 2012). The column was an Agilent HP-INNOWAX capillary column (30 m*0.25 mm ID*0.25 μm) (Suzhou Bionovogene Co., Ltd); split injection, injection volume 1 μL, split ratio 10:1. The inlet temperature was 250°C; the ion source temperature was 230°C; the transfer line temperature was 250°C; and the quadrupole temperature was 150°C. The initial temperature of the temperature program was 90°C; then, it was heated to 120°C at 10°C/min and 150°C at 5°C/min; finally, it was heated to 250°C at 25°C/min and maintained for 2 min. The carrier gas was helium at a flow rate of 1.0 mL/min.
Metabolomic profiling by liquid chromatography and mass spectrometry (LC‒MS)
Metabolomic analysis of all samples was performed using the Thermo Ultimate 3,000 system according to previous studies (Niu et al., 2019). Additionally, ESI-MSn analysis was conducted as previously described (Li et al., 2019; Niu et al., 2020). Briefly, chemical composition of rat fecal samples were evaluated the by untargeted LC-MS (liquid chromatography-mass spectrometry) form BioNovoGene (Suzhou, China). 100 mg of stool sample was added to 0.6 mL of 2-chlorophenylalanine in methanol and centrifuged at 12,000 rpm for 10 min at 4°C. We filtered out 300 μL of the supernatant using a 0.22 μM filter. Chromatography was performed using ACQUITY UPLC ® HSS T3 (150 × 2.1 mm, 1.8 µm) (Waters, Milford, MA, USA) with the column temperature maintained at 40°C. The flow rate was set to 0.25 mL/min and the injection volume was set to 2 μL. Mass spectrometric detection of metabolites was used with an Orbitrap Exploris 120 (Thermo Fisher Scientific, USA). Electrospray ionization mass spectrometry (ESI-MSn) experiments were performed in positive and negative modes (voltages of 3.5 kV and −2.5 kV). The sheath, auxiliary gas, and capillary temperatures were set to 30 and 10 arbitrary units and 325°C. The analyzer’s scan mass range is m/z 81-1,000 with a mass resolution of 60,000.
Metagenomic de novo sequencing
Extraction of total microbiome DNA
Mo Bio/QIAGEN’s DNeasy PowerWater Kit was used for extraction, and the extracted DNA was detected. Fluorescence spectrophotometer (Quantifluor-ST fluorometer, Promega, E6090; Quant-iT PicoGreen dsDNA Assay Kit, Invitrogen, P7589), measure the absorbance value of DNA at 260 nm and 280 nm respectively, detect the concentration of DNA, and use 1% agarose gel electrophoresis to detect the quality of DNA. Adjust the concentration of the DNA solution. Store the DNA working solution at 4°C and the storage solution at −20°C.
Library construction and sequencing process
Use the standard Illumina TruSeq DNA library preparation protocol (Illumina TruSeq DNA Sample Preparation Guide) to construct the required genomic on-machine library.
Correlation analysis of the gut microbiome and host fecal metabolome
The correlation between the gut microbiota and the host fecal metabolome was analyzed. Analysis was performed as previously described (Duan et al., 2021). In brief, Pearson correlation analysis was performed using the coNet plug-in of the Cytoscape software to reveal the correlation between intestinal flora and host fecal metabolites, without setting the correlation coefficient and p-value threshold. Heat maps were used to display the correlation between intestinal flora and fecal metabolites.
Statistical analysis
Data are shown as the mean ± standard error. Data were analyzed using Student’s t-test. Pearson’s correlation analysis was used to determine the correlation between the gut microbiota and the host fecal metabolome. Relative indices were analyzed using SPSS version 24.0 software. The data were graphically plotted using GraphPad Prism 7. Differences were considered statistically significant at p < 0.05.
Results
Changes in the gut microbiome in rats with chronic hypoxia-induced PH
As a classic PH model of small animals such as rats, chronic hypoxia-induced PH is widely used to study the occurrence and development of PH (Dumas et al., 2012). PH induced by chronic hypoxia mainly caused the proliferation, hypertrophy and remodeling of rat pulmonary vascular smooth muscle, which led to thickened smooth muscle of the vascular media (Pak et al., 2007). Rats after 21 days of hypoxia, it can be seen that RVSP and RVHI in the hypoxia group were significantly higher than the normoxia group, indicating that the model was successful (Figures 1A, B). Chronic hypoxia is bound to be accompanied by changes in the gut microbiome of rats. We observed from the two indicators ACE and Chao1 in the alpha diversity index that compared with the normoxia group, the intestinal microbial composition diversity and richness of the hypoxia-induced PH group were lower (Figures 1C, D). In addition, based on the MNDS plot analysis, we identified different bacterial species in the two groups (Figure 1E). Although some bacterial genera of the two groups were similar in distance, they did not show obvious clusters. However, the abundance of intestinal flora changed in the two groups. At the phylum level, Firmicutes (p = 0.08), Spirochaetota (p = 0.07), Campilobacterota (p = 0.04), and Euryarchaeota (p = 0.21) were higher in abundance in the hypoxia-induced PH group than in the normoxia group (Statistically significant difference in Campilobacterota), but Bacteroidota (p = 0.02), Proteobacteria (p = 0.03), Actinobacteriota (p = 0.34), and Chloroflexi (p = 0.04) were lower in abundance than in the normoxia group (Statistically significant difference in Bacteroidota, Proteobacteria, Chloroflexi). At the class level, the abundances of Clostridia (p = 0.03), Saccharimonadia (p = 0.01), and Spirochaetia (p = 0.07) were increased in the hypoxia-induced PH group compared with those in the normoxia group (Statistically significant difference in Clostridia and Saccharimonadia), but the abundance of Bacteroidia (p = 0.02) was lower than in the normoxia group. At the genus level, the abundances of Lactobacillus (p = 0.49), Lachnospiraceae NK4A136 (p = 0.49), and Candidatus Saccharimonas (p = 0.01) were elevated in the hypoxia-induced PH group compared with those in the normoxia group (Statistically significant difference in Candidatus Saccharimonas), while the abundances of Blautia (p = 0.02), Ruminococcus (p = 0.04), Allobaculum (p = 0.12), Alloprevotella (p = 0.02), Turicibacter (p = 0.01)and Clostridium sensu stricto 1 (p = 0.45) were lower than in the normoxia group (Statistically significant difference in Blautia, Ruminococcus, Alloprevotella and Turicibacter) (Figures 1F–H).
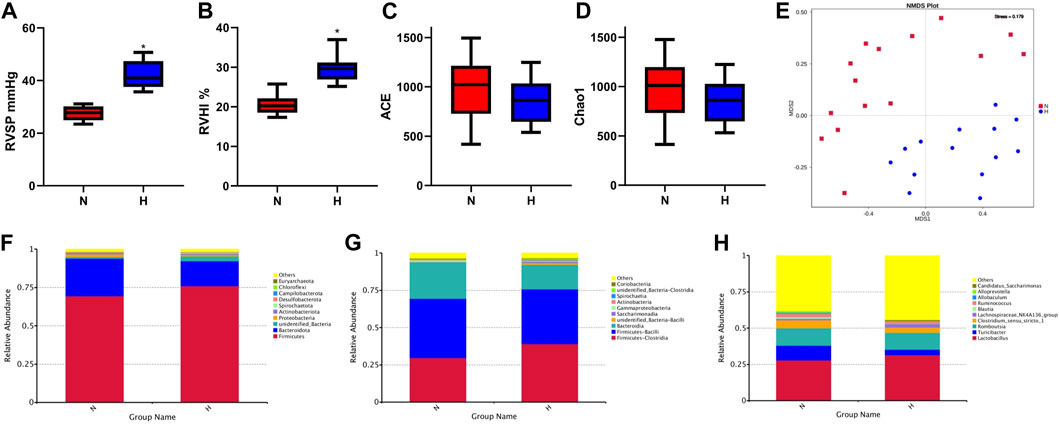
Figure 1. Intestinal microbial diversity and composition in the normoxia group and hypoxia-induced PH group. Differences in RVSP (A) and RVHI (B) between the two groups. Variation in diversity within the two groups by ACE (C) and Chao1 index (D). NMDS plots based on (E). Average relative abundances of dominant bacterial phyla (F), classes (G), and genera (H) in the intestine within the two groups. Normoxia group, n = 15; hypoxia-induced PH group, n = 14.
Using PICRUSt (version 1.1.4) to predict the function of intestinal microbes (Langille et al., 2013), it was found that the expression of some signaling pathways changed significantly, such as genetic information processing, metabolism processing and environmental processing. The functional genes that changed significantly in the hypoxia-induced PH and normoxic groups are shown in Figure 2.
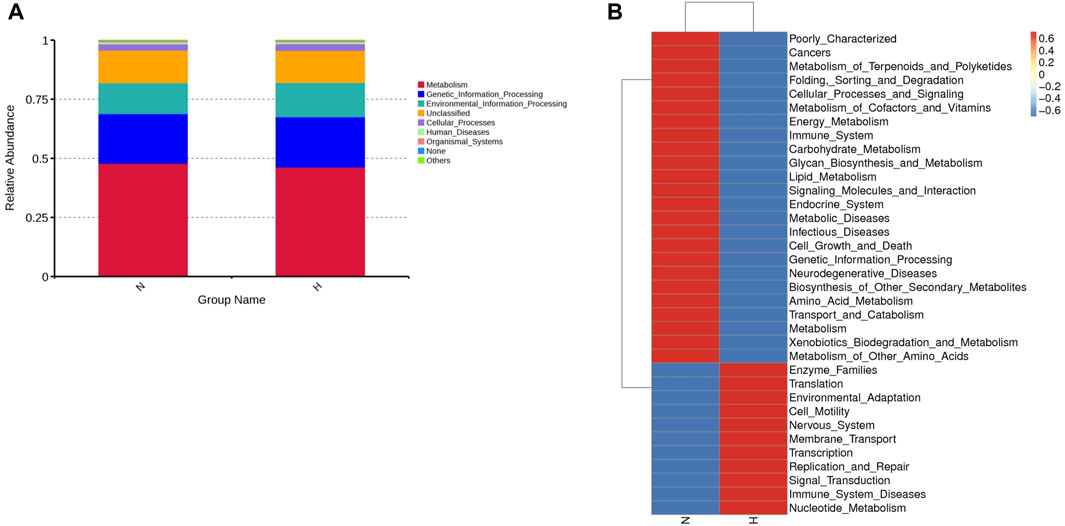
Figure 2. Differentially expressed genes involved in the pathogenicity of intestinal bacteria in the normoxia and hypoxia-induced PH groups. (A) Enriched genes involved in regulation. (B) Enriched genes listed in the heatmap. Normoxia group, n = 15; hypoxia-induced PH group, n = 14.
Changes in SCFAs in rats with chronic hypoxia-induced PH
Short-chain fatty acids (SCFAs) are important metabolites of intestinal microbes (Van Der Hee and Wells, 2021). They act as signaling molecules to affect a series of activities of the host. We observed that the primary SCFAs in rat feces were propionic, acetic, butyric and valeric acid and found that valeric acid and isovaleric acid levels in the hypoxia-induced PH group were lower than those in the normoxic group (normoxic group vs. hypoxia-induced PH group: valeric acid 74.17 ± 32.49 vs. 50.18 ± 19.49, p = 0.024; isovaleric acid 39.12 ± 17.66 vs. 27.26 ± 6.87, p = 0.026) (Figure 3).
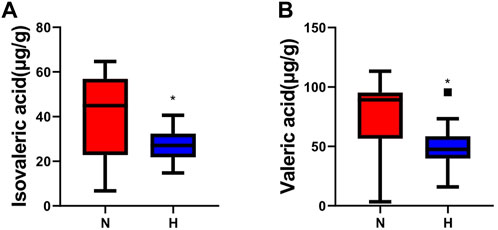
Figure 3. Changes in SCFAs in rats with chronic hypoxia-induced PH. The levels of isovaleric acid (A) and valeric acid (B) measured by GC‒MS in the normoxia group and hypoxia-induced PH group. The values are presented as the means ± SDs, *p < 0.05. Normoxia group, n = 15; hypoxia-induced PH group, n = 14.
Changes in the fecal metabolome in rats with chronic hypoxia-induced PH
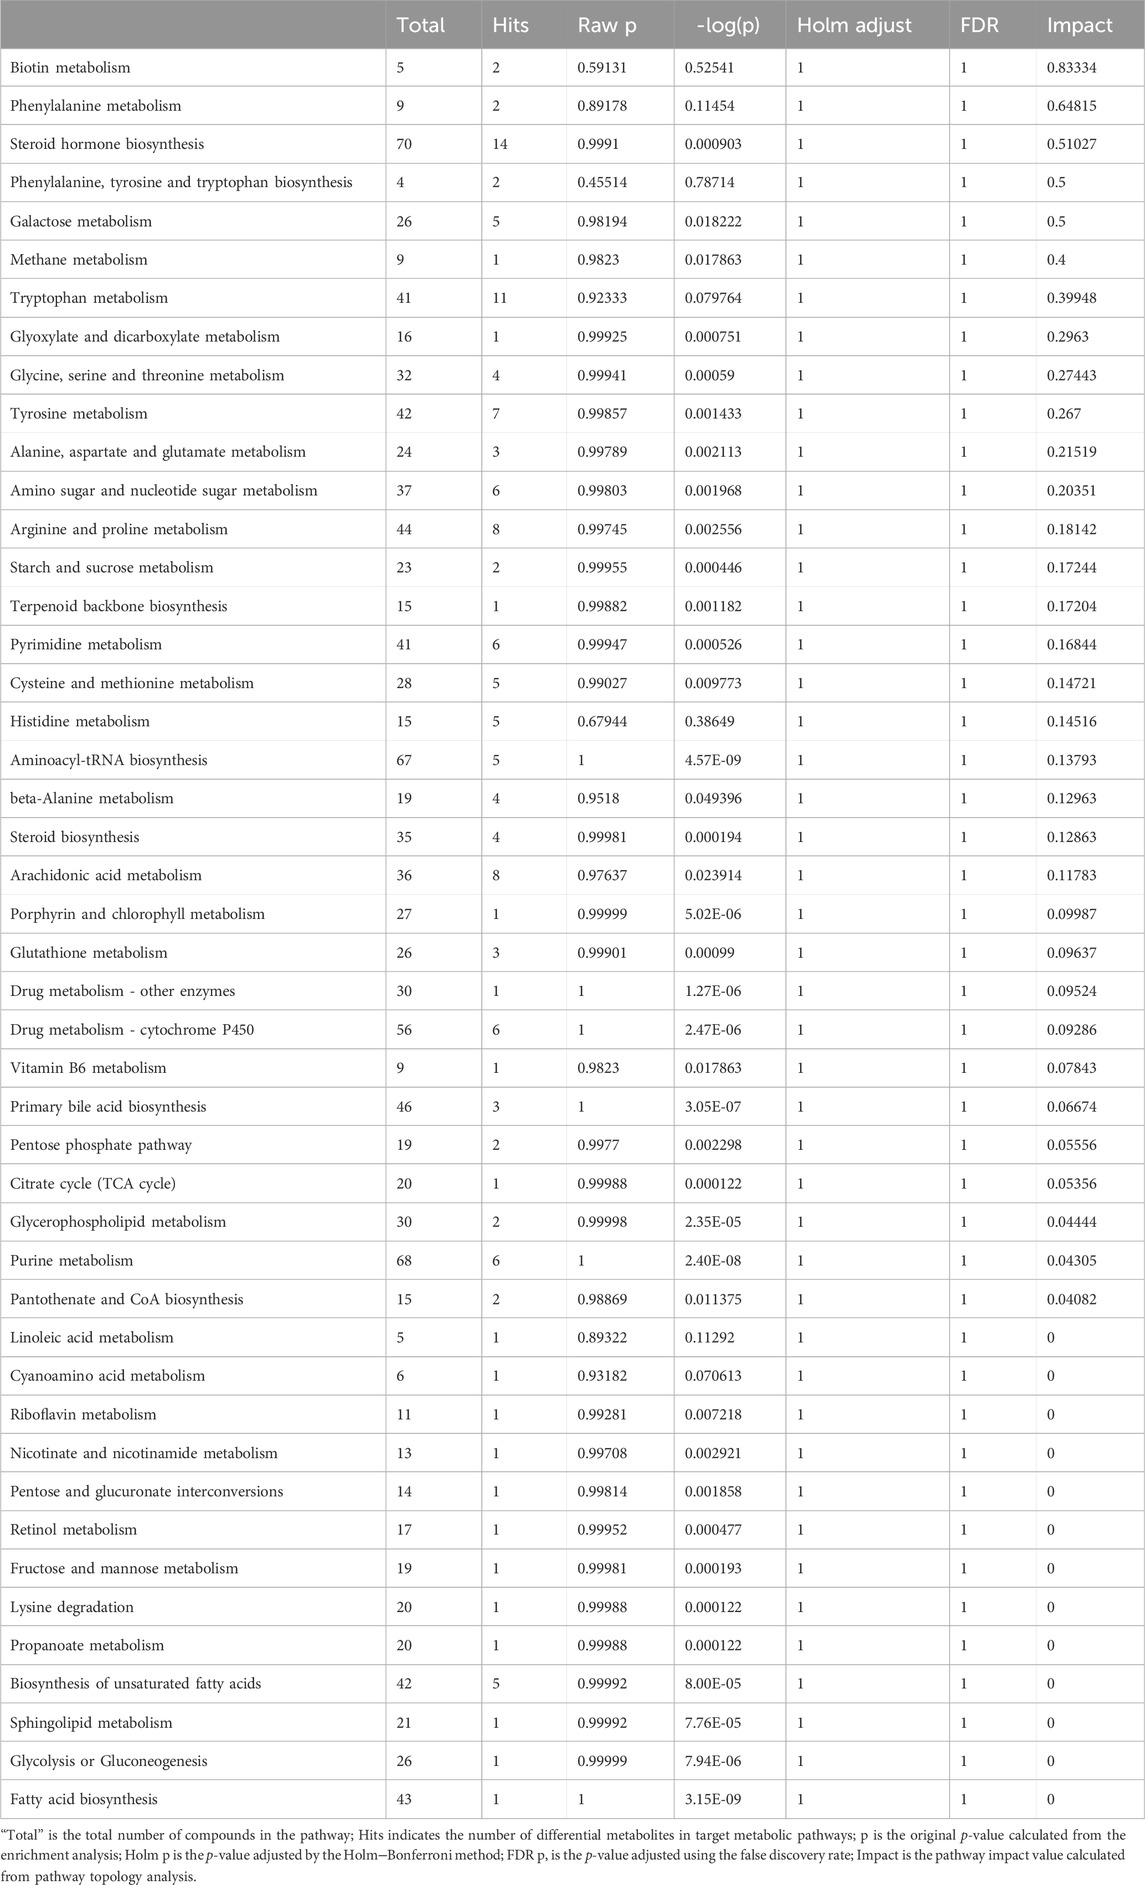
Recently, studies have suggested that the occurrence and development of diseases are closely related to metabolites and that changes in intestinal flora may be related to changes in metabolites. Therefore, in addition to observing changes in intestinal flora, we also observed chronic hypoxia-induced PH rat changes in fecal metabolites. First, in positive and negative ion mode LC/MS total ion base peak chromatograms, it can be seen that the base peaks in the two groups are not at the same level, indicating that the metabolite abundances are different (Figures 4A, B). Next, to “simplify and reduce dimensionality” of high-dimensional and complex data on the basis of preserving the original information to the greatest extent and establish a reliable mathematical model to summarize the characteristics of the metabolic spectrum of the research object, we used partial least squares-discriminant analysis (PLS-DA) to screen for differential metabolites. As shown in Figures 4C–F, the contribution of each sample of PLS-DA to the observed component is equal and consistent. It was determined that the stability and repeatability of the analysis model were sufficiently good, so we used p-value ≤0.05 and VIP ≥1 as the screening criteria for differential metabolites. Our research found that compared with the normoxia group, many metabolites of rats in the hypoxia-induced PH group showed significant changes. Among the 35 metabolites, 14 metabolites were upregulated in the hypoxic group, and 21 metabolites were downregulated (Figure 4G). The intestinal balance in rats with hypoxia-induced pulmonary hypertension was disrupted, and the metabolites underwent significant changes. Furthermore, the method of KEGG annotation of the abovementioned significantly different metabolites enriched the signaling pathways (p-value and influence value), and the signaling pathways of biotin and phenylalanine metabolism had the most significant changes (Figure 5; Table 1). Our method is nontargeted metabolomics to support the overall change level in metabolomics predicted from related changes in microbiome composition.
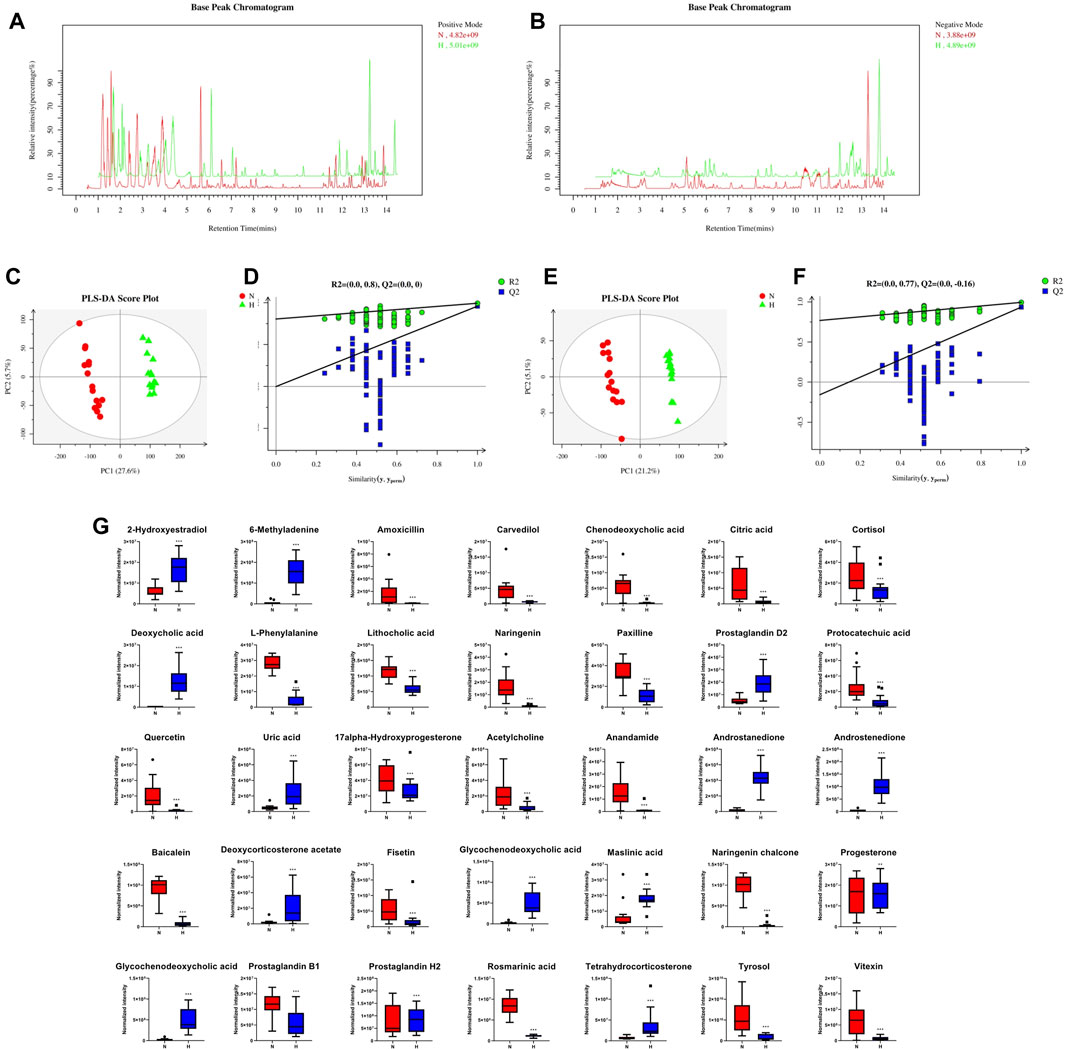
Figure 4. The effect of interference on the fecal metabolome. Typical LC–MS total ion current (TIC) chromatograms of nontarget metabonomics from the normoxia and hypoxia-induced PH groups in positive mode (A) and negative mode (B). (C) PLS-DA score plot of positive ions. (D) Permutation testing of positive ions. (E) PLS-DA score plot of negative ions. (F) Permutation testing of negative ions. (G) Fecal metabolite disorder between the normoxia and hypoxia-induced PH groups. The data are presented as the mean ± SD, and significant differences between groups are indicated as ***p < 0.001, **p < 0.01 and *p < 0.05. Normoxia group, n = 15; hypoxia-induced PH group, n = 14.
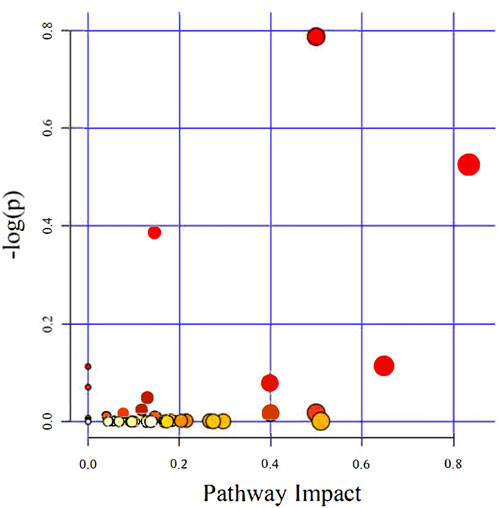
Figure 5. The KEGG pathways enriched and analyzed. Ingenuity pathway analysis. The size and color are based on the p-value and impact value, and a small p-value and large pathway impact value indicate that the pathway is greatly influenced.
Correlation between the gut microbiota and the fecal metabolome
At present, an increasing number of studies report that gut microbes and their derived metabolites are the key mechanism for the communication and stimulation between gut microbes and the host, and it is an important link that affects the health of the host and the occurrence of diseases (Bowerman et al., 2020; Vernocchi et al., 2020; Gong et al., 2021). We explored the relationship between intestinal microbes and metabolites in rats with PH induced by hypoxia. After the results of the correlation heatmap and redundancy analysis, it can be seen that there are significant correlations between multiple gut microbiota at the genus level and 34 metabolic pathways. Figure 6 shows that among the 30 microbiota at the genus level, except for Lactobacillus, Treponema, Candidatus Aquiluna, Romboutsia, and Staphylococcus, the remaining gut microbiota had a strong correlation with 34 metabolites. These findings suggested relationships between gut microbiota changes and the host metabolome, which were promoted by hypoxia-induced PH development in rats.
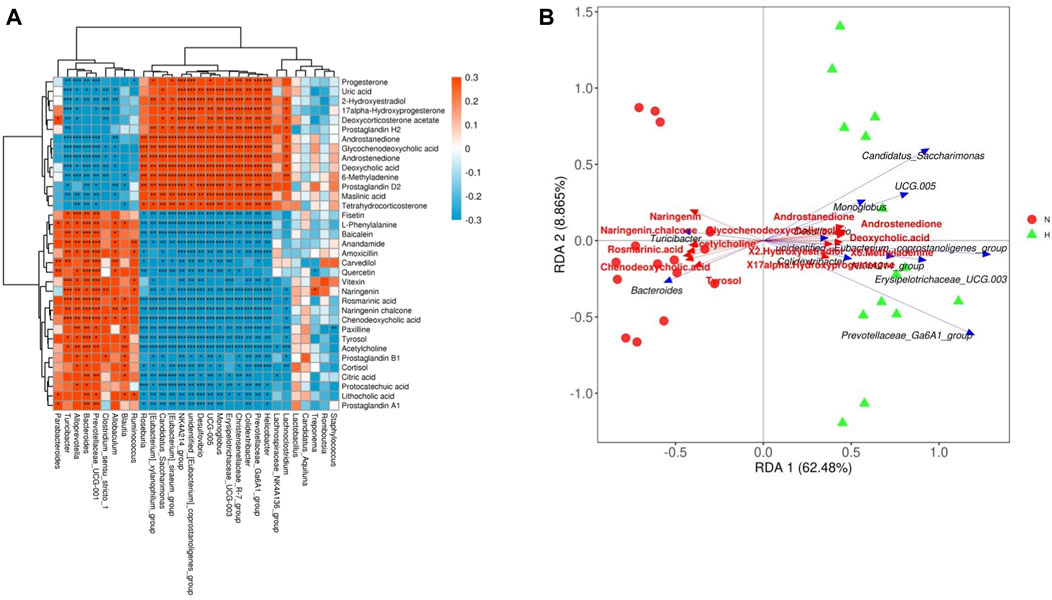
Figure 6. Relationship between the gut microbiome and host metabolome. (A) Heatmaps indicate positive (red) and negative (blue) correlations between the levels of host metabolites and the identified gut microbes at the genus level of normoxia rats compared with hypoxia-induced PH rats. The legend shows correlation values from −1 to 1 and assigns the appropriate color to them (red for positive correlations and blue for negative correlations). (B) Redundancy analysis between the levels of host metabolites and the identified gut microbiome at the genus level in normoxic rats compared with hypoxia-induced PH rats. There is an acute angle between the two variables, which represents a positive correlation, and there is a synergistic effect; there is an obtuse angle between the two variables, which represents a negative correlation, and there is an antagonistic effect. Normoxia group, n = 15; hypoxia-induced PH group, n = 14.
Changes in the fecal metatranscriptome in rats with chronic hypoxia-induced PH
Metatranscriptomics mainly studies the expression levels of all transcripts (mRNA) of microorganisms in environmental samples and their transcriptional regulation rules under different environmental conditions at the population level, and studies the relationship between microorganisms and the natural environment. Metatranscriptome can study changes in complex microbial communities from the transcription level and can better explore potential new genes. First, we observed from two indicators, ACE and Chao1, that compared with the normoxic group, the intestinal microbial composition diversity and richness of the hypoxia-induced PH group were lower (Figures 7A, B). In addition, NMDS analysis showed that there was a significant difference in bacterial species between the two groups (stress = 0.004) (Figure 7C). Similarly, the abundance of intestinal flora in the two groups was different at the phylum and genus level. In addition, observing the function of intestinal microorganisms in the metatranscriptome, it was also found that the expression of some signaling pathways has changed significantly, such as genetic information processing, metabolism, and cells (Figure 8A). We used principal component analysis (PLS-DA) to analyze the differential metabolites between the two groups. It can be seen that there is a clear distinction between the two, indicating that there are significant differences (Figure 8B). For further functional difference analysis, we used the KO database to conduct KO metabolic pathway analysis on the respondent’s metatranscriptome. From the heat map results, we can see that many enzymes and proteins are significantly different between the two groups (Figure 8C). In addition, based on gene abundance, the KEGG metabolic pathway was also enriched from the metatranscriptome (Figure 8D).
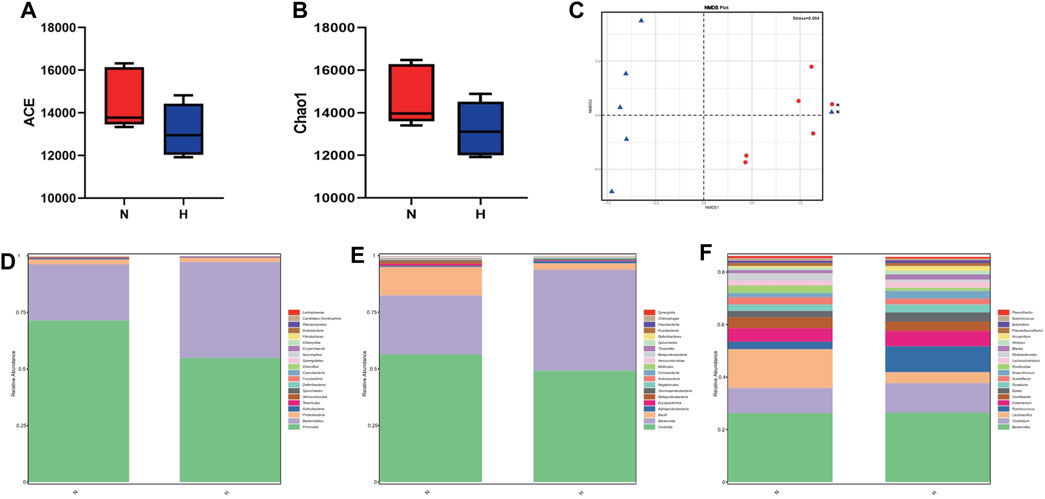
Figure 7. Metatranscriptome in intestinal microbial diversity and composition in the normoxia group and hypoxia-induced PH group. Variation in diversity within the two groups by ACE (A,B) Chao1 index. NMDS plots based on (C). Average relative abundances of dominant bacterial phyla (D), classes (E), and genera (F) in the intestine within the two groups. Normoxia group, n = 5; hypoxia-induced PH group, n = 5.
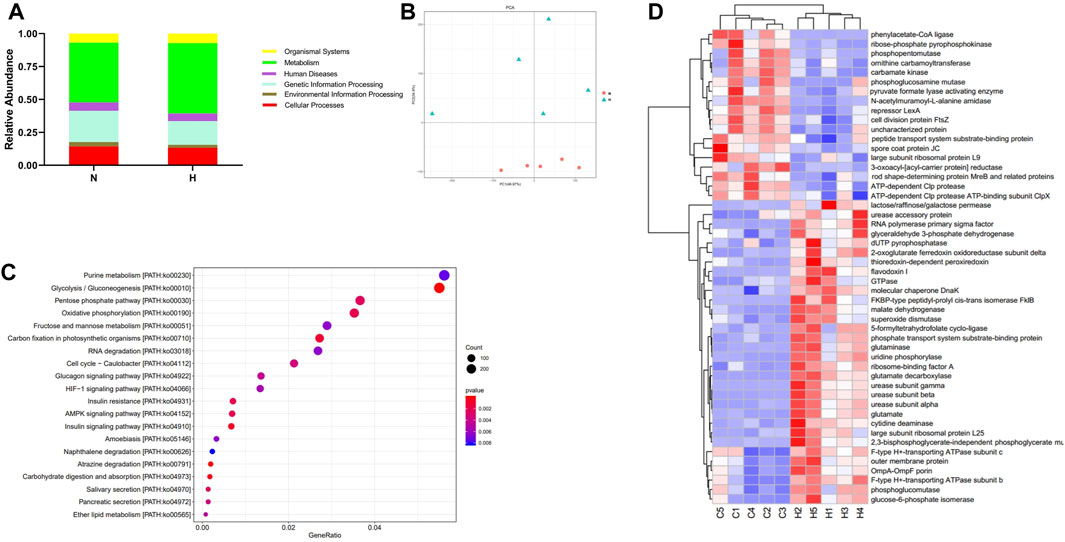
Figure 8. Metatranscriptomic analysis of intestinal microbial gene changes and functional changes in normoxia group and hypoxia-induced PH group. (A) Enriched genes involved in regulation. (B) PLS-DA analyzed differential metabolites between the two groups. (C) Differential functional unit clustering heat map. (D) KEGG metabolic pathway enrichment analysis. Normoxia group, n = 5; hypoxia-induced PH group, n = 5.
Discussion
It has been found that the intestinal microbes of patients with pulmonary arterial hypertension (type I PAH (Kim et al., 2020) and chronic thromboembolic pulmonary hypertension (Ikubo et al., 2022)) have significant changed, which are related to the pathogenesis of pulmonary arterial hypertension, but there are few studies on pulmonary hypertension caused by hypoxia. The study explored hypoxia-induced pulmonary hypertension model rats to find out the characteristic changes of intestinal microorganisms and metabolites of hypoxia-induced pulmonary hypertension, and provide a theoretical basis for clinical treatment.
With the continuous research being conducted on microorganisms, our understanding of their importance has become increasingly profound in the past 10 years. The remote gastrointestinal tract has the largest microbial reservoir in the human body, and its interaction with host cells affects the function of tissues and organs. At present, increasing evidence proves that the composition and function of the gastrointestinal microbiota are related to respiratory diseases. The mechanisms leading to the PH phenotype in MCT (monocrotaline) and hypoxia rat models were difference that MCT was related to endothelial toxicity and marked lung inflammation, whereas hypoxia was characterized by proliferative pulmonary vascular disease (Stenmark et al., 2009). Although significant changed in intestinal microbiota were found in MCT-induced PH rat models in our previous research (Hong et al., 2021), gut microbiome and metabolome changed in rats between MCT model and hypoxia model were difference. Therefore, it is necessary to elucidate the changes in gut microbiota and metabolites in chronic hypoxia-induced PH. In this study, 16S amplicon analysis technology was used to measure the flora in the rat intestine and mass spectrometry metabolomics to measure the changes in fecal metabolites. First, compared with the normoxia group, the hypoxia group’s gut microbiota alpha diversity and beta diversity were significantly reduced, which suggests that the hypoxia group’s intestinal diversity and richness are lower. Subsequently, we further observed the specific differences in the biological classification of the bacterial species in the two groups. The bacterial composition of the hypoxic group showed significant changes at the phylum, class, order, and genus levels. For example, in the hypoxic group, Turicibacter (Goodrich et al., 2016), Blautia (Liu et al., 2021), Alloprevotella (Cai et al., 2020) and other beneficial gut microbes related to inflammatory tumors changed significantly, which suggests that the health status of the hypoxic group was poor. These findings suggest that the imbalance of intestinal microbes may be related to pulmonary hypertension, which may be a risk factor for the development of pulmonary hypertension. Subsequently, we performed functional predictions of the gut microbiota and demonstrated host microbiome genes and related signaling pathway changes in hypoxia-induced PH rats, which suggested that hypoxia exposure increased the pathogenicity of the intestinal flora.
A stable gut microbiota plays a vital role in maintaining the homeostasis of barrier integrity, function, metabolism and immunity (Nicholson et al., 2012; Shi et al., 2017). However, alterations in the intestinal flora could lead to changes in the function of multiple organs in the host body (Bowerman et al., 2020). In this study, changes in intestinal microbes were accompanied by alterations in their metabolites. It has been found that valeric acid, an SCFA, can produce vasodilation and lower blood pressure (Onyszkiewicz et al., 2020), and we found that valeric acid and isovaleric acid were lower in the hypoxia-induced PH group. In the hypoxia-induced PH group, 35 significant changes in metabolites (14 upregulated, 21 downregulated) were closely related to the pathological changes in pulmonary vessels. For example, fisetin (Chen et al., 2019; Rodius et al., 2020), naringenin (Tang et al., 2017; Heidary Moghaddam et al., 2020), vitexin (Xue et al., 2020), baicalein (Woo et al., 2005), tyrosol (Boronat et al., 2019), quercetin (Ferenczyova et al., 2020) and other substances with protective effects on the cardiovascular system decreased significantly in the hypoxia-induced PH group. For prostaglandin H2 (Kato et al., 1990) and uric acid (Kimura et al., 2020), which promote vasoconstriction, inflammation and vascular sclerosis are significantly increased. Indeed, the microbiota not only impacted metabolites but also played a part in various signaling pathways. An increasing number of studies have shown that intestinal flora is related to various signaling pathways involved in the occurrence and development of PH (Chen et al., 2022). In this study, we enriched and identified 43 signaling pathways. and analyzed the change and functional influence of the intestinal flora on signaling pathways (Figure 5; Table 1). Among them, the biotin metabolism pathway was the most affected. We used metatranscriptomics to analyze rat feces, which also showed that the diversity and richness of intestinal microorganisms in the hypoxia-induced PH group decreased, and there were significant differences in metabolites and enriched KEGG metabolic pathways (Figure 8). Patients in each group of PH have the same pathophysiology, prognosis, and treatment response (Thenappan et al., 2018); however, there is heterogeneity among the groups. The potential mechanisms of PH may related to various causes such as chronic inflammation, immune disorders, and autophagy. It can be observed from the hypoxia-induced PH model in rats that the composition of the fecal microbiota changes. This unbalanced bacterial ecosystem may in turn play a role in the development of PH by changing immunity, inflammation, and metabolic homeostasis. It has been reported that there is also an enrichment of pro-inflammatory microbial metabolites in PAH patients (Moutsoglou et al., 2023). Therefore, this suggests that in patients with different types of PH, their fecal microbial groups and metabolite enrichments may be different. Fecal metabolites in rats induced by hypoxia may be different from those in PAH or other types of PH, but this change can also lead to increased production of metabolites such as pro-inflammatory substances, enrichment of signaling pathways such as ROS, biotin or HIF involved in the development of PH. These different changes can lead to the same result which may lead to participation in the development of PH through chronic inflammation, immunity and metabolism.
With the development of high-throughput sequencing technology and the continuous deepening of omics research, we can study the data integration of various omics techniques to comprehensively and systematically understand the interrelationship of multiple substances. This study integrates metabolomics and the microbiome, correlates metabolites with microbial abundance, species and genes, and analyzes the correlation between metabolites and microbial populations. Based on our study, exposure to hypoxia induced PH, and the gut microbiota may have a causal interaction with the host metabolome, which ultimately led to the correlation between the gut microbiota and the host metabolome. Such findings may further contribute to the development of novel biomarkers.
Our study has limitation. No human specimens were used in the study, and the clinical relevance is poor.
Conclusion
We analyzed the stool of chronic hypoxia-induced PH rat through various methods such as: 16S ribosomal ribonucleic acid (16S rRNA), short-chain fatty acid (SCFA) determination, mass spectrometry (MS) metabolomics analysis and metatranscriptomics. The results showed that enriched signaling pathways of the intestinal microbiome and metabolome were significantly different from chronic hypoxia-induced PH rats to the normoxia group. Some signaling pathways are closely related to the onset of pulmonary hypertension caused by hypoxia. This imbalanced bacterial ecosystem might play a pathophysiological role in PH by altering homeostasis.
Data availability statement
The datasets presented in this study can be found in online repositories. The names of the repository/repositories and accession number(s) can be found below: NCBI BioProject accession number: PRJNA874536.
Ethics statement
The animal study was approved by the animal study was reviewed and approved by Animal Care and Use Committee of Guangzhou Medical University (Approval No. GY2019-064). The study was conducted in accordance with the local legislation and institutional requirements.
Author contributions
Conceived and designed the study: GP, BL; Performed the experiments: WC, LW, QM, FP; Analyzed and interpreted the data: WC, LW, QM, FP, WH, YZ, RS, HL, CL; Wrote the manuscript: WC; Revised the manuscript: GP, DZ, MZ. All authors contributed to the article and approved the submitted version.
Funding
This project was supported by grants from National Natural Science Foundation of China (82170056, 81570045), Local Innovative and Research Teams Project of Guangdong Pearl River Talents Program (2017BT01S155), Natural Science Foundation of Guangdong Province (2021A1515011024, 2017A030313683, 2014A030313486), Science and Technology Program of Guangzhou (202201020404, 201510010226), National Key Research and Development Program of China (2018YFC1311600, 2018YFC1311604, 2016YFC1304100, 2016YFC1304104), Training Program for Academic Backbone of High Level Universities of Guangzhou Medical University (2017210), the Grant of the First Affiliated Hospital of Guangzhou Medical University (201619), and the Grant of State Key Laboratory of Respiratory Disease (SKLRD2016ZJ013).
Acknowledgments
Rats in this study were obtained from the Experimental Animal Center of Guangdong (Guangdong, China). Approval of animal care and experiments was issued with the Animal Care and Use Committee of Guangzhou Medical University (Approval No. GY2019-064) and in accordance with the principles and guidelines of the National Institutes of Health.
Conflict of interest
The authors declare that the research was conducted in the absence of any commercial or financial relationships that could be construed as a potential conflict of interest.
Publisher’s note
All claims expressed in this article are solely those of the authors and do not necessarily represent those of their affiliated organizations, or those of the publisher, the editors and the reviewers. Any product that may be evaluated in this article, or claim that may be made by its manufacturer, is not guaranteed or endorsed by the publisher.
References
Arseneau, J. R., Steeves, R., and Laflamme, M. (2017). Modified low-salt CTAB extraction of high-quality DNA from contaminant-rich tissues. Mol. Ecol. Resour. 17 (4), 686–693. doi:10.1111/1755-0998.12616
Bolignano, D., Rastelli, S., Agarwal, R., Fliser, D., Massy, Z., Ortiz, A., et al. (2013). Pulmonary hypertension in CKD. Am. J. Kidney Dis. 61 (4), 612–622. doi:10.1053/j.ajkd.2012.07.029
Boronat, A., Mateus, J., Soldevila-Domenech, N., Guerra, M., Rodríguez-Morató, J., Varon, C., et al. (2019). Cardiovascular benefits of tyrosol and its endogenous conversion into hydroxytyrosol in humans. A randomized, controlled trial. Free Radic. Biol. Med. 143, 471–481. doi:10.1016/j.freeradbiomed.2019.08.032
Bowerman, K. L., Rehman, S. F., Vaughan, A., Lachner, N., Budden, K. F., Kim, R. Y., et al. (2020). Disease-associated gut microbiome and metabolome changes in patients with chronic obstructive pulmonary disease. Nat. Commun. 11 (1), 5886. doi:10.1038/s41467-020-19701-0
Budden, K. F., Shukla, S. D., Rehman, S. F., Bowerman, K. L., Keely, S., Hugenholtz, P., et al. (2019). Functional effects of the microbiota in chronic respiratory disease. Lancet Respir. Med. 7 (10), 907–920. doi:10.1016/S2213-2600(18)30510-1
Cai, T. T., Ye, X. L., Li, R. R., Chen, H., Wang, Y. Y., Yong, H. J., et al. (2020). Resveratrol modulates the gut microbiota and inflammation to protect against diabetic nephropathy in mice. Front. Pharmacol. 11, 1249. doi:10.3389/fphar.2020.01249
Callejo, M., Mondejar-Parreño, G., Barreira, B., Izquierdo-Garcia, J. L., Morales-Cano, D., Esquivel-Ruiz, S., et al. (2018). Pulmonary arterial hypertension affects the rat gut microbiome. Sci. Rep. 8 (1), 9681. doi:10.1038/s41598-018-27682-w
Cassady, S. J., and Ramani, G. V. (2020). Right heart failure in pulmonary hypertension. Cardiol. Clin. 38 (2), 243–255. doi:10.1016/j.ccl.2020.02.001
Chen, Y. H., Yuan, W., Meng, L. K., Zhong, J. C., and Liu, X. Y. (2022). The role and mechanism of gut microbiota in pulmonary arterial hypertension. Nutrients 14 (20), 4278. doi:10.3390/nu14204278
Chen, Y. P., Sivalingam, K., Shibu, M. A., Peramaiyan, R., Day, C. H., Shen, C. Y., et al. (2019). Protective effect of Fisetin against angiotensin II-induced apoptosis by activation of IGF-IR-PI3K-Akt signaling in H9c2 cells and spontaneous hypertension rats. Phytomedicine 57, 1–8. doi:10.1016/j.phymed.2018.09.179
Duan, Y., Xiong, D., Wang, Y., Li, H., Dong, H., and Zhang, J. (2021). Toxic effects of ammonia and thermal stress on the intestinal microbiota and transcriptomic and metabolomic responses of Litopenaeus vannamei. Sci. Total Environ. 754, 141867. doi:10.1016/j.scitotenv.2020.141867
Dumas, D. L., Roque, E., Bellance, N., Rossignol, R., Billaud, M., dos Santos, P., et al. (2012). Dehydroepiandrosterone reverses chronic hypoxia/reoxygenation-induced right ventricular dysfunction in rats. Eur. Respir. J. 40 (6), 1420–1429. doi:10.1183/09031936.00011511
Ferenczyova, K., Kalocayova, B., and Bartekova, M. (2020). Potential implications of quercetin and its derivatives in cardioprotection. Int. J. Mol. Sci. 21 (5), 1585. doi:10.3390/ijms21051585
Garcia-Villalba, R., Gimenez-Bastida, J. A., Garcia-Conesa, M. T., Tomás-Barberán, F. A., Carlos Espín, J., and Larrosa, M. (2012). Alternative method for gas chromatography-mass spectrometry analysis of short-chain fatty acids in faecal samples. J. Sep. Sci. 35 (15), 1906–1913. doi:10.1002/jssc.201101121
Gong, G. C., Song, S. R., and Su, J. (2021). Pulmonary fibrosis alters gut microbiota and associated metabolites in mice: an integrated 16S and metabolomics analysis. Life Sci. 264, 118616. doi:10.1016/j.lfs.2020.118616
Goodrich, J. K., Davenport, E. R., Waters, J. L., Clark, A. G., and Ley, R. E. (2016). Cross-species comparisons of host genetic associations with the microbiome. Science 352 (6285), 532–535. doi:10.1126/science.aad9379
Heidary Moghaddam, R., Samimi, Z., Moradi, S. Z., Little, P. J., Xu, S., and Farzaei, M. H. (2020). Naringenin and naringin in cardiovascular disease prevention: a preclinical review. Eur. J. Pharmacol. 887, 173535. doi:10.1016/j.ejphar.2020.173535
Hong, W., Mo, Q., Wang, L., Peng, F., Zhou, Y., Zou, W., et al. (2021). Changes in the gut microbiome and metabolome in a rat model of pulmonary arterial hypertension. Bioengineered 12 (1), 5173–5183. doi:10.1080/21655979.2021.1952365
Humbert, M., Kovacs, G., Hoeper, M. M., Badagliacca, R., Berger, R. M. F., Brida, M., et al. (2022). 2022 ESC/ERS Guidelines for the diagnosis and treatment of pulmonary hypertension. Eur. Heart J. 43 (38), 3618–3731. doi:10.1093/eurheartj/ehac237
Ikubo, Y., Sanada, T. J., Hosomi, K., Park, J., Naito, A., Shoji, H., et al. (2022). Altered gut microbiota and its association with inflammation in patients with chronic thromboembolic pulmonary hypertension: a single-center observational study in Japan. BMC Pulm. Med. 22 (1), 138. doi:10.1186/s12890-022-01932-0
Kato, T., Iwama, Y., Okumura, K., Hashimoto, H., Ito, T., and Satake, T. (1990). Prostaglandin H2 may be the endothelium-derived contracting factor released by acetylcholine in the aorta of the rat. Hypertension 15 (5), 475–481. doi:10.1161/01.hyp.15.5.475
Kim, E. K., Lee, J. H., Oh, Y. M., Lee, Y. S., and Lee, S. D. (2010). Rosiglitazone attenuates hypoxia-induced pulmonary arterial hypertension in rats. Respirol. Carlt. Vic. 15 (4), 659–668. doi:10.1111/j.1440-1843.2010.01756.x
Kim, S., Rigatto, K., Gazzana, M. B., Knorst, M. M., Richards, E. M., Pepine, C. J., et al. (2020). Altered gut microbiome profile in patients with pulmonary arterial hypertension. Hypertension 75 (4), 1063–1071. doi:10.1161/HYPERTENSIONAHA.119.14294
Kimura, Y., Yanagida, T., Onda, A., Tsukui, D., Hosoyamada, M., and Kono, H. (2020). Soluble uric acid promotes atherosclerosis via AMPK (AMP-Activated protein kinase)-mediated inflammation. Arterioscler. Thromb. Vasc. Biol. 40 (3), 570–582. doi:10.1161/ATVBAHA.119.313224
Langille, M. G., Zaneveld, J., Caporaso, J. G., McDonald, D., Knights, D., Reyes, J. A., et al. (2013). Predictive functional profiling of microbial communities using 16S rRNA marker gene sequences. Nat. Biotechnol. 31 (9), 814–821. doi:10.1038/nbt.2676
Li, H., He, Z., Gao, D., Lv, Y., Zhou, Q., Xiao, B., et al. (2019). Characteristics of the intestinal microbiota in very low birth weight infants with extrauterine growth restriction. Front. Pediatr. 7, 99. doi:10.3389/fped.2019.00099
Liu, X., Mao, B., Gu, J., Wu, J., Cui, S., Wang, G., et al. (2021). Blautia-a new functional genus with potential probiotic properties? Gut Microbes 13 (1), 1–21. doi:10.1080/19490976.2021.1875796
Lu, A., Zuo, C., He, Y., Chen, G., Piao, L., Zhang, J., et al. (2015). EP3 receptor deficiency attenuates pulmonary hypertension through suppression of Rho/TGF-β1 signaling. J. Clin. Invest. 125 (3), 1228–1242. doi:10.1172/JCI77656
Moutsoglou, D. M., Tatah, J., Prisco, S. Z., Prins, K. W., Staley, C., Lopez, S., et al. (2023). Pulmonary arterial hypertension patients have a proinflammatory gut microbiome and altered circulating microbial metabolites. Am. J. Respir. Crit. Care Med. 207 (6), 740–756. doi:10.1164/rccm.202203-0490OC
Nicholson, J. K., Holmes, E., Kinross, J., Burcelin, R., Gibson, G., Jia, W., et al. (2012). Host-gut microbiota metabolic interactions. Science 336 (6086), 1262–1267. doi:10.1126/science.1223813
Niu, J., Zhang, J., Wei, L., Ma, X., Zhang, W., and Nie, C. (2020). Cottonseed meal fermented by Candida tropical reduces the fat deposition in white-feather broilers through cecum bacteria-host metabolic cross-talk. Appl. Microbiol. Biotechnol. 104 (10), 4345–4357. doi:10.1007/s00253-020-10538-7
Niu, J. L., Zhang, J., Wei, L. Q., Zhang, W. J., and Nie, C. X. (2019). Effect of fermented cottonseed meal on the lipid-related indices and serum metabolic profiles in broiler chickens. Anim. (Basel) 9 (11), 930. doi:10.3390/ani9110930
Onyszkiewicz, M., Gawrys-Kopczynska, M., Salagaj, M., Aleksandrowicz, M., Sawicka, A., Koźniewska, E., et al. (2020). Valeric acid lowers arterial blood pressure in rats. Eur. J. Pharmacol. 877, 173086. doi:10.1016/j.ejphar.2020.173086
Pak, O., Aldashev, A., Welsh, D., and Peacock, A. (2007). The effects of hypoxia on the cells of the pulmonary vasculature. Eur. Respir. J. 30 (2), 364–372. doi:10.1183/09031936.00128706
Parperis, K., Velidakis, N., Khattab, E., Gkougkoudi, E., and Kadoglou, N. P. E. (2023). Systemic lupus erythematosus and pulmonary hypertension. Int. J. Mol. Sci. 24 (6), 5085. doi:10.3390/ijms24065085
Ranchoux, B., Bigorgne, A., Hautefort, A., Girerd, B., Sitbon, O., Montani, D., et al. (2017). Gut-lung connection in pulmonary arterial hypertension. Am. J. Respir. Cell Mol. Biol. 56 (3), 402–405. doi:10.1165/rcmb.2015-0404LE
Rodius, S., De Klein, N., Jeanty, C., Sánchez-Iranzo, H., Crespo, I., Ibberson, M., et al. (2020). Fisetin protects against cardiac cell death through reduction of ROS production and caspases activity. Sci. Rep. 10 (1), 2896. doi:10.1038/s41598-020-59894-4
Sanada, T. J., Hosomi, K., Shoji, H., Park, J., Naito, A., Ikubo, Y., et al. (2020). Gut microbiota modification suppresses the development of pulmonary arterial hypertension in an SU5416/hypoxia rat model. Pulm. Circ. 10 (3), 2045894020929147. doi:10.1177/2045894020929147
Shi, N., Li, N., Duan, X., and Niu, H. (2017). Interaction between the gut microbiome and mucosal immune system. Mil. Med. Res. 4, 14. doi:10.1186/s40779-017-0122-9
Simonneau, G., Montani, D., Celermajer, D. S., Denton, C. P., Gatzoulis, M. A., Krowka, M., et al. (2019). Haemodynamic definitions and updated clinical classification of pulmonary hypertension. Eur. Respir. J. 53 (1), 1801913. doi:10.1183/13993003.01913-2018
Stenmark, K. R., Meyrick, B., Galie, N., Mooi, W. J., and McMurtry, I. F. (2009). Animal models of pulmonary arterial hypertension: the hope for etiological discovery and pharmacological cure. Am. J. Physiol. Lung Cell Mol. Physiol. 297 (6), L1013–L1032. doi:10.1152/ajplung.00217.2009
Tang, J. Y., Jin, P., He, Q., Lu, L. H., Ma, J. P., Gao, W. L., et al. (2017). Naringenin ameliorates hypoxia/reoxygenation-induced endoplasmic reticulum stress-mediated apoptosis in H9c2 myocardial cells: involvement in ATF6, IRE1α and PERK signaling activation. Mol. Cell Biochem. 424 (1-2), 111–122. doi:10.1007/s11010-016-2848-1
Thenappan, T., Ormiston, M. L., Ryan, J. J., and Archer, S. L. (2018). Pulmonary arterial hypertension: pathogenesis and clinical management. BMJ 360, j5492. doi:10.1136/bmj.j5492
Van Der Hee, B., and Wells, J. M. (2021). Microbial regulation of host physiology by short-chain fatty acids. Trends Microbiol. 29 (8), 700–712. doi:10.1016/j.tim.2021.02.001
Vernocchi, P., Gili, T., Conte, F., Del Chierico, F., Conta, G., Miccheli, A., et al. (2020). Network analysis of gut microbiome and metabolome to discover microbiota-linked biomarkers in patients affected by non-small cell lung cancer. Int. J. Mol. Sci. 21 (22), 8730. doi:10.3390/ijms21228730
Wedgwood, S., Gerard, K., Halloran, K., Hanhauser, A., Monacelli, S., Warford, C., et al. (2020). Intestinal dysbiosis and the developing lung: the role of toll-like receptor 4 in the gut-lung Axis. Front. Immunol. 11, 357. doi:10.3389/fimmu.2020.00357
Woo, A. Y., Cheng, C. H., and Waye, M. M. (2005). Baicalein protects rat cardiomyocytes from hypoxia/reoxygenation damage via a prooxidant mechanism. Cardiovasc. Res. 65 (1), 244–253. doi:10.1016/j.cardiores.2004.09.027
Wu, X., Lu, W., He, M., Chen, H., Chen, Y., Duan, X., et al. (2020). Structural and functional definition of the pulmonary vein system in a chronic hypoxia-induced pulmonary hypertension rat model. Am. J. Physiol. Cell Physiol. 318 (3), C555–C69. doi:10.1152/ajpcell.00289.2019
Keywords: chronic hypoxia, pH, gut microbiome, SCFAs, gut metabolome
Citation: Cao W, Wang L, Mo Q, Peng F, Hong W, Zhou Y, Sun R, Li H, Liang C, Zhao D, Zheng M, Li B and Peng G (2024) Disease-associated gut microbiome and metabolome changes in rats with chronic hypoxia-induced pulmonary hypertension. Front. Cell Dev. Biol. 12:1022181. doi: 10.3389/fcell.2024.1022181
Received: 18 August 2022; Accepted: 19 June 2024;
Published: 12 July 2024.
Edited by:
Roland Wohlgemuth, Lodz University of Technology, PolandReviewed by:
Laura Veronica Gonzalez Bosc, University of New Mexico, United StatesEdward Emmanuel Kweku Baidoo, Berkeley Lab (DOE), United States
Copyright © 2024 Cao, Wang, Mo, Peng, Hong, Zhou, Sun, Li, Liang, Zhao, Zheng, Li and Peng. This is an open-access article distributed under the terms of the Creative Commons Attribution License (CC BY). The use, distribution or reproduction in other forums is permitted, provided the original author(s) and the copyright owner(s) are credited and that the original publication in this journal is cited, in accordance with accepted academic practice. No use, distribution or reproduction is permitted which does not comply with these terms.
*Correspondence: Gongyong Peng, Z29uZ3lvbmcxOTc2MUAxNjMuY29t
 Weitao Cao
 Luyao Wang
 Qiudi Mo1,2
 Wei Hong
 Yumin Zhou
 Ruiting Sun
 Haiqing Li
 Chunxiao Liang
 Dongxing Zhao
 Bing Li
 Gongyong Peng