 Ruo-Nan Shao
 Kun-Hao Bai
 Qian-Qian Huang1,2†
 Si-Liang Chen
 Xin Huang
 Yu-Jun Dai
94% of researchers rate our articles as excellent or good
Learn more about the work of our research integrity team to safeguard the quality of each article we publish.
Find out more
ORIGINAL RESEARCH article
Front. Cell Dev. Biol., 07 August 2023
Sec. Cancer Cell Biology
Volume 11 - 2023 | https://doi.org/10.3389/fcell.2023.1180625
This article is part of the Research TopicCuproptosis and TumorView all 14 articles
Background: Cuprotosis is a recently discovered copper-dependent cell death mechanism that relies on mitochondrial respiration. However, the role of cuprotosis-related genes (CRGs) in hepatocellular carcinoma (HCC) and their prognostic significances remain unknown.
Methods: Based on the recently published CRGs, the LASSO Cox regression analysis was applied to construct a CRGs risk model using the gene expression data from the International Cancer Genome Consortium as a training set, followed by validation with datasets from The Cancer Genome Atlas and the Gene Expression Omnibus (GSE14520). Functional enrichment analysis of the CRGs was performed by single-sample gene set enrichment analysis.
Results: Five of the 13 previously published CRGs were identified to be associated with prognosis in HCC. Kaplan-Meier analysis suggested that patients with high-risk scores have a shorter overall survival time than patients with low-risk scores. ROC curves indicated that the average AUC was more than 0.7, even at 4 years, and at least 0.5 at 5 years. Moreover, addition of this CRG risk score can significantly improve the efficiency of predicting overall survival compared to using traditional factors alone. Functional analysis demonstrated increased presence of Treg cells in patients with high-risk scores, suggesting a suppressed immune state in these patients. Finally, we point to the possibility that novel immunotherapies such as inhibitors of PDCD1, TIGIT, IDO1, CD274, CTLA4, and LAG3 may have potential benefits in high-risk patients.
Conclusion: We constructed a better prognostic model for liver cancer by using CRGs. The CRG risk score established in this study can serve as a potentially valuable tool for predicting clinical outcome of patients with HCC.
Multicellular organisms have a variety of predetermined and precisely programmed cell death pathways, such as apoptosis, necroptosis (programmed necrosis), pyroptosis (inflammation mediated), and ferroptosis (iron regulated cell death) (Yan et al., 2022). Recent research reported a novel mechanism known as cuprotosis where cell death is regulated by copper. This mechanisms can be triggered by copper ions even when other common cell death pathways are blocked (Tang et al., 2022). Copper ions directly bind to fatty acylated components of the tricarboxylic acid (TCA) cycle within the mitochondria, leading to aggregation of fatty acylated proteins and downregulation of iron-sulfur cluster proteins, which induces proteotoxic stress and cell death (Tsvetkov et al., 2022). This novel pathway may have significant implications for understanding cancer biology and treatment.
Copper concentrations are elevated in the tumor tissues and serum samples of animals and patients with cancers (Jiang et al., 2022). The level of copper is associated with liver cirrhosis, acute hepatitis, and liver cancer. Serum copper may be useful as a marker for liver cancer detection (Jaafarzadeh et al., 2021). In patients with hepatocellular carcinoma (HCC), excessive copper concentrations can enhance tumor development, chemoresistance, and poor prognosis (Fang et al., 2019). All the above studies indicate that copper may be related to the occurrence of liver tumors, providing a new perspective for the treatment of this malignancy (Ge et al., 2022).
Here, we comprehensively explored the clinical relevance of the expression of cuproptosis-related genes (CRGs), their molecular alterations, and the tumor immune microenvironment in HCC. Moreover, our study also constructed a new prognostic model for HCC with CRGs and laid a foundation for potential therapeutic development utilizing cuproptosis regulators for HCC targeting and immunotherapy.
Gene expression information and related clinicopathologic data of 817 HCC patients were retrieved from The Cancer Genome Atlas (https://portal.gdc.cancer.gov/repository) (TCGA, 231 samples), International Cancer Genome Consortium (https://dcc.icgc.org) (ICGC, 231 samples) and Gene Expression Omnibus (http://www.ncbi.nlm.nih.gov/geo/) (GEO, GSE14520, 365 samples). Log2 transformation was performed to normalize the expression profiles of the gene sets. A total of 370 samples with copy number variation (CNV) and single nucleotide variant (SNV) relevant to HCC were downloaded from the TCGA-LIHC site (University of California Santa Cruz Xena database). Moreover, 13 CRGs were collected from a previous literature (Tsvetkov et al., 2022) and are shown in Supplementary Table S1.
The LIRI-JP cohort from the ICGC database was employed as the training cohort. Overall survival (OS)—related CRGs were screened via the univariate Cox analysis (p < 0.1). The prognostic CRG signature was constructed using the LASSO regression analysis based on 10-fold cross-validation penalized maximum likelihood estimators. The minimum criteria were used to choose the optimal penalty parameter (λ) values. The GSE14520 and TCGA-LIHC datasets were selected as the external validation cohorts. We calculated the CRG risk score (RS) for each HCC patient using the following formula: RS = (β * ATP7A expression level) + (β * DLAT expression level) + (β * DLD expression level) + (β * FDX1 expression level) + (β * PDHB expression level), where β is the coefficient for each gene. Patients were further assigned into the high- and low-risk sets in accordance with the median RS. Kaplan-Meier and time-dependent receptor operating characteristic (ROC) curves were employed to assess the predictability of the CRG signature. The design of the study is shown in Figure 1.
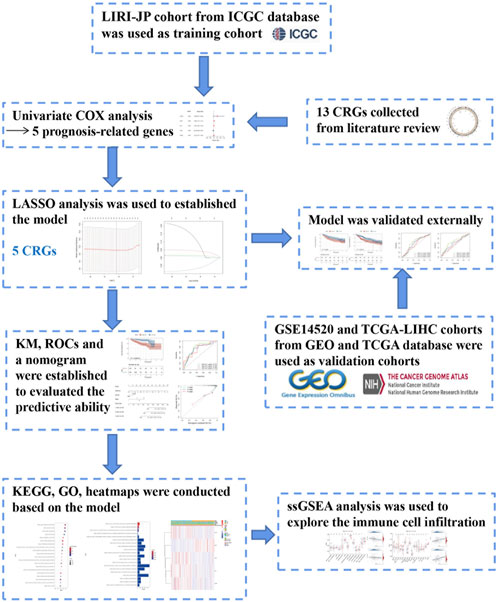
FIGURE 1. Flow chart of data collection and analysis, LIRI-JP cohort OCHC database was used as training cohort.
The liver cancer cell lines including HEG2, MHCC97-H, HUH-7, SNU449, PLC-PRF-5, LM3, and LM9, and normal liver cell lines such as HL7702, WRL68, QSG-7701, and MIHA cells were obtained from Sun Yat-sen University Cancer Center. The expression data of these CRGs were obtained from Cancer Cell Line Encyclopedia (CCLE).
Total RNA was extracted from cells using TRIzol reagent (Takara Bio, Carlsbad, United States) and reverse transcribed using a cDNA reverse transcription kit (Takara Bio, Carlsbad, United States) in accordance with the manufacturer’s instructions, and the obtained cDNA was amplified using TB Green® Premix Ex Taq (Takara Bio, Carlsbad, United States). qRT-PCR was performed to detect expression levels of the genes of interest. Each experiment was repeated three times. The 2−ΔΔCT methodology was adopted to calculate the relative expression of genes. The primers used are listed in Supplementary Table S2.
The GSEA_4.2.3 software was applied to examine the physiological pathways that genes in the low- and high-risk datasets are involved in according to the KEGG and GO analyses, “c2. cp.kegg.v7.5.1. symbols” and “c5. go.bp.v7.5.1. symbols”, respectively. Normalized p-value <0.05 was considered statistically significant. In addition, we calculated the activity of 13 immune-linked networks and 16 immune cell types through the single-sample gene set enrichment analysis (ssGSEA) (Rooney et al., 2015). Protein interactions between model-related proteins were constructed with the STRING algorithm (https://cn.string-db.org). Genetic variation information in the cancer cell lines was from the cBioPortal Genomics database. DNA methylation analysis was performed by methsurv (https://biit.cs.ut.ee/methsurv/) (Modhukur et al., 2018; Anuraga et al., 2021; Xing et al., 2021).
The Student’s t-test or Wilcoxon test was employed to analyze continuous data. OS comparisons between two sets were completed by the log-rank test. The time-ROC package was applied to complete the ROC curves and estimate the values of the area under the curve (AUC). The independent prognosis index was estimated by the uni- and multivariate COX analyses. All statistical analyses were performed using the R software (Version 4.0.4) or SPSS (Version 25.0). A two-sided p-value <0.05 indicated statistical significance.
A recent study reported 13 genes related to the cuproptosis pathway, including ATP7A, ATP7B, DBT, DLA, DLD, DLAT, DLST, FDX1, GCSH, LIAS, LIPT1, PDHA1, and PDHB (Tsvetkov et al., 2022). To determine whether these cuproptosis-related genes (CRGs) are involved in HCC, we extracted their expression levels from 817 HCC patient samples from three databases (TCGA, ICGC and GEO) for further analysis (Supplementary Figure S1A; Supplementary Table S1). Many of these CRGs are mutated in HCC samples and the top 10 mutated genes with the highest frequencies are showed in the Supplementary Figure S1A. Among them, the gene with the highest mutation frequency is ATP7A, accounting for about 10%, followed by DLST, DLD, and DBT accounting for about 7%. The major mutation type is missense mutation (43.33%, 13/33), with C>T being the most common (Figure 2A). The expression levels of most CRGs, except for FDX1, showed a positive correlation to HCC samples (Supplementary Figure S1B). In addition, the CRGs, DLAT, DLD, PDHB, ATP7A, PDHA1, DLST, LIPT1, and LIAS, are also expressed at significantly higher levels in liver cancer cells than in normal tissues (Figure 2B). On the other hand, the heatmaps suggested that expression of ATP7A, DBT, and LIPT1 are lower than other genes, and lower in tumors compared to controls (Supplementary Figure S1C). Twelve of the CRGs are significantly differentially expressed in the TCGA database and analysis also indicated that FDX1 has the lowest expression (Supplementary Figure S1D). In addition, except for ATP7A and PDHA1, which are located on the X chromosome, all other genes are located in the autosomes (Supplementary Figure S1E). Copy number variation (CNV) analysis showed that most of the 13 genes have copy number losses, with GCSH and ATP7B being the most obvious, while DLD showed a copy number gain (Figure 2C). We further validated the expressions of the CRGs in liver cancer cell lines and related normal cells and found that the expression of DLAT and DLA are much higher and FDX1 lower in cancer cell lines compared to normal cells (Supplementary Figure S2A). We also validated the same results of CRGs expressions in HCC cancer cell lines through Cancer Cell Line Encyclopedia (CCLE) project (Supplementary Figure S2B).
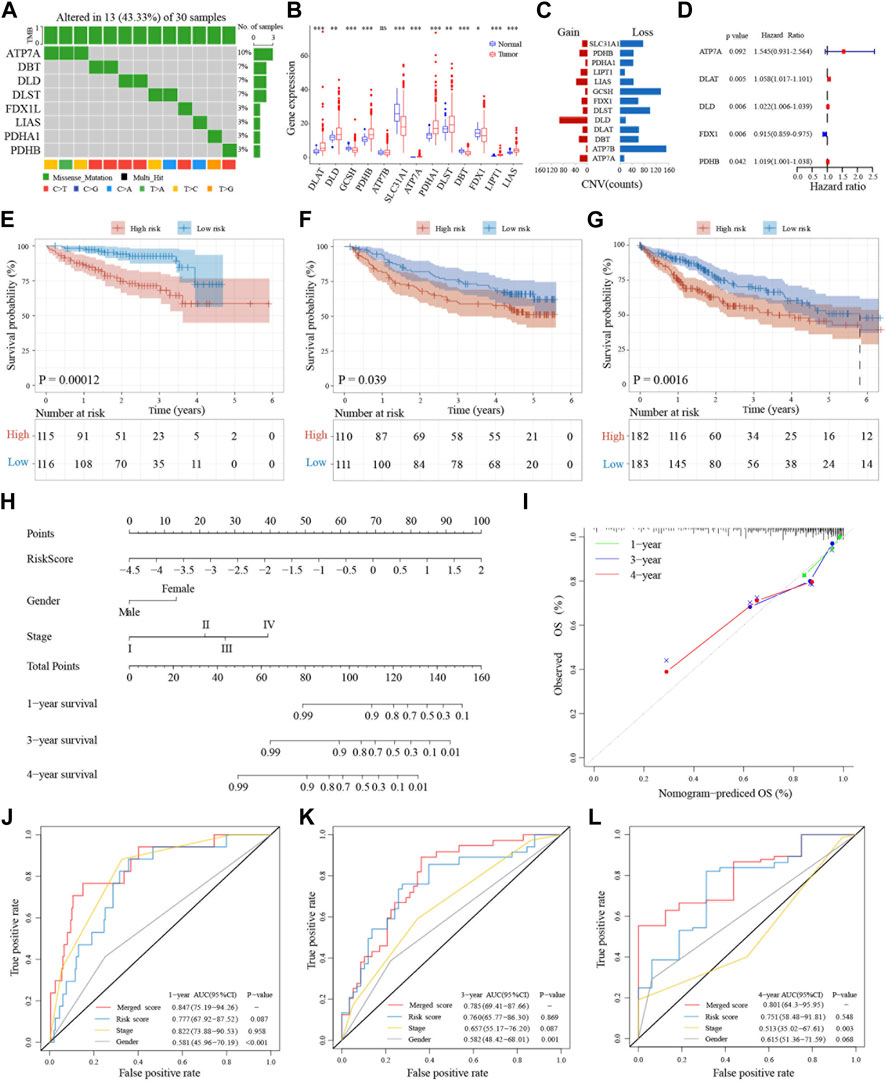
FIGURE 2. Genetic landscape and prognostic significance of CRGs in HCC. (A) Mutation status of 13 CRGs in the TCGA database. (B) Tumor-normal expression difference of CRGs in TCGA database. (C) CNV situation of CRGs in TCGA database. (D) Forest plot of five prognosis-related CRGs in ICGC database. (E–G) Kaplan-Meier curves for the OS of patients in the high-risk group and low-risk group in ICGC, GSE14520 and TCGA cohort. (H) Nomogram model built on the ICGC dataset. (I) Calibration curves for nomogram models. (J–L) AUC of time-dependent ROC curves verified the prognostic performance of merged risk score in 1-year, 3-years or 4 years of ICGC, GSE14520 and TCGA cohort.
Next, we used the ICGC databset to explore the prognostic value of these 13 CRGs in liver cancer. The forest plot results indicated that the expressions of five genes (ATP7A, DLAT, DLD, FDX1, and PDHB) are associated with prognosis. Except for FDX1, expressions of the other four genes are closely related to poor prognosis (Figure 2D). The gene correlation results also pointed out that in addition to FDX1, the other CRGs are associated with at least three or more other genes (Supplementary Figure S3A). Protein interaction analysis showed that FDX1 is weakly associated with the other proteins, while DLD, PDHB, and DLAT have stronger interactions among these five proteins (Supplementary Figure S3B). Moreover, the mutational landscape of these five CRGs in different cancer cell lines indicated that they also have different frequencies of mutations in tumor cells (Supplementary Figure S3C). Further, LASSO-Cox regression analysis of these five prognosis-related CRGs in the ICGC LIRI-JP training dataset showed that they can be used as a cuprotosis signature (Supplementary Figures S3D, E).
To further examine the prognostic significance of this five-gene cuprotosis signature in HCC, we validated this signature in the GSE14520 and TCGA datasets. A CRG risk score was established using the expression levels of the five CRGs and the HCC patients were divided into two groups based on the median CRG risk score. Patients in different risk categories are scattered in two directions (Supplementary Figures S4A–C). The scatter charts demonstrated that patients with high-risk scores have shorter survival time than patients with low-risk scores (Supplementary Figures S4D–F). This can also be seen in the Kaplan-Meier analysis showing that high-risk patients have shorter overall survival than low-risk patients in both the training and validation datasets (Figures 2E–G). To further validate the survival prediction of this prognostic CRG signature, we utilized the time-dependent ROC curves to analyze the AUC between the specificity and sensitivity of these risk factors in liver cancer patients. In the training set, the AUC was more than 0.7, even at 4 years, and it was also at least 0.5 at 5 years in the validation datasets (Supplementary Figures S4G–I).
To further validate the importance of the CRG risk score in clinical features and prognosis, univariate and multivariate analyses were applied to examine whether the CRG risk score can be an independent prognostic marker for OS in HCC patients. Univariate Cox analysis showed that a high-risk score is a poor prognostic indicator of OS in liver cancers (Supplementary Figures S5A–C). Moreover, when combining with other well-known prognostic factors, multivariate Cox analysis suggested that the CRG risk score can also be a significant predictor of OS in liver cancer (Supplementary Figures S5D–F). Further, heatmap of clinical features including grade, TNM staging, AFP levels, BCLC staging, ALT levels, HBV status, and so on indicated that some of these biomarkers distributed differently in the high- and low-risk groups (Supplementary Figures S5G–I).
To further expand the clinical applicability of the five-CRG signature, a nomogram of clinical variables and the CRG risk score was created as shown in Figure 2H. A total score was obtained for each patient by combining the scores for each prognostic criterion. The results suggested that patients with higher total scores have poorer clinical outcomes. Furthermore, the nomogram calibration plots are highly consistent with the operating modes of the ideal model and predicted the 1-, 3- and 4-year survival time (Figure 2I). The AUC for 1-year overall survival of the merged score group is 0.847 [95% CI: 0.75–0.94], the CRG risk score group is 0.777 [95% CI: 0.68–0.88], the stage is 0.822 [95% CI: 0.74–0.91], and the gender is 0.581 [95% CI: 0.46–0.70]. In addition, the AUC for 3-year survival of the merged score group is 0.785 [95% CI: 0.69–0.88], the CRG risk score group is 0.760 [95% CI: 0.66–0.86], the stage is 0.657 [95% CI: 0.55–0.76], and the gender is 0.582 [95% CI: 0.48–0.68]. Further, the AUC for 4-year OS of merged score group is 0.801 [95% CI: 0.64–0.96], the CRG risk score group is 0.751 [95% CI: 0.58–0.92], the stage is 0.513 [95% CI: 0.35–0.68], and the gender is 0.615 [95% CI: 0.51–0.72]. All these results suggested that the addition of this five-CRG risk score can significantly improve the OS prediction efficiency compared to traditional factors alone (Figures 2J–L).
Since the five-CRG signature described above can distinguish between high- and low-risk patients, we look wider to asked which genes are differentially expressed between these patient subgroups. We applied “limma” to identify the differentially expressed genes with the criterion (|log2FC| ≥ 1 and FDR <0.05) in the ICGC, GSE14520 and TCGA datasets. Functional pathway analysis of these differentially expressed genes using Go terms showed that immune response pathways of different types of immune cells are more enriched in the high-risk score group. Moreover, single sample gene set enrichment analysis (ssGSEA) functional results further indicated that several different immune-related pathways are closely associated with the CRG risk score (Supplementary Figures S6A–C). What caught our attention was that the results of the refined immunophenotyping analysis suggested that the type I and II interferon (IFN) response pathway is the only pathway significantly more enriched in the low-risk score group in all three datasets (Figures 3A–C). To further determine the correlation between immune cell infiltration and the CRG risk score, we quantified and analyzed the enriched fractions of different immune cell subsets using ssGSEA. We found that NK cells, Th2, and Treg cells have significant differences between the high- and low-risk groups in the ICGC dataset. In the GSE14520 dataset, activated dendritic cells (aDCs), macrophages, and Treg cells are more enriched in the high-risk group. While in the TCGA dataset, aDCs, DCs, macrophages, neutrophils, masts, NK cells, and Treg cells have significant enrichment differences (Figures 3D–F). Interestingly, Treg cells are the only immune cell subtype, that is, more enriched in the high-risk score group, with significant differences in all three datasets.
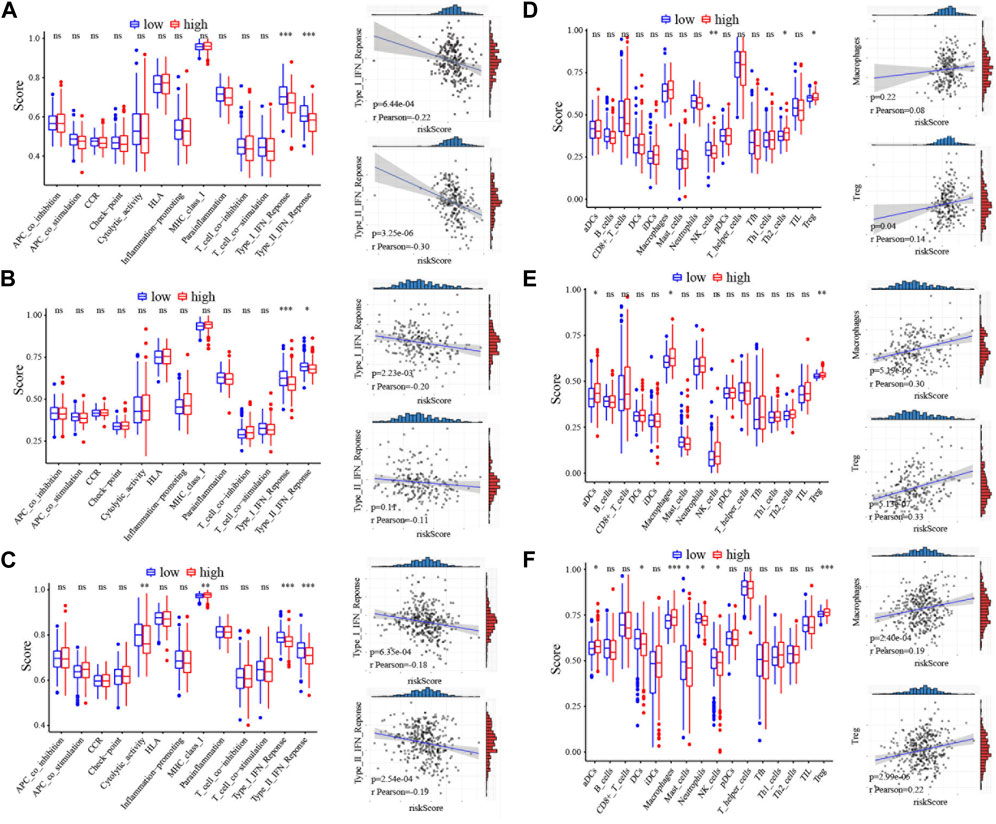
FIGURE 3. Immunoassay correlation analysis of CRGs in HCC. (A–C) Immune-related functions between different risk groups in ICGC, GSE14520 and TCGA cohort. The correlation of the type I IFN response or type II IFN response with risk score was displayed on the right panel. The relation value was calculated by pearson analysis. (D–F) The scores of immune cells between different risk groups in ICGC, GSE14520 and TCGA cohort. The correlation of the macrophages or Treg cells with risk score was displayed on the right panel. The relation value was calculated by pearson analysis. *, p < 0.05; **, p < 0.01; ***, p < 0.001.
Cancer immunotherapy has made great breakthroughs and significantly improved the survival rate of cancer patients (Riley et al., 2019). Our results showed that the high-risk score is closely associated with Treg cells, indicating that cuprotosis may affect the prognosis of HCC patients by regulating the tumor immune microenvironment. We explored the relationship between the CRG risk score and immunosuppressive marker molecules including IL-10, FOXP3, FAP, TGFB1, and IL-6 and found that the CRG risk score is positively correlated with IL-10 (t = 2.36, p = 0.02), FAP (t = 3.3, p = 1.08e-03), and TGFB1 (t = 4.25, p = 2.75e-05) (Figure 4A; Supplementary Figure S5D). Therefore, we wondered whether the current immunotherapy-related drugs can improve the prognosis of patients in the high-risk group. We investigated the correlation between the CRG risk score and the known targets genes of immunotherapy, including PVR, PDCD1, CD96, TIGIT, IDO1, CD274, CTLA4, and LAG3. Consistent with our predictions, the CRG risk score is positively correlated with PDCD1 (t = 2.2, p = 0.03), TIGIT (t = 3.24, p = 1.32e-03), IDO1 (t = 2.11, p = 0.04), CD274 (t = 2.51, p = 0.01), CTLA4 (t = 3.76, p = 2.01e-04), and LAG3 (t = 2.67, p = 7.93e-03) (Figure 4B; Supplementary Figure S6D). The DNA methylation of these genes showed no significant changes among these genes in HCC (Supplementary Table S3).
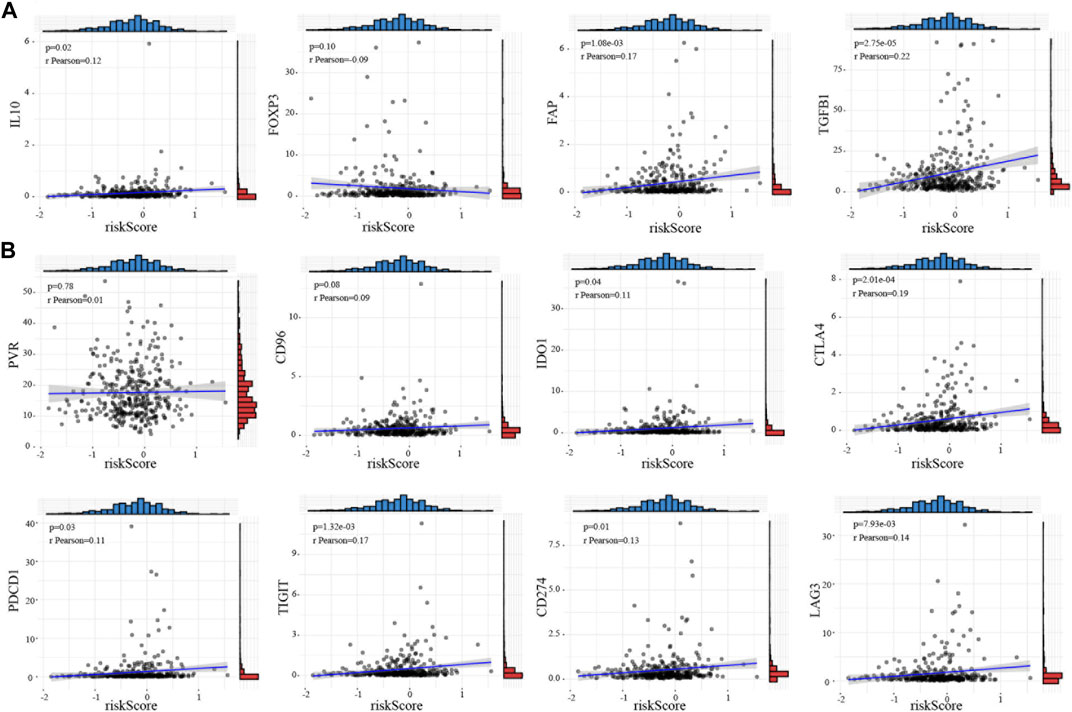
FIGURE 4. Immune checkpoint target correlation analysis of CRGs in HCC (A) Relationship between the risk score and immunosuppressive marker molecules including IL-10, FOXP3, FAP, TGFB1, and IL-6. (B) The correlation between the risk score and the targets of immunotherapy such as PVR, PDCD1, CD96, TIGHT, IDO1, CD274, CTLA4, and LAG3. The relation value was calculated by pearson analysis.
Copper is an essential nutrient with redox properties that can be both beneficial and harmful to cells. The role of copper in tumor biology is gradually being recognized and the understanding of cuprotosis in tumors is continuously being improved (Riley et al., 2019). Numerous observations had shown that tumor tissue requires higher levels of copper than healthy tissue (Shanbhag et al., 2021). Gene analysis in clear cell renal cell carcinoma suggested that CRGs play a key role in clinical outcomes of this disease (Xia et al., 2017).
For liver cancer, there are currently insufficient studies supporting a role for CRGs in this disease. Our study found that the CRGs are significantly overexpressed in liver cancer. Among the 13 published CRGs, we found that the expression levels of five genes are correlated with the prognosis of liver cancer patients. Except for the high expression of FDX1, which indicated a lower risk of poor prognosis, the other genes, ATP7A, DLAT, DLD, and PDHB, all correlated with poor prognosis. We constructed a prognostic score model composed of these five genes and found that patients with high CRG risk scores tend to have the worse prognosis in all three datasets. FDX1 and fatty acylation of proteins are key factors in copper ionophore-induced cell death (Dorsam and Fahrer, 2016). Deletion of FDX1 blocks the progress of the TCA cycle, triggering the accumulation of pyruvate and α-ketoglutarate in cells and promotes tumor development (Rayess et al., 2012). DLAT is one of the components of the pyruvate dehydrogenase (PDH) complex, which catalyzes the decarboxylation of pyruvate in the TCA cycle to form acetyl-CoA (Tsvetkov et al., 2022). The expression of ATP7A in breast cancer tissues is significantly higher than that in normal tissues, and inhibiting the expression of ATP7A can improve the sensitivity of breast cancer to cisplatin (Yu et al., 2020). A spectrum of diverse genomic alterations in PDHB has been found in non-clear cell renal carcinoma (Durinck et al., 2015). These research support the significance of our CRG model in the prognostic prediction of HCC.
The tumor microenvironment is intimately involved the occurrence and development of tumors, and affects the therapeutic effect of any treatments that targets the tumor (Kennedy and Salama, 2020). Several studies have shown that pyroptosis is closely associated with tumor immunity (Gao et al., 2022). In this study, we emphasized the relationship between the immune microenvironment and CRGs, and found that in the high-risk group with high expression of CRGs, the expression of the type I and II IFN response pathways are significantly lower than that in the low-risk group, indicating that the overall immunity of the patients in the high-risk group is in a suppressed state. In addition, we also found that immunosuppressive Treg cells are significantly increased in the high-risk score group. This suggested that the high expression of CRGs can induce immune disorders to promote the development of tumors. The novel immunotherapy agents such as inhibitors of PDCD1, TIGHT, IDO1, CD274, CTLA4 and LAG3 were considered had potential survival benefit in several cancers. The CD274 and PDCD1 immune checkpoint interaction could accelerate cancer progression in the colorectal cancer microenvironment and elderly non-small cell lung cancer patients (Elomaa et al., 2023; Tanaka et al., 2023). The SNP of PDCD1, including rs11568821 and rs2227981 was a prognostic marker in a triple-negative breast cancer (Boguszewska-Byczkiewicz et al., 2023). Moreover, TIGHT regulated TWIST1and promoted vasculature remodeling in bladder cancer (Liu et al., 2022). It also affected autophagy in leukemia and esophageal squamous cell carcinoma (Gschwind et al., 2022; Huang et al., 2023). LAG3 was identified as an important therapeutic target in pancreatic cancer, liver, brain, breast cancer and melanoma (Gulhati et al., 2023; Huuhtanen et al., 2023; Ulase et al., 2023; Zou et al., 2023). In this study, we found that these inhibitors of PDCD1, TIGHT, IDO1, CD274, CTLA4 and LAG3 had potential benefit in high-risk patients.
With increasing knowledge of the mechanism of copper-driven cell death in tumors, we demonstrated here that this mechanism is also likely to be applicable for HCC. Using copper death-related genes, we constructed a prognostic model that will help to better understand the relationship between cuprotosis and liver cancer. The CRG risk score is related to the overall immune status of patients, particularly the presence of Treg cells. This suggested that immune checkpoint inhibitor therapies may have better effects in HCC patients with high CRG risk scores.
The original contributions presented in the study are included in the article/Supplementary Material, further inquiries can be directed to the corresponding author.
This work has been approved by the Ethics Committee of Sun Yat-sen University Cancer Center and Ruijin Hospital affiliated to Shanghai Jiao Tong University School of Medicine.
R-NS, K-HB, and Q-QH performed bioinformatics analyses; XH and S-LC. interpreted data, created a graphical summary; Y-JD. conceived and oversaw the study, interpreted data, and wrote the paper. All authors contributed to the article and approved the submitted version.
This work was supported by the National Natural Science Foundation of China (81800140), the Fundamental Research Funds for the Central Universities, Sun Yat-sen University (22qntd4001). GuangDong Basic and Applied Basic Research Foundation (KY037906 and KY030709).
We especially thank Si-Yuan He (The University of Texas MD Anderson Cancer Center) for helping perform analysis of samples.
The authors declare that the research was conducted in the absence of any commercial or financial relationships that could be construed as a potential conflict of interest.
All claims expressed in this article are solely those of the authors and do not necessarily represent those of their affiliated organizations, or those of the publisher, the editors and the reviewers. Any product that may be evaluated in this article, or claim that may be made by its manufacturer, is not guaranteed or endorsed by the publisher.
The Supplementary Material for this article can be found online at: https://www.frontiersin.org/articles/10.3389/fcell.2023.1180625/full#supplementary-material
Anuraga, G., Wang, W. J., Phan, N. N., An Ton, N. T., Ta, H. D. K., Berenice Prayugo, F., et al. (2021). Potential prognostic biomarkers of NIMA (never in mitosis, gene A)-Related kinase (NEK) family members in breast cancer. J. Pers. Med. 11 (11), 1089. doi:10.3390/jpm11111089
Boguszewska-Byczkiewicz, K., Wow, T., Szymańska, B., Kosny, M., and Kolacinska-Wow, A. (2023). The PD-1 single-nucleotide polymorphism rs11568821 and rs2227981 as a novel prognosis model in a triple-negative breast cancer patient. Mol. Biol. Rep. 50 (7), 6279–6285. doi:10.1007/s11033-023-08423-3
Dorsam, B., and Fahrer, J. (2016). The disulfide compound alpha-lipoic acid and its derivatives: A novel class of anticancer agents targeting mitochondria. Cancer Lett. 371 (1), 12–19. doi:10.1016/j.canlet.2015.11.019
Durinck, S., Stawiski, E. W., Pavía-Jiménez, A., Modrusan, Z., Kapur, P., Jaiswal, B. S., et al. (2015). Spectrum of diverse genomic alterations define non-clear cell renal carcinoma subtypes. Nat. Genet. 47 (1), 13–21. doi:10.1038/ng.3146
Elomaa, H., Ahtiainen, M., Väyrynen, S. A., Ogino, S., Nowak, J. A., Lau, M. C., et al. (2023). Spatially resolved multimarker evaluation of CD274 (PD-L1)/PDCD1 (PD-1) immune checkpoint expression and macrophage polarisation in colorectal cancer. Br. J. Cancer 128 (11), 2104–2115. doi:10.1038/s41416-023-02238-6
Fang, A. P., Chen, P. Y., Wang, X. Y., Liu, Z. Y., Zhang, D. M., Luo, Y., et al. (2019). Serum copper and zinc levels at diagnosis and hepatocellular carcinoma survival in the Guangdong Liver Cancer Cohort. Int. J. Cancer 144 (11), 2823–2832. doi:10.1002/ijc.31991
Gao, W., Wang, X., Zhou, Y., Wang, X., and Yu, Y. (2022). Autophagy, ferroptosis, pyroptosis, and necroptosis in tumor immunotherapy. Signal Transduct. Target Ther. 7 (1), 196. doi:10.1038/s41392-022-01046-3
Ge, E. J., Bush, A. I., Casini, A., Cobine, P. A., Cross, J. R., DeNicola, G. M., et al. (2022). Connecting copper and cancer: From transition metal signalling to metalloplasia. Nat. Rev. Cancer 22 (2), 102–113. doi:10.1038/s41568-021-00417-2
Gschwind, A., Marx, C., Just, M. D., Severin, P., Behring, H., Marx-Blümel, L., et al. (2022). Tight association of autophagy and cell cycle in leukemia cells. Cell Mol. Biol. Lett. 27 (1), 32. doi:10.1186/s11658-022-00334-8
Gulhati, P., Schalck, A., Jiang, S., Shang, X., Wu, C. J., Hou, P., et al. (2023). Targeting T cell checkpoints 41BB and LAG3 and myeloid cell CXCR1/CXCR2 results in antitumor immunity and durable response in pancreatic cancer. Nat. Cancer 4 (1), 62–80. doi:10.1038/s43018-022-00500-z
Huang, S., Zhang, J., Li, Y., Xu, Y., Jia, H., An, L., et al. (2023). Downregulation of Claudin5 promotes malignant progression and radioresistance through Beclin1-mediated autophagy in esophageal squamous cell carcinoma. J. Transl. Med. 21 (1), 379. doi:10.1186/s12967-023-04248-7
Huuhtanen, J., Kasanen, H., Peltola, K., Lönnberg, T., Glumoff, V., Brück, O., et al. (2023). Single-cell characterization of anti-LAG-3 and anti-PD-1 combination treatment in patients with melanoma. J. Clin. Invest. 133 (6), e164809. doi:10.1172/JCI164809
Jaafarzadeh, M. M., Ranji, N., and Aboutaleb, E. (2021). The effect of N-acetylcysteine on the levels of copper, zinc and expression of matrix metalloproteinases in the liver. Pol. J. Vet. Sci. 24 (2), 191–199. doi:10.24425/pjvs.2020.135816
Jiang, Y., Huo, Z., Qi, X., Zuo, T., and Wu, Z. (2022). Copper-induced tumor cell death mechanisms and antitumor theragnostic applications of copper complexes. Nanomedicine (Lond) 17 (5), 303–324. doi:10.2217/nnm-2021-0374
Kennedy, L. B., and Salama, A. K. S. (2020). A review of cancer immunotherapy toxicity. CA Cancer J. Clin. 70 (2), 86–104. doi:10.3322/caac.21596
Liu, X. Q., Shao, X. R., Liu, Y., Dong, Z. X., Chan, S. H., Shi, Y. Y., et al. (2022). Tight junction protein 1 promotes vasculature remodeling via regulating USP2/TWIST1 in bladder cancer. Oncogene 41 (4), 502–514. doi:10.1038/s41388-021-02112-w
Modhukur, V., Iljasenko, T., Metsalu, T., Lokk, K., Laisk-Podar, T., and Vilo, J. (2018). MethSurv: A web tool to perform multivariable survival analysis using DNA methylation data. Epigenomics 10 (3), 277–288. doi:10.2217/epi-2017-0118
Rayess, H., Wang, M. B., and Srivatsan, E. S. (2012). Cellular senescence and tumor suppressor gene p16. Int. J. Cancer 130 (8), 1715–1725. doi:10.1002/ijc.27316
Riley, R. S., June, C. H., Langer, R., and Mitchell, M. J. (2019). Delivery technologies for cancer immunotherapy. Nat. Rev. Drug Discov. 18 (3), 175–196. doi:10.1038/s41573-018-0006-z
Rooney, M. S., Shukla, S. A., Wu, C. J., Getz, G., and Hacohen, N. (2015). Molecular and genetic properties of tumors associated with local immune cytolytic activity. Cell 160 (1-2), 48–61. doi:10.1016/j.cell.2014.12.033
Shanbhag, V. C., Gudekar, N., Jasmer, K., Papageorgiou, C., Singh, K., and Petris, M. J. (2021). Copper metabolism as a unique vulnerability in cancer. Biochim. Biophys. Acta Mol. Cell Res. 1868 (2), 118893. doi:10.1016/j.bbamcr.2020.118893
Tanaka, T., Yoshida, T., Masuda, K., Takeyasu, Y., Shinno, Y., Matsumoto, Y., et al. (2023). Prognostic role of modified Glasgow Prognostic score in elderly non-small cell lung cancer patients treated with anti-PD-1 antibodies. Respir. Investig. 61 (1), 74–81. doi:10.1016/j.resinv.2022.10.003
Tang, D., Chen, X., and Kroemer, G. (2022). Cuproptosis: A copper-triggered modality of mitochondrial cell death. Cell Res. 32 (5), 417–418. doi:10.1038/s41422-022-00653-7
Tsvetkov, P., Coy, S., Petrova, B., Dreishpoon, M., Verma, A., Abdusamad, M., et al. (2022). Copper induces cell death by targeting lipoylated TCA cycle proteins. Science 375 (6586), 1254–1261. doi:10.1126/science.abf0529
Ulase, D., Behrens, H. M., Krüger, S., Heckl, S. M., Ebert, U., Becker, T., et al. (2023). LAG3 in gastric cancer: it's complicated. J. Cancer Res. Clin. Oncol. doi:10.1007/s00432-023-04954-1
Xia, Y., Liu, L., Bai, Q., Long, Q., Wang, J., Xi, W., et al. (2017). Prognostic value of copper transporter 1 expression in patients with clear cell renal cell carcinoma. Oncol. Lett. 14 (5), 5791–5800. doi:10.3892/ol.2017.6942
Xing, C., Wang, Z., Zhu, Y., Zhang, C., Liu, M., Hu, X., et al. (2021). Integrate analysis of the promote function of Cell division cycle-associated protein family to pancreatic adenocarcinoma. Int. J. Med. Sci. 18 (3), 672–684. doi:10.7150/ijms.53243
Yan, J., Wan, P., Choksi, S., and Liu, Z. G. (2022). Necroptosis and tumor progression. Trends Cancer 8 (1), 21–27. doi:10.1016/j.trecan.2021.09.003
Yu, Z., Cao, W., Ren, Y., Zhang, Q., and Liu, J. (2020). ATPase copper transporter A, negatively regulated by miR-148a-3p, contributes to cisplatin resistance in breast cancer cells. Clin. Transl. Med. 10 (1), 57–73. doi:10.1002/ctm2.19
Zou, Y., Ye, F., Kong, Y., Hu, X., Deng, X., Xie, J., et al. (2023). The single-cell landscape of intratumoral heterogeneity and the immunosuppressive microenvironment in liver and brain metastases of breast cancer. Adv. Sci. (Weinh) 10 (5), e2203699. doi:10.1002/advs.202203699
Keywords: cuprotosis (CRGs), prognostic model, hepatocellular carcinoma (HCC), treg cells, immunotherapy
Citation: Shao R-N, Bai K-H, Huang Q-Q, Chen S-L, Huang X and Dai Y-J (2023) A novel prognostic prediction model of cuprotosis-related genes signature in hepatocellular carcinoma. Front. Cell Dev. Biol. 11:1180625. doi: 10.3389/fcell.2023.1180625
Received: 06 March 2023; Accepted: 28 July 2023;
Published: 07 August 2023.
Edited by:
Lin-Lin Bu, Wuhan University, ChinaReviewed by:
Chih-Yang Wang, Taipei Medical University, TaiwanCopyright © 2023 Shao, Bai, Huang, Chen, Huang and Dai. This is an open-access article distributed under the terms of the Creative Commons Attribution License (CC BY). The use, distribution or reproduction in other forums is permitted, provided the original author(s) and the copyright owner(s) are credited and that the original publication in this journal is cited, in accordance with accepted academic practice. No use, distribution or reproduction is permitted which does not comply with these terms.
*Correspondence: Yu-Jun Dai, ZGFpeWpAc3lzdWNjLm9yZy5jbg==
†These authors have contributed equally to this work
Disclaimer: All claims expressed in this article are solely those of the authors and do not necessarily represent those of their affiliated organizations, or those of the publisher, the editors and the reviewers. Any product that may be evaluated in this article or claim that may be made by its manufacturer is not guaranteed or endorsed by the publisher.
Research integrity at Frontiers
Learn more about the work of our research integrity team to safeguard the quality of each article we publish.