 Min Liu1†
 Zhangqi Xu1†Cheng Zhang1Chunxia Yang1Jiaxing Feng1Yiqing Lu1Wen Zhang1Wenwen Chen1Xiaoyang Xu1Xiaoxia Sun1Mingyang Yang1Wei Liu1
 Tianhua Zhou1,2,3,4*
 Yuehong Yang1*
- 1Department of Cell Biology, and Institute of Gastroenterology of the Second Affiliated Hospital, Zhejiang University School of Medicine, Hangzhou, China
- 2The Cancer Center of the Second Affiliated Hospital, Zhejiang University School of Medicine, Hangzhou, China
- 3Collaborative Innovation Center for Diagnosis and Treatment of Infectious Diseases, Hangzhou, China
- 4Department of Molecular Genetics, University of Toronto, Toronto, ON, Canada
A Corrigendum on
NudC L279P mutation destabilizes filamin a by inhibiting the Hsp90 chaperoning pathway and suppresses cell migration
by Liu M, Xu Z, Zhang C, Yang C, Feng J, Lu Y, Zhang W, Chen W, Xu X, Sun X, Yang M, Liu W, Zhou T and Yang Y (2021). Front. Cell Dev. Biol. 9:671233. doi: 10.3389/fcell.2021.671233
In the published article, there were errors in Figure 6, Supplementary Figure S4 and the legend for Supplementary Figure S3. The representative image of the “GFP+Myc-Hsp90” group in Figure 6B and the image of the “GFP-NudC 0 h” in Supplementary Figure S4B were misused due to carelessness. In the figure legend for Supplementary Figure S3D, the description of the scale bar should be 50 μm, but not 100 μm. The corrected Figure 6, Supplementary Figure S4 and figure legend for Supplementary Figure S3 appear below.
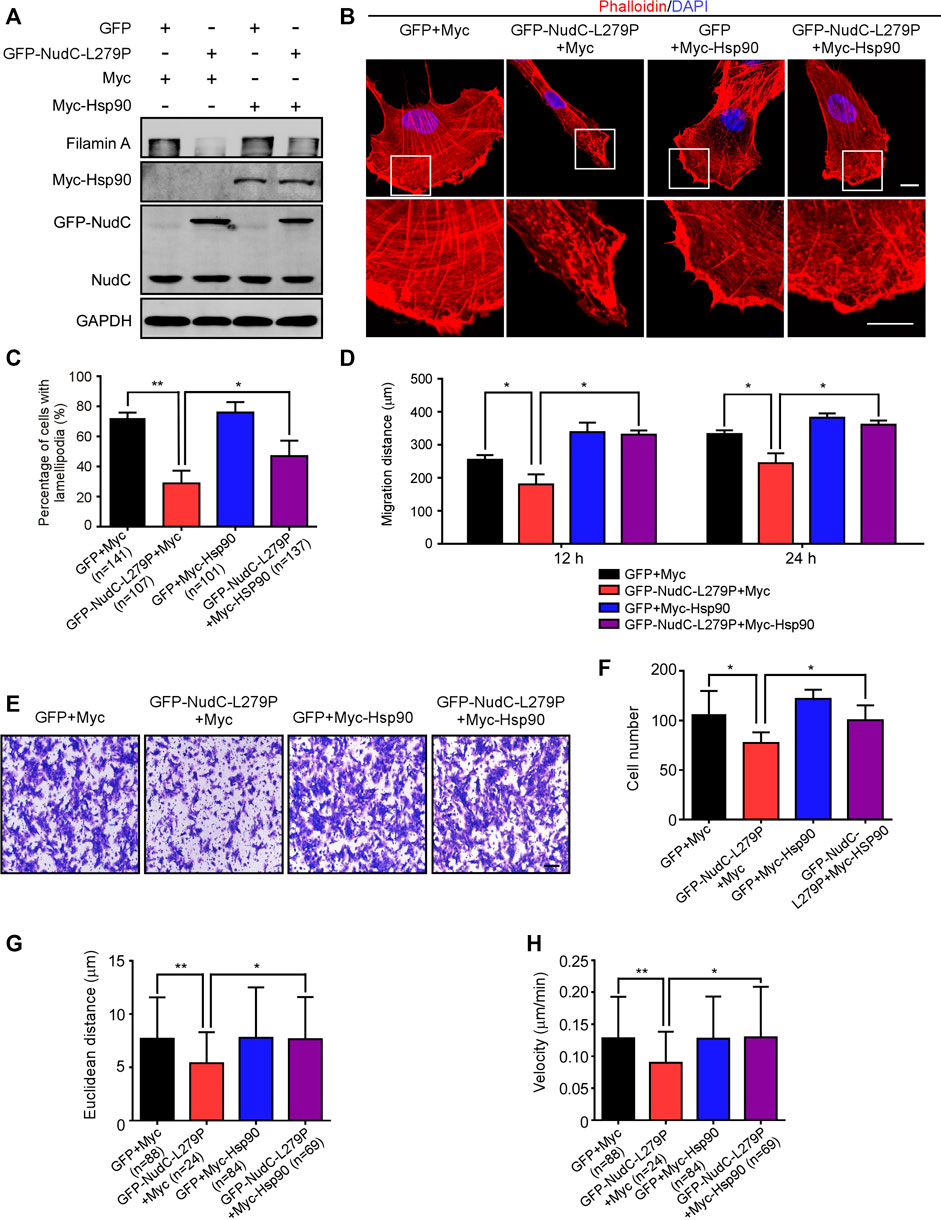
FIGURE 6. Ectopic expression of Hsp90 reverses the defects induced by NudC-L279P overexpression. RPE-1 cells stably overexpressing GFP or GFP-NudC-L279P were transfected with Myc or Myc-Hsp90 and then subjected to the following analyses. (A) Western blotting analysis of the expression of the indicated proteins. GAPDH, a loading control. (B) Cells were fixed and stained with phalloidin. DNA was visualized with DAPI. Images were captured by immunofluorescence microscopy. Scale bar, 10 μm. Higher magnifications of the boxed regions are displayed. (C) Cells were fixed and stained with phalloidin after 3 h of scratching. Cells with lamellipodia were counted. (D) Scratch wound assays detected cell motility. The distance of scratch closure was measured by ImageJ software. (E,F) Transwell migration assays were performed to detect cell motility. Cells that migrated to the undersides of the filters were stained with 0.2% crystal violet and monitored with DIC microscopy. The number of migrated cells per transwell was calculated. Scale bar, 100 μm. (G,H) The migration tracks of individual cells were traced by Imaris 9.1.2 software. Euclidean distance and migration velocity were analyzed with Imaris 9.1.2 software. Quantitative data are presented as the means ± SD (at least three independent experiments). n, the sample size. *p < 0.05; **p < 0.01. Student’s t-test.
The authors apologize for these errors and state that these mistakes do not change the scientific conclusions of the article in any way. The original article has been updated.
Publisher’s note
All claims expressed in this article are solely those of the authors and do not necessarily represent those of their affiliated organizations, or those of the publisher, the editors and the reviewers. Any product that may be evaluated in this article, or claim that may be made by its manufacturer, is not guaranteed or endorsed by the publisher.
Supplementary material
The Supplementary Material for this article can be found online at: https://www.frontiersin.org/articles/10.3389/fcell.2023.1163790/full#supplementary-material
Supplementary Figure S3 | Downregulation of filamin A suppresses cell migration in AGS cells. Cells treated with filamin A RNAi or not were subjected to the following analyses. (A) Western blotting analysis showed the expression of filamin (A). GAPDH, a loading control. (B,C) Scratch wound assays revealed cell migration at the different time points. The scratch closure was recorded with DIC microscopy. Dashed lines indicated the approximate line of wound edges. The distance between the two edge lines was measured by ImageJ software. Scale bar, 100 μm. (D,E) Transwell migration assays were performed to detect cell motility. Cells that migrated to the undersides of the filters were stained with 0.2% crystal violet and monitored with DIC microscopy. The number of migrated cells per transwell was counted. Scale bar, 50 μm. (F–H) The migration tracks of individual cells were traced by Imaris 9.1.2 software. Euclidean distance and migration velocity were analyzed with Imaris 9.1.2 software. Quantitative data are presented as the means ± SD (at least three independent experiments). n, the sample size. *P < 0.05; **P < 0.01. Student’s t-test.
Supplementary Figure S4 | Overexpression of NudC-L279P suppresses cell migration in AGS Cells. AGS cells stably overexpressing GFP, GFP-NudC, or GFP-NudC-L279P were subjected to following analyses. (A) Western blotting analysis of the expression levels of the indicated proteins. GAPDH, a loading control. (B,C) Scratch wound assays revealed cell migration at the different time points. The scratch closure was recorded with fluorescence microscopy. Dashed lines defined the approximate line of wound edges. The distance between the two edge lines was measured by ImageJ software. (D,E) Transwell migration assays were carried out to detect cell motility. Cells that migrated to the undersides of the filters were stained with 0.2% crystal violet and monitored with DIC microscopy. The number of migrated cells per transwell was counted. (F–H) The migration tracks of individual cells were traced by Imaris 9.1.2 software. Euclidean distance and migration velocity were analyzed with Imaris 9.1.2 software. Scale bars, 100 μm. Quantitative data are presented as the means ± SD (at least three independent experiments). n, the sample size. *P < 0.05; **P < 0.01; ***P < 0.001; ns, not significant (P > 0.05). Student’s t-test.
Keywords: cell migration, filamin A, Hsp90, NudC-L279P, protein stability
Citation: Liu M, Xu Z, Zhang C, Yang C, Feng J, Lu Y, Zhang W, Chen W, Xu X, Sun X, Yang M, Liu W, Zhou T and Yang Y (2023) Corrigendum: NudC L279P mutation destabilizes filamin a by inhibiting the Hsp90 chaperoning pathway and suppresses cell migration. Front. Cell Dev. Biol. 11:1163790. doi: 10.3389/fcell.2023.1163790
Received: 11 February 2023; Accepted: 20 March 2023;
Published: 28 March 2023.
Edited and reviewed by:
Ben Goult, University of Kent, United KingdomCopyright © 2023 Liu, Xu, Zhang, Yang, Feng, Lu, Zhang, Chen, Xu, Sun, Yang, Liu, Zhou and Yang. This is an open-access article distributed under the terms of the Creative Commons Attribution License (CC BY). The use, distribution or reproduction in other forums is permitted, provided the original author(s) and the copyright owner(s) are credited and that the original publication in this journal is cited, in accordance with accepted academic practice. No use, distribution or reproduction is permitted which does not comply with these terms.
*Correspondence: Tianhua Zhou, dHpob3VAemp1LmVkdS5jbg==; Yuehong Yang, eWh5YW5nQHpqdS5lZHUuY24=
†These authors have contributed equally to this work